
Body Composition Measurement Improved Performance of GLIM Criteria in Diagnosing Malnutrition Compared to PG-SGA in Ambulatory Cancer Patients: A Prospective Cross-Sectional Study

 , ,
, ,
Abstract
:1. Introduction
2. Materials and Methods
2.1. Study Design
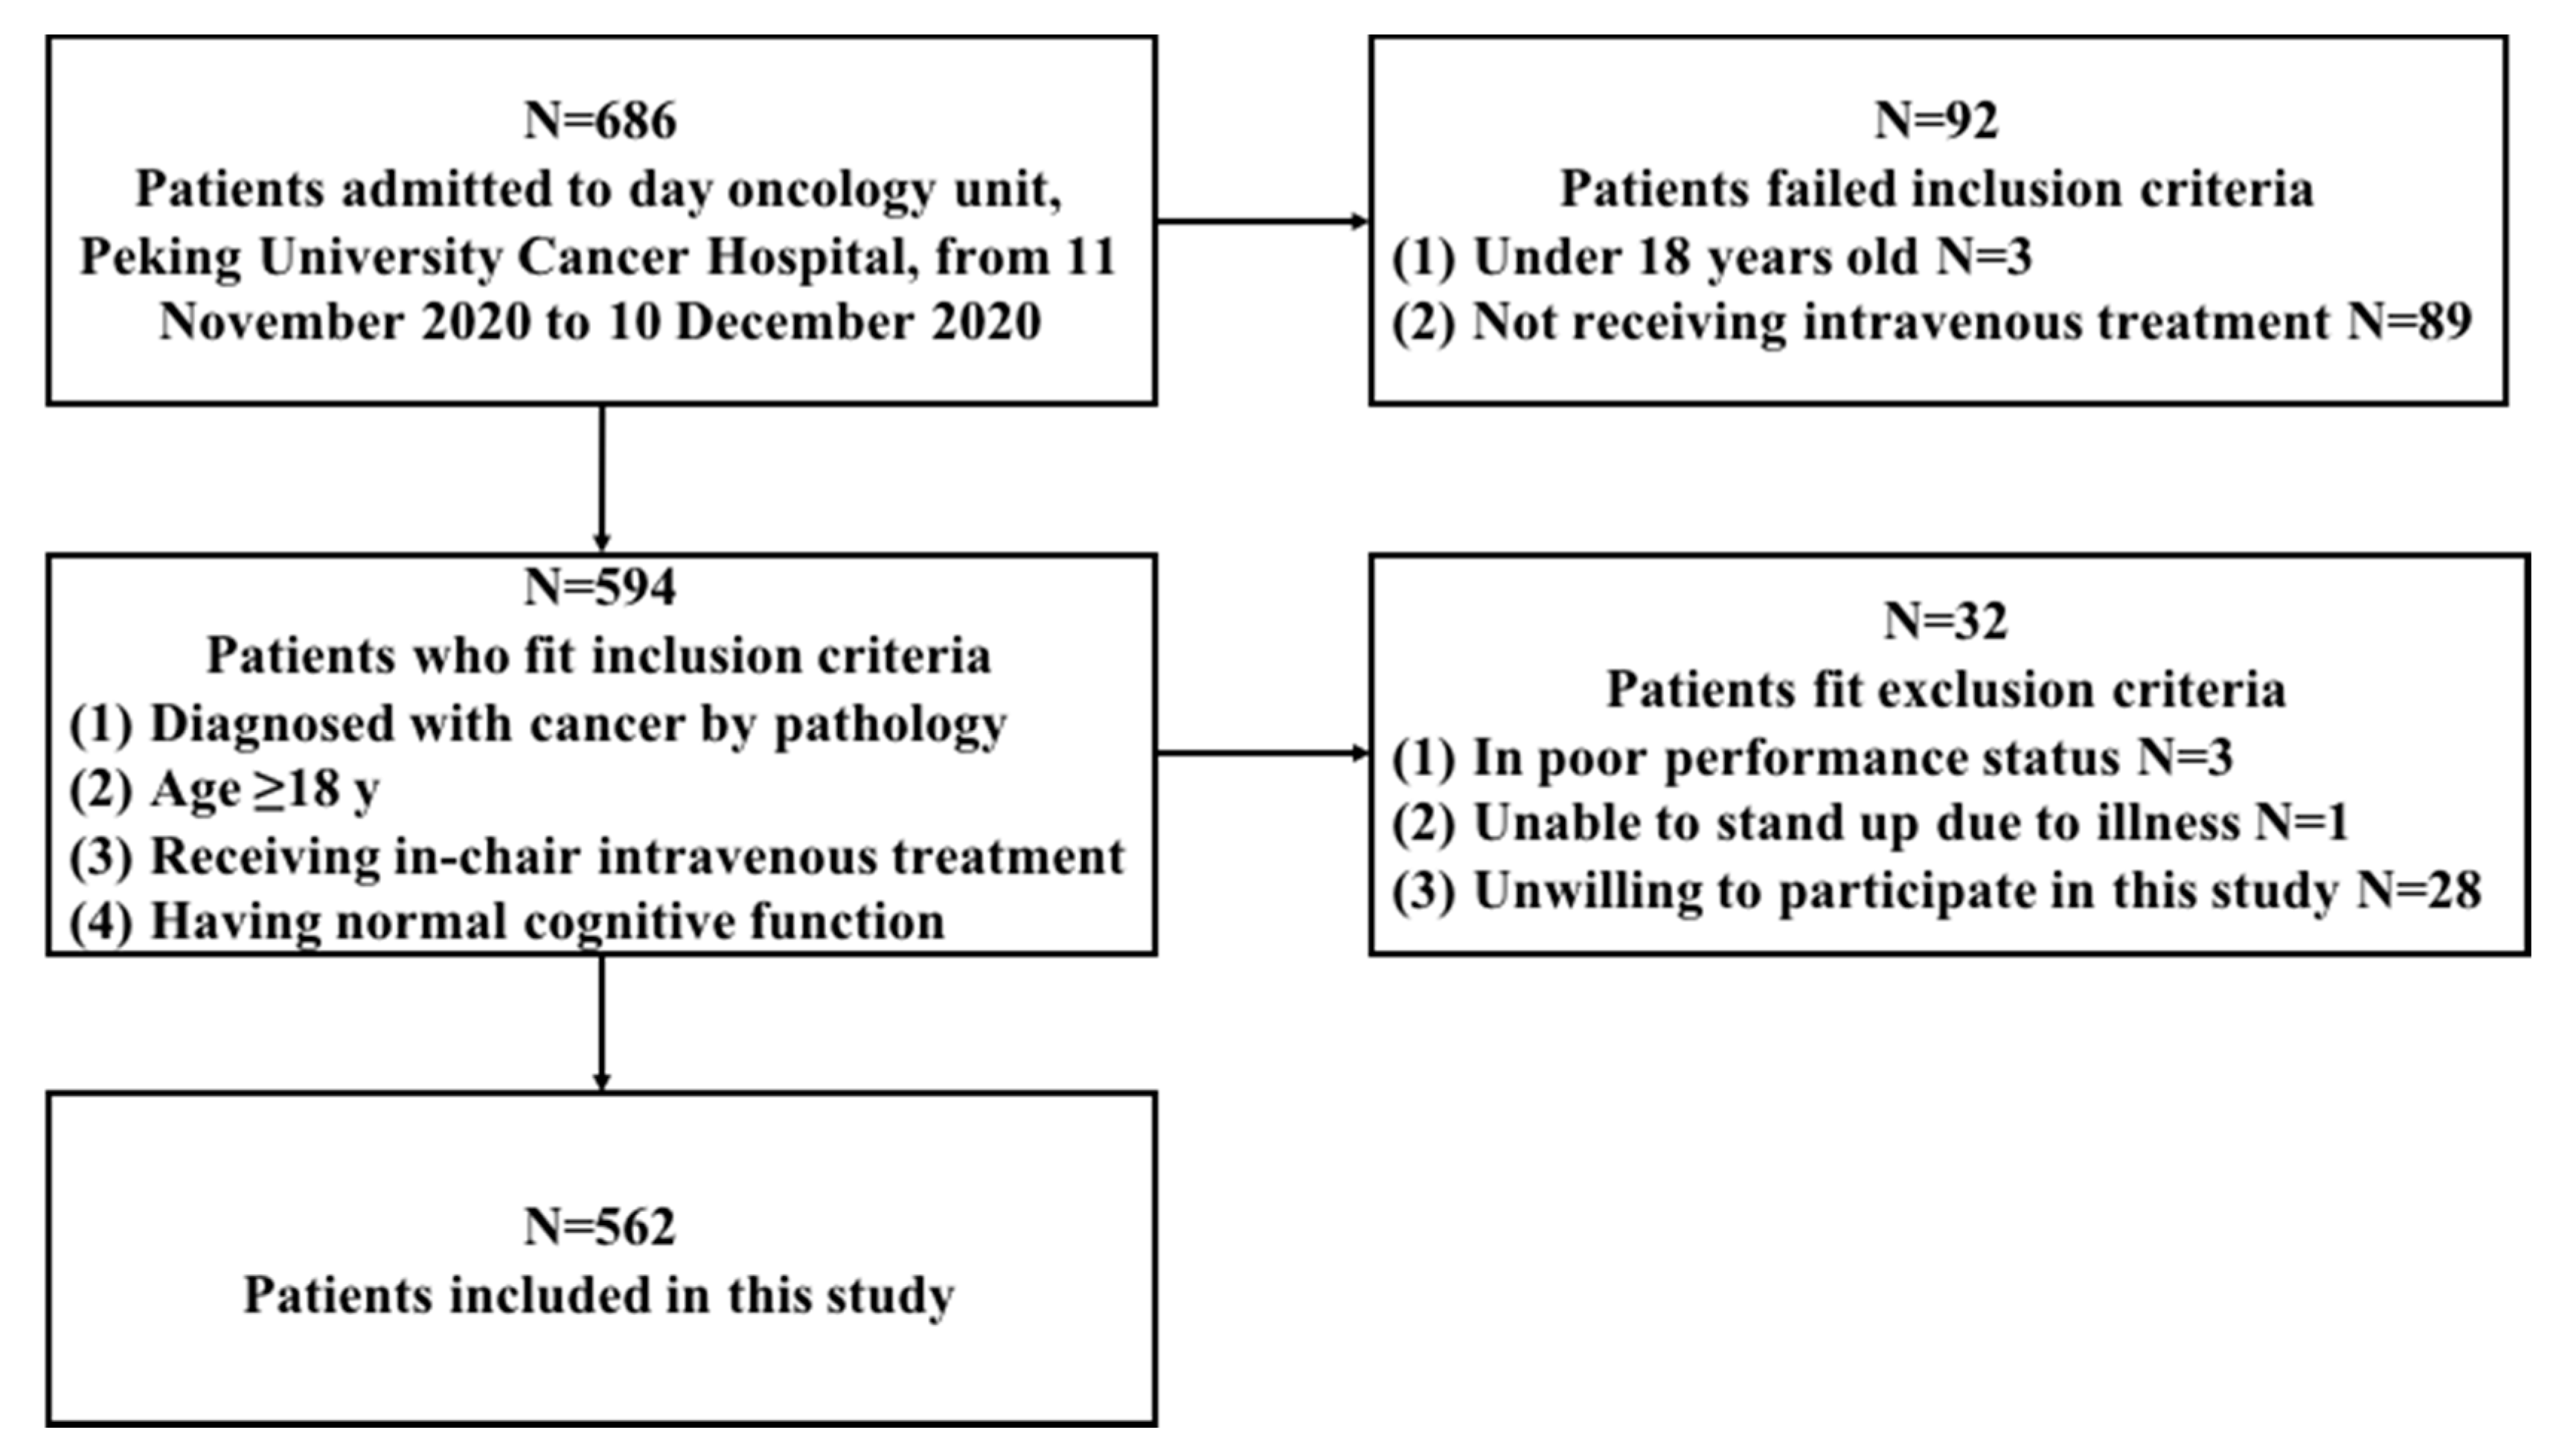
2.2. Participants
2.3. Data Collection
2.4. PG-SGA
2.5. GLIM Criteria
2.5.1. Step 1: Nutrition Screening
2.5.2. Step 2: Assessment for Diagnosis
Phenotypic Criteria
- Weight loss: weight loss is defined as unintentional weight loss of >5% within the past 6 mo or >10% beyond 6 mo.
- Low BMI: a low BMI for Asians is considered when BMI < 18.5 kg/m2 if age < 70 y or BMI < 20 kg/m2 if age > 70 y.
- MMR: In order to evaluate the value of MMR in GLIM criteria and determine the best definition of MMR, the phenotypic criterion MMR was defined using the following eight different definitions, respectively, as follows:
- “excluded MMR”: MMR was not used as a phenotypic criterion.
- “CC”: MMR is defined as CC < 34 cm in men or CC < 33 cm for women [21];
- “FFMI”: MMR is identified as FFMI < 17 kg/m2 in men or <15 kg/m2 in women, as established by the European Society for Clinical Nutrition and Metabolism (ESPEN) [22];
- “ASMI”: the cut-off points for diagnosing MMR were set as ASMI < 7.0 kg/m2 in men or <5.7 kg/m2 in women according to the Asian Working Group for Sarcopenia (AWGS) [21];
- “CC+FFMI”: meeting “CC” or “FFMI”;
- “CC+ASMI”: meeting “CC” or “ASMI”;
- “FFMI+ASMI”: meeting “FFMI” or “ASMI”;
- “CC+FFMI+ASMI”: meeting at least one criterion of “CC”, “FFMI”, and “ASMI”.
Etiologic Criteria
- Reduced intake or assimilation: Reduced intake or assimilation is defined as intake ≤ 50% of energy requirement for >1 week, or reduction for >2 weeks, or the presence of disorders which affect assimilation, or gastrointestinal symptoms which were shown in the PG-SGA questionnaire
- Disease burden or inflammation: Inflammation is identified by plasma C-reactive protein (CRP) > 8 mg/L (if available; 44 patients were tested for CRP) or current diseases/injury with which inflammation is likely to be associated with [11,12] according to medical records. Since all participants of this study were with malignant disease, malignancy was not used as an indicator for inflammation.
Diagnosis of Malnutrition
2.5.3. Step 3: Severity Grading of GLIM Criteria
2.6. Ethics Statement
2.7. Statistical Analysis
3. Results
3.1. Characteristics of Participants
3.2. Nutritional Screening and Evaluation Results of the Participants
3.3. Comparision between the GLIM Criteria using different definitions of MMR and the PG-SGA
4. Discussion
5. Conclusions
Author Contributions
Funding
Institutional Review Board Statement
Informed Consent Statement
Acknowledgments
Conflicts of Interest
Appendix A

| Combination | SE (%,95%CI) | SP (%,95%CI) | PPV (%,95%CI) | NPV (%,95%CI) | κ |
|---|---|---|---|---|---|
| Weight loss Reduced intake or assimilation | 48.5 (42.1–55.0) | 98.2 (95.9–99.2) | 95.1 (89.2–98.0) | 72.1 (67.7–76.2) | 0.488 |
| Low BMI Reduced intake or assimilation | 10.2 (6.8,15.0) | 99.7 (98.0–100.0) | 96.0 (77.7–99.8) | 60.7 (56.4–64.8) | 0.113 |
| MMR * Reduced intake or assimilation | 36.2 (30.1–42.7) | 99.4 (97.6–99.9) | 97.7 (91.2–99.6) | 68.4 (64.0–72.5) | 0.390 |
| Any phenotypic criterion Reduced intake or assimilation | 60.4 (53.8–66.7) | 98.2 (95.8–99.2) | 95.9 (91.0–98.3) | 77.5 (73.1–81.4) | 0.618 |
| Weight loss Disease burden/inflammation | 0 (0–2.0) | 99.7 (98.0–100.0) | 0 (0–94.5) | 58.1 (53.9–62.2) | −0.004 |
| Low BMI Disease burden/inflammation | 0 (0–2.0) | 100.0 (98.6–100.0) | - | - | 0.000 |
| MMR * Disease burden/inflammation | 0 (0–2.0) | 100.0 (98.6–100.0) | - | - | 0.000 |
| Any phenotypic criterion Disease burden/inflammation | 0 (0–2.0) | 99.7 (98.0–100.0) | 0 (0–94.5) | 58.1 (53.9–62.2) | −0.004 |
| Weight loss Any etiologic criterion | 47.2 (40.7–53.8) | 97.9 (95.4–99.1) | 94.1 (87.8–97.4) | 72.1 (67.6–76.1) | 0.485 |
| Low BMI Any etiologic criterion | 10.2 (6.8–15.0) | 99.7 (98.0–100.0) | 96.0 (77.7–99.8) | 60.7 (56.4–64.8) | 0.113 |
| MMR * Any etiologic criterion | 36.2 (30.1–42.7) | 99.4 (97.6–99.9) | 97.7 (91.2–99.6) | 68.4 (64.0–72.5) | 0.39 |
| Any phenotypic criterion Any etiologic criterion | 60.4 (53.8–66.7) | 97.9 (95.4–99.1) | 95.3 (90.2–97.9) | 77.5 (73.1–81.4) | 0.614 |
References
- Hebuterne, X.; Lemarie, E.; Michallet, M.; de Montreuil, C.B.; Schneider, S.M.; Goldwasser, F. Prevalence of malnutrition and current use of nutrition support in patients with cancer. JPEN J. Parenter Enter. Nutr. 2014, 38, 196–204. [Google Scholar] [CrossRef]
- Arends, J.; Baracos, V.; Bertz, H.; Bozzetti, F.; Calder, P.C.; Deutz, N.E.P.; Erickson, N.; Laviano, A.; Lisanti, M.P.; Lobo, D.N.; et al. ESPEN expert group recommendations for action against cancer-related malnutrition. Clin. Nutr. 2017, 36, 1187–1196. [Google Scholar] [CrossRef] [Green Version]
- Salas, S.; Deville, J.L.; Giorgi, R.; Pignon, T.; Bagarry, D.; Barrau, K.; Zanaret, M.; Giovanni, A.; Bourgeois, A.; Favre, R.; et al. Nutritional factors as predictors of response to radio-chemotherapy and survival in unresectable squamous head and neck carcinoma. Radiother. Oncol. 2008, 87, 195–200. [Google Scholar] [CrossRef] [PubMed]
- Arends, J.; Bachmann, P.; Baracos, V.; Barthelemy, N.; Bertz, H.; Bozzetti, F.; Fearon, K.; Hutterer, E.; Isenring, E.; Kaasa, S.; et al. ESPEN guidelines on nutrition in cancer patients. Clin. Nutr. 2017, 36, 11–48. [Google Scholar] [CrossRef] [PubMed] [Green Version]
- Hill, A.; Kiss, N.; Hodgson, B.; Crowe, T.C.; Walsh, A.D. Associations between nutritional status, weight loss, radiotherapy treatment toxicity and treatment outcomes in gastrointestinal cancer patients. Clin. Nutr. 2011, 30, 92–98. [Google Scholar] [CrossRef] [PubMed]
- Tian, J.; Chen, J.S. Nutritional status and quality of life of the gastric cancer patients in Changle County of China. World J. Gastroenterol. 2005, 11, 1582–1586. [Google Scholar] [CrossRef]
- Planas, M.; Alvarez-Hernandez, J.; Leon-Sanz, M.; Celaya-Perez, S.; Araujo, K.; Garcia de Lorenzo, A.; Researchers, P.R. Prevalence of hospital malnutrition in cancer patients: A sub-analysis of the PREDyCES(R) study. Support. Care Cancer 2016, 24, 429–435. [Google Scholar] [CrossRef] [Green Version]
- Rondel, A.; Langius, J.A.E.; de van der Schueren, M.A.E.; Kruizenga, H.M. The new ESPEN diagnostic criteria for malnutrition predict overall survival in hospitalised patients. Clin. Nutr. 2018, 37, 163–168. [Google Scholar] [CrossRef] [PubMed]
- Contreras-Bolivar, V.; Sanchez-Torralvo, F.J.; Ruiz-Vico, M.; Gonzalez-Almendros, I.; Barrios, M.; Padin, S.; Alba, E.; Olveira, G. GLIM Criteria Using Hand Grip Strength Adequately Predict Six-Month Mortality in Cancer Inpatients. Nutrients 2019, 11, 2043. [Google Scholar] [CrossRef] [Green Version]
- Lin, J.; Peng, J.; Qdaisat, A.; Li, L.; Chen, G.; Lu, Z.; Wu, X.; Gao, Y.; Zeng, Z.; Ding, P.; et al. Severe weight loss during preoperative chemoradiotherapy compromises survival outcome for patients with locally advanced rectal cancer. J. Cancer Res. Clin. Oncol. 2016, 142, 2551–2560. [Google Scholar] [CrossRef] [Green Version]
- Jensen, G.L.; Cederholm, T.; Correia, M.; Gonzalez, M.C.; Fukushima, R.; Higashiguchi, T.; de Baptista, G.A.; Barazzoni, R.; Blaauw, R.; Coats, A.J.S.; et al. GLIM Criteria for the Diagnosis of Malnutrition: A Consensus Report From the Global Clinical Nutrition Community. JPEN J. Parenter Enter. Nutr. 2019, 43, 32–40. [Google Scholar] [CrossRef] [PubMed] [Green Version]
- Cederholm, T.; Jensen, G.L.; Correia, M.; Gonzalez, M.C.; Fukushima, R.; Higashiguchi, T.; Baptista, G.; Barazzoni, R.; Blaauw, R.; Coats, A.; et al. GLIM criteria for the diagnosis of malnutrition—A consensus report from the global clinical nutrition community. Clin. Nutr. 2019, 38, 1–9. [Google Scholar] [CrossRef] [PubMed] [Green Version]
- de van der Schueren, M.A.E.; Keller, H.; Consortium, G.; Cederholm, T.; Barazzoni, R.; Compher, C.; Correia, M.; Gonzalez, M.C.; Jager-Wittenaar, H.; Pirlich, M.; et al. Global Leadership Initiative on Malnutrition (GLIM): Guidance on validation of the operational criteria for the diagnosis of protein-energy malnutrition in adults. Clin. Nutr. 2020, 39, 2872–2880. [Google Scholar] [CrossRef] [PubMed]
- Keller, H.; de van der Schueren, M.A.E.; Consortium, G.; Jensen, G.L.; Barazzoni, R.; Compher, C.; Correia, M.; Gonzalez, M.C.; Jager-Wittenaar, H.; Pirlich, M.; et al. Global Leadership Initiative on Malnutrition (GLIM): Guidance on Validation of the Operational Criteria for the Diagnosis of Protein-Energy Malnutrition in Adults. JPEN J. Parenter Enter. Nutr. 2020, 44, 992–1003. [Google Scholar] [CrossRef] [PubMed]
- Ottery, F.D. Definition of standardized nutritional assessment and interventional pathways in oncology. Nutrition 1996, 12, S15–S19. [Google Scholar] [CrossRef]
- Thompson, K.L.; Elliott, L.; Fuchs-Tarlovsky, V.; Levin, R.M.; Voss, A.C.; Piemonte, T. Oncology Evidence-Based Nutrition Practice Guideline for Adults. J. Acad. Nutr. Diet. 2017, 117, 297–310.e247. [Google Scholar] [CrossRef] [PubMed]
- Allard, J.P.; Keller, H.; Gramlich, L.; Jeejeebhoy, K.N.; Laporte, M.; Duerksen, D.R. GLIM criteria has fair sensitivity and specificity for diagnosing malnutrition when using SGA as comparator. Clin. Nutr. 2020, 39, 2771–2777. [Google Scholar] [CrossRef]
- De Groot, L.M.; Lee, G.; Ackerie, A.; van der Meij, B.S. Malnutrition Screening and Assessment in the Cancer Care Ambulatory Setting: Mortality Predictability and Validity of the Patient-Generated Subjective Global Assessment Short form (PG-SGA SF) and the GLIM Criteria. Nutrients 2020, 12, 2287. [Google Scholar] [CrossRef] [PubMed]
- Shi, H.; Li, W.; Qi, Y. Nutrition Screening and Evaluation; People’s Medical Publishing House: Beijing, China, 2014. [Google Scholar]
- Stratton, R.J.; Hackston, A.; Longmore, D.; Dixon, R.; Price, S.; Stroud, M.; King, C.; Elia, M. Malnutrition in hospital outpatients and inpatients: Prevalence, concurrent validity and ease of use of the ’malnutrition universal screening tool’ (’MUST’) for adults. Br. J. Nutr. 2004, 92, 799–808. [Google Scholar] [CrossRef]
- Chen, L.K.; Woo, J.; Assantachai, P.; Auyeung, T.W.; Chou, M.Y.; Iijima, K.; Jang, H.C.; Kang, L.; Kim, M.; Kim, S.; et al. Asian Working Group for Sarcopenia: 2019 Consensus Update on Sarcopenia Diagnosis and Treatment. J. Am. Med. Dir. Assoc. 2020, 21, 300–307.e302. [Google Scholar] [CrossRef] [PubMed]
- Cederholm, T.; Barazzoni, R.; Austin, P.; Ballmer, P.; Biolo, G.; Bischoff, S.C.; Compher, C.; Correia, I.; Higashiguchi, T.; Holst, M.; et al. ESPEN guidelines on definitions and terminology of clinical nutrition. Clin. Nutr. 2017, 36, 49–64. [Google Scholar] [CrossRef]
- Maeda, K.; Ishida, Y.; Nonogaki, T.; Mori, N. Reference body mass index values and the prevalence of malnutrition according to the Global Leadership Initiative on Malnutrition criteria. Clin. Nutr. 2020, 39, 180–184. [Google Scholar] [CrossRef] [PubMed]
- Shrout, P.E. Measurement reliability and agreement in psychiatry. Stat. Methods Med. Res. 1998, 7, 301–317. [Google Scholar] [CrossRef] [PubMed]
- Power, L.; Mullally, D.; Gibney, E.R.; Clarke, M.; Visser, M.; Volkert, D.; Bardon, L.; de van der Schueren, M.A.E.; Corish, C.A.; MaNu, E.L.C. A review of the validity of malnutrition screening tools used in older adults in community and healthcare settings—A MaNuEL study. Clin. Nutr. ESPEN 2018, 24, 1–13. [Google Scholar] [CrossRef] [PubMed] [Green Version]
- Yin, L.; Lin, X.; Zhao, Z.; Li, N.; He, X.; Zhang, M.; Yang, J.; Guo, Z.; Li, Z.; Wang, K.; et al. Is hand grip strength a necessary supportive index in the phenotypic criteria of the GLIM-based diagnosis of malnutrition in patients with cancer? Support. Care Cancer 2021, 29, 4001–4013. [Google Scholar] [CrossRef] [PubMed]
- Zhang, Z.; Wan, Z.; Zhu, Y.; Zhang, L.; Zhang, L.; Wan, H. Prevalence of malnutrition comparing NRS2002, MUST, and PG-SGA with the GLIM criteria in adults with cancer: A multi-center study. Nutrition 2021, 83, 111072. [Google Scholar] [CrossRef] [PubMed]
- Cereda, E.; Pedrazzoli, P.; Lobascio, F.; Masi, S.; Crotti, S.; Klersy, C.; Turri, A.; Stobaus, N.; Tank, M.; Franz, K.; et al. The prognostic impact of BIA-derived fat-free mass index in patients with cancer. Clin. Nutr. 2021, 40, 3901–3907. [Google Scholar] [CrossRef]
| Parameter | Total n = 562 |
|---|---|
| Age, y (median, interquartile range) | 59 (52–65) |
| Sex, n (%) | |
| Male | 354 (70.3) |
| Female | 208 (37.0) |
| Tumor site, n (%) | |
| Upper Gastrointestinal tract | 134 (23.8) |
| Colorectal | 291 (51.8) |
| Head and neck | 1 (0.2) |
| Lung and mediastinum | 43 (7.7) |
| Breast | 21 (3.7) |
| Urogenital | 11 (2.0) |
| Gynecology | 1 (0.2) |
| Liver, pancreas | 40 (7.1) |
| Lymphoma | 4 (0.7) |
| Other | 16 (2.8) |
| Tumor stage, n (%) | |
| I | 10 (1.8) |
| II | 45 (8.0) |
| III | 176 (31.3) |
| IV | 331 (58.9) |
| Criteria | n (%) | |
|---|---|---|
| Phenotypic Criteria | Total n = 562 | |
| Weight loss | 227 (40.4) | |
| Low BMI | 60 (10.7) | |
| MMR | CC | 129 (23.0) |
| FFMI | 158 (28.1) | |
| ASMI | 119 (21.2) | |
| CC+FFMI | 194 (34.5) | |
| CC+ASMI | 162 (28.8) | |
| FFMI+ASMI | 168 (29.9) | |
| CC+FFMI+ASMI | 197 (35.1) | |
| Etiologic criteria | Total n = 562 | |
| Reduced intake or assimilation | 186 (33.1) | |
| Disease burden or inflammation | Inflammation-associated disease or injury | 0 (0) |
| Total n = 44 | ||
| Elevated plasm CRP | 7 (1.2) | |
| Combination | Prevalence n (%) |
|---|---|
| Weight loss Reduced intake or assimilation | 117 (20.8) |
| Low BMI Reduced intake or assimilation | 25 (4.4) |
| MMR * Reduced intake or assimilation | 87 (15.5) |
| Any phenotypic criterion Reduced intake or assimilation | 148 (26.3) |
| Weight loss Disease burden/inflammation | 1 (2.3) |
| Low BMI Disease burden/inflammation | 0 (0) |
| MMR * Disease burden/inflammation | 0 (0) |
| Any phenotypic criterion Disease burden/inflammation | 44 (2.3) |
| Weight loss Any etiologic criterion | 118 (21.0) |
| Low BMI Any etiologic criterion | 25 (4.4) |
| MMR * Any etiologic criterion | 87 (15.5) |
| Any phenotypic criterion Any etiologic criterion | 149 (26.5) |
| Definition of MMR | SE (%,95%CI) | SP (%,95%CI) | PPV (%,95%CI) | NPV (%,95%CI) | κ |
|---|---|---|---|---|---|
| Excluded MMR | 50.2 (43.7–56.8) | 97.9 (95.4–99.1) | 94.4 (88.4–97.5) | 73.2 (68.8–77.3) | 0.515 |
| CC | 55.3 (48.7–61.7) | 97.9 (95.4–99.1) | 94.9 (89.4–97.8) | 75.3 (70.9–79.3) | 0.565 |
| FFMI | 58.7 (52.1–65.0) | 97.9 (95.4–99.1) | 95.2 (90.0–97.9) | 76.7 (72.3–80.7) | 0.598 |
| ASMI | 57.4 (50.8–63.8) | 97.9 (95.4–99.1) | 95.1 (89.7–97.8) | 76.2 (71.8–80.1) | 0.586 |
| CC+FFMI | 60.0 (53.4–66.3) | 97.9 (95.4–99.1) | 95. 3 (90.1–97.9) | 77.3 (72.9–81.2) | 0.610 |
| CC+ASMI | 59.1 (52.6–65.4) | 97.9 (95.4–99.1) | 95.2 (90.0–97.9) | 76.9 (72.5–80.8) | 0.602 |
| FFMI+ASMI | 59.1 (52.6–65.4) | 97.9 (95.4–99.1) | 95.2 (90.0–97.9) | 76.9 (72.5–80.8) | 0.602 |
| CC+FFMI+ASMI | 60.4 (53.8–66.7) | 97.9 (95.4–99.1) | 95.3 (90.2–98.0) | 77.5 (73.1–81.4) | 0.614 |
| Definition of MMR | SE (%,95%CI) | SP (%,95%CI) | PPV (%,95%CI) | NPV (%,95%CI) | κ |
|---|---|---|---|---|---|
| Excluded MMR | 58.2 (45.5–69.9) | 93.9 (91.4–95.8) | 56.5 (44.1–68.2) | 94.3 (91.8–96.1) | 0.515 |
| CC | 58.2 (45.5–69.9) | 93.9 (91.4–95.8) | 56.5 (44.1–68.2) | 94.3 (91.8–96.1) | 0.515 |
| FFMI | 58.2 (45.5–69.9) | 93.9 (91.4–95.8) | 56.5 (44.1–68.2) | 94.3 (91.8–96.1) | 0.515 |
| ASMI | 58.2 (45.5–69.9) | 93.9 (91.4–95.8) | 56.5 (44.1–68.2) | 94.3 (91.8–96.1) | 0.515 |
| CC+FFMI | 58.2 (45.5–69.9) | 93.9 (91.4–95.8) | 56.5 (44.1–68.2) | 94.3 (91.8–96.1) | 0.515 |
| CC+ASMI | 58.2 (45.5–69.9) | 93.9 (91.4–95.8) | 56.5 (44.1–68.2) | 94.3 (91.8–96.1) | 0.515 |
| FFMI+ASMI | 58.2 (45.5–69.9) | 93.9 (91.4–95.8) | 56.5 (44.1–68.2) | 94.3 (91.8–96.1) | 0.515 |
| CC+FFMI+ASMI | 58.2 (45.5–69.9) | 93.9 (91.4–95.8) | 56.5 (44.1–68.2) | 94.3 (91.8–96.1) | 0.515 |
Publisher’s Note: MDPI stays neutral with regard to jurisdictional claims in published maps and institutional affiliations. |
© 2021 by the authors. Licensee MDPI, Basel, Switzerland. This article is an open access article distributed under the terms and conditions of the Creative Commons Attribution (CC BY) license (https://creativecommons.org/licenses/by/4.0/).
Share and Cite
Wang, Y.; Chen, X.; Wang, Y.; Liu, Z.; Fang, Y.; Peng, Z.; Liu, W. Body Composition Measurement Improved Performance of GLIM Criteria in Diagnosing Malnutrition Compared to PG-SGA in Ambulatory Cancer Patients: A Prospective Cross-Sectional Study. Nutrients 2021, 13, 2744. https://doi.org/10.3390/nu13082744
Wang Y, Chen X, Wang Y, Liu Z, Fang Y, Peng Z, Liu W. Body Composition Measurement Improved Performance of GLIM Criteria in Diagnosing Malnutrition Compared to PG-SGA in Ambulatory Cancer Patients: A Prospective Cross-Sectional Study. Nutrients. 2021; 13(8):2744. https://doi.org/10.3390/nu13082744
Chicago/Turabian StyleWang, Yanfei, Xiaoyan Chen, Yunyi Wang, Ziqi Liu, Yu Fang, Zhi Peng, and Wei Liu. 2021. "Body Composition Measurement Improved Performance of GLIM Criteria in Diagnosing Malnutrition Compared to PG-SGA in Ambulatory Cancer Patients: A Prospective Cross-Sectional Study" Nutrients 13, no. 8: 2744. https://doi.org/10.3390/nu13082744
APA StyleWang, Y., Chen, X., Wang, Y., Liu, Z., Fang, Y., Peng, Z., & Liu, W. (2021). Body Composition Measurement Improved Performance of GLIM Criteria in Diagnosing Malnutrition Compared to PG-SGA in Ambulatory Cancer Patients: A Prospective Cross-Sectional Study. Nutrients, 13(8), 2744. https://doi.org/10.3390/nu13082744