
Assessment of Plant Sterols in the Diet of Adult Polish Population with the Use of a Newly Developed Database

 ,
,  ,
,  ,
,  , and
, and
Abstract
:1. Introduction
2. Materials and Methods
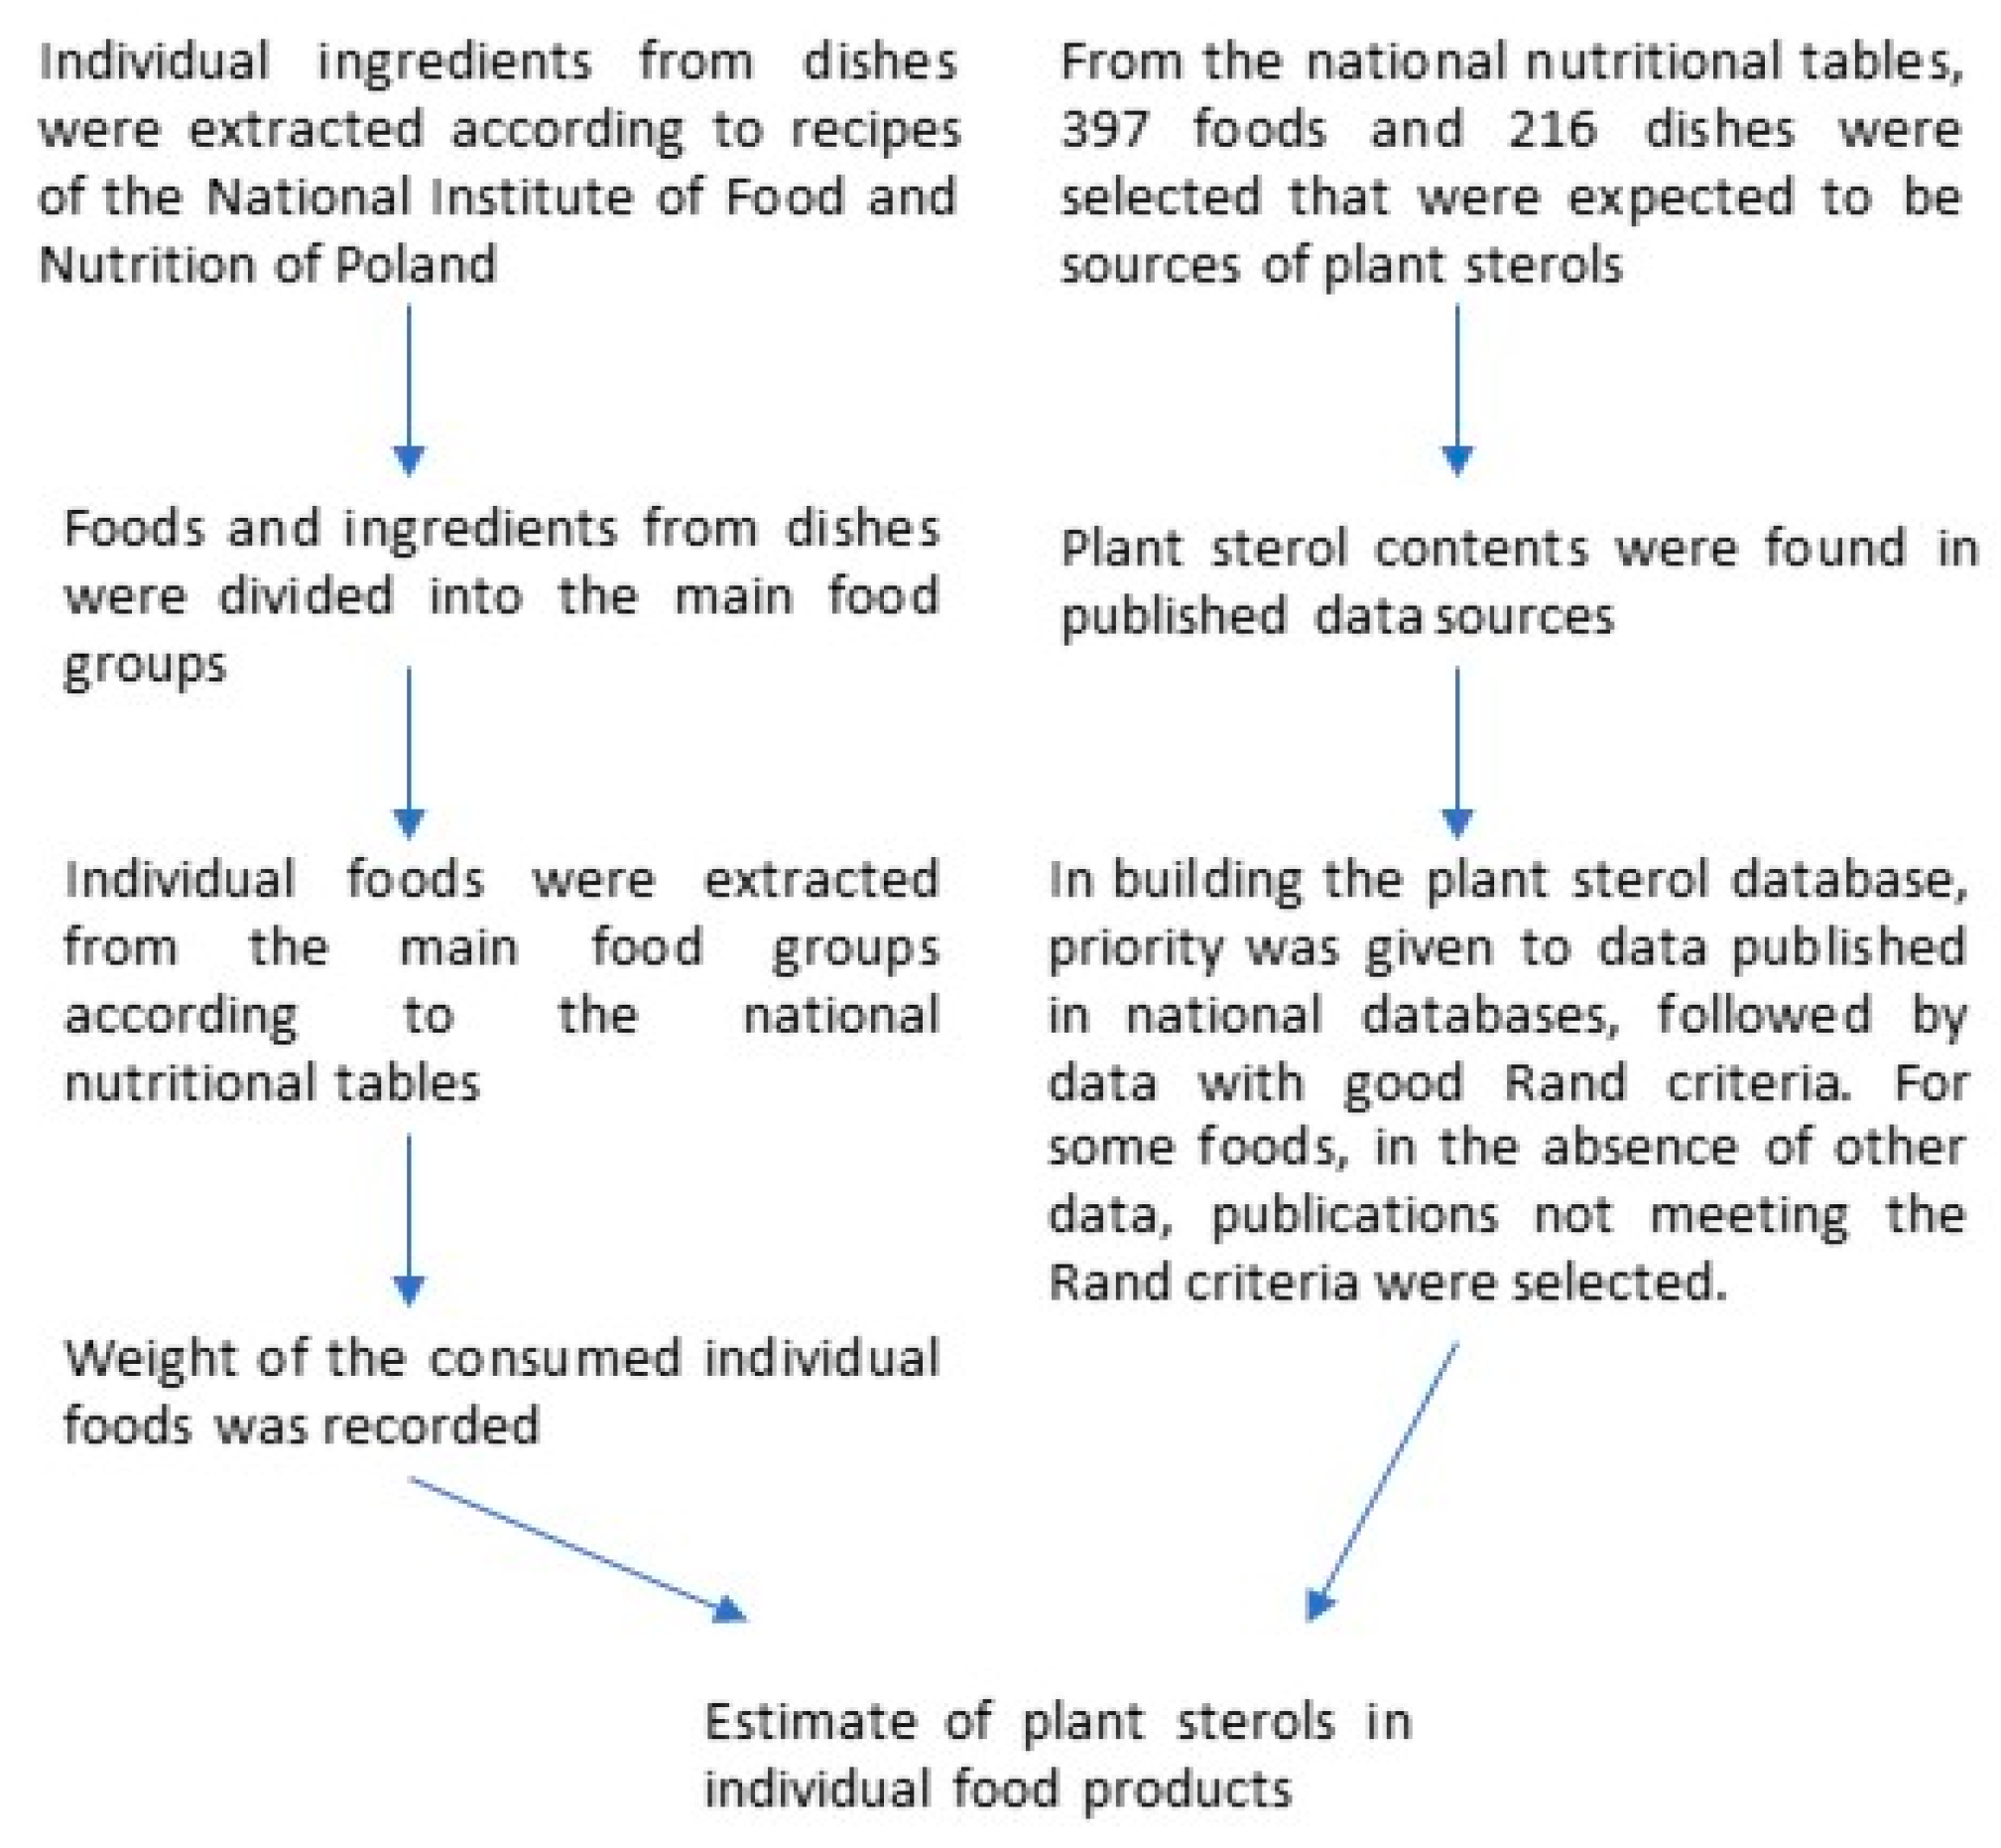
2.1. Plant Sterol Database and Calculation of Dietary Intake
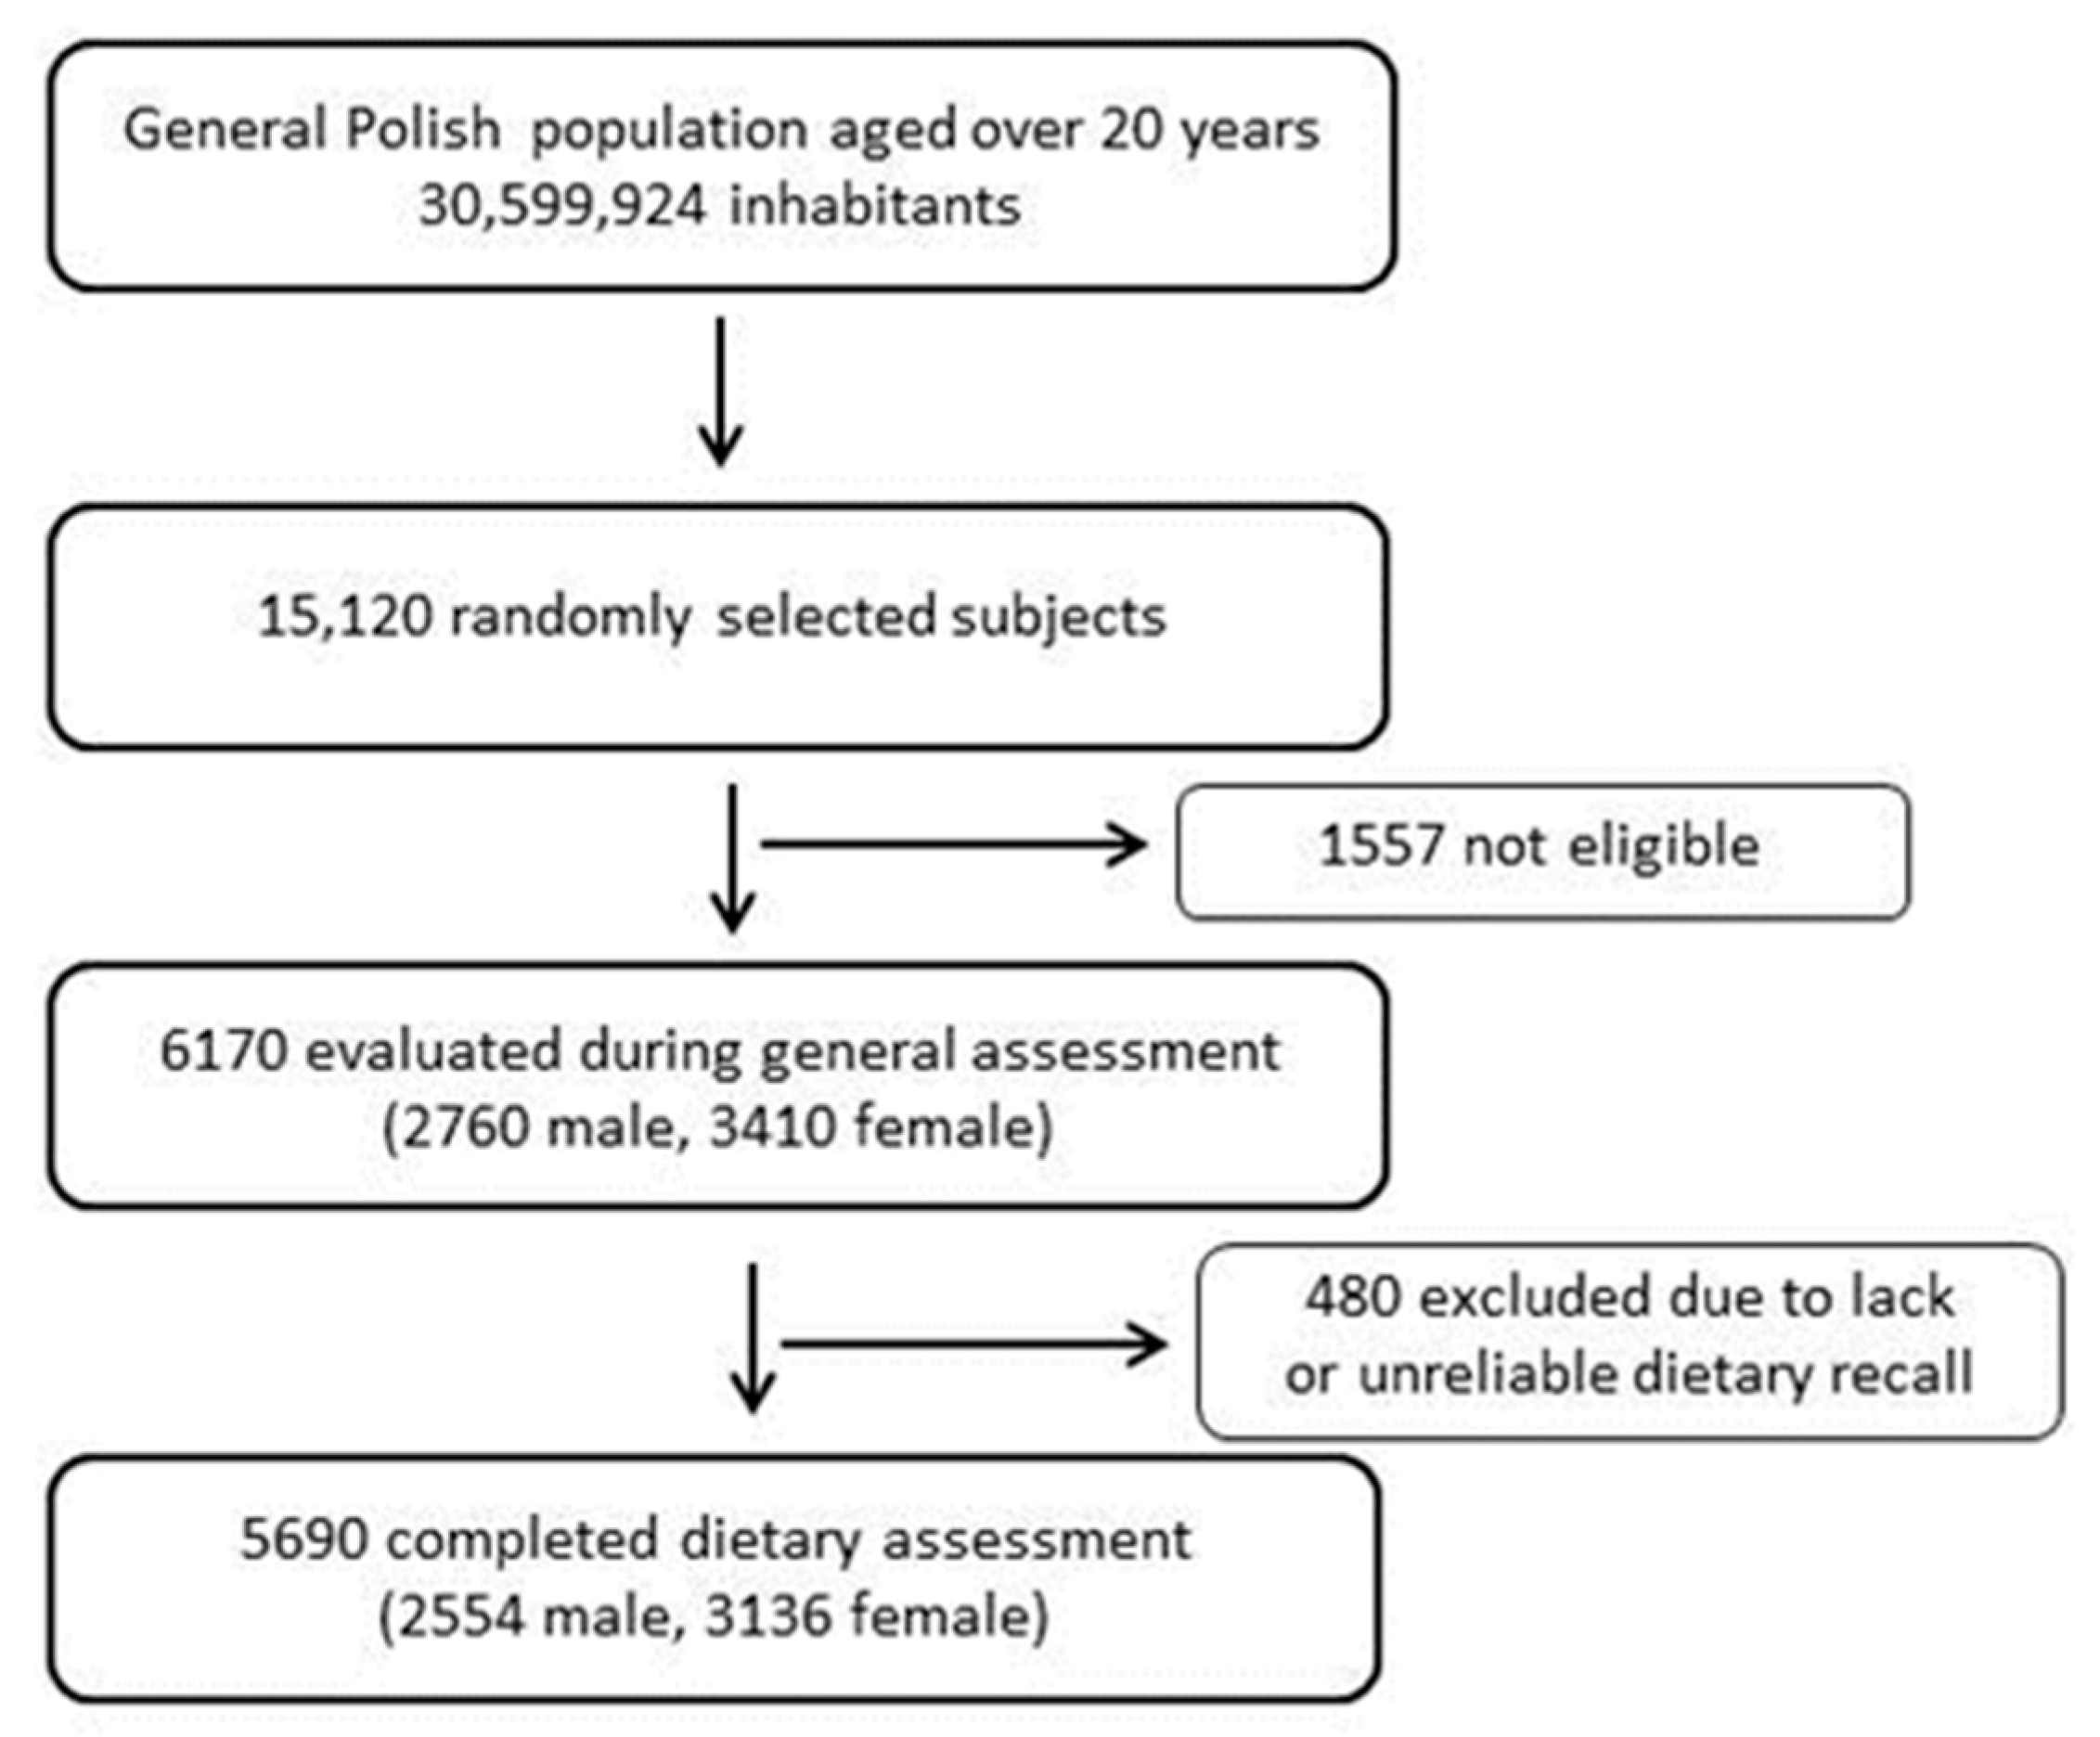
2.2. Study Group and Data Collection
2.3. Data Analysis
3. Results
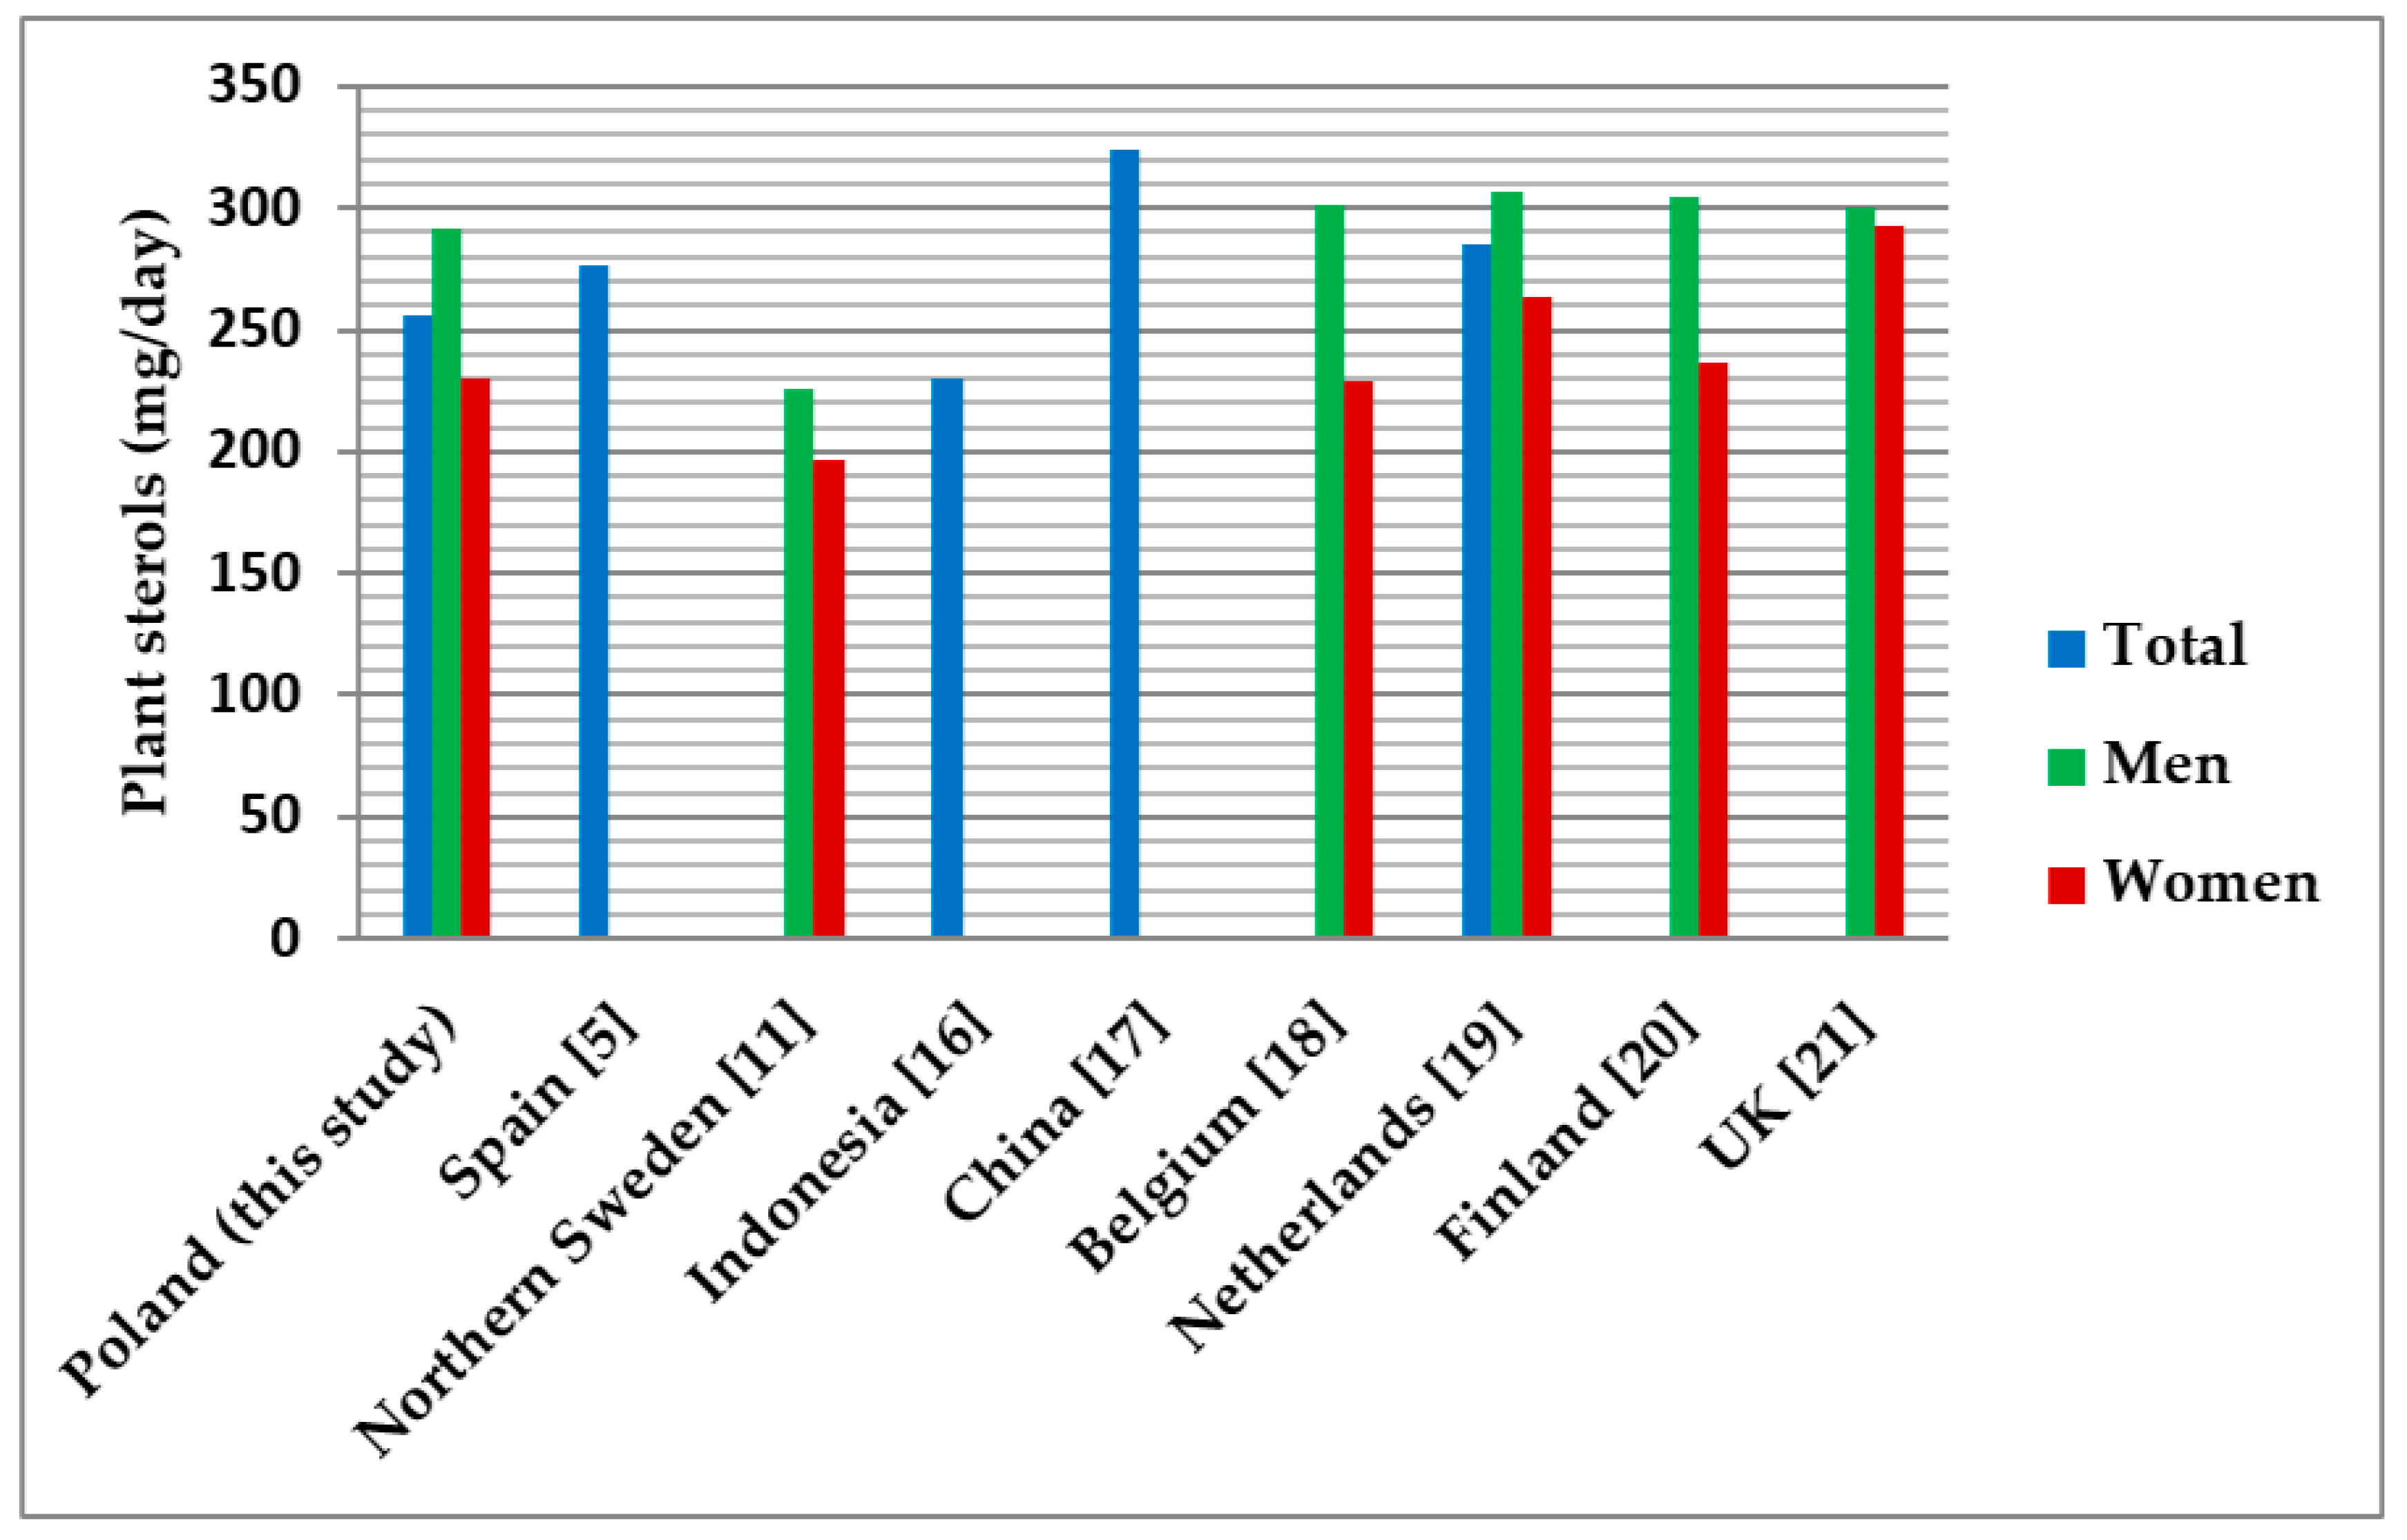
4. Discussion
Limitations
5. Conclusions
Supplementary Materials
Author Contributions
Funding
Institutional Review Board Statement
Informed Consent Statement
Data Availability Statement
Conflicts of Interest
References
- Dufourc, E.J. Sterols and membrane dynamics. J. Chem. Biol. 2008, 1, 63–77. [Google Scholar] [CrossRef] [PubMed] [Green Version]
- De Smet, E.; Mensink, R.P.; Plat, J. Effects of plant sterols and stanols on intestinal cholesterol metabolism: Suggested mechanisms from past to present. Mol. Nutr. Food Res. 2012, 56, 1058–1072. [Google Scholar] [CrossRef]
- Vezza, T.; Canet, F.; de Marañón, A.M.; Bañuls, C.; Rocha, M.; Víctor, V.M. Phytosterols: Nutritional Health Players in the Management of Obesity and Its Related Disorders. Antioxidants 2020, 9, 1266. [Google Scholar] [CrossRef] [PubMed]
- Feng, S.; Belwal, T.; Li, L.; Limwachiranon, J.; Liu, X.; Luo, Z. Phytosterols and their derivatives: Potential health-promoting uses against lipid metabolism and associated diseases, mechanism, and safety issues. Compr. Rev. Food Sci. Food Saf. 2020, 19, 1243–1267. [Google Scholar] [CrossRef]
- Jiménez-Escrig, A.; Santos-Hidalgo, A.B.; Saura-Calixto, F. Common sources and estimated intake of plant sterols in the Spanish diet. J. Agric. Food Chem. 2006, 54, 3462–3471. [Google Scholar] [CrossRef] [PubMed] [Green Version]
- Shaghaghi, M.A.; Harding, S.V.; Jones, P.J.H. Water dispersible plant sterol formulation shows improved effect on lipid profile compared to plant sterol esters. J. Funct. Foods 2014, 6, 280–289. [Google Scholar] [CrossRef]
- Plat, J.; Brufau, G.; Dallinga-Thie, G.M.; Dasselaar, M.; Mensink, R.P. A plant stanol yogurt drink alone or combined with a low-dose statin lowers serum triacylglycerol and non-HDL cholesterol in metabolic syndrome patients. J. Nutr. 2009, 139, 1143–1149. [Google Scholar] [CrossRef] [Green Version]
- Yoshida, Y.; Niki, E. Antioxidant effects of phytosterol and its components. J. Nutr. Sci. Vitaminol. 2003, 49, 277–280. [Google Scholar] [CrossRef]
- Brüll, F.; De Smet, E.; Mensink, R.P.; Vreugdenhil, A.; Kerksiek, A.; Lütjohann, D.; Wesseling, G.; Plat, J. Dietary plant stanol ester consumption improves immune function in asthma patients: Results of a randomized, double-blind clinical trial. Am. J. Clin. Nutr. 2016, 103, 444–453. [Google Scholar] [CrossRef] [PubMed] [Green Version]
- Kurano, M.; Hasegawa, K.; Kunimi, M.; Hara, M.; Yatomi, Y.; Teramoto, T.; Tsukamoto, K. Sitosterol prevents obesity-related chronic inflammation. Biochim. Biophys. Acta Mol. Cell Biol. Lipids 2018, 1863, 191–198. [Google Scholar] [CrossRef]
- Klingberg, S.; Ellegård, L.; Johansson, I.; Jansson, J.H.; Hallmans, G.; Winkvist, A. Dietary intake of naturally occurring plant sterols is related to a lower risk of a first myocardial infarction in men but not in women in northern Sweden. J. Nutr. 2013, 143, 1630–1635. [Google Scholar] [CrossRef] [Green Version]
- Ramprasath, V.R.; Awad, A.B. Role of phytosterols in cancer prevention and treatment. J. AOAC Int. 2015, 98, 735–738. [Google Scholar] [CrossRef]
- Jiang, L.; Zhao, X.; Xu, J.; Li, C.; Yu, Y.; Wang, W.; Zhu, L. The Protective Effect of Dietary Phytosterols on Cancer Risk: A Systematic Meta-Analysis. J. Oncol. 2019, 2019, 7479518. [Google Scholar] [CrossRef] [Green Version]
- Composition of Foods, Raw, Processed, Prepared. National Nutrient Database for Standard Reference Release 27. USDA, 2015. Modified in 2019. Available online: https://data.nal.usda.gov/dataset/composition-foods-raw-processed-prepared-usda-national-nutrient-database-standard-reference-release-27 (accessed on 25 May 2019).
- Tolve, R.; Cela, N.; Condelli, N.; Di Cairano, M.; Caruso, M.C.; Galgano, F. Microencapsulation as a Tool for the Formulation of Functional Foods: The Phytosterols’ Case Study. Foods 2020, 9, 470. [Google Scholar] [CrossRef] [Green Version]
- Martianto, D.; Bararah, A.; Andarwulan, N.; Średnicka-Tober, D. Cross-Sectional Study of Plant Sterols Intake as a Basis for Designing Appropriate Plant Sterol-Enriched Food in Indonesia. Nutrients 2021, 13, 452. [Google Scholar] [CrossRef]
- Wang, M.; Huang, W.; Hu, Y.; Zhang, L.; Shao, Y.; Wang, M.; Zhang, F.; Zhao, Z.; Mei, X.; Li, T.; et al. Phytosterol profiles of common foods and estimated natural intake of different structures and forms in China. J. Agric. Food Chem. 2018, 66, 2669–2676. [Google Scholar] [CrossRef]
- Sioen, I.; Matthys, C.; Huybrechts, I.; Van Camp, J.; De Henauw, S. Consumption of plant sterols in Belgium: Estimated intakes and sources of naturally occurring plant sterols and β-carotene. Br. J. Nutr. 2011, 105, 960–966. [Google Scholar] [CrossRef] [PubMed] [Green Version]
- Normen, A.L.; Brants, H.A.M.; Voorrips, L.E.; Anderson, H.A.; van den Brandt, P.A.; Goldbohm, R.A. Plant sterol intakes and colorectal cancer risk in The Netherlands Cohort Study on diet and cancer. Am. J. Clin. Nutr. 2001, 74, 141–148. [Google Scholar] [CrossRef] [PubMed] [Green Version]
- Valsta, L.M.; Lemström, A.; Ovaskainen, M.L.; Lampi, A.M.; Toivo, J.; Korhonen, T.; Piironen, V. Estimation of plant sterol and cholesterol intake in Finland: Quality of new values and their effect on intake. Br. J. Nutr. 2004, 92, 671–678. [Google Scholar] [CrossRef] [PubMed] [Green Version]
- Klingberg, S.; Andersson, H.; Mulligan, A.; Bhaniani, A.; Welch, A.; Bingham, S.; Khaw, K.T.; Andersson, S.; Ellegård, L. Food sources of plant sterols in the EPIC Norfolk population. Eur. J. Clin. Nutr. 2008, 62, 695–703. [Google Scholar] [CrossRef] [Green Version]
- Amirabdollahian, F.; Ash, R. An estimate of phytate intake and molar ratio of phytate to zinc in the diet of the people in the United Kingdom. Public Health Nutr. 2010, 13, 1380–1388. [Google Scholar] [CrossRef] [Green Version]
- Przysławski, J.; Stelmach, M.; Grygiel-Górniak, M.; Dubec, A. An assessment of dietary habits in the group of studying adolescents especially taking into consideration plant sterols intake—Pilot study. Nowiny Lek. 2009, 77, 299–304. [Google Scholar]
- Food Standard Agency, Public Health England. McCance and Widdowson’s the Composition of Foods: 2019. Available online: https://www.gov.uk/government/publications/composition-of-foods-integrated-dataset-cofid (accessed on 25 May 2019).
- Rand, W.M.; Pennington, J.A.T.; Murphy, S.P.; Klensin, J.C. Compiling Data for Food Composition Data Bases; United Nations University Press: Tokyo, Japan, 1991; Available online: http://www.unu.edu/unupress/unupbooks/80772e/80772E00.htm (accessed on 10 January 2019).
- Lagarda, M.J.; García-Llatas, G.; Farré, R. Analysis of phytosterols in foods. J. Pharm. Biomed. Anal. 2006, 41, 1486–1496. [Google Scholar] [CrossRef] [PubMed] [Green Version]
- Normen, L.; Ellegard, L.; Brants, H.; Dutta, P.; Andersson, H. A phytosterol database: Fatty foods consumed in Sweden and the Netherlands. J. Food Compos. Anal. 2007, 20, 193–201. [Google Scholar] [CrossRef]
- Normén, L.; Bryngelsson, S.; Johnsson, M.; Evheden, P.; Ellegård, L.; Brants, H.; Andersson, H.; Dutta, P. The Phytosterol Content of Some Cereal Foods Commonly Consumed in Sweden and in the Netherlands. J. Food Compos. Anal. 2002, 15, 693–704. [Google Scholar] [CrossRef]
- Normén, L.; Johnsson, M.; Andersson, H.; van Gameren, Y.; Dutta, P. Plant sterols in vegetables and fruits commonly consumed in Sweden. Eur. J. Nutr. 1999, 38, 84–89. [Google Scholar] [CrossRef] [PubMed]
- Han, J.H.; Yang, Y.X.; Feng, M.Y. Contents of phytosterols in vegetables and fruits commonly consumed in China. Biomed. Environ. Sci. 2008, 21, 449–453. [Google Scholar] [CrossRef]
- Piironen, V.; Toivo, J.; Puupponen-Pimia, R.; Lampi, A.M. Plant sterols in vegetables, fruits and berries. J. Sci. Food Agric. 2003, 83, 330–337. [Google Scholar] [CrossRef]
- Ryan, E.; Galvin, K.; O’Connor, T.P.; Maguire, A.R.; O’Brien, N.M. Phytosterol, squalene, tocopherol content and fatty acid profile of selected seeds, grains, and legumes. Plant Foods Hum. Nutr. 2007, 62, 85–91. [Google Scholar] [CrossRef]
- Li, Y.C.; Li, C.L.; Li, R.; Chen, Y.; Zhang, M.; Guo, P.P.; Shi, D.; Ji, X.N.; Feng, R.N.; Sun, C.H. Associations of dietary phytosterols with blood lipid profiles and prevalence of obesity in Chinese adults, a cross-sectional study. Lipids Health Dis. 2018, 17, 54. [Google Scholar] [CrossRef] [Green Version]
- Yamaya, A.; Endo, Y.; Fujimoto, K.; Kitamura, K. Effects of genetic variability and planting location on the phytosterol content and composition in soybean seeds. Food Chem. 2007, 102, 1071–1075. [Google Scholar] [CrossRef]
- Decloedt, A.I.; Van Landschoot, A.; Watson, H.; Vanderputten, D.; Vanhaecke, L. Plant-Based Beverages as Good Sources of Free and Glycosidic Plant Sterols. Nutrients 2017, 10, 21. [Google Scholar] [CrossRef] [Green Version]
- Ruggiero, A.; Vitalini, S.; Burlini, N.; Bernasconi, S.; Iriti, M. Phytosterols in grapes and wine, and effects of agrochemicals on their levels. Food Chem. 2013, 141, 3473–3479. [Google Scholar] [CrossRef]
- Čížková, H.; Soukupová, V.; Voldřich, M.; Ševčík, R. Differentiation of coffee varieties according to their sterolic profile. J. Food Nutr. Res. 2007, 46, 28–34. [Google Scholar]
- Drygas, W.; Niklas, A.A.; Piwońska, A.; Piotrowski, W.; Flotyńska, A.; Kwaśniewska, M.; Nadrowski, P.; Puch-Walczak, A.; Szafraniec, K.; Bielecki, W.; et al. Multi-center National Population Health Examination Survey (WOBASZ II study): Assumptions, methods and implementation. Kardiol. Pol. 2016, 74, 681–690. [Google Scholar] [CrossRef] [PubMed] [Green Version]
- European Food Safety Authority (EFSA). Consumption of Food and Beverages with Added Plant Sterols. EFSA J. 2008, 133, 1–21. [Google Scholar] [CrossRef]
- Ras, R.T.; van der Schouw, Y.T.; Trautwein, E.A.; Sioen, I.; Dalmeijer, G.W.; Zock, P.L.; Beulens, J.W.J. Intake of phytosterols from natural sources and risk of cardiovascular disease in the European Prospective Investigation into Cancer and Nutrition-the Netherlands (EPIC-NL) population. Eur. J. Prev. Cardiol. 2015, 22, 1067–1075. [Google Scholar] [CrossRef] [PubMed]
- Jew, S.; AbuMweis, S.S.; Jones, P.J.H. Evolution of the human diet: Linking our ancestral diet to modern functional foods as a means of chronic disease prevention. J. Med. Food 2009, 12, 925–934. [Google Scholar] [CrossRef] [Green Version]
- Sirirat, R.; Heskey, C.; Haddad, E.; Tantamango-Bartley, Y.; Fraser, G.; Mashchak, A.; Jaceldo-Siegl, K. Comparison of phytosterol intake from FFQ with repeated 24-h dietary recalls of the Adventist Health Study-2 calibration sub-study. Br. J. Nutr. 2019, 121, 1424–1430. [Google Scholar] [CrossRef]
- Jaceldo-Siegl, K.; Lütjohann, D.; Sirirat, R.; Mashchak, A.; Fraser, G.E.; Haddad, E. Variations in dietary intake and plasma concentrations of plant sterols across plant-based diets among North American adults. Mol. Nutr. Food Res. 2017, 61. [Google Scholar] [CrossRef]
- Moreau, R.A. Composition of Plant Sterols and Stanols in Supplemented Food Products. J. AOAC Int. 2015, 98, 685–690. [Google Scholar] [CrossRef] [PubMed]
- Escurriol, V.; Cofán, M.; Serra, M.; Bulló, M.; Basora, J.; Salas-Salvadó, J.; Corella, D.; Zazpe, I.; Martínez-González, M.A.; Ruiz-Gutiérrez, V.; et al. Serum sterol responses to increasing plant sterol intake from natural foods in the Mediterranean diet. Eur. J. Nutr. 2009, 48, 373–382. [Google Scholar] [CrossRef]
- Ras, R.T.; Geleijnse, J.M.; Trautwein, E.A. LDL cholesterol-lowering effect of plant sterols and stanols across different dose ranges: A meta-analysis of randomised controlled studies. Br. J. Nutr. 2014, 112, 214–219. [Google Scholar] [CrossRef] [Green Version]
- Sanclemente, T.; Marques-Lopes, I.; Fajo-Pascual, M.; Cofán, M.; Jarauta, E.; Ros, E.; Puzo, J.; García-Otín, A.L. Naturally-occurring phytosterols in the usual diet influence cholesterol metabolism in healthy subjects. Nutr. Metab. Cardiovasc. Dis. 2012, 22, 849–855. [Google Scholar] [CrossRef]
- Racette, S.B.; Lin, X.; Lefevre, M.; Spearie, C.A.; Most, M.M.; Ma, L.; Ostlund, R.E., Jr. Dose effects of dietary phytosterols on cholesterol metabolism: A controlled feeding study. Am. J. Clin. Nutr. 2010, 91, 32–38. [Google Scholar] [CrossRef] [PubMed] [Green Version]
- Trautwein, E.A.; Vermeer, M.A.; Hiemstra, H.; Ras, R.T. LDL-Cholesterol Lowering of Plant Sterols and Stanols-Which Factors Influence Their Efficacy? Nutrients 2018, 10, 1262. [Google Scholar] [CrossRef] [Green Version]
- Witkowska, A.M.; Waśkiewicz, A.; Zujko, M.E.; Szcześniewska, D.; Śmigielski, W.; Stepaniak, U.; Pająk, A.; Drygas, W. The Consumption of Nuts is Associated with Better Dietary and Lifestyle Patterns in Polish Adults: Results of WOBASZ and WOBASZ II Surveys. Nutrients 2019, 11, 1410. [Google Scholar] [CrossRef] [PubMed] [Green Version]
- Waśkiewicz, A.; Szcześniewska, D.; Szostak-Węgierek, D.; Kwaśniewska, M.; Pająk, A.; Stepaniak, U.; Kozakiewicz, K.; Tykarski, A.; Zdrojewski, T.; Zujko, M.E.; et al. Are dietary habits of the Polish population consistent with the recommendations for prevention of cardiovascular disease?—WOBASZ II project. Kardiol. Pol. 2016, 74, 969–977. [Google Scholar] [CrossRef] [PubMed] [Green Version]
- Drywień, M.E.; Hamulka, J.; Jezewska-Zychowicz, M. Perceived Nutrition and Health Concerns: Do They Protect against Unhealthy Dietary Patterns in Polish Adults? Nutrients 2021, 13, 170. [Google Scholar] [CrossRef]
- Yang, R.; Xue, L.; Zhang, L.; Wang, X.; Qi, X.; Jiang, J.; Yu, L.; Wang, X.; Zhang, W.; Zhang, Q.; et al. Phytosterol Contents of Edible Oils and Their Contributions to Estimated Phytosterol Intake in the Chinese Diet. Foods 2019, 8, 334. [Google Scholar] [CrossRef] [Green Version]


| Trait | Men and Women N = 5690 | Men N = 2554 | Women N = 3136 | p * |
|---|---|---|---|---|
| Age (year), mean ± SD median (IQR) | 49.58 ± 16.43 50.00 (36.00–62.00) | 48.79 ± 16.27 49.00 (35.00–61.00) | 50.23 ± 16.54 51.00 (37.00–62.00) | 0.0023 |
| BMI (kg/m2), mean ± SD median (IQR) | 27.17 ± 5.19 26.63 (23.54–30.15) | 27.42 ± 4.55 27.07 (24.34–30.02) | 26.96 ± 5.65 26.12 (22.87–30.39) | <0.0001 |
| Systolic BP (mmHg), mean ± SD median (IQR) | 130.67 ± 19.34 127.5 (117.5–141.0) | 134.44 ± 18.19 131.5 (122.0–144.5) | 127.6 ± 19.71 124.0 (113.5–138.0) | <0.0001 |
| Diastolic BP (mmHg), mean ± SD median (IQR) | 80.23 ± 10.81 80.0 (72.5–87.0) | 81.51 ± 10.91 81.0 (74.0–88.0) | 79.19 ± 10.62 78.5 (72.0–85.5) | <0.0001 |
| Fasting glucose (mmol/L), mean ± SD median (IQR) | 5.50 ± 1.46 5.21 (4.84–5.72) | 5.65 ± 1.6 5.35 (4.96–5.84) | 5.38 ± 1.32 5.12 (4.77–5.58) | <0.0001 |
| Total cholesterol (mmol/L), mean ± SD median (IQR) | 5.20 ± 1.27 5.14 (4.38–5.93) | 5.21 ± 1.33 5.15 (4.36–5.97) | 5.19 ± 1.22 5.14 (4.41–5.90) | 0.7223 |
| LDL-cholesterol (mmol/L), mean ± SD median (IQR) | 3.15 ± 1.03 3.07 (2.42–3.78) | 3.19 ± 1.04 3.15 (2.46–3.86) | 3.11 ± 1.02 3.01 (2.39–3.72) | 0.0002 |
| Diseases (%) | ||||
| Hypertension 1 | 45.22 | 49.56 | 41.69 | <0.0001 |
| Hypercholesterolemia 2 | 67.30 | 68.86 | 66.03 | 0.0262 |
| Diabetes 3 | 10.82 | 11.86 | 9.96 | 0.0249 |
| Age groups (%) | ||||
| 20–40 years | 33.46 | 34.92 | 32.27 | 0.0045 |
| 41–60 years | 38.60 | 38.32 | 38.83 | |
| 61–74 years | 20.42 | 20.52 | 20.34 | |
| >74 years | 7.52 | 6.24 | 8.56 | |
| Commune size (%) | ||||
| <8.000 inhabitants | 35.20 | 33.83 | 36.32 | 0.0849 |
| 8.000–40.000 inhabitants | 30.67 | 30.70 | 30.64 | |
| >40.000 inhabitants | 34.13 | 35.47 | 33.04 | |
| Marital status (%) | ||||
| married | 66.71 | 70.19 | 63.87 | <0.0001 |
| single 4 | 33.29 | 29.81 | 36.13 | |
| Level of education 5 (%) | ||||
| under middle | 17.12 | 14.74 | 19.06 | <0.0001 |
| middle | 38.89 | 36.89 | 40.52 | |
| academic | 19.85 | 17.09 | 22.09 | |
| vocational | 24.14 | 31.28 | 18.33 | |
| Smoking status (%) | ||||
| current smokers | 23.28 | 28.95 | 18.66 | <0.0001 |
| past smokers | 25.46 | 33.62 | 18.82 | |
| never smokers | 51.26 | 37.43 | 62.52 | |
| Leisure-time physical activity 6 (%) | ||||
| low level | 54.25 | 54.98 | 53.67 | 0.2856 |
| middle level | 15.29 | 14.81 | 15.68 | |
| high level | 28.08 | 27.50 | 28.54 | |
| seasonally | 2.38 | 2.71 | 2.11 | |
| BMI (kg/m2) (%) | ||||
| underweight (BMI < 18.5) | 1.61 | 0.90 | 2.20 | <0.0001 |
| normal (BMI 18.5–24.99) | 34.91 | 30.07 | 38.88 | |
| overweight (BMI 25–29.99) | 37.25 | 43.93 | 31.76 | |
| obesity (BMI ≥ 30) | 26.23 | 25.10 | 27.16 | |
| Use of phytosterol-enriched margarines (%) | 1.90 | 1.96 | 1.85 | 0.7660 |
| Food Categories | All N = 5690 | Men N = 2554 | Women N = 3136 | p * | |
|---|---|---|---|---|---|
| Cereals | mg/day (mean ± SD), | 90.65 ± 56.38 | 112.51 ± 63.28 | 72.85 ± 42.42 | <0.0001 |
| median (IQR) | 79.15 (53.94–114.87) | 102.44 (69.27–143.02) | 66.77 (45.90–91.39) | ||
| Contribution to PS (%) | 32.04 | 35.08 | 28.88 | <0.0001 | |
| Major sources (% contribution) ** | wheat bread (16.65), rolls (6.64), rye bread (5.38) | wheat bread (20.59), rolls (6.85), rye bread (4.82) | wheat bread (12.56), rolls (6.43), rye bread (5.96) | - | |
| Fats | mg/day (mean ± SD), | 81.94 ± 92.30 | 98.34 ± 107.10 | 68.58 ± 75.63 | <0.0001 |
| median (IQR) | 51.65 (19.05–114.67) | 64.75 (24.30–138.68) | 44.47 (15.76–97.22) | ||
| Contribution to PS (%) | 28.95 | 30.66 | 27.20 | 0.0042 | |
| Major sources (% contribution) ** | oils (19.11) including: canola oil (16.92), sunflower oil (2.06), olive oil (0.04), soft margarines (8.33), mayonnaise (1.05) | oils (20.02) including: canola oil (18.03), sunflower oil (1.88), olive oil (0.06), soft margarines (9.08), mayonnaise (1.05) | oils (18.17) including: canola oil (15.77), sunflower oil (2.25), olive oil (0.03), soft margarines (7.56), mayonnaise (1.05) | - | |
| Fruits | mg/day (mean ± SD), | 27.76 ± 31.23 | 25.69 ± 31.46 | 29.44 ± 30.95 | <0.0001 |
| median (IQR) | 20.19 (0–40.38) | 17.50 (0–39.37) | 21.62 (3.62–42.39) | ||
| Contribution to PS (%) | 9.81 | 8.01 | 11.67 | <0.0001 | |
| Major sources (% contribution) ** | raw fruits (9.78) including: apples (4.47), bananas (1.04), grapes (0.78), pears (0.52), plums (0.48), strawberries (0.37) | raw fruits (7.98) including: apples (4.10), bananas (0.87), grapes (0.57), pears (0.44), plums (0.40), strawberries (0.27) | raw fruits (11.65) including: apples (5.42), bananas (1.23), grapes (1.00), pears (0.60), plums (0.55), strawberries (0.48) | - | |
| Vegetables | mg/day (mean ± SD), | 25.37 ± 24.22 | 26.04 ± 24.16 | 24.83± 24.26 | 0.0028 |
| median (IQR) | 20.05 (10.12–33.45) | 21.10 (10.53–34.73) | 19.22 (9.92–32.34) | ||
| Contribution to PS (%) | 8.97 | 8.12 | 9.85 | 0.0224 | |
| Major sources (% contribution) ** | raw vegetables (7.27), including: tomatoes (1.11), carrots (0.90), cabbage (0.84), cauliflowers (0.77), peppers (0.45), beetroot (0.49), lettuce (0.47), cucumbers (0.42), vegetable preserves (1.32) | raw vegetables (6.45) including: tomatoes (1.02), carrots (0.77), cabbage (0.77), cauliflowers (0.64), beetroot (0.50), peppers (0.39), lettuce (0.38), cucumbers (0.38), vegetable preserves (1.37) | raw vegetables (8.11) including: tomatoes (1.21), carrots (1.03), cabbage (0.91), cauliflowers (0.91), peppers (0.52), beetroot (0.49), lettuce (0.47), cucumbers (0.42), vegetable preserves (1.26) | - | |
| Coffee | mg/day (mean ± SD), | 19.24 ± 20.39 | 17.56 ± 20.84 | 20.61 ± 19.91 | <0.0001 |
| median (IQR) | 21.47 (0–26.84) | 21.47 (0–26.84) | 21.47 (0–26.84) | ||
| Contribution to PS (%) | 6.80 | 5.48 | 8.17 | <0.0001 | |
| Cookies, | mg/day (mean ± SD), | 11.57± 23.84 | 11.36 ± 24.40 | 11.72 ± 23.40 | 0.0055 |
| cakes | median (IQR) | 0 (0–16.50) | 0 (0–15.00) | 0 (0–17.60) | |
| Contribution to PS (%) | 4.08 | 3.54 | 4.65 | 0.0332 | |
| Chocolate | mg/day (mean ± SD), | 6.46 ± 22.86 | 6.78 ± 7.20 | 6.19 ± 21.39 | 0.0477 |
| products | median (IQR) | 0 (0–0) | 0 (0–0) | 0 (0–0) | |
| Contribution to PS (%) | 2.28 | 2.11 | 2.46 | 0.3936 | |
| Potatoes | mg/day (mean ± SD), | 6.12 ± 6.34 | 7.30 ± 7.20 | 5.16 ± 5.35 | <0.0001 |
| median (IQR) | 6.05 (0–11.01) | 6.05 (0–12.10) | 4.15 (0–8.07) | ||
| Contribution to PS (%) | 2.16 | 2.27 | 2.05 | 0.5511 | |
| Legumes | mg/day (mean ± SD), | 3.84 ± 18.56 | 4.70 ± 21.97 | 3.13 ± 15.19 | 0.9949 |
| median (IQR) | 0 (0–0) | 0 (0–0) | 0 (0–0) | ||
| Contribution to PS (%) | 1.36 | 1.47 | 1.24 | 0.4277 | |
| Other food products | mg/day (mean ± SD), | 10.02 | 10.49 | 9.68 | - |
| Contribution to PS (%) | 3.55 | 3.26 | 3.83 | 0.2434 | |
| Total plant sterol intake | mg/day (mean ± SD), median (IQR) | 282.97 ± 144.50 255.96 (184.98–347.98) | 320.77 ± 160.93 291.76 (209.96–399.07) | 252.19 ± 121.20 230.61 (167.73–308.2) | <0.0001 |
| Contribution to PS (%) | 100 | 100 | 100 | - | |
| Food Categories | All N = 5690 | Men N = 2554 | Women N = 3136 | p * | |
|---|---|---|---|---|---|
| Cereals | mg/day (mean ± SD), | 51.37 ± 31.69 | 63.57 ± 35.62 | 41.44 ± 23.84 | <0.0001 |
| median (IQR) | 44.98 (30.27–64.94) | 58.45 (39.20–81.10) | 37.87 (26.28–51.81) | ||
| Contribution to β-SIT (%) | 29.19 | 32.13 | 26.20 | <0.0001 | |
| Major sources (% contribution) ** | wheat bread (14.88), rolls (6.04), rye bread (4.75) | wheat bread (18.56), rolls (6.29), rye bread (4.28) | wheat bread (11.14), rolls (5.79), rye bread (5.22) | - | |
| Fats | mg/day (mean ± SD), | 50.78 ± 54.93 | 60.81 ± 63.51 | 42.61 ± 45.17 | <0.0001 |
| median (IQR) | 33.86 (12.70–71.60) | 42.15 (16.50–88.00) | 28.40 (11.00–61.14) | ||
| Contribution to β-SIT (%) | 28.86 | 30.73 | 26.95 | 0.0017 | |
| Major sources (% contribution) ** | oils (18.43) including: canola oil (15.88), sunflower oil (2.40), olive oil (0.07), soybean oil (0.07), soft margarines (9.02), mayonnaise (0.87) | oils (19.40) including: canola oil (17.06), sunflower oil (2.20), olive oil (0.09), soybean oil (0.05), soft margarines (9.87), mayonnaise (0.88) | oils (17.44) including: canola oil (14.68), sunflower oil (2.60), olive oil (0.05), soybean oil (0.09), soft margarines (8.16), mayonnaise (0.86) | - | |
| Fruits | mg/day (mean ± SD), | 25.00 ± 27.70 | 23.21 ± 27.96 | 26.45 ± 27.41 | <0.0001 |
| median (IQR) | 19.50 (0–38.13) | 15.90 (0–36.36) | 19.50 (3.29–39.00) | ||
| Contribution to β-SIT (%) | 14.20 | 11.73 | 16.73 | <0.0001 | |
| Major sources (% contribution) ** | raw fruits (14.17) including: apples (7.37), bananas (1.29), grapes (1.05), pears (0.81), plums (0.62), strawberries (0.55) | raw fruits (11.68) including: apples (6.41), bananas (1.08), grapes (0.77), pears (0.69), plums (0.53), strawberries (0.40) | raw fruits (16.70) including: apples (8.34), bananas (1.51), grapes (1.33), pears (0.93), plums (0.72), strawberries (0.70), peaches (0,56) | - | |
| Vegetables | mg/day (mean ± SD), | 15.31 ± 14.51 | 15.68 ± 14.69 | 15.01 ± 14.36 | 0.0037 |
| median (IQR) | 11.96 (5.88–20.15) | 12.60 (6.16–20.84) | 11.56 (5.73–19.60) | ||
| Contribution to β-SIT (%) | 8.70 | 7.92 | 9.49 | 0.0347 | |
| Major sources (% contribution) ** | raw vegetables (7.11), including: cabbage (0.98), carrots (0.99), tomatoes (0.91), cauliflowers (0.81), peppers (0.54), beetroot (0.43), onion (0.36), cucumbers (0.33), vegetable preserves (1.23) | raw vegetables (6.36) including: cabbage (0.92), carrots (0.86), tomatoes (0.84), cauliflowers (0.68), peppers (0.47), beetroot (0.43), onion (0.38), cucumbers (0.32), vegetable preserves (1.28) | raw vegetables (7.88) including: cabbage (1.06), carrots (1.13), tomatoes (0.99), cauliflowers (0.94), peppers (0.61), beetroot (0.42), onion (0.34), cucumbers (0.35), vegetable preserves (1.18) | - | |
| Coffee | mg/day (mean ± SD), | 9.91 ± 10.50 | 9.05 ± 10.74 | 10.62 ± 10.26 | <0.0001 |
| median (IQR) | 11.06 (0–13.83) | 11.06 (0–13.83) | 11.06 (0–13.83) | ||
| Contribution to β-SIT (%) | 5.64 | 4.57 | 6.72 | 0.0005 | |
| Cookies, | mg/day (mean ± SD), | 7.04 ± 14.04 | 6.97 ± 14.69 | 7.10 ± 13.49 | 0.0058 |
| cakes | median (IQR) | 0 (0–10.20) | 0 (0–10.00) | 0 (0–10.40) | |
| Contribution to β-SIT (%) | 4.00 | 3.52 | 4.49 | 0.0645 | |
| Chocolate | mg/day (mean ± SD), | 3.89 ± 13.77 | 4.10 ± 14.76 | 3.73 ± 12.89 | 0.0485 |
| products | median (IQR) | 0 (0–0) | 0 (0–0) | 0 (0–0) | |
| Contribution to β-SIT (%) | 2.22 | 2.07 | 2.36 | 0.4699 | |
| Potatoes | mg/day (mean ± SD), | 4.35 ± 4.50 | 5.18 ± 5.12 | 3.67 ± 3.80 | <0.0001 |
| median (IQR) | 4.30 (0–7.82) | 4.30 (0–8.60) | 2.95 (0–5.73) | ||
| Contribution to β-SIT (%) | 2.47 | 2.62 | 2.32 | 0.4742 | |
| Legumes | mg/day (mean ± SD), | 2.21 ± 11.91 | 2.71 ± 14.03 | 1.80 ± 9.83 | 0.9852 |
| median (IQR) | 0 (0–0) | 0 (0–0) | 0 (0–0) | ||
| Contribution to β-SIT (%) | 1.25 | 1.37 | 1.14 | 0.4522 | |
| Other food products | mg/day (mean ± SD), | 6.12 | 6.61 | 5.71 | - |
| Contribution to β-SIT (%) | 3.47 | 3.34 | 3.60 | 0.5732 | |
| Total β-sitosterol intake | mg/day (mean ± SD), median (IQR) | 175.98 ± 88.00 160.85 (115.80–218.15) | 197.89 ± 98.28 180.84 (131.20–246.86) | 158.14 ± 74.02 146.28 (105.89–196.13) | <0.0001 |
| Contribution to β-SIT (%) | 100 | 100 | 100 | - | |
| Food Categories | All N = 5690 | Men N = 2554 | Women N = 3136 | p * | |
|---|---|---|---|---|---|
| Fats | mg/day (mean ± SD), | 26.55 ± 35.53 | 32.02 ± 41.34 | 22.10 ± 29.23 | <0.0001 |
| median (IQR) | 12.52 (3.75–37.85) | 16.70 (4.65–45.65) | 10.10 (3.00–31.11) | ||
| Contribution to CAMP (%) | 44.95 | 46.30 | 43.47 | 0.0311 | |
| Major sources (% contribution) ** | oils (34.60) including: canola oil (33.43), sunflower oil (1.07), soybean oil (0.08), olive oil (0.01), soft margarines (8.11), mayonnaise (1.87) | oils (35.50) including: canola oil (34.48), sunflower oil (0.94), soybean oil (0.06), olive oil (0.01), soft margarines (8.58), mayonnaise (1.81) | oils (33.61) including: canola oil (32.26), sunflower oil (1.21), soybean oil (0.11), olive oil (0.01), soft margarines (7.60), mayonnaise (1.94) | - | |
| Cereals | mg/day (mean ± SD), | 18.79 ± 11.57 | 23.34 ± 13.00 | 15.09 ± 8.65 | <0.0001 |
| median (IQR) | 16.50 (11.11–23.84) | 21.46 (14.48–30.02) | 13.79 (9.37–19.06) | ||
| Contribution to CAMP (%) | 31.81 | 33.74 | 29.67 | 0.0009 | |
| Major sources (% contribution) ** | wheat bread (16.30), rolls (6.91), rye bread (5.49) | wheat bread (19.52), rolls (6.92), rye bread (4.76) | wheat bread (12.74), rolls (6.91), rye bread (6.29) | - | |
| Vegetables | mg/day (mean ± SD), | 3.04 ± 3.81 | 3.06 ± 3.90 | 3.04 ± 3.75 | 0.2297 |
| median (IQR) | 2.00 (0.72–3.99) | 2.09 (0.74–4.08) | 1.95 (0.69–3.91) | ||
| Contribution to CAMP (%) | 5.16 | 4.43 | 5.97 | 0.0098 | |
| Major sources (% contribution) ** | fresh vegetables (4.29) including: cauliflowers (1.07), cabbage (0.93), carrots (0.70), peppers (0.51), tomatoes (0.36), vegetable preserves (0.68) | fresh vegetables (3.62) including: cabbage (0.75), cauliflowers (0.71), carrots (0.49), peppers (0.36), tomatoes (0.28), vegetable preserves (0.67) | fresh vegetables (5.04) including: cauliflowers (1.07), cabbage (0.93), carrots (0.70), peppers (0.51), tomatoes (0.36), vegetable preserves (0.69) | - | |
| Cookies, | mg/day (mean ± SD), | 2.99 ± 6.30 | 2.99 ± 6.69 | 3.00 ± 5.95 | 0.0049 |
| cakes | median (IQR) | 0 (0–3.90) | 0 (0–3.60) | 0 (0–4.16) | |
| Contribution to CAMP (%) | 5.07 | 4.32 | 5.90 | 0.0071 | |
| Coffee | mg/day (mean ± SD), | 3.15 ± 3.33 | 2.87 ± 3.41 | 3.37 ± 3.26 | <0.0001 |
| median (IQR) | 3.51 (0–4.39) | 3.51 (0–4.39) | 3.51 (0–4.39) | ||
| Contribution to CAMP (%) | 5.33 | 4.15 | 6.63 | <0.0001 | |
| Fruits | mg/day (mean ± SD), | 1.52 ± 2.47 | 1.38 ± 2.53 | 1.63 ± 2.42 | <0.0001 |
| median (IQR) | 0.60 (0–1.91) | 0.54 (0–1.64) | 0.72 (0.15–2.23) | ||
| Contribution to CAMP (%) | 2.57 | 1.99 | 3.21 | 0.0044 | |
| Major sources (% contribution) ** | raw fruits (2.56) including: apples (0.61), bananas (0.53), grapes (0.30), mandarins (0.27), plums (0.19), oranges (0.17) | raw fruits (1.98) including: apples (0.51), bananas (0.42), grapes (0.22), mandarins (0.21), plums (0.16), oranges (0.11) | raw fruits (3.20) including: apples (0.72), bananas (0.64), grapes (0.40), mandarins (0.34), oranges (0.24), plums (0.23) | - | |
| Chocolate | mg/day (mean ± SD), | 0.68 ± 2.41 | 0.71 ± 2.59 | 0.65 ± 2.25 | 0.0462 |
| products | median (IQR) | 0 (0–0) | 0 (0–0) | 0 (0–0) | |
| Contribution to CAMP (%) | 1.15 | 1.03 | 1.28 | 0.3669 | |
| Potatoes | mg/day (mean ± SD), | 0.37 ± 0.38 | 0.44 ± 0.44 | 0.31 ± 0.32 | <0.0001 |
| median (IQR) | 0.37 (0–0.67) | 0.37 (0–0.73) | 0.25 (0–0.49) | ||
| Contribution to CAMP (%) | 0.63 | 0.64 | 0.61 | 0.9213 | |
| Legumes | mg/day (mean ± SD), | 0.35 ± 1.75 | 0.42 ± 2.06 | 0.28 ± 1.44 | 0.9950 |
| median (IQR) | 0 (0–0) | 0 (0–0) | 0 (0–0) | ||
| Contribution to CAMP (%) | 0.59 | 0.61 | 0.55 | 0.6768 | |
| Other food products | mg/day (mean ± SD), | 1.62 | 1.93 | 1.36 | - |
| Contribution to CAMP (%) | 2.74 | 2.79 | 2.67 | 0.8152 | |
| Total campesterol intake | mg/day (mean ± SD), median (IQR) | 59.06 ± 41.44 47.45 (31.53–74.39) | 69.16 ± 47.68 56.71 (37.17–86.39) | 50.83 ± 33.38 40.88 (27.80–64.90) | <0.0001 |
| Contribution to CAMP (%) | 100 | 100 | 100 | - | |
| Food Categories | All N = 5690 | Men N = 2554 | Women N = 3136 | p * | |
|---|---|---|---|---|---|
| Coffee | mg/day (mean ± SD), | 6.18 ± 6.55 | 5.64 ± 6.70 | 6.62 ± 6.40 | <0.0001 |
| median (IQR) | 6.90 (0–8.63) | 6.90 (0–8.63) | 6.90 (0–8.63) | ||
| Contribution to STIG (%) | 25.10 | 21.41 | 28.53 | <0.0001 | |
| Vegetables | mg/day (mean ± SD), | 5.72 ± 5.48 | 6.00 ± 5.63 | 5.49 ± 5.34 | 0.0007 |
| median (IQR) | 4.34 (1.90–7.96) | 4.55 (1.95–8.48) | 4.12 (1.85–7.45) | ||
| Contribution to STIG (%) | 23.22 | 22.76 | 23.66 | 0.4179 | |
| Major sources (% contribution) ** | raw vegetables (17.90) including: tomatoes (4.63), beets (1.90), cucumbers (1.82), carrots (1.80), parsley (1.88), green beans (1.88), lettuce (1.24), celery (1.08), vegetable preserves (4.10) | raw vegetables (17.15) including: tomatoes (4.48), beets (2.02), cucumbers (1.83), carrots (1.64), parsley (1.89), green beans (1.52), lettuce (1.17), celery (1.12), vegetable preserves (4.62) | raw vegetables (18.60) including: tomatoes (4.76), beets (1.79), cucumbers (1.81), carrots (1.96), parsley (1.88), green beans (2.21), lettuce (1.31), celery (1.04), vegetable preserves (3.62) | - | |
| Fats | mg/day (mean ± SD), | 4.15 ± 4.93 | 5.02 ± 5.79 | 3.44 ± 3.97 | <0.0001 |
| median (IQR) | 2.59 (0.81–5.77) | 3.23 (1.05–7.10) | 2.28 (0.66–4.97) | ||
| Contribution to STIG (%) | 16.85 | 19.05 | 14.84 | <0.0001 | |
| Major sources (% contribution) ** | soft margarines (11.82), oils (3.75), mixed fats (0.65), mayonnaise (0.60) | soft margarines (13.90), oils (3.69), mixed fats (0.79), mayonnaise (0.63) | soft margarines (9.91), oils (3.80), mixed fats (0.52), mayonnaise (0.56) | - | |
| Cereals | mg/day (mean ± SD), | 3.19 ± 2.26 | 3.91 ± 2.43 | 2.60 ± 1.93 | <0.0001 |
| median (IQR) | 2.72 (1.82–3.98) | 3.53 (2.36–5.02) | 2.33 (1.57–3.19) | ||
| Contribution to STIG (%) | 12.93 | 14.83 | 11.18 | <0.0001 | |
| Major sources (% contribution) ** | wheat bread (6.48), rolls (2.57), rye bread (2.48), cereals (0,66) | wheat bread (8.49), rolls (2.69), rye bread (2.44), cereals (0,47) | wheat bread (4.62), rolls (2.29), rye bread (2.69), cereals (0,84) | - | |
| Chocolate | mg/day (mean ± SD), | 1.58 ± 5.59 | 1.66 ± 6.00 | 1.51 ± 5.22 | 0.0474 |
| products | median (IQR) | 0 (0–0) | 0 (0–0) | 0 (0–0) | |
| Contribution to STIG (%) | 6.40 | 6.29 | 6.52 | 0.7579 | |
| Legumes | mg/day (mean ± SD), | 1.21 ± 6.04 | 1.47 ± 7.23 | 0.99 ± 4.86 | 0.9904 |
| median (IQR) | 0 (0–0) | 0 (0–0) | 0 (0–0) | ||
| Contribution to STIG (%) | 4.91 | 5.58 | 4.28 | 0.0208 | |
| Fruits | mg/day (mean ± SD), | 0.92 ± 1.81 | 0.82 ± 1.71 | 1.00 ± 1.88 | <0.0001 |
| median (IQR) | 0.18 (0–0.88) | 0.15 (0–0.60) | 0.22 (0.02–1.13) | ||
| Contribution to STIG (%) | 3.73 | 3.13 | 4.29 | 0.0211 | |
| Major sources (% contribution) ** | raw fruits (3.72) including: bananas (1.68), apples (0.40), nectarines (0.30), plums (0.29), peaches (0.40) | raw fruits (3.12) including: bananas (1.33), apples (0.37), nectarines (0.27), plums (0.26), peaches (0.25) | raw fruits (4.28) including: bananas (1.68), apples (0.44), nectarines (0.33), plums (0.32), peaches (0.53) | - | |
| Potatoes | mg/day (mean ± SD), | 0.61 ± 0.63 | 0.73 ± 0.72 | 0.52 ± 0.53 | <0.0001 |
| median (IQR) | 0.60 (0–1.10) | 0.60 (0–1.21) | 0.41 (0–0.81) | ||
| Contribution to STIG (%) | 2.48 | 2.77 | 2.22 | 0.1861 | |
| Cookies, | mg/day (mean ± SD), | 0.59 ± 1.52 | 0.57 ± 1.62 | 0.61 ± 1.44 | 0.0004 |
| cakes | median (IQR) | 0 (0–0.40) | 0 (0–0.25) | 0 (0–0.50) | |
| Contribution to STIG (%) | 2.40 | 2.17 | 2.61 | 0.2589 | |
| Other food products | mg/day (mean ± SD), | 0.48 | 0.54 | 0.44 | - |
| Contribution to STIG (%) | 1.98 | 2.01 | 1.88 | 0.7530 | |
| Total stigmasterol intake | mg/day (mean ± SD), median (IQR) | 24.63 ± 14.49 22.10 (14.53–30.92) | 26.36 ± 16.02 23.49 (15.14–32.91) | 23.22 ± 12.94 21.11 (14.16–29.19) | <0.0001 |
| Contribution to STIG (%) | 100 | 100 | 100 | - | |
| Plant Sterols (mg) | Men | Women | p-Value |
|---|---|---|---|
| Total plant sterols | 320.8 | 252.2 | <0.0001 |
| Total plant sterols/1000 kcal | 141.0 | 154.2 | <0.0001 |
| β-sitosterol | 197.8 | 158.1 | <0.0001 |
| β-sitosterol/1000 kcal | 87.1 | 96.8 | <0.0001 |
| Campesterol | 69.2 | 50.8 | <0.0001 |
| Campesterol/1000 kcal | 29.8 | 30.4 | 0.2279 |
| Stigmasterol | 26.4 | 23.2 | <0.0001 |
| Stigmasterol/1000 kcal | 12.0 | 14.8 | <0.0001 |
Publisher’s Note: MDPI stays neutral with regard to jurisdictional claims in published maps and institutional affiliations. |
© 2021 by the authors. Licensee MDPI, Basel, Switzerland. This article is an open access article distributed under the terms and conditions of the Creative Commons Attribution (CC BY) license (https://creativecommons.org/licenses/by/4.0/).
Share and Cite
Witkowska, A.M.; Waśkiewicz, A.; Zujko, M.E.; Mirończuk-Chodakowska, I.; Cicha-Mikołajczyk, A.; Drygas, W. Assessment of Plant Sterols in the Diet of Adult Polish Population with the Use of a Newly Developed Database. Nutrients 2021, 13, 2722. https://doi.org/10.3390/nu13082722
Witkowska AM, Waśkiewicz A, Zujko ME, Mirończuk-Chodakowska I, Cicha-Mikołajczyk A, Drygas W. Assessment of Plant Sterols in the Diet of Adult Polish Population with the Use of a Newly Developed Database. Nutrients. 2021; 13(8):2722. https://doi.org/10.3390/nu13082722
Chicago/Turabian StyleWitkowska, Anna Maria, Anna Waśkiewicz, Małgorzata Elżbieta Zujko, Iwona Mirończuk-Chodakowska, Alicja Cicha-Mikołajczyk, and Wojciech Drygas. 2021. "Assessment of Plant Sterols in the Diet of Adult Polish Population with the Use of a Newly Developed Database" Nutrients 13, no. 8: 2722. https://doi.org/10.3390/nu13082722
APA StyleWitkowska, A. M., Waśkiewicz, A., Zujko, M. E., Mirończuk-Chodakowska, I., Cicha-Mikołajczyk, A., & Drygas, W. (2021). Assessment of Plant Sterols in the Diet of Adult Polish Population with the Use of a Newly Developed Database. Nutrients, 13(8), 2722. https://doi.org/10.3390/nu13082722