
A Fit-for-Purpose Nutrient Profiling Model to Underpin Food and Nutrition Policies in South Africa

 , , and
Abstract
:1. Introduction
1.1. The Need for Evidence-Based Restrictive Food Policies in South Africa
1.2. Considerations for a Fit-for-Purpose NPM to Underpin Restrictive Food Policy in SA
2. Materials and Methods
- Determining the purpose, and target population of the NPM;
- Selecting appropriate nutrients and other food components to include;
- Selecting a suitable NPM type, criteria and base;
- Selecting appropriate numbers and thresholds.
2.1. Data
2.2. Steps in NPM Development
2.2.1. Step 1: Determining the Purpose and Target Population of the NPM
2.2.2. Step 2: Deciding Which Nutrients and Other Food Components to Include
2.2.3. Step 3: Selection of a Suitable NPM Type, Criteria and Base
2.2.4. Step 4: Choosing the Thresholds to Use
3. Results
3.1. The Purpose and Target Population of the NPM
Recommendation
3.2. Nutrients and Other Food Components to Include
3.2.1. Sugar
3.2.2. Fat
3.2.3. Sodium
3.2.4. Energy
3.2.5. Non-Sugar Sweetener
3.2.6. Recommendation
3.3. Selecting the NPM Type, Criteria and Base
Recommendation
3.4. Thresholds to Use
Recommendation
- Free sugar;
- Added sodium;
- Added saturated fat;
- Non-sugar sweetener.
4. Discussion
Limitations and Strengths of the Study
5. Conclusions
Supplementary Materials
Author Contributions
Funding
Institutional Review Board Statement
Informed Consent Statement
Data Availability Statement
Acknowledgments
Conflicts of Interest
References
- Wells, J.C.; Sawaya, A.L.; Wibaek, R.; Mwangome, M.; Poullas, M.S.; Yajnik, C.S.; Demaio, A. The double burden of malnutrition: Aetiological pathways and consequences for health. Lancet 2020, 395, 75–88. [Google Scholar] [CrossRef]
- Food and Agriculture Organization; World Health Organization. The Nutrition Challenge: Food System Solutions; FAO: Rome, Italy, 2018. [Google Scholar]
- Hawkes, C.; Smith, T.G.; Jewell, J.; Wardle, J.; Hammond, R.A.; Friel, S.; Thow, A.M.; Kain, J. Smart food policies for obesity prevention. Lancet 2015, 385, 2410–2421. [Google Scholar] [CrossRef]
- Sacks, G.; Rayner, M.; Stockley, L.; Scarborough, P.; Snowdon, W.; Swinburn, B. Applications of nutrient profiling: Potential role in diet-related chronic disease prevention and the feasibility of a core nutrient-profiling system. Eur. J. Clin. Nutr. 2011, 65, 298–306. [Google Scholar] [CrossRef] [Green Version]
- Contreras-Manzano, A.; Jáuregui, A.; Velasco-Bernal, A.; Vargas-Meza, J.; Rivera, J.; Tolentino-Mayo, L.; Barquera, S. Comparative Analysis of the Classification of Food Products in the Mexican Market According to Seven Different Nutrient Profiling Systems. Nutrients 2018, 10, 737. [Google Scholar] [CrossRef] [Green Version]
- Labonté, M.-È.E.; Gladanac, B.; Ahmed, M.; Rayner, M.; Poon, T.; Franco-Arellano, B.; L’Abbé, M.R.; Gladanac, B.; Ahmed, M.; Franco-Arellano, B.; et al. Nutrient Profile Models with Applications in Government-Led Nutrition Policies Aimed at Health Promotion and Noncommunicable Disease Prevention: A Systematic Review. Adv. Nutr. 2018, 9, 741–788. [Google Scholar] [CrossRef] [PubMed] [Green Version]
- Food and Agriculture Organization; Pan American Health Organization. Approval of a New Food Act in Chile: Process Summary; FAO: Santiago, Chile, 2017. [Google Scholar]
- Shisana, O.; Labadarios, D.; Rehle, T.; Simbayi, L.; Zuma, K.; Dhansay, A.; Reddy, P.; Parker, W.; Hooisan, E.; Naidoo, P.; et al. South African National Health and Nutrition Examination Survey (SANHANES-1); HSRC Press: Cape Town, South Africa, 2013. [Google Scholar]
- Ronquest-Ross, L.-C.; Vink, N.; Sigge, G. Food consumption changes in South Africa since 1994. S. Afr. J. Sci. 2015, 111, 1–12. [Google Scholar] [CrossRef]
- National Department of Health. Strategy for the Prevention and Control of Obesity in South Africa 2015–2020; National Department of Health: Pretoria, South Africa, 2015.
- Popkin, B.M.; Corvalan, C.; Grummer-Strawn, L.M. Dynamics of the double burden of malnutrition and the changing nutrition reality. Lancet 2020, 395, 65–74. [Google Scholar] [CrossRef]
- Erzse, A.; Fraser, H.; Levitt, N.; Hofman, K. Prioritising action on diabetes during COVID-19. South African Med. J. 2020, 110, 719. [Google Scholar] [CrossRef]
- National Department of Health. Regulations Relating to the Labelling and Advertsing of Foodstuffs (R146/2010); National Department of Health: Pretoria, South Africa, 2010; pp. 3–53.
- National Department of Health. Draft Regulations Relating to Labelling and Advertising of Foods (R429/2014); National Department of Health: Pretoria, South Africa, 2014.
- National Department of Health. Regulations Relating to the Reduction of Sodium in Certain Foodstuffs and Related Matters (R214/2013); National Department of Health: Pretoria, South Africa, 2013; pp. 3–7.
- National Department of Health. Regulations Relating to Trans-Fat in Foodstuffs (R127/2011); National Department of Health: Pretoria, South Africa, 2011; pp. 3–6.
- Reeve, E.; Naseri, T.; Martyn, T.; Bollars, C.; Thow, A.-M. Developing a context-specific nutrient profiling system for food policy in Samoa. Health Promot. Int. 2018, 34, e94–e105. [Google Scholar] [CrossRef] [PubMed]
- Jones, A.; Neal, B.; Reeve, B.; Ni Mhurchu, C.; Thow, A.M. Front-of-pack nutrition labelling to promote healthier diets: Current practice and opportunities to strengthen regulation worldwide. BMJ Glob. Health 2019, 4, e001882. [Google Scholar] [CrossRef]
- Bertscher, A.; London, L.; Orgill, M. Unpacking policy formulation and industry influence: The case of the draft control of marketing of alcoholic beverages bill in South Africa. Health Policy Plan. 2018, 33, 786–800. [Google Scholar] [CrossRef]
- Fooks, G.J.; Williams, S.; Box, G.; Sacks, G. Corporations’ use and misuse of evidence to influence health policy: A case study of sugar-sweetened beverage taxation. Global Health 2019, 15, 56. [Google Scholar] [CrossRef] [PubMed]
- Abdool Karim, S.; Kruger, P.; Hofman, K. Industry strategies in the parliamentary process of adopting a sugar-sweetened beverage tax in South Africa: A systematic mapping. Global Health 2020, 16, 116. [Google Scholar] [CrossRef]
- Mialon, M.; Crosbie, E.; Sacks, G. Mapping of food industry strategies to influence public health policy, research and practice in South Africa. Int. J. Public Health 2020, 1. [Google Scholar] [CrossRef]
- Labonté, M.-È.; Poon, T.; Mulligan, C.; Bernstein, J.T.; Franco-Arellano, B.; L’Abbé, M.R. Comparison of global nutrient profiling systems for restricting the commercial marketing of foods and beverages of low nutritional quality to children in Canada. Am. J. Clin. Nutr. 2017, 106, 1471–1481. [Google Scholar] [CrossRef] [Green Version]
- Bell, W.; Colaiezzi, B.A.; Prata, C.S.; Coates, J.C. Scaling up Dietary Data for Decision-Making in Low-Income Countries: New Technological Frontiers. Adv. Nutr. 2017, 8, 916–932. [Google Scholar] [CrossRef] [PubMed] [Green Version]
- Pitt, C.; Vassall, A.; Teerawattananon, Y.; Griffiths, U.K.; Guinness, L.; Walker, D.; Foster, N.; Hanson, K. Foreword: Health Economic Evaluations in Low- and Middle-income Countries: Methodological Issues and Challenges for Priority Setting. Health Econ. 2016, 25, 1–5. [Google Scholar] [CrossRef]
- Dodd, R.; Reeve, E.; Sparks, E.; George, A.; Vivili, P.; Win Tin, S.T.; Buresova, D.; Webster, J.; Thow, A.-M. The politics of food in the Pacific: Coherence and tension in regional policies on nutrition, the food environment and non-communicable diseases. Publ. Health Nutr. 2020, 23, 168–180. [Google Scholar] [CrossRef]
- Wicks, M.; Wright, H.; Wentzel-Viljoen, E. Restricting the marketing of foods and non-alcoholic beverages to children in South Africa: Are all nutrient profiling models the same? Br. J. Nutr. 2017, 116, 2150–2159. [Google Scholar] [CrossRef] [PubMed]
- Wicks, M.; Wright, H.; Wentzel-Viljoen, E. Assessing the construct validity of nutrient profiling models for restricting the marketing of foods to children in South Africa. Eur. J. Clin. Nutr. 2020, 74, 1065–1072. [Google Scholar] [CrossRef] [PubMed]
- Dunford, E.; Huang, L.; Peters, S.; Crino, M.; Neal, B.; Ni Mhurchu, C. Evaluation of Alignment between the Health Claims Nutrient Profiling Scoring Criterion (NPSC) and the Health Star Rating (HSR) Nutrient Profiling Models. Nutrients 2018, 10, 1065. [Google Scholar] [CrossRef] [PubMed] [Green Version]
- World Health Organization Regional Office for Africa. Nutrient Profile Model for the WHO African Region: A Tool for Implementing WHO Recommendations on the Marketing of Foods and Non-Alcoholic Beverages to Childre; World Health Organization Regional Office for Africa: Brazzaville, Congo, 2019. [Google Scholar]
- Rayner, M.; Scarborough, P.; Stockley, L. Nutrient Profiles: Options for Definitions for Use in Relation to Food Promotion and Children’s Diets: Final Report; British Heart Foundation Health Promotions Research Group; University of Oxford: Oxford, UK, 2004. [Google Scholar]
- Scarborough, P.; Rayner, M.; Stockley, L. Developing nutrient profile models: A systematic approach. Publ. Health Nutr. 2007, 10, 330–336. [Google Scholar] [CrossRef] [PubMed] [Green Version]
- Joint FAO/WHO Food Standards Programme Codex Committee on Food Labelling. Proposed Draft Guidelines on Front-of-Pack Nutrition Labelling; Joint FAO/WHO Food Standards Programme Codex Committee on Food Labelling: Ottawa, Canada, 2019. [Google Scholar]
- Verhagen, H.; van den Berg, H. A simple visual model to compare existing nutrient profiling schemes. Food Nutr. Res. 2008, 52, 1649. [Google Scholar] [CrossRef] [PubMed]
- Statistics South Africa. South African Demographic and Health Survey (SADHS); Statistics South Africa: Pretoria, South Africa, 2017; ISBN 9780621454994.
- Lobstein, T.; Brinsden, H. Atlas of Childhood Obesity; World Obesity Federation: London, UK, 2019. [Google Scholar]
- Mchiza, Z.; Steyn, N.; Hill, J.; Kruger, A.; Schönfeldt, H.; Nel, J.; Wentzel-Viljoen, E. A Review of Dietary Surveys in the Adult South African Population from 2000 to 2015. Nutrients 2015, 7, 8227–8250. [Google Scholar] [CrossRef] [PubMed]
- Armstrong, M.E.G.; Lambert, M.I.; Lambert, E. V Secular trends in the prevalence of stunting, overweight and obesity among South African children (1994–2004). Eur. J. Clin. Nutr. 2011, 65, 835–840. [Google Scholar] [CrossRef] [Green Version]
- Oldewage-Theron, W.H.; Slabbert, T.J.C. Impact of food and nutrition interventions on poverty in an informal settlement in the Vaal Region of South Africa. Proc. Nutr. Soc. 2008, 67, 91–97. [Google Scholar] [CrossRef] [PubMed] [Green Version]
- Steyn, N.P.; Nel, J.H.; Casey, A. Secondary data analyses of dietary surveys undertaken in South Africa to determine usual food consumption of the population. Publ. Health Nutr. 2003, 6, 631–644. [Google Scholar] [CrossRef] [Green Version]
- Temple, N.J.; Steyn, N.P. The cost of a healthy diet: A South African perspective. Nutrition 2011, 27, 505–508. [Google Scholar] [CrossRef]
- Monteiro, C.A.; Cannon, G.; Levy, R.; Moubarac, J.-C.; Jaime, P.; Martins, A.P.; Canella, D.; Louzada, M.; Parra, D. NOVA. The star shines bright. World Nutr. 2016, 7, 28–38. [Google Scholar]
- Monteiro, C.A.; Cannon, G.; Levy, R.B.; Moubarac, J.-C.; Louzada, M.L.C.; Rauber, F.; Khandpur, N.; Cediel, G.; Neri, D.; Martinez-Steele, E.; et al. Ultra-processed foods: What they are and how to identify them. Publ. Health Nutr. 2019, 22, 936–941. [Google Scholar] [CrossRef]
- Correa, T.; Fierro, C.; Reyes, M.; Dillman Carpentier, F.R.; Taillie, L.S.; Corvalan, C.; Smith Taillie, L.; Corvalan, C. Responses to the Chilean law of food labeling and advertising: Exploring knowledge, perceptions and behaviors of mothers of young children. Int. J. Behav. Nutr. Phys. Act. 2019, 16, 1–10. [Google Scholar] [CrossRef] [PubMed]
- Mediano Stoltze, F.; Reyes, M.; Smith, T.L.; Correa, T.; Corvalán, C.; Carpentier, F.R.D. Prevalence of Child-Directed Marketing on Breakfast Cereal Packages before and after Chile’s Food Marketing Law: A Pre- and Post-Quantitative Content Analysis. Int. J. Environ. Res. Publ. Health 2019, 16, 4501. [Google Scholar] [CrossRef] [PubMed] [Green Version]
- Caro, J.C.; Valizadeh, P.; Correa, A.; Silva, A.; Ng, S.W. Combined fiscal policies to promote healthier diets: Effects on purchases and consumer welfare. PLoS ONE 2020, 15, e0226731. [Google Scholar] [CrossRef] [PubMed]
- Dillman Carpentier, F.R.; Correa, T.; Reyes, M.; Taillie, L.S. Evaluating the impact of Chile’s marketing regulation of unhealthy foods and beverages: Pre-school and adolescent children’s changes in exposure to food advertising on television. Publ. Health Nutr. 2020, 23, 747–755. [Google Scholar] [CrossRef]
- Taillie, L.S.; Reyes, M.; Colchero, M.A.; Popkin, B.; Corvalán, C. An evaluation of Chile’s Law of Food Labeling and Advertising on sugar-sweetened beverage purchases from 2015 to 2017: A before-and-after study. PLoS Med. 2020, 17, e1003015. [Google Scholar] [CrossRef]
- Ministerio de Salud del Perú Aprueban Manual de Advertencias. Ministry of Health: Lima, Peru, 2018; pp. 58–63. Available online: https://busquedas.elperuano.pe/download/url/aprueban-manual-de-advertencias-publicitarias-en-el-marco-de-decreto-supremo-n-012-2018-sa-1660606-1 (accessed on 14 July 2021).
- Ministry of Agriculture. Nutrition Labelling Regulation Israel: 7904; Ministry of Agriculture: Tel Aviv, Israel, 2017. Available online: https://www.health.gov.il/Subjects/FoodAndNutrition/Nutrition/Adequate_nutrition/Documents/THE%20PROTECTION%20OF%20PUBLIC%20HEALTH%20%28FOOD%29%20%28NUTRITIONAL%20LABELING%29%20REGULATIONS%2C%205778%20-%202017.pdf (accessed on 14 July 2021).
- Bernstein, J.T.; Franco-Arellano, B.; Schermel, A.; Labonté, M.-È.; L’Abbé, M.R. Healthfulness and nutritional composition of Canadian prepackaged foods with and without sugar claims. Appl. Physiol. Nutr. Metab. 2017, 42, 1217–1224. [Google Scholar] [CrossRef]
- Pan American Health Organization; WHO. Pan American Health Organisation Nutrient Profile Model; Pan American Health Organization: Washington, DC, USA, 2016; ISBN 9789275318737. [Google Scholar]
- World Health Organization. Draft Guiding Principles and Framework Manual for Front-of-Pack Labelling for Promoting Healthy Diet; WHO: Geneva, Switzerland, 2019. [Google Scholar]
- Corvalán, C.; Reyes, M.; Garmendia, M.L.; Uauy, R. Structural responses to the obesity and non-communicable diseases epidemic: Update on the Chilean law of food labelling and advertising. Obes. Rev. 2019, 20, 367–374. [Google Scholar] [CrossRef]
- Medical Research Council. Food Composition Tables for South Africa, 5th ed.; Medical Research Council: Cape Town, South Africa, 2017.
- Baker, P.; Machado, P.; Santos, T.; Sievert, K.; Backholer, K.; Hadjikakou, M.; Russell, C.; Huse, O.; Bell, C.; Scrinis, G.; et al. Ultra-processed foods and the nutrition transition: Global, regional and national trends, food systems transformations and political economy drivers. Obes. Rev. 2020, 21, 1–22. [Google Scholar] [CrossRef]
- Adams, J.; Hofman, K.; Moubarac, J.-C.; Thow, A.M. Public health response to ultra-processed food and drinks. BMJ 2020, 369, m2391. [Google Scholar] [CrossRef]
- Pillay-van Wyk, V.; Msemburi, W.; Laubscher, R.; Dorrington, R.E.; Groenewald, P.; Glass, T.; Nojilana, B.; Joubert, J.D.; Matzopoulos, R.; Prinsloo, M.; et al. Mortality trends and differentials in South Africa from 1997 to 2012: Second National Burden of Disease Study. Lancet Glob. Heal. 2016, 4, e642–e653. [Google Scholar] [CrossRef] [Green Version]
- National Department of Health. Regulations Relating to Foodstuffs for Infants and Young Children (R991/2012); National Department of Health: Pretoria, South Africa, 2012; pp. 3–32.
- Gillon-Keren, M.; Kaufman-Shriqui, V.; Goldsmith, R.; Safra, C.; Shai, I.; Fayman, G.; Berry, E.; Tirosh, A.; Dicker, D.; Froy, O.; et al. Development of Criteria for a Positive Front-of-Package Food Labeling: The Israeli Case. Nutrients 2020, 12, 1875. [Google Scholar] [CrossRef] [PubMed]
- Cordain, L.; Eaton, S.B.; Sebastian, A.; Mann, N.; Lindeberg, S.; Watkins, B.A.; O’Keefe, J.H.; Brand-Miller, J. Origins and evolution of the Western diet: Health implications for the 21st century. Am. J. Clin. Nutr. 2005, 81, 341–354. [Google Scholar] [CrossRef]
- Lustig, R.H.; Schmidt, L.A.; Brindis, C.D. The toxic truth about sugar. Nature 2012, 482, 27–29. [Google Scholar] [CrossRef] [PubMed]
- Norat, T.; Scoccianti, C.; Boutron-Ruault, M.-C.; Anderson, A.; Berrino, F.; Cecchini, M.; Espina, C.; Key, T.; Leitzmann, M.; Powers, H.; et al. European Code against Cancer 4th Edition: Diet and cancer. Cancer Epidemiol. 2015, 39, S56–S66. [Google Scholar] [CrossRef] [Green Version]
- Johnson, R.J.; Segal, M.S.; Sautin, Y.; Nakagawa, T.; Feig, D.I.; Kang, D.; Gersch, M.S.; Benner, S.; Sanchez-Lozada, L.G. Potential role of sugar (fructose) in the epidemic of hypertension, obesity and the metabolic syndrome, diabetes, kidney disease, and cardiovascular disease. Am. J. Clin. Nutr. 2007, 86, 899–906. [Google Scholar]
- Yeh, C.-J.; Chang, H.-Y.; Pan, W.-H. Time trend of obesity, the metabolic syndrome and related dietary pattern in Taiwan: From NAHSIT 1993-1996 to NAHSIT 2005-2008. Asia Pac. J. Clin. Nutr. 2011, 20, 292–300. [Google Scholar] [PubMed]
- World Health Organization. Diet, Nutrition and the Prevention of Chronic Diseases; WHO: Geneva, Switzerland, 2003. [Google Scholar]
- World Health Organization. Guideline: Sugars Intake for Adults and Children; WHO: Geneva, Switzerland, 2015. [Google Scholar]
- Louie, J.C.Y.; Moshtaghian, H.; Boylan, S.; Flood, V.M.; Rangan, A.M.; Barclay, A.W.; Brand-Miller, J.C.; Gill, T.P. A systematic methodology to estimate added sugar content of foods. Eur. J. Clin. Nutr. 2015, 69, 154–161. [Google Scholar] [CrossRef]
- Sánchez-Pimienta, T.G.; Batis, C.; Lutter, C.K.; Rivera, J.A. Sugar-Sweetened Beverages Are the Main Sources of Added Sugar Intake in the Mexican Population. J. Nutr. 2016, 146, 1888S–1896S. [Google Scholar] [CrossRef] [Green Version]
- Lobstein, T.; Davies, S. Defining and labelling “healthy” and “unhealthy” food. Publ. Health Nutr. 2009, 12, 331–340. [Google Scholar] [CrossRef] [Green Version]
- Tappy, L. Fructose-containing caloric sweeteners as a cause of obesity and metabolic disorders. J. Exp. Biol. 2018, 221, jeb164202. [Google Scholar] [CrossRef] [Green Version]
- Collin, L.J.; Judd, S.; Safford, M.; Vaccarino, V.; Welsh, J.A. Association of Sugary Beverage Consumption with Mortality Risk in US Adults. JAMA Netw. Open 2019, 2, e193121. [Google Scholar] [CrossRef] [PubMed]
- Gupta, P.; Shah, D.; Kumar, P.; Bedi, N.; Mittal, H.G.; Mishra, K.; Khalil, S.; Elizabeth, K.E.; Dalal, R.; Harish, R.; et al. Indian Academy of Pediatrics Guidelines on the Fast and Junk Foods, Sugar Sweetened Beverages, and Energy Drinks. Ind. Pediatr. 2019, 849–850. [Google Scholar] [CrossRef]
- World Health Organization. Global Strategy on Diet, Physical Activity and Health; WHO: Geneva, Switzerland, 2004. [Google Scholar]
- Dietary Guidelines Advisory Committee. Scientific Report of the 2020 Dietary Guidelines Advisory Committee: Advisory Report to the Secretary of Agriculture and the Secretary of Health and Human Services; Dietary Guidelines Advisory Committee: Washington, DC, USA, 2020.
- Kris-Etherton, P.M.; Krauss, R.M. Public health guidelines should recommend reducing saturated fat consumption as much as possible: YES. Am. J. Clin. Nutr. 2020, 112, 13–18. [Google Scholar] [CrossRef] [PubMed]
- Kris-Etherton, P.M.; Petersen, K.; Van Horn, L. Convincing evidence supports reducing saturated fat to decrease cardiovascular disease risk. BMJ Nutr. Prev. Heal. 2018, 1, 23–26. [Google Scholar] [CrossRef] [PubMed] [Green Version]
- Clifton, P.M.; Keogh, J.B. A systematic review of the effect of dietary saturated and polyunsaturated fat on heart disease. Nutr. Metab. Cardiovasc. Dis. 2017, 27, 1060–1080. [Google Scholar] [CrossRef] [PubMed]
- Forouhi, N.G.; Krauss, R.M.; Taubes, G.; Willett, W. Dietary fat and cardiometabolic health: Evidence, controversies, and consensus for guidance. BMJ 2018, 2139, k2139. [Google Scholar] [CrossRef] [Green Version]
- World Health Organization. Draft Guideline: Saturated Fatty Acid and Trans-Fatty Acid Intake for Adults and Children; World Health Organization: Geneva, Switzrland, 2018. [Google Scholar]
- Codex Alimentarius Guidelines on Nutrition Labelling. Cac/Gl 2-1985 2013, 53, 1689–1699. [CrossRef]
- World Health Organization. Guideline: Sodium Intake for Adults and Children; WHO: Geneva, Switzerland, 2012. [Google Scholar]
- Peters, S.; Dunford, E.; Ware, L.; Harris, T.; Walker, A.; Wicks, M.; van Zyl, T.; Swanepoel, B.; Charlton, K.; Woodward, M.; et al. The Sodium Content of Processed Foods in South Africa during the Introduction of Mandatory Sodium Limits. Nutrients 2017, 9, 404. [Google Scholar] [CrossRef]
- Camacho, S.; Ruppel, A. Is the calorie concept a real solution to the obesity epidemic? Glob. Health Action 2017, 10, 1289650. [Google Scholar] [CrossRef] [Green Version]
- Drewnowski, A.; Amanquah, D.; Gavin-Smith, B. Perspective: How to Develop Nutrient Profiling Models Intended for Global Use: A Manual. Adv. Nutr. 2021, 1–12. [Google Scholar] [CrossRef]
- Samaniego-Vaesken, M.d.L.; Partearroyo, T.; Cano, A.; Urrialde, R.; Varela-Moreiras, G. Novel database of declared low- and no-calorie sweeteners from foods and beverages available in Spain. J. Food Compos. Anal. 2019, 82, 103234. [Google Scholar] [CrossRef]
- Serra-Majem, L.; Raposo, A.; Aranceta-Bartrina, J.; Varela-Moreiras, G.; Logue, C.; Laviada, H.; Socolovsky, S.; Pérez-Rodrigo, C.; Aldrete-Velasco, J.; Meneses Sierra, E.; et al. Ibero–American Consensus on Low- and No-Calorie Sweeteners: Safety, Nutritional Aspects and Benefits in Food and Beverages. Nutrients 2018, 10, 818. [Google Scholar] [CrossRef] [PubMed] [Green Version]
- Suez, J.; Korem, T.; Zeevi, D.; Zilberman-Schapira, G.; Thaiss, C.A.; Maza, O.; Israeli, D.; Zmora, N.; Gilad, S.; Weinberger, A.; et al. Artificial sweeteners induce glucose intolerance by altering the gut microbiota. Nature 2014, 514, 181–186. [Google Scholar] [CrossRef] [PubMed]
- Dunford, E.K.; Taillie, L.S.; Miles, D.R.; Eyles, H.; Tolentino-Mayo, L.; Ng, S.W. Non-nutritive sweeteners in the packaged food supply—an assessment across 4 countries. Nutrients 2018, 10, 257. [Google Scholar] [CrossRef] [Green Version]
- Vyth, E.L.; Steenhuis, I.H.M.; Roodenburg, A.J.C.; Brug, J.; Seidell, J.C. Front-of-pack nutrition label stimulates healthier product development: A quantitative analysis. Int. J. Behav. Nutr. Phys. Act. 2010, 7, 65. [Google Scholar] [CrossRef] [Green Version]
- Reyes, M.; Smith Taillie, L.; Popkin, B.; Kanter, R.; Vandevijvere, S.; Corvalán, C. Changes in the amount of nutrient of packaged foods and beverages after the initial implementation of the Chilean Law of Food Labelling and Advertising: A nonexperimental prospective study. PLoS Med. 2020, 17, e1003220. [Google Scholar] [CrossRef]
- Durán Agüero, S.; Angarita Dávila, L.; Escobar Contreras, M.C.; Rojas Gómez, D.; de Assis Costa, J. Noncaloric Sweeteners in Children: A Controversial Theme. Biomed Res. Int. 2018, 2018, 1–7. [Google Scholar] [CrossRef]
- Brown, R.J.; de Banate, M.A.; Rother, K.I. Artificial Sweeteners: A systematic review of metabolic effects in youth. Int. J. Pediatr. Obes. 2010, 5, 305–312. [Google Scholar] [CrossRef] [Green Version]
- Toews, I.; Lohner, S.; Küllenberg de Gaudry, D.; Sommer, H.; Meerpohl, J.J. Association between intake of non-sugar sweeteners and health outcomes: Systematic review and meta-analyses of randomised and non-randomised controlled trials and observational studies. BMJ 2019, 364, k4718. [Google Scholar] [CrossRef] [Green Version]
- Sardarodiyan, M.; Hakimzadeh, V. Artificial Sweeteners. Int. J. Pharm. Tech. Res. 2016, 9, 357–363. [Google Scholar]
- United States Department of Agriculture; Global Agricultural Information Network. Food and Agricultural Import Regulations and Standards: Saudi Arabia; Office of Agricultural Affairs of the USDA/Foreign Agricultural Service: Riyadh, Saudi Arabia, 2020.
- Sambra, V.; López-Arana, S.; Cáceres, P.; Abrigo, K.; Collinao, J.; Espinoza, A.; Valenzuela, S.; Carvajal, B.; Prado, G.; Peralta, R.; et al. Overuse of Non-caloric Sweeteners in Foods and Beverages in Chile: A Threat to Consumers’ Free Choice? Front. Nutr. 2020, 7, 1–8. [Google Scholar] [CrossRef]
- Essman, M.; Taillie, L.S.; Frank, T.; Ng, S.W.; Popkin, B.M.; Swart, E.C. Taxed and untaxed beverage intake by South African young adults after a national sugar-sweetened beverage tax: A before-and-after study. PLoS Med. 2021, 18, e1003574. [Google Scholar] [CrossRef] [PubMed]
- Stacey, N.; Mudara, C.; Ng, S.W.; van Walbeek, C.; Hofman, K.; Edoka, I. Sugar-based beverage taxes and beverage prices: Evidence from South Africa’s Health Promotion Levy. Soc. Sci. Med. 2019, 238, 112465. [Google Scholar] [CrossRef] [PubMed]
- Appleton, K.M.; Tuorila, H.; Bertenshaw, E.J.; de Graaf, C.; Mela, D.J. Sweet taste exposure and the subsequent acceptance and preference for sweet taste in the diet: Systematic review of the published literature. Am. J. Clin. Nutr. 2018, 107, 405–419. [Google Scholar] [CrossRef] [PubMed]
- Swithers, S.E. Artificial sweeteners are not the answer to childhood obesity. Appetite 2015, 93, 85–90. [Google Scholar] [CrossRef] [PubMed]
- Archibald, A.; Dolinsky, V.; Azad, M. Early-Life Exposure to Non-Nutritive Sweeteners and the Developmental Origins of Childhood Obesity: Global Evidence from Human and Rodent Studies. Nutrients 2018, 10, 194. [Google Scholar] [CrossRef] [Green Version]
- World Health Organization Regional Office for Europe. WHO Regional Office for Europe Nutrient Profile Model; WHO: Copenhagen, Denmark, 2015. [Google Scholar]
- Reyes, M.; Garmendia, M.L.; Olivares, S.; Aqueveque, C.; Zacarías, I.; Corvalán, C. Development of the Chilean front-of-package food warning label. BMC Publ. Health 2019, 19, 906. [Google Scholar] [CrossRef] [Green Version]
- Ministerio de Salud de Uruguay Manual. Para la Aplicación del Decreto No 272/018 Sobre Rotulado Frontal de Alimentos. Ministry of Health: Montevideo, Uruguay, 2018. Available online: https://www.gub.uy/ministerio-salud-publica/sites/ministerio-salud-publica/files/documentos/publicaciones/MSP_MANUAL_APLICACION_ROTULADO_FRONTAL_ALIMENTOS_0.pdf (accessed on 14 July 2021).
- Secretaria de Economia. Mexico Regulation NOM-051; Ministry of Economy: Mexico City, Mexico, 2020; Volume 1, pp. 4–40. Available online: https://www.dof.gob.mx/2020/SEECO/NOM_051.pdf (accessed on 14 July 2021).
- National Agency of Sanitary Surveillance (ANVISA); Ministério da Saúde. Resolution of the Collegiate Board 429 and Normative Instruction 75; ANVISA: Sau Paulo, Brazil, 2020. Available online: https://www.in.gov.br/en/web/dou/-/resolucao-de-diretoria-colegiada-rdc-n-429-de-8-de-outubro-de-2020-282070599 (accessed on 14 July 2021).
- Popkin, B.M.; Barquera, S.; Corvalan, C.; Hofman, K.J.; Monteiro, C.; Ng, S.W.; Swart, E.C.; Taillie, L.S. Towards unified and impactful policies to reduce ultra-processed food consumption and promote healthier eating. Lancet Diabetes Endocrinol. 2021, 8587, 1–10. [Google Scholar] [CrossRef]
- Dorlach, T.; Mertenskötter, P. Interpreters of International Economic Law: Corporations and Bureaucrats in Contest over Chile’s Nutrition Label. Law Soc. Rev. 2020, 54, 571–606. [Google Scholar] [CrossRef]
- Thow, A.M.; Jones, A.; Hawkes, C.; Ali, I.; Labonté, R. Nutrition labelling is a trade policy issue: Lessons from an analysis of specific trade concerns at the World Trade Organization. Health Promot. Int. 2017, 33, daw109. [Google Scholar] [CrossRef] [Green Version]
- Garton, K.; Thow, A.M.; Swinburn, B. International Trade and Investment Agreements as Barriers to Food Environment Regulation for Public Health Nutrition: A Realist Review. Int. J. Heal. Policy Manag. 2020, 1–21. [Google Scholar] [CrossRef]
- Thow, A.M.; Gleeson, D. Advancing Public Health on the Changing Global Trade and Investment Agenda Comment on “The Trans-Pacific Partnership: Is It Everything We Feared for Health?”. Int. J. Health Policy Manag. 2017, 6, 295–298. [Google Scholar] [CrossRef]
- Thow, A.M.; Reeve, E.; Naseri, T.; Martyn, T.; Bollars, C. Food supply, nutrition and trade policy: Reversal of an import ban on turkey tails. Bull. World Health Organ. 2017, 95, 723–725. [Google Scholar] [CrossRef] [PubMed]
- National Department of Health. Regulations Relating to the use of Sweeteners in Foodstufss (R733/2012); National Department of Health: Pretoria, South Africa, 2012; pp. 3–6.
- Tong, T.; Rangan, A.; Gemming, L. Evaluating the Nutritional Content of Children’s Breakfast Cereals in Australia. Children 2018, 5, 84. [Google Scholar] [CrossRef] [PubMed] [Green Version]
- Koen, N.; Wentzel-Viljoen, E.; Blaauw, R. The development of a single health-endorsement logo for South Africa. Publ. Health Nutr. 2018, 21, 1444–1454. [Google Scholar] [CrossRef] [PubMed] [Green Version]
- Townsend, M.S. Where is the science? What will it take to show that nutrient profiling systems work? Am. J. Clin. Nutr. 2010, 91, 1109S–1115S. [Google Scholar] [CrossRef] [Green Version]
- Cooper, S.L.; Pelly, F.E.; Lowe, J.B. Construct and criterion-related validation of nutrient profiling models: A systematic review of the literature. Appetite 2016, 100, 26–40. [Google Scholar] [CrossRef]


| Highlighted Food Categories | SA HNC Baseline (Only ‘Nutrients to Limit’ | CWO 2019 (Only ‘Nutrients to Limit’) | SA HNC (Nutrients to Limit and Encourage) | |
|---|---|---|---|---|
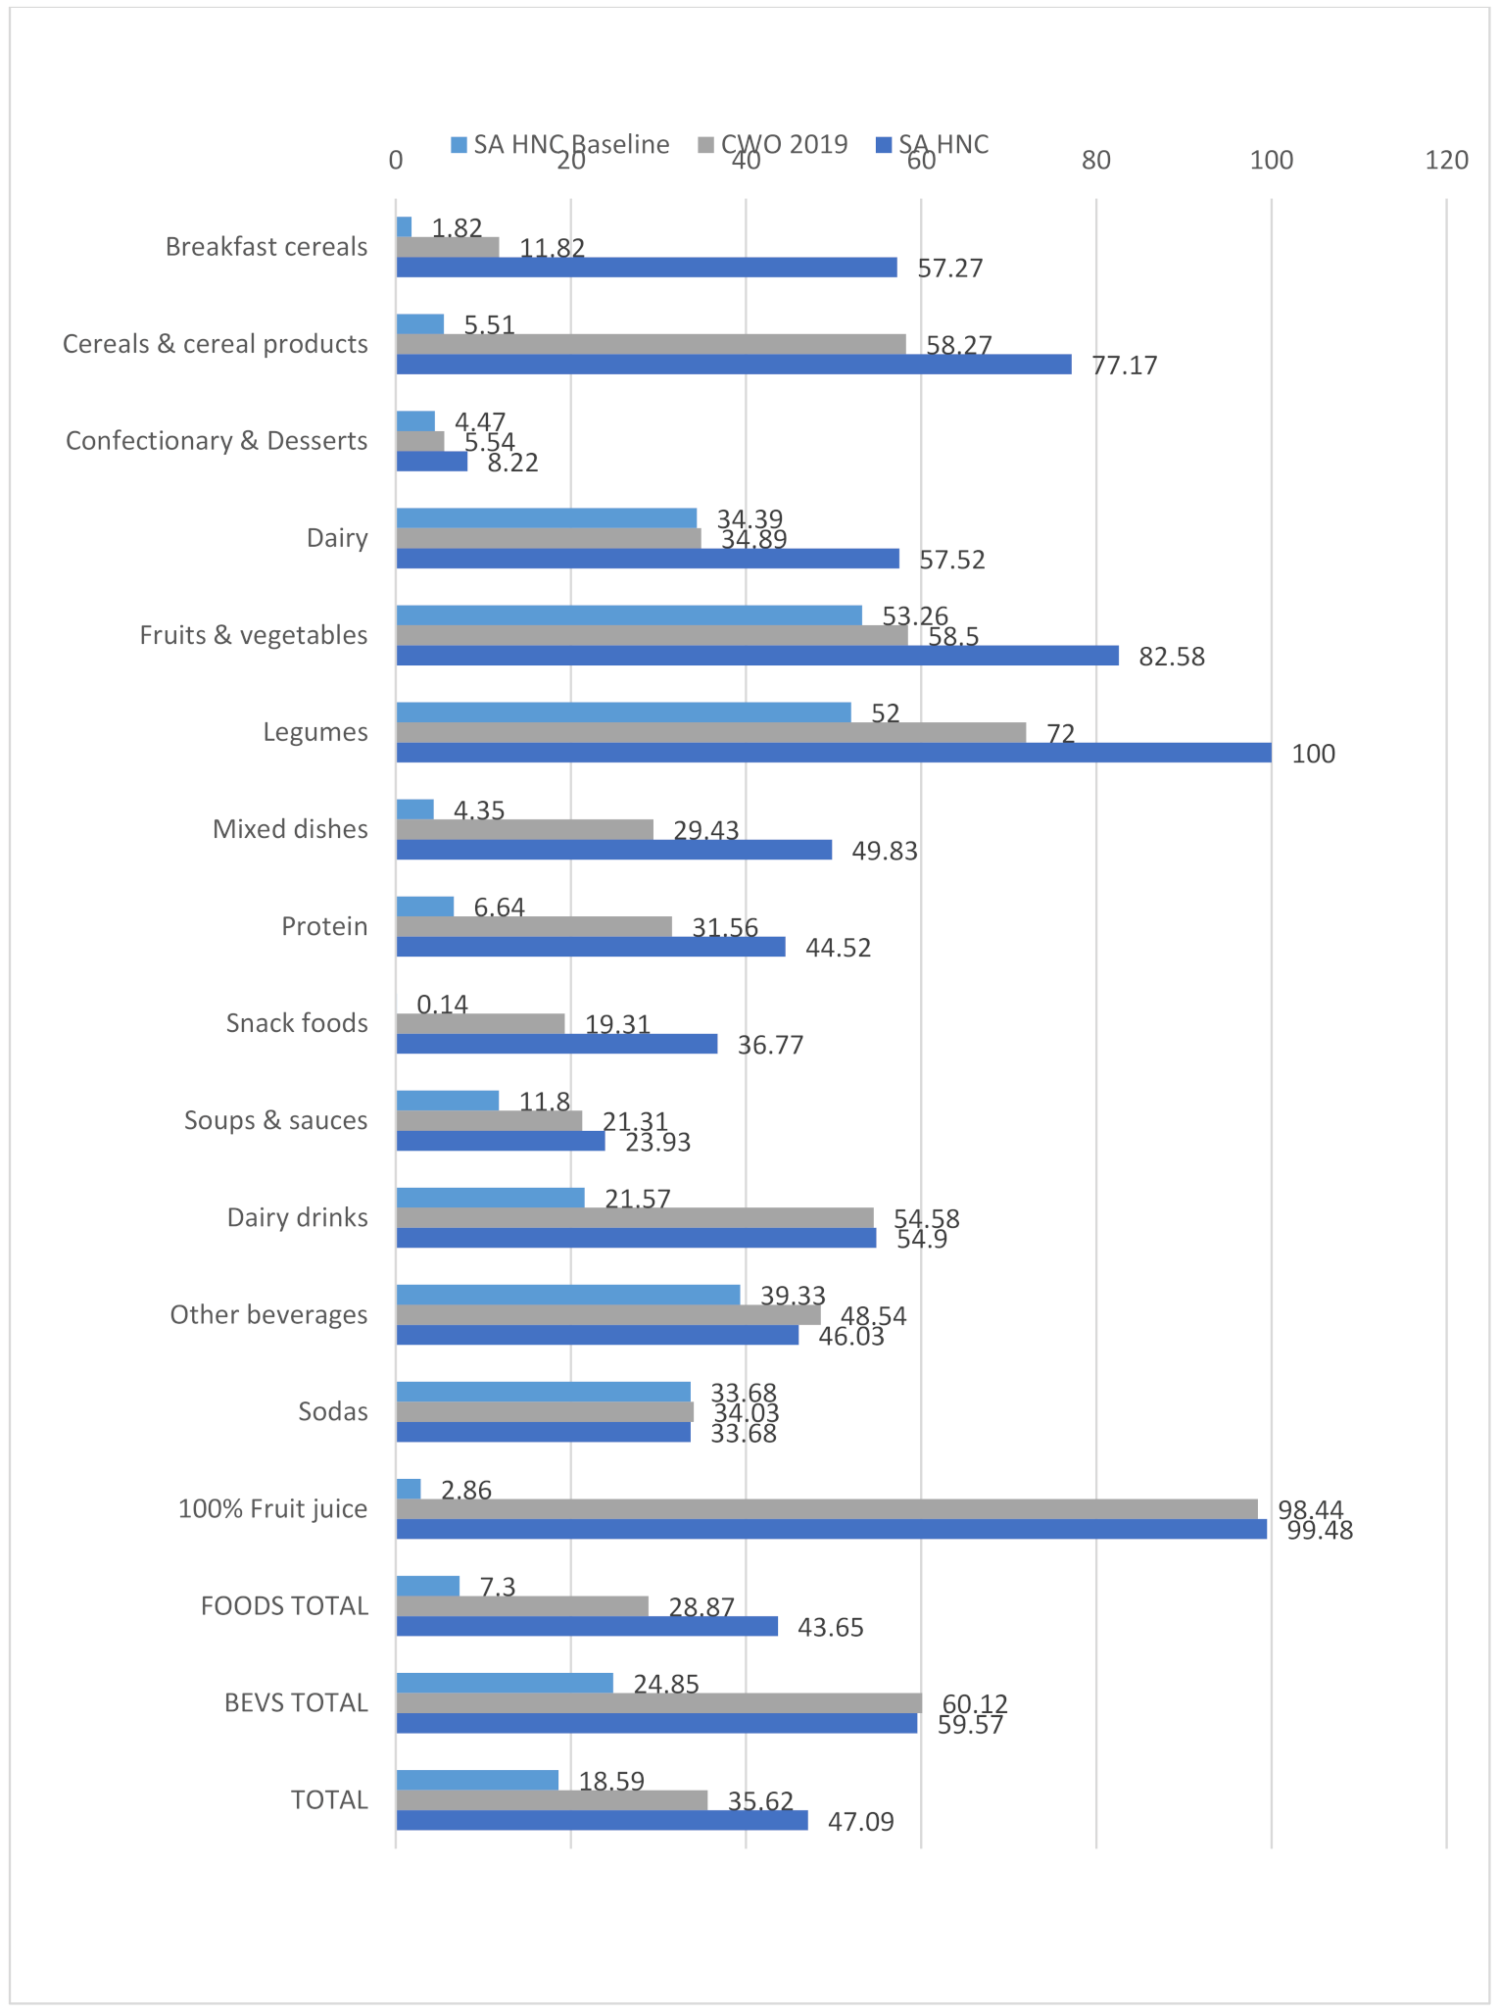
| Categories where the addition of ‘nutrients to encourage’ may potentially be beneficial | Dairy Drinks | 21.57% compliant with criteria | 54.6% compliant with criteria | 54.9% compliant with criteria |
| In this category one would want to mitigate the effects of lactose, a carbohydrate naturally present in milk, which contributes to the total sugar score. Here the addition of ‘nutrients to encourage’ potentially assists; although given the differences in algorithms, the CWO criteria (which only includes ‘nutrients to limit’) has a similar compliance level. | ||||
| Categories where the addition of ‘nutrients to encourage’ allows for a more lenient score | Breakfast cereals | 1.8% compliant with criteria | 11.8% compliant with criteria | 57.3% compliant with criteria |
| Dairy (food) | 34.39% | 34.89% | 57.52% | |
| Fruits and vegetables | 53.26 | 58.5% | 82.58% | |
| Legumes | 52% | 72% | 100% | |
| These categories highlight where the more lenient score of the SA HNC NPM causes contestation due to the addition of protein, fiber, FVNL (fruit, vegetables, nuts and legumes) points. In all of these categories the SA HNC NPM scored at least 23% higher than for the CWO 2019. Although these foods may include healthy components, the impact of undesirable ingredients cannot be negated by ‘nutrients to encourage’. Most of the fruits, vegetables and legumes that are restricted by the CWO 2019 contain high levels of sugar or sodium. The significant change in compliance due to the addition of ‘nutrients to encourage’ is seen in the difference in scores between the baseline and final SA HNC NPM. | ||||
| Categories that are strict regardless of nutrients to encourage or limit | Confectionery & Dessert | 4.47% | 5.54% | 8.22% |
| Soda | 33.68% | 34.03% | 33.68% | |
| These categories contain a large number of unhealthy products that are linked to poor health outcomes. Even when ‘nutrients to encourage’ are added, they score poorly across different NPMs. The addition of ‘nutrients to encourage’ does not result in a more lenient score. | ||||
| Energy (kJ) | Total Sugar (g) | Free Sugar (g) | Total Fat (g) | Saturated Fat (g) | Trans Fat (g) | Sodium (mg) | Contains NSS n (%) | |
|---|---|---|---|---|---|---|---|---|
| Breakfast cereals n = 110 | 1588.2 | 17.2 | 16.3 | 8.9 | 2.9 | 0.03 | 210.6 | 0 (0) |
| Cereals & cereal products n = 254 | 989.9 | 3.1 | 3.2 | 6.1 | 2.4 | 0.11 | 338.5 | 8 (3.2) |
| Confectionary & dessert n = 1119 | 1559.8 | 38.4 | 35.1 | 14.0 | 7.7 | 0.12 | 142.5 | 143 (12.8) |
| Dairy n = 791 | 766.5 | 6.4 | 3.5 | 12.6 | 8.8 | 0.33 | 322.1 | 70 (8.9) |
| Fruits & vegetables n = 196 | 677.4 | 29.8 | 15.2 | 2.1 | 1.2 | 0.02 | 41.9 | 0 (0) |
| Vegetables n = 510 | 315.9 | 3.3 | 3.3 | 3.6 | 0.7 | 0.03 | 392.6 | 5 (1.0) |
| Legumes n = 100 | 342.7 | 2.1 | 2.1 | 0.8 | 0.2 | 0.03 | 290.3 | 0 (0) |
| Mixed dishes n = 299 | 813.0 | 3.3 | 3.2 | 9.3 | 4.0 | 0.17 | 429.2 | 10 (3.3) |
| Protein n = 602 | 787.4 | 1.4 | 1.4 | 9.9 | 3.5 | 0.13 | 826.0 | 18 (3.0) |
| Snack foods n = 699 | 2059.4 | 6.8 | 6.1 | 27.9 | 7.7 | 0.06 | 476.8 | 58 (8.3) |
| Soups & sauces n = 610 | 676.1 | 9.7 | 9.6 | 11.2 | 2.2 | 0.07 | 746.3 | 35 (5.9) |
| Food total n = 5290 | 1072.8 | 13.4 | 11.6 | 12.4 | 5.1 | 0.12 | 411.2 | 347 (6.6) |
| Dairy drinks n = 306 | 255.1 | 6.0 | 4.9 | 1.8 | 1.1 | 0.07 | 43.3 | 58 (19.0) |
| Other beverages n = 478 | 116.7 | 5.8 | 4.0 | 0.1 | 0.08 | 0.004 | 13.4 | 213 (44.6) |
| Sodas n = 288 | 125.1 | 6.9 | 6.9 | 0.04 | 0.02 | 0.01 | 18.6 | 160 (55.6) |
| 100% fruit juice n = 385 | 190.0 | 10.4 | 6.0 | 0.05 | 0.02 | 0.0 | 9.5 | 1 (0.3) |
| Beverage total n = 1457 | 160.7 | 7.2 | 5.1 | 0.45 | 0.3 | 0.01 | 19.7 | 432 (29.6) |
| Food & beverage total n = 6747 | 875.7 | 12.1 | 10.7 | 9.8 | 4.1 | 0.09 | 326.6 | 779 (11.5) |
| Number Regulated (Overall) | Number Regulated for Sugar | Number Regulated for Sodium | Number Regulated for Saturated Fat | Number Regulated for Energy | Number Regulated for Only Energy | |
|---|---|---|---|---|---|---|
| Breakfast cereals n = 110 | 97 | 74 | 16 | 31 | 94 | 11 |
| Cereals & cereal products n = 254 | 106 | 1 | 71 | 34 | 47 | 10 |
| Confectionary & dessert n = 1119 | 1057 | 997 | 83 | 600 | 912 | 12 |
| Dairy n = 791 | 515 | 262 | 246 | 56 | 74 | 3 |
| Fruits & vegetables n = 706 | 293 | 129 | 163 | 13 | 29 | 8 |
| Legumes n = 100 | 28 | 0 | 28 | 0 | 3 | 0 |
| Mixed dishes n = 299 | 211 | 14 | 177 | 113 | 36 | 3 |
| Protein n = 602 | 412 | 6 | 390 | 88 | 88 | 3 |
| Snack foods n = 699 | 564 | 95 | 388 | 394 | 552 | 35 |
| Soups & sauces n = 610 | 480 | 206 | 416 | 106 | 244 | 12 |
| Food total n = 5290 | 3763 | 1784 | 1978 | 1435 | 2079 | 97 |
| Dairy drinks n = 306 | 139 | 135 | 4 | 0 | 39 | 1 |
| Other beverages n = 478 | 246 | 243 | 1 | 0 | 3 | 2 |
| Sodas n = 288 | 190 | 190 | 0 | 0 | 2 | 0 |
| 100% juice n = 385 | 6 | 3 | 3 | 0 | 0 | 0 |
| Beverage total n = 1457 | 581 | 571 | 8 | 0 | 44 | 3 |
| Food & beverage total n = 6747 | 4344 | 2355 | 1986 | 1435 | 2123 | 100 |
| Pros | Cons | |
|---|---|---|
| Per 100 g/100 mL | Simple to conceptualize and easy to compare foods Used on nutrition information panels on SA packaged foods | Certain foods are eaten in very small quantities (e.g., oil) while others are consumed in large quantities (e.g., beverages) |
| Per 100 kJ/% total energy | Allows for food consumed in smaller quantities to be put into context | Difficult to make sense of individual food items that do not represent total energy intake for the day |
| Per serving | Recognizes that portion sizes of different food types vary significantly, and if eaten in large quantities, will contribute more to nutritional intake than smaller amounts | Serving sizes are determined by the food producer and as a result vary significantly, even within a food category Easy to manipulate serving sizes to appear ‘healthier’, but these are not representative of the amount usually consumed |
| Solid Food (g) Cut-Points | Liquids (mL) Cut-Points | ||
|---|---|---|---|
| Sodium mg/100 g | 400 mg | Sodium mg/100 mL | 100 mg |
| Total sugar g/100 g | 10 g | Total sugar g/100 mL | 5 g |
| Saturated fat g/100 g | 4 g | Saturated fat g/100 mL | 3 g |
| Non-sugar sweetener | Contains any | Non-sugar sweetener | Contains any |
Publisher’s Note: MDPI stays neutral with regard to jurisdictional claims in published maps and institutional affiliations. |
© 2021 by the authors. Licensee MDPI, Basel, Switzerland. This article is an open access article distributed under the terms and conditions of the Creative Commons Attribution (CC BY) license (https://creativecommons.org/licenses/by/4.0/).
Share and Cite
Frank, T.; Thow, A.-M.; Ng, S.W.; Ostrowski, J.; Bopape, M.; Swart, E.C. A Fit-for-Purpose Nutrient Profiling Model to Underpin Food and Nutrition Policies in South Africa. Nutrients 2021, 13, 2584. https://doi.org/10.3390/nu13082584
Frank T, Thow A-M, Ng SW, Ostrowski J, Bopape M, Swart EC. A Fit-for-Purpose Nutrient Profiling Model to Underpin Food and Nutrition Policies in South Africa. Nutrients. 2021; 13(8):2584. https://doi.org/10.3390/nu13082584
Chicago/Turabian StyleFrank, Tamryn, Anne-Marie Thow, Shu Wen Ng, Jessica Ostrowski, Makoma Bopape, and Elizabeth C. Swart. 2021. "A Fit-for-Purpose Nutrient Profiling Model to Underpin Food and Nutrition Policies in South Africa" Nutrients 13, no. 8: 2584. https://doi.org/10.3390/nu13082584
APA StyleFrank, T., Thow, A.-M., Ng, S. W., Ostrowski, J., Bopape, M., & Swart, E. C. (2021). A Fit-for-Purpose Nutrient Profiling Model to Underpin Food and Nutrition Policies in South Africa. Nutrients, 13(8), 2584. https://doi.org/10.3390/nu13082584