
Nutritional Significance of Fruit and Fruit Products in the Average Polish Diet


Abstract
1. Introduction
2. Materials and Methods
2.1. Study Description
- Supply of energy, macronutrients, and dietary fiber.
- Supply of minerals i.e., calcium, phosphorus, sodium, potassium, iron, magnesium, zinc, and copper.
- Supply of vitamins, i.e., thiamine, riboflavin, niacin, folate, vitamins: B6, C, A, and E.
- Supply of energy and nutrients according to household characteristics.
2.2. Data Collection and Analysis
2.3. Food Grouping
- (1)
- citrus fruits—lemons, oranges, mandarins, grapefruits, pineapples;
- (2)
- bananas;
- (3)
- apples;
- (4)
- berries—strawberries, raspberries, blueberries, cranberries, white-, red- and blackcurrants, blackberries, gooseberries, wild strawberries;
- (5)
- stone fruits—plums, cherries, sour cherries, apricots, peaches, nectarines;
- (6)
- other fruits—for example, mangoes, kiwis, grapes, figs, dactyls, papayas;
- (7)
- frozen fruits—all single types and mixed;
- (8)
- dried fruits and nuts—all kinds of dried fruit, nuts, including salted and roasted nuts, almonds, edible seeds (e.g., poppy seeds, pumpkin seeds, sunflower seeds);
- (9)
- fruit products—pasteurized fruit, canned fruit, pickled fruit, fruit salads.
3. Results
3.1. Supply of Energy, Macronutrients, and Dietary Fiber
3.2. Supply of Minerals
3.3. Supply of Vitamins
3.4. Supply of Energy and Nutrients According to Household Characteristics
4. Discussion
4.1. Energy, Free Sugars, and Dietary Fiber
4.2. Minerals and Vitamins
4.3. Fruit and Fruit Products in the Polish Diet and Public Health Issues
4.4. Strengths and Limitations of Our Study
5. Conclusions
Author Contributions
Funding
Institutional Review Board Statement
Informed Consent Statement
Data Availability Statement
Acknowledgments
Conflicts of Interest
References
- Fardet, A.; Richonnet, C.; Mazur, A. Association between consumption of fruit or processed fruit and chronic diseases and their risk factors: A systematic review of meta-analyses. Nutr. Rev. 2019, 77, 376–387. [Google Scholar] [CrossRef]
- He, F.J.; Nowson, C.A.; Lucas, M.; MacGregor, G.A. Increased consumption of fruit and vegetables is related to a reduced risk of coronary heart disease: Meta-analysis of cohort studies. J. Hum. Hypertens. 2007, 21, 717–728. [Google Scholar] [CrossRef] [PubMed]
- Aune, D.; Giovannucci, E.; Boffetta, P.; Fadnes, L.T.; Keum, N.N.; Norat, T.; Greenwood, D.C.; Riboli, E.; Vatten, L.J.; Tonstad, S. Fruit and vegetable intake and the risk of cardiovascular disease, total cancer and all-cause mortality-A systematic review and dose-response meta-analysis of prospective studies. Int. J. Epidemiol. 2017, 46, 1029–1056. [Google Scholar] [CrossRef]
- Li, B.; Li, F.; Wang, L.; Zhang, D. Fruit and Vegetables Consumption and Risk of Hypertension: A Meta-Analysis. J. Clin. Hypertens. 2016, 18, 468–476. [Google Scholar] [CrossRef]
- Mamluk, L.; O’Doherty, M.G.; Orfanos, P.; Saitakis, G.; Woodside, J.V.; Liao, L.M.; Sinha, R.; Boffetta, P.; Trichopoulou, A.; Kee, F. Fruit and vegetable intake and risk of incident of type 2 diabetes: Results from the consortium on health and ageing network of cohorts in Europe and the United States (CHANCES). Eur. J. Clin. Nutr. 2017, 71, 83–91. [Google Scholar] [CrossRef]
- Wang, T.; Cai, H.; Sasazuki, S.; Tsugane, S.; Zheng, W.; Rin Cho, E.; Ha Jee, S.; Michel, A.; Pawlita, M.; Xiang, Y.-B.; et al. Fruit and Vegetable Consumption, Helicobacter pylori Antibodies, and Gastric Cancer Risk: A Pooled Analysis of Prospective Studies in China, Japan and Korea. Int. J. Cancer 2017, 140, 591–599. [Google Scholar] [CrossRef]
- Koushik, A.; Hunter, D.J.; Spiegelman, D.; Beeson, W.L.; Van Den Brandt, P.A.; Buring, J.E.; Calle, E.E.; Cho, E.; Fraser, G.E.; Freudenheim, J.L.; et al. Fruits, vegetables, and colon cancer risk in a pooled analysis of 14 cohort studies. J. Natl. Cancer Inst. 2007, 99, 1471–1483. [Google Scholar] [CrossRef]
- Vieira, A.R.; Abar, L.; Vingeliene, S.; Chan, D.S.M.; Aune, D.; Navarro-Rosenblatt, D.; Stevens, C.; Greenwood, D.; Norat, T. Fruits, vegetables and lung cancer risk: A systematic review and meta-analysis. Ann. Oncol. 2016, 27, 81–96. [Google Scholar] [CrossRef] [PubMed]
- Hosseini, B.; Berthon, B.S.; Wark, P.; Wood, L.G. Effects of fruit and vegetable consumption on risk of asthma, wheezing and immune responses: A systematic review and meta-analysis. Nutrients 2017, 9, 341. [Google Scholar] [CrossRef] [PubMed]
- Schwingshackl, L.; Hoffmann, G.; Kalle-Uhlmann, T.; Arregui, M.; Buijsse, B.; Boeing, H. Fruit and vegetable consumption and changes in anthropometric variables in adult populations: A systematic review and meta-analysis of prospective cohort studies. PLoS ONE 2015, 10, e0140846. [Google Scholar] [CrossRef] [PubMed]
- Jiang, X.; Huang, J.; Song, D.; Deng, R.; Wei, J.; Zhang, Z. Increased consumption of fruit and vegetables is related to a reduced risk of cognitive impairment and dementia: Meta-analysis. Front. Aging Neurosci. 2017, 9, 18. [Google Scholar] [CrossRef]
- Głąbska, D.; Guzek, D.; Groele, B.; Gutkowska, K. Fruit and vegetable intake and mental health in adults: A systematic review. Nutrients 2020, 12, 115. [Google Scholar] [CrossRef]
- Liu, X.; Yan, Y.; Li, F.; Zhang, D. Fruit and vegetable consumption and the risk of depression: A meta-analysis. Nutrition 2016, 32, 296–302. [Google Scholar] [CrossRef] [PubMed]
- Burlingame, B.; Dernini, S. Sustainable Diets and Biodiversity Directions and Solutions for Policy, Research and Action; Burlingame, B., Dernini, S., Eds.; Nutrition and Consumer Protection Division FAO: Rome, Italy, 2012; ISBN 9789251072882. [Google Scholar]
- WHO. Promoting Fruit and Vegetable Consumption around the World. Available online: https://www.who.int/dietphysicalactivity/fruit/en/ (accessed on 26 April 2021).
- Eat Well–NHS. Available online: https://www.nhs.uk/live-well/eat-well/ (accessed on 21 January 2021).
- Vegetables. MyPlate. Available online: https://www.myplate.gov/eat-healthy/vegetables (accessed on 28 April 2021).
- Willett, W.; Rockström, J.; Loken, B.; Springmann, M.; Lang, T.; Vermeulen, S.; Garnett, T.; Tilman, D.; DeClerck, F.; Wood, A.; et al. Food in the Anthropocene: The healthy diets from sustainable food systems. Summ. Rep. EAT-Lancet Comm. 2019, 393, 447–492. [Google Scholar]
- Fruits and Vegetables Crucial for Healthy Lives, Sustainable World: Guterre. UN News. Available online: https://news.un.org/en/story/2020/12/1080492 (accessed on 28 April 2021).
- Dreher, M.L. Whole fruits and fruit fiber emerging health effects. Nutrients 2018, 10, 1833. [Google Scholar] [CrossRef]
- IARC. IARC Handbooks of Cancer Prevention. Fruit and Vagetables; IARC: Lyon, France, 2003; ISBN 978-92-832-3008-3. [Google Scholar]
- Aune, D.; Keum, N.N.; Giovannucci, E.; Fadnes, L.T.; Boffetta, P.; Greenwood, D.C.; Tonstad, S.; Vatten, L.J.; Riboli, E.; Norat, T. Nut consumption and risk of cardiovascular disease, total cancer, all-cause and cause-specific mortality: A systematic review and dose-response meta-analysis of prospective studies. BMC Med. 2016, 14, 207. [Google Scholar] [CrossRef]
- Gawęcki, J.; Hryniewiecki, L.; Berger, S. Human Nutrition; PWN: Warsaw, Poland, 2008; ISBN 978-83-01-13947-6/978-83-01-13954-4. [Google Scholar]
- FAO—News Article: FAO Launches the UN’s International Year of Fruits and Vegetables 2021. Available online: http://www.fao.org/news/story/en/item/1364762/icode/ (accessed on 28 April 2021).
- Barrett, D.M.; Lloyd, B. Advanced preservation methods and nutrient retention in fruits and vegetables. J. Sci. Food Agric. 2012, 92, 7–22. [Google Scholar] [CrossRef] [PubMed]
- Vincente, A.R.; Manganaris, G.A.; Ortiz, C.M.; Sozzi, G.O.; Crisosto, C.H. Nutritional Quality of Fruits and Vegetables. In Postharvest Handling: A Systems Approach; Elsevier Inc.: Amsterdam, The Netherlands, 2014; pp. 69–122. ISBN 9780124081376. [Google Scholar]
- Cardoso, P.C.; Tomazini, A.P.B.; Stringheta, P.C.; Ribeiro, S.M.R.; Pinheiro-Sant’Ana, H.M. Vitamin C and carotenoids in organic and conventional fruits grown in Brazil. Food Chem. 2011, 126, 411–416. [Google Scholar] [CrossRef]
- Wolfe, K.L.; Kang, X.; He, X.; Dong, M.; Zhang, Q.; Liu, R.H. Cellular antioxidant activity of common fruits. J. Agric. Food Chem. 2008, 56, 8418–8426. [Google Scholar] [CrossRef]
- Dhalaria, R.; Verma, R.; Kumar, D.; Puri, S.; Tapwal, A.; Kumar, V.; Nepovimova, E.; Kuca, K. Bioactive Compounds of Edible Fruits with Their Anti-Aging Properties: A Comprehensive Review to Prolong Human Life. Antioxidants 2020, 9, 1123. [Google Scholar] [CrossRef]
- McGartland, C.P.; Robson, P.J.; Murray, L.J.; Cran, G.W.; Savage, M.J.; Watkins, D.C.; Rooney, M.M.; Boreham, C.A. Fruit and vegetable consumption and bone mineral density: The Northern Ireland Young Hearts Project. Am. J. Clin. Nutr. 2004, 80, 1019–1023. [Google Scholar] [CrossRef]
- Prynne, C.J.; Mishra, G.D.; O’Connell, M.A.; Muniz, G.; Laskey, M.A.; Yan, L.; Prentice, A.; Ginty, F. Fruit and vegetable intakes and bone mineral status: A cross-sectional study in 5 age and sex cohorts. Am. J. Clin. Nutr. 2006, 83, 1420–1428. [Google Scholar] [CrossRef]
- Laskowski, W.; Górska-Warsewicz, H.; Kulykovets, O. Meat, Meat Products and Seafood as Sources of Energy and Nutrients in the Average Polish Diet. Nutrients 2018, 10, 1412. [Google Scholar] [CrossRef]
- Laskowski, W.; Górska-Warsewicz, H.; Rejman, K. How Important are Cereals and Cereal Products in the Average Polish Diet? Nutrients 2019, 11, 679. [Google Scholar] [CrossRef] [PubMed]
- Górska-Warsewicz, H.; Rejman, K.; Laskowski, W.; Czeczotko, M. Milk and Dairy Products and Their Nutritional Contribution to the Average Polish Diet. Nutrients 2019, 11, 1771. [Google Scholar] [CrossRef]
- Rejman, K.; Górska-Warsewicz, H.; Czeczotko, M.; Laskowski, W. Nonalcoholic Beverages as Sources of Nutrients in the Average Polish Diet. Nutrients 2020, 12, 1262. [Google Scholar] [CrossRef]
- Górska-Warsewicz, H.; Rejman, K.; Laskowski, W. Butter, Margarine, Vegetable Oils, and Olive Oil in the Average Polish Diet. Nutrients 2019, 11, 2935. [Google Scholar] [CrossRef]
- Górska-Warsewicz, H.; Rejman, K.; Kaczorowska, J.; Laskowski, W. Vegetables, Potatoes and Their Products as Sources of Energy and Nutrients to the Average Diet in Poland. Int. J. Environ. Res. Public Health 2021, 18, 3217. [Google Scholar] [CrossRef] [PubMed]
- Górska-Warsewicz, H.; Laskowski, W.; Kulykovets, O.; Kudlińska-Chylak, A.; Czeczotko, M.; Rejman, K. Food Products as Sources of Protein and Amino Acids—The Case of Poland. Nutrients 2018, 10, 1977. [Google Scholar] [CrossRef]
- Górska-Warsewicz, H.; Rejman, K.; Laskowski, W.; Kowalcze, K. Food sources of potassium in the average Polish diet. Nutrients 2019, 11, 2905. [Google Scholar] [CrossRef] [PubMed]
- CSO. Household Budget Surveys in 2016; Central Statistical Office: Warsaw, Poland, 2017; ISSN 0208-9793. [Google Scholar]
- Kowrygo, B.; Górska-Warsewicz, H.; Berger, S. Evaluation of eating patterns with different methods: The Polish experience. Appetite 1999, 32, 86–92. [Google Scholar] [CrossRef] [PubMed][Green Version]
- CSO. Household Budget Surveys in 2006; Central Statistical Office: Warsaw, Poland, 2007. [Google Scholar]
- CSO. Household Budget Survey in 2013; Central Statistical Office: Warsaw, Poland, 2013; ISSN 0208-9793. [Google Scholar]
- CSO. Methodology of Household Survey; Barlik, M., Siwiak, K., Eds.; Central Statistical Office, Zakład Wydawnictw Statystycznych: Warsaw, Poland, 2011. (In Polish) [Google Scholar]
- Kunachowicz, H.; Przygoda, B.; Nadolna, I.; Iwanow, K. Nutritive Tables for Foods and Meals, 4th ed.; PZWL Wydawnictwo Lekarskie: Warsaw, Poland, 2017; ISBN 9788320053111. (In Polish) [Google Scholar]
- World Health Organization. The Science behind the Sweetness in Our Diets. Available online: https://www.who.int/bulletin/volumes/92/11/14-031114.pdf (accessed on 1 June 2021).
- Lang, M. Efficient R Programming. J. Stat. Softw. 2017, 80. [Google Scholar] [CrossRef]
- Fox, J.; Leanage, A. R and the Journal of Statistical Software. J. Stat. Softw. 2016, 73, 1–13. [Google Scholar] [CrossRef]
- Dubes, R.; Jain, A.K. Clustering Methodologies in Exploratory Data Analysis. Adv. Comput. 1980, 19, 113–228. [Google Scholar] [CrossRef]
- Wilks, D.S. Cluster Analysis. Int. Geophys. 2011, 100, 603–616. [Google Scholar]
- Rojas, R. 15 Kohonen Networks 15.1. In Neural Networks; Springer: Berlin, Germany, 1996; pp. 391–412. ISBN 9783540605058. [Google Scholar]
- Groele, B.; Głąbska, D.; Gutkowska, K.; Guzek, D. Mother’s fruit preferences and consumption support similar attitudes and behaviors in their children. Int. J. Environ. Res. Public Health 2018, 15, 2833. [Google Scholar] [CrossRef]
- Papanikolaou, Y.; Fulgoni, V. Grains Contribute Shortfall Nutrients and Nutrient Density to Older US Adults: Data from the National Health and Nutrition Examination Survey, 2011–2014. Nutrients 2018, 10, 534. [Google Scholar] [CrossRef]
- O’Neil, C.E.; Keast, D.R.; Fulgoni, V.L.; Nicklas, T.A. Food sources of energy and nutrients among adults in the US: NHANES 2003-2006. Nutrients 2012, 4, 2097–2120. [Google Scholar] [CrossRef]
- McLennan, W.; Podger, A. National Nutrition Survey Nutrient Intakes and Physical Measurements; Australian Bureau of Statistics: Canberra, Australia, 1998; ISBN 0642257248. [Google Scholar]
- A Focus on Nutrition: Key Findings from the 2008/09 NZ Adult Nutrition Survey. Ministry of Health NZ. Available online: https://www.health.govt.nz/publication/focus-nutrition-key-findings-2008-09-nz-adult-nutrition-survey (accessed on 30 June 2019).
- Roberts, C.; Steer, T.; Maplethorpe, N.; Cox, L.; Meadows, S.; Nicholson, S.; Page, P.; Swan, G. National Diet and Nutrition Survey: Results from Years 7 and 8 (Combined) of the Rolling Programme (2014/2015–2015/2016); Public Health England: London, UK, 2018. [Google Scholar]
- Van Rossum, C.T.M.; Fransen, H.; Verkaik-Kloosterman, J.; Buurma-Rethans, E.J.M.; Ocké, M.C. Dutch National Food Consumption Survey 2007–2010. Diet of Children and dults Aged 7 to 69 Years; Ministry of Health, Welfare and Sport: The Hague, The Netherlands, 2011. [Google Scholar]
- Samaniego-Vaesken, L.; Partearroyo, T.; Olza, J.; Aranceta-Bartrina, J.; Gil, Á.; González-Gross, M.; Ortega, R.M.; Serra-Majem, L.; Varela-Moreiras, G. Iron Intake and Dietary Sources in the Spanish Population: Findings from the ANIBES Study. Nutrients 2017, 9, 203. [Google Scholar] [CrossRef]
- Nutrition Facts for Olives, Green, Canned or Bottled, Pickled, Recommended Daily Values and Analysis. Available online: https://www.nutritionvalue.org/Olives%2C_green%2C_canned_or_bottled%2C_pickled_nutritional_value.html (accessed on 30 April 2021).
- Ros, E. Health Benefits of Nut Consumption. Nutrients 2010, 2, 652–682. [Google Scholar] [CrossRef]
- Olza, J.; Aranceta-Bartrina, J.; González-Gross, M.; Ortega, R.M.; Serra-Majem, L.; Varela-Moreiras, G.; Gil, Á. Reported dietary intake and food sources of zinc, selenium, and vitamins a, e and c in the spanish population: Findings from the anibes study. Nutrients 2017, 9, 697. [Google Scholar] [CrossRef]
- Mielgo-Ayuso, J.; Aparicio-Ugarriza, R.; Olza, J.; Aranceta-Bartrina, J.; Gil, Á.; Ortega, R.; Serra-Majem, L.; Varela-Moreiras, G.; González-Gross, M. Dietary Intake and Food Sources of Niacin, Riboflavin, Thiamin and Vitamin B6 in a Representative Sample of the Spanish Population. The Anthropometry, Intake, and Energy Balance in Spain (ANIBES) Study. Nutrients 2018, 10, 846. [Google Scholar] [CrossRef] [PubMed]
- Rejman, K. Food Consumption and Nutritional Behaviour among Low-Income Population in Poland and Implications for Nutrition Policy; WULS: Warsaw, Poland, 2011; ISBN 978-83-7583-211-2. [Google Scholar]
- Gałązka, M. Wpływ społeczno-demograficznych determinantów kształtowania się wydatków na żywność i napoje bezalkoholowe w gospodarstwach domowych w Polsce. Rocz. Ekon. Kujawsko-Pomorskiej Szk. Wyższej w Bydgoszczy 2012, 5, 223–239. [Google Scholar]
- Kułyk, P.; Michałowska, M. Uwarunkowania i kierunki zmian z spożyciu żywności w województwie lubuskim. Rocz. Nauk. Ekon. Rol. i Rozw. Obsz. Wiej. 2017, 104, 83–94. [Google Scholar] [CrossRef]
- Kwasek, M. Dochodowa elastyczność popytu na żywność. Wiadomości Stat. 2008, 53, 39–51. [Google Scholar]
- Stanisławska, J.; Wysocki, F. Dochodowa elastyczność wydatków na artykuły żywnościowe w gospodarstwach domowych rolników według grup dochodowych. Roczniki Naukowe Stowarzyszenia Ekonomistów Rolnictwa i Agrobiznesu 2011, 13, 315–319. [Google Scholar]
- Maciejewska, D.; Czerwińska, M.; Banaszczak, M.; Ryterska, K.; Łukomska, A.; Budrewicz, S.; Skowronek, M.; Stachowski, A.; Stachowska, E. Fruit and vegetable consumption among the young Polish population. Pomeranian J. Life Sci. 2016, 62, 57–61. [Google Scholar] [CrossRef] [PubMed]
- National Association of Fruit and Vegetable Producer Groups. Vegetables and Fruit in the Polish Diet; National Research of Vegetable and Fruit Consumption. Available online: https://www.producencipapryki.pl/files/news/2020/BADANIA%2027.02.2020.pdf (accessed on 20 April 2021).
- Rolnictwo i Gospodarka Żywnościowa w Polsce—Ministerstwo Rolnictwa i Rozwoju Wsi—Portal Gov.pl. Available online: https://www.gov.pl/web/rolnictwo/rolnictwo-i-gospodarka-zywnosciowa-w-polsce (accessed on 1 May 2021).
- CSO. Statistical Yearbook of the Republic of Poland 2018; Central Statistical Office: Warsaw, Poland, 2019. [Google Scholar]
- FAOSTAT. Food Balance Sheets, Data for 2018. Available online: http://www.fao.org/faostat/en/#data/FBS (accessed on 6 February 2021).
- Agostoni, C.; Berni Canani, R.; Fairweather-Tait, S.; Heinonen, M.; Korhonen, H.; La Vieille, S.; Marchelli, R.; Martin, A.; Naska, A.; Neuhäuser-Berthold, M.; et al. Scientific Opinion on Dietary Reference Values for vitamin C. EFSA J. 2013, 11, 3418–3420. [Google Scholar]
- Diet, Nutrition, Physical Activity and Cancer: A Global Perspective. About the Third Expert Report. Available online: https://www.wcrf.org/dietandcancer/about (accessed on 26 March 2020).
- Gibson, R.; Eriksen, R.; Chambers, E.; Gao, H.; Aresu, M.; Heard, A.; Chan, Q.; Elliott, P.; Frost, G. Intakes and food sources of dietary fibre and their associations with measures of body composition and inflammation in UK adults: Cross-sectional analysis of the airwave health monitoring study. Nutrients 2019, 11, 1839. [Google Scholar] [CrossRef] [PubMed]
- Krusinska, B.; Kowalkowska, J.; Wadolowska, L.; Wuenstel, J.W.; Slowinska, M.A.; Niedzwiedzka, E. Fibre-related dietary patterns: Socioeconomic barriers to adequate fibre intake in Polish adolescents. A short report. Nutrients 2017, 9, 590. [Google Scholar] [CrossRef] [PubMed]
- WHO. Diet, Nutrition and the Prevention of Chronic Diseases; Report of a Joint WHO/FAO Expert Consultation; WHO: Geneva, Switzerland, 2003; ISBN 924120916X. [Google Scholar]
- World Health Organization Guideline: Sugars intake for adults and children. World Heal. Organ. 2018, 57, 1716–1722. [CrossRef]
- Van Buul, V.J.; Tappy, L.; Brouns, F.J.P.H. Misconceptions about fructose-containing sugars and their role in the obesity epidemic. Nutr. Res. Rev. 2014, 27, 119–130. [Google Scholar] [CrossRef] [PubMed]
- National Center for Nutrition Education Recommendations for Healthy Eating. Available online: https://ncez.pl/abc-zywienia-/zasady-zdrowego-zywienia/talerz-zdrowego-zywienia (accessed on 20 April 2021). (In Polish).


| Specification | Energy | Protein | Fat | Carbohydrates | Fiber | Free Sugars |
|---|---|---|---|---|---|---|
| Average Daily Supply | 2261.00 kcal | 77.90 g | 96.91 g | 270.37 g | 17.64 g | 30.70 g |
| Daily Supply from Fruit and Fruit Products Share (%) in Average Daily Diet | 70.54 kcal | 1.03 g | 1.10 g | 15.65 g | 2.41 g | 7.22 g |
| 3.12% | 1.32% | 1.13% | 5.79% | 13.66% | 23.52% | |
| List of Fruit and Fruit Products by Supply (in %) 1/: | ||||||
| Citrus fruits | 0.34 | 0.17 | 0.04 | 0.72 | 1.90 | 2.54 |
| Bananas | 0.62 | 0.18 | 0.05 | 1.27 | 1.43 | 2.56 |
| Apples | 0.63 | 0.15 | 0.13 | 1.29 | 3.19 | 6.34 |
| Berries | 0.31 | 0.17 | 0.06 | 0.66 | 3.05 | 3.68 |
| Stone fruits | 0.28 | 0.13 | 0.04 | 0.54 | 0.92 | 3.06 |
| Other fruits | 0.26 | 0.10 | 0.14 | 0.46 | 1.06 | 2.39 |
| Frozen fruits | 0.01 | 0.00 | 0.00 | 0.01 | 0.07 | 0.07 |
| Dried fruits and nuts | 0.55 | 0.39 | 0.64 | 0.63 | 1.89 | 2.67 |
| Fruit products | 0.11 | 0.02 | 0.03 | 0.21 | 0.15 | 0.22 |
| Specification | Calcium | Phosphorus | Sodium | Potassium | Iron | Magnesium | Zinc | Copper |
|---|---|---|---|---|---|---|---|---|
| Average Daily Diet | 644.10 mg | 1160.19 mg | 3863.84 mg | 2617.85 mg | 10.28 mg | 267.33 mg | 9.78 mg | 1.11 mg |
| Daily Supply from Fruit and Fruit Products Share (%) in Average Daily Diet | 18.48 mg | 25.29 mg | 5.41 mg | 224.87 mg | 0.52 mg | 14.73 mg | 0.21 mg | 0.10 mg |
| 2.87% | 2.18% | 0.14% | 8.59% | 5.07% | 5.51% | 2.12% | 8.81% | |
| List of Fruit and Fruit Products by Supply 1/: | ||||||||
| Citrus fruits | 0.81 | 0.30 | 0.01 | 1.29 | 0.67 | 0.77 | 0.20 | 1.60 |
| Bananas | 0.13 | 0.24 | 0.00 | 2.13 | 0.55 | 1.69 | 0.26 | 1.27 |
| Apples | 0.19 | 0.22 | 0.02 | 1.43 | 0.82 | 0.32 | 0.46 | 1.01 |
| Berries | 0.59 | 0.34 | 0.01 | 1.01 | 1.01 | 0.57 | 0.33 | 1.57 |
| Stone fruits | 0.27 | 0.20 | 0.01 | 0.84 | 0.47 | 0.33 | 0.15 | 0.95 |
| Other fruits | 0.20 | 0.16 | 0.01 | 0.77 | 0.35 | 0.43 | 0.16 | 0.71 |
| Frozen fruits | 0.01 | 0.01 | 0.00 | 0.02 | 0.02 | 0.01 | 0.01 | 0.03 |
| Dried fruits and nuts | 0.61 | 0.69 | 0.01 | 0.99 | 1.03 | 1.32 | 0.52 | 1.52 |
| Fruit products | 0.05 | 0.02 | 0.07 | 0.11 | 0.14 | 0.06 | 0.03 | 0.14 |
| Specification | Thiamin | Riboflavin | Niacin | Vitamin B6 | Folate | Vitamin C | Vitamin A | Vitamin E |
|---|---|---|---|---|---|---|---|---|
| Average Daily Diet | 1.32 mg | 1.59 mg | 16.21 mg | 1.84 mg | 275.02 µg | 91.40 mg | 1.194.55 µg | 13.45 mg |
| Daily Supply from Fruit and Fruit Products Share (%) in Average Daily Diet | 0.05 mg | 0.05 mg | 0.40 mg | 0.11 mg | 13.39 µg | 21.62 mg | 29.15 µg | 0.74 mg |
| 3.75% | 3.15% | 2.46% | 5.74% | 4.87% | 23.65% | 2.44% | 5.53% | |
| List of Fruit and Fruit Products by Supply 1/: | ||||||||
| Citrus fruits | 0.76 | 0.29 | 0.19 | 0.61 | 1.14 | 8.03 | 0.41 | 0.77 |
| Bananas | 0.45 | 0.88 | 0.47 | 2.78 | 1.14 | 1.50 | 0.11 | 0.34 |
| Apples | 0.74 | 0.47 | 0.31 | 0.47 | 0.62 | 3.13 | 0.11 | 1.19 |
| Berries | 0.44 | 0.40 | 0.25 | 0.47 | 0.73 | 5.97 | 0.08 | 0.82 |
| Stone fruits | 0.40 | 0.36 | 0.40 | 0.28 | 0.22 | 1.06 | 0.75 | 0.48 |
| Other fruits | 0.35 | 0.26 | 0.30 | 0.56 | 0.67 | 3.45 | 0.49 | 0.37 |
| Frozen fruits | 0.01 | 0.01 | 0.01 | 0.01 | 0.01 | 0.17 | 0.00 | 0.02 |
| Dried fruits and nuts | 0.56 | 0.44 | 0.49 | 0.51 | 0.32 | 0.22 | 0.43 | 1.45 |
| Fruit products | 0.05 | 0.04 | 0.04 | 0.04 | 0.03 | 0.11 | 0.05 | 0.11 |
| Factors | Cramer Correlations |
|---|---|
| Study month | 0.418 |
| Income (quintile group) | 0.113 |
| Degree of urbanization | 0.084 |
| Education level | 0.080 |
| Socioeconomic affiliation | 0.078 |
| Size of the town | 0.077 |
| Land use | 0.076 |
| Number of people in a household | 0.066 |
| Assessment of the financial situation | 0.060 |
| Family life phase | 0.055 |
| Gender | 0.047 |
| Assessment of nutrition | 0.044 |
| Age | 0.040 |
| Region | 0.037 |
| Specification | Sample Population | Cluster 1 | Cluster 2 | Cluster 3 | Cluster 4 |
|---|---|---|---|---|---|
| 100% | 67.1% | 14.1% | 10.1% | 8.7% | |
| Number of households | 36,886 | 24,758 | 5208 | 3724 | 3196 |
| Factors | % of sample population | % of households in the cluster (100%) | |||
| Study month | |||||
| Month: 01 | 8.4% | 8.3% | 19.7% | 0.1% | 0.2% |
| Month: 02 | 8.4% | 9.2% | 15.5% | 0.2% | 0.3% |
| Month: 03 | 8.4% | 9.4% | 14.3% | 0.1% | 0.3% |
| Month: 04 | 8.3% | 10.7% | 6.3% | 0.4% | 2.1% |
| Month: 05 | 8.3% | 10.4% | 2.5% | 1.0% | 10.1% |
| Month: 06 | 8.4% | 5.8% | 0.7% | 8.7% | 40.6% |
| Month: 07 | 8.4% | 6.0% | 0.6% | 31.5% | 12.2% |
| Month: 08 | 8.3% | 5.9% | 0.7% | 31.6% | 11.9% |
| Month: 09 | 8.3% | 7.3% | 0.6% | 21.3% | 13.2% |
| Month: 10 | 8.3% | 10.3% | 2.5% | 4.5% | 7.0% |
| Month: 11 | 8.4% | 9.7% | 11.7% | 0.5% | 1.9% |
| Month: 12 | 8.3% | 7.1% | 25.0% | 0.1% | 0.2% |
| Income (quintile group) | |||||
| 1st group | 20.0% | 23.9% | 11.4% | 12.5% | 12.6% |
| 2nd group | 20.0% | 21.5% | 15.6% | 17.8% | 17.9% |
| 3rd group | 20.0% | 20.2% | 18.7% | 21.1% | 19.4% |
| 4th group | 20.0% | 18.5% | 24.4% | 21.8% | 22.5% |
| 5th group | 20.0% | 15.9% | 29.9% | 26.7% | 27.7% |
| Degree of urbanization | |||||
| Densely populated area | 35.4% | 31.8% | 44.2% | 42.3% | 40.8% |
| Medium populated area | 22.9% | 22.9% | 23.6% | 22.5% | 21.9% |
| Sparsely populated area | 41.7% | 45.3% | 32.2% | 35.2% | 37.3% |
| Education level | |||||
| Lower secondary, primary | 13.7% | 15.5% | 9.5% | 10.3% | 11.4% |
| Basic vocational | 31.3% | 33.7% | 24.8% | 29.2% | 25.5% |
| Secondary and post-secondary | 32.6% | 31.7% | 34.5% | 33.2% | 36.1% |
| Higher | 22.4% | 19.3% | 31.2% | 27.3% | 27.0% |
| Socioeconomic affiliation | |||||
| White-collar workers | 24.5% | 27.1% | 19.1% | 20.5% | 17.6% |
| Employees in manual labor positions | 24.0% | 21.8% | 30.9% | 26.9% | 26.3% |
| Farmers | 4.6% | 5.3% | 2.1% | 3.8% | 4.0% |
| Self-employed | 6.8% | 6.3% | 8.0% | 7.6% | 7.4% |
| Pensioners | 29.9% | 28.4% | 31.1% | 33.3% | 34.8% |
| Retired | 6.3% | 6.5% | 5.5% | 5.4% | 6.6% |
| Recipients of social benefits | 2.6% | 3.1% | 1.4% | 1.5% | 2.0% |
| Living from other unearned sources | 1.5% | 1.5% | 1.8% | 1.3% | 1.4% |
| Size of the town | |||||
| 500 thousand residents and more | 12.9% | 11.1% | 17.5% | 15.8% | 16.1% |
| 200–499 thousand residents | 8.5% | 7.4% | 11.0% | 10.5% | 10.6% |
| 100–199 thousand residents | 7.9% | 7.5% | 8.7% | 9.2% | 8.2% |
| 20–99 thousand residents | 17.2% | 16.6% | 19.2% | 18.6% | 17.3% |
| Less than 20 thousand residents | 11.2% | 11.2% | 11.9% | 10.8% | 10.9% |
| Village | 42.3% | 46.3% | 31.6% | 35.1% | 37.0% |
| Land use | |||||
| Yes | 52.6% | 54.8% | 44.0% | 49.8% | 53.2% |
| No | 47.4% | 45.2% | 56.0% | 50.2% | 46.8% |
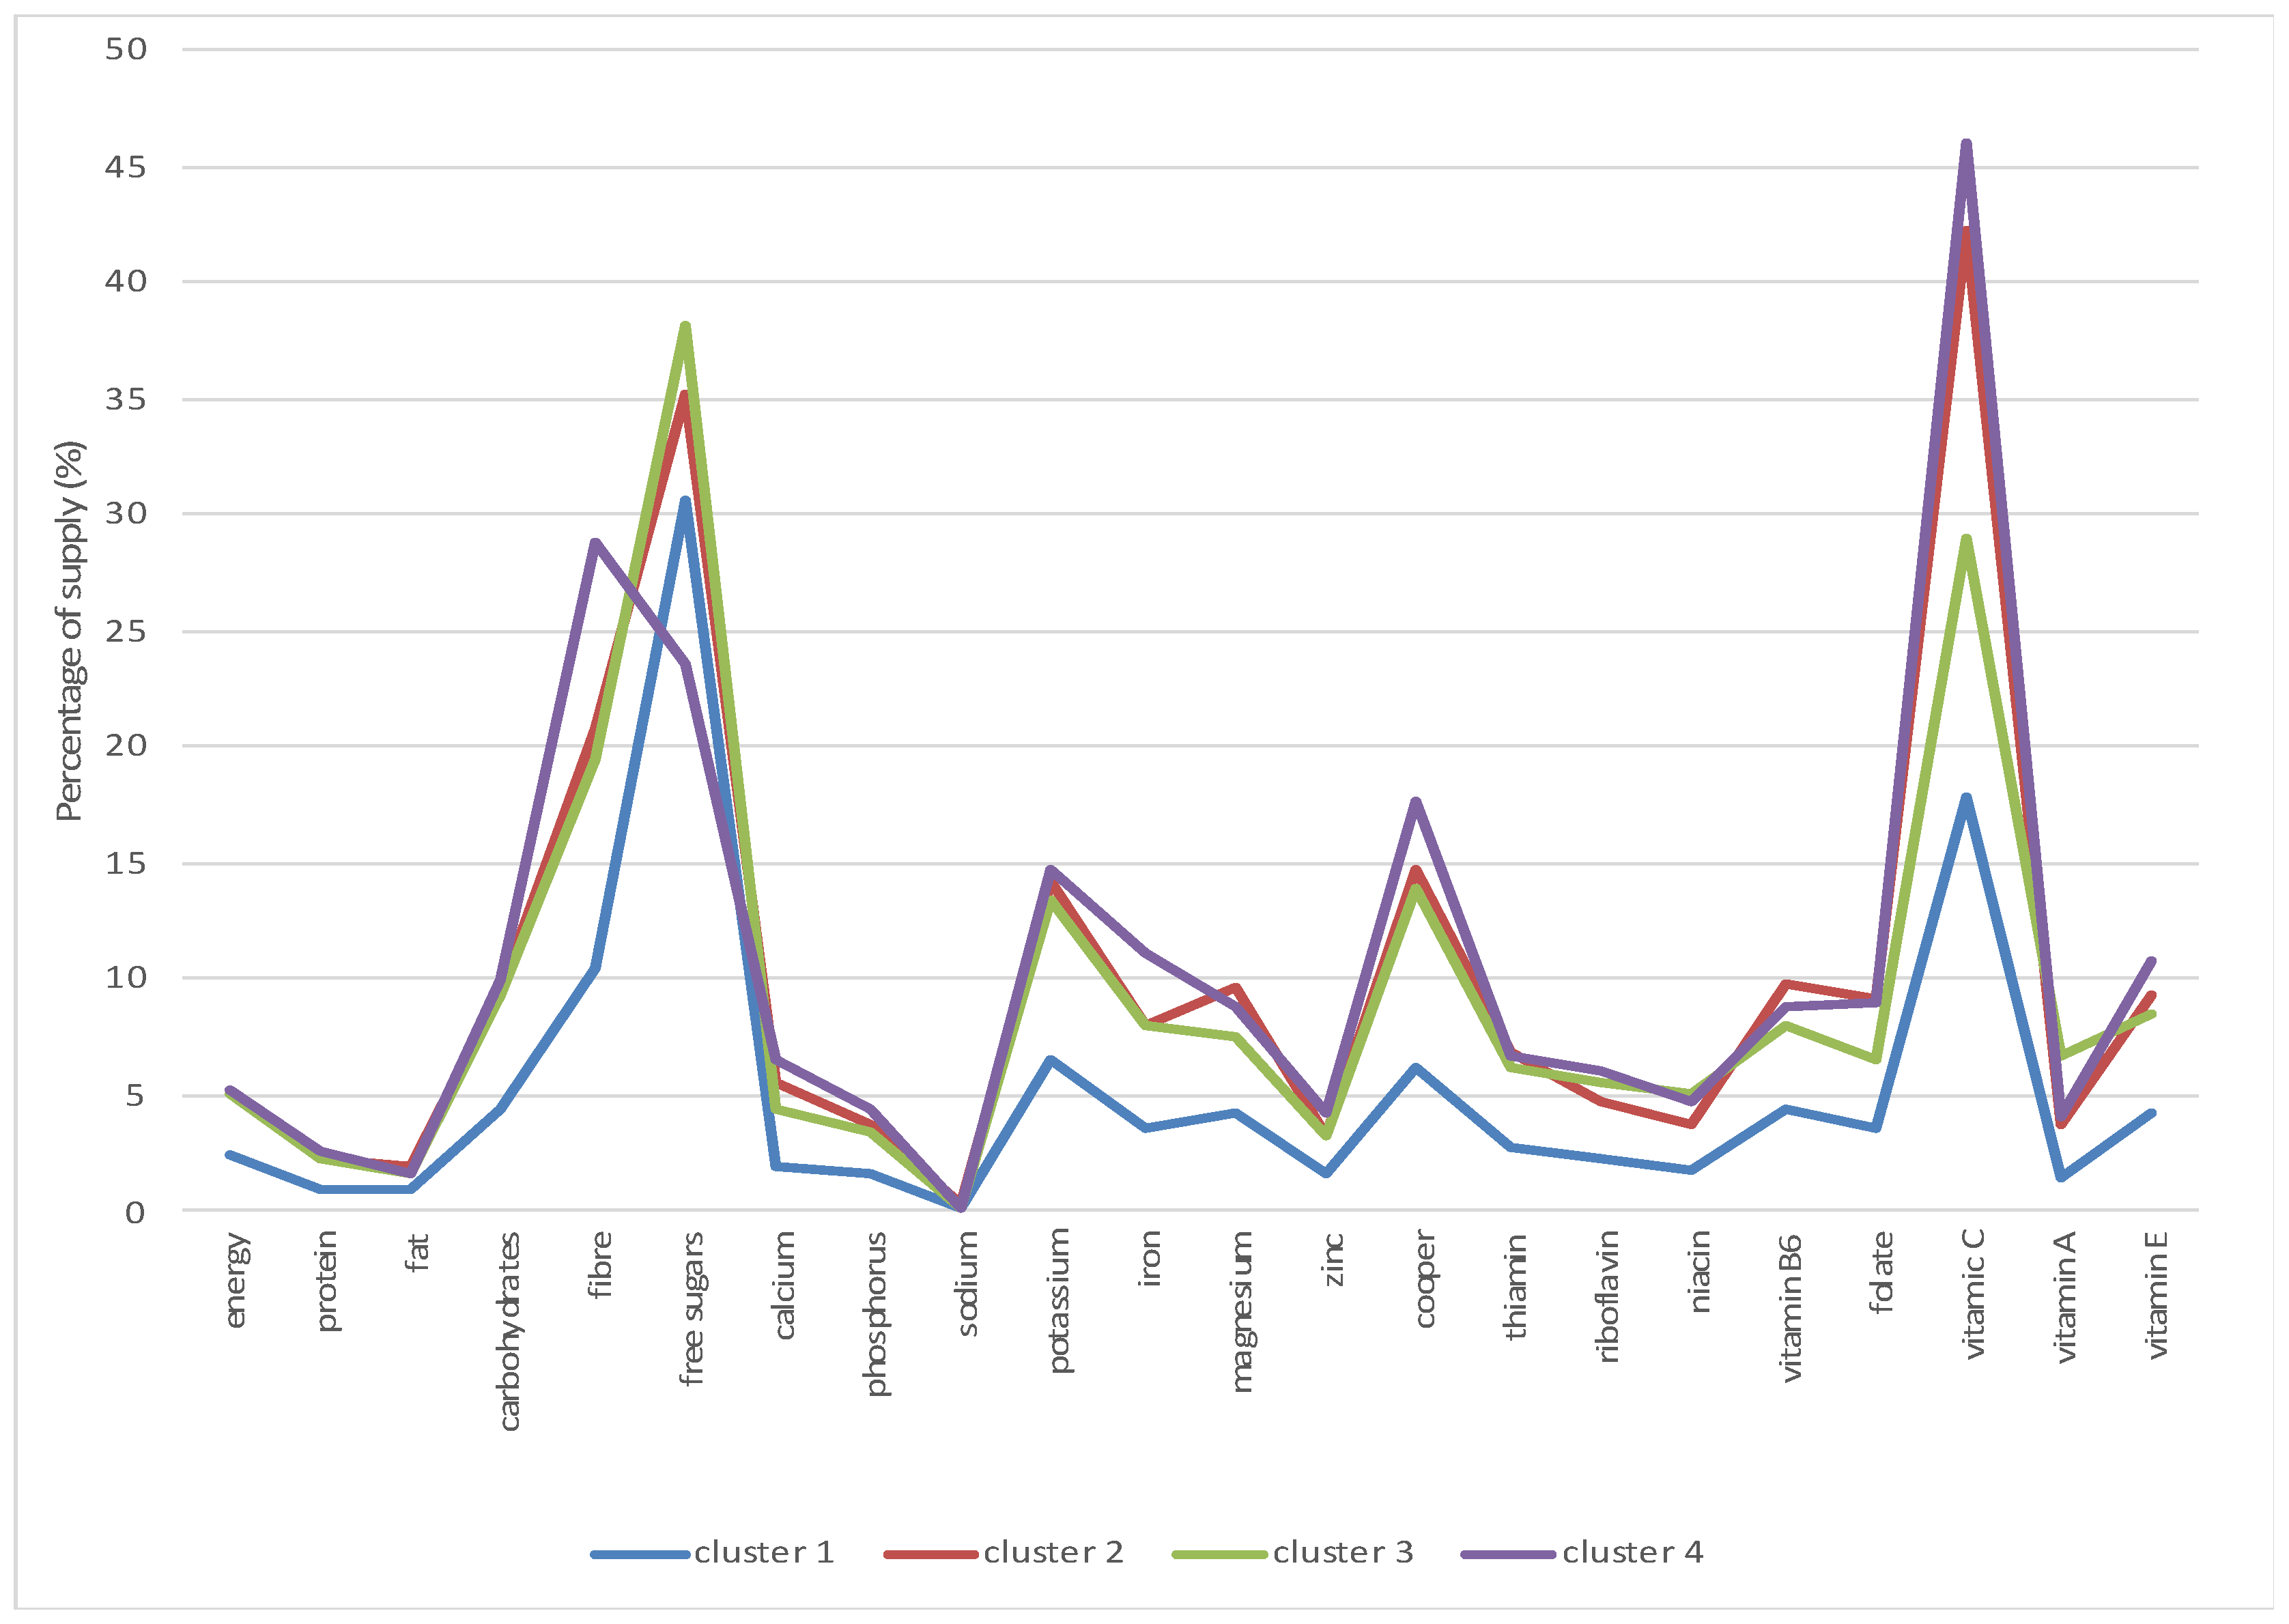
| Specification | Sample Population | Cluster 1 | Cluster 2 | Cluster 3 | Cluster 4 |
|---|---|---|---|---|---|
| Energy | 3.12 | 2.40 | 5.06 | 5.04 | 5.27 |
| Protein | 1.32 | 0.95 | 2.22 | 2.19 | 2.55 |
| Fat | 1.13 | 0.92 | 1.97 | 1.66 | 1.57 |
| Carbohydrates | 5.79 | 4.48 | 9.55 | 9.25 | 9.99 |
| Fiber | 13.66 | 10.41 | 20.70 | 19.51 | 28.77 |
| Simple sugars | 23.52 | 18.61 | 30.54 | 35.22 | 38.05 |
| Calcium | 2.87 | 2.00 | 5.59 | 4.33 | 6.46 |
| Phosphorus | 2.18 | 1.58 | 3.73 | 3.46 | 4.44 |
| Sodium | 0.14 | 0.11 | 0.22 | 0.16 | 0.15 |
| Potassium | 8.59 | 6.50 | 14.28 | 13.35 | 14.70 |
| Iron | 5.07 | 3.64 | 7.94 | 7.94 | 11.17 |
| Magnesium | 5.51 | 4.17 | 9.69 | 7.49 | 8.78 |
| Zinc | 2.12 | 1.61 | 3.32 | 3.20 | 4.27 |
| Cooper | 8.81 | 6.27 | 14.74 | 13.92 | 17.72 |
| Thiamin | 3.75 | 2.73 | 6.79 | 6.12 | 6.66 |
| Riboflavin | 3.15 | 2.33 | 4.68 | 5.48 | 5.97 |
| Niacin | 2.46 | 1.72 | 3.68 | 5.06 | 4.66 |
| Vitamin B6 | 5.74 | 4.40 | 9.78 | 7.93 | 8.84 |
| Folate | 4.87 | 3.53 | 9.12 | 6.48 | 8.91 |
| Vitamin C | 23.65 | 17.78 | 42.15 | 28.96 | 45.94 |
| Vitamin A | 2.44 | 1.47 | 3.70 | 6.76 | 4.03 |
| Vitamin E | 5.53 | 4.16 | 9.23 | 8.57 | 10.82 |
Publisher’s Note: MDPI stays neutral with regard to jurisdictional claims in published maps and institutional affiliations. |
© 2021 by the authors. Licensee MDPI, Basel, Switzerland. This article is an open access article distributed under the terms and conditions of the Creative Commons Attribution (CC BY) license (https://creativecommons.org/licenses/by/4.0/).
Share and Cite
Rejman, K.; Górska-Warsewicz, H.; Kaczorowska, J.; Laskowski, W. Nutritional Significance of Fruit and Fruit Products in the Average Polish Diet. Nutrients 2021, 13, 2079. https://doi.org/10.3390/nu13062079
Rejman K, Górska-Warsewicz H, Kaczorowska J, Laskowski W. Nutritional Significance of Fruit and Fruit Products in the Average Polish Diet. Nutrients. 2021; 13(6):2079. https://doi.org/10.3390/nu13062079
Chicago/Turabian StyleRejman, Krystyna, Hanna Górska-Warsewicz, Joanna Kaczorowska, and Wacław Laskowski. 2021. "Nutritional Significance of Fruit and Fruit Products in the Average Polish Diet" Nutrients 13, no. 6: 2079. https://doi.org/10.3390/nu13062079
APA StyleRejman, K., Górska-Warsewicz, H., Kaczorowska, J., & Laskowski, W. (2021). Nutritional Significance of Fruit and Fruit Products in the Average Polish Diet. Nutrients, 13(6), 2079. https://doi.org/10.3390/nu13062079