Abstract
Limited and inconsistent evidence exists on the associations between dietary patterns and overweight during childhood. The present study describes dietary patterns of three-year-old Dutch children and associations between childhood overweight and body mass index (BMI) development between 3 and 10 years. In the GECKO Drenthe birth cohort (N = 1306), body height and weight were measured around the age of 3, 4, 5, and 10 years, and overweight was defined according to Cole and Lobstein. A validated food frequency questionnaire (FFQ) was used to measure diet at 3 years. Dietary patterns were derived using principal components analysis (PCA). Using logistic regression analyses, pattern scores were related to overweight at 3 and 10 years. A linear mixed-effect model was used to estimate BMI-SDS development between 3 to 10 years according to quartiles of adherence to the pattern scores. Two dietary patterns were identified: (1) ‘minimally processed foods’, indicating high intakes of vegetables/sauces/savory dishes, and (2) ‘ultra-processed foods’, indicating high intakes of white bread/crisps/sugary drinks. A 1 SD increase in the ‘ultra-processed foods’ pattern score increased the odds of overweight at 10 years (adjusted OR: 1.30; 95%CI: 1.08, 1.57; p = 0.006). The ‘minimally processed foods’ pattern was not associated with overweight. Although a high adherence to both dietary patterns was associated with a higher BMI-SDS up to 10 years of age, a stronger association for the ‘ultra-processed foods’ pattern was observed (p < 0.001). A dietary pattern high in energy-dense and low-fiber ultra-processed foods at 3 years is associated with overweight and a high BMI-SDS later in childhood.
1. Introduction
Childhood overweight and obesity are important public health challenges because they are associated with an increased risk of obesity later in life [1] as well as other adverse health consequences [2]. Increasing evidence suggests that unhealthy diets during early childhood are key modifiable risk factors for the development of overweight and obesity [3,4,5]. Improving dietary habits is thus one of the crucial strategies for the prevention of overweight.
Dietary patterns represent a comprehensive picture of the whole diet and may thus give a better indication of a disease risk than by looking at the consumption of individual foods or nutrients [6]. There is growing evidence for adults and older children that dietary patterns that are high in energy-dense, nutrient-poor, low-fiber foods predispose to later overweight and obesity [5,7]. However, studies in young children (2 to 5 years) are limited and have shown inconsistent findings.
Most previous studies on dietary patterns including young children have identified two major dietary patterns. One pattern indicated a high intake of energy-dense, high-sugar/fat, low-fiber foods, often labeled as ‘unhealthy’ or ‘processed’ [8,9,10,11,12,13,14,15,16,17,18]. In cross-sectional studies among 3- to 7-year-old children, a high adherence to such patterns was associated with a higher risk of obesity [8,10,12]. However, cross-sectional studies including younger children reported no associations [9,11,13]. Another dietary pattern commonly identified across studies indicated a high intake of fruits and vegetables, cereals, and/or dairy products, named as ‘traditional’ [8,9,11] or ‘healthy’ [8,9,10,12,13]. Two cross-sectional studies [8,11] reported an association between a high adherence to these patterns and a lower risk for overweight or obesity, while others [9,10,13] did not. Interestingly, one study found that a higher adherence to a ‘traditional’ pattern was associated with a higher BMI [12].
Prospective studies have also shown inconsistent findings. Among 2- to 5-year-old children, three studies found that a high adherence to a ‘snacking’ or ‘energy-dense’ pattern or ‘processed foods’ cluster was associated with an increase in BMI [14,15] or excess fat mass [16]. However, another study showed no association between a ‘junk food’ pattern at 3 years and obesity at 7 years [18]. In one study, an association with BMI at 7 years was found only among girls [17]. Moreover, studies with the longest follow-up period (up to 5 years) reported either no or mixed associations between various dietary patterns at age 3 or 5 and weight-related outcomes later in childhood [18,19].
Based on the aforementioned findings, current evidence on the associations between dietary patterns of young children and the development of childhood overweight or obesity is conflicting. Direct comparison between studies is also difficult due to differences in methodology to derive dietary patterns (PCA, cluster analysis, or reduced rank regression), various outcome measures used, and the fact that dietary patterns are population-specific. Because dietary habits are established early and track into later life [20,21,22,23], and longer-term follow-up studies on this topic are lacking, further knowledge is crucial for developing prevention strategies for overweight and obesity. Therefore, the objective of this study was to (1) identify the dietary patterns of three-year-old Dutch children by using principal component analysis (PCA) and (2) examine associations between dietary patterns and overweight cross-sectionally at 3 years and prospectively at 10 years. Additionally, we examined associations between dietary patterns and BMI-SDS development between 3 and 10 years of age.
2. Materials and Methods
2.1. Subjects
Data were obtained from a Dutch population-based cohort study, embedded within the Groningen Expert Center for Kids with Obesity (GECKO), the GECKO Drenthe study. Details of the study design, recruitment, and study procedures are described in detail elsewhere [24]. All pregnant women living in the province of Drenthe, the Netherlands, were invited to participate in this study during the third trimester of their pregnancy. Of the 5326 children born between April 2006 and April 2007, 2842 started active participation in the study. At 10 years, 2299 children still participated in the study. For the identification of dietary patterns among the study population, all children with complete data on the food frequency questionnaire (FFQ) at 3 years were included (N = 1306). From these children, all children with complete data on the covariates and for whom height and weight measurements were obtained at 3 and 10 years were selected for the analyses on the dietary patterns and overweight (N = 938, Figure S1). The majority of missing questionnaires at the age of 3 years was related to logistical issues. Characteristics and available BMI measurements of the children excluded from the analyses (because of the missing data on growth measurements or covariates) were similar, except for the educational status of the mother, which was slightly lower among those excluded. For the analysis on the dietary patterns and BMI-SDS development between 3 and 10 years, children with complete data on FFQ, covariates, and at least one BMI measurement during the period of 3 to 10 years were included, N = 1233. Written informed consent was obtained from the parents. The study was conducted according to the guidelines of the Declaration of Helsinki and was approved by the Medical Ethics Committee of the University Medical Center Groningen (Medical ethical approval ID: 2005.260). The cohort is registered at www.birthcohorts.net (accessed on 10 May 2021).
2.2. Dietary Data
Information on the diets at 3 years was obtained through an FFQ, completed by the parents. This FFQ has been validated for energy intake against the doubly labelled water method in a group of 4- to 6-year-old children [25]. The FFQ assessed the frequency of weekly consumption of 71 food products over the previous four weeks. Answer categories ranged from ‘never’ to ‘6–7 days a week’. For 27 food products, additional questions were included regarding the type or brand of the product consumed. Portion size was assessed using fixed units (e.g., slices of bread) or common household measures (e.g., cups, spoons). Parents were asked to measure the volume of glasses and cups used for different beverages. From these data, intake of each food product (in grams per day) was calculated. Daily energy and nutrient intakes were calculated based on the Dutch food composition database (2011) [26]. For the purpose of the current analysis, food intake data were collapsed into 33 food groups taking into account the nutrient composition, i.e., energy density, fat, and fiber content, as well as the usage of each food item. These 33 food groups are listed in Table S1.
2.3. Growth Measures during Childhood
The weight and height of the children were measured at ages 3, 4, 5, and 10 years during routine health examinations by the staff of the Youth Health Care centers (YHC). Body weight was measured using an electronic scale and rounded to the nearest 0.1 kg. Height was measured in the standing position against a wall and rounded to the nearest 0.1 cm. For the analyses on overweight at 3 and 10 years, age- and sex-specific BMI standard deviation scores (SDS) were derived using the WHO growth references [27,28] using the Growth Analyzer Software, version 4.0 (Growth Analyzer BV). Because the number of children with obesity (n = 17 and n = 39 at 3 and 10 years, respectively) were too small to be analyzed separately, the outcome was defined as overweight including obesity (referred to as overweight in the Methods and Results sections) and defined according to Cole and Lobstein [29]. To investigate the BMI-SDS development between 3 and 10 years, all BMI measurements at ages 3, 4, 5, and 10 years were included. These were calculated according to the age- and sex-specific distributions of BMI derived from the Dutch growth reference (2010) [30]. This reference was selected as it covers the period of 0–21 years, (thus including the period between 3 and 10 years), whereas the WHO provides two separate standards for the periods of 0–5 [27] and 5–19 years [28].
2.4. Covariates
Maternal covariates included pre-pregnancy BMI, highest completed educational level, ethnicity, smoking during pregnancy (yes/no), age (continuous, years), and parity (primiparous/multiparous) [31,32,33]. The information on the maternal covariates was collected during the last trimester of pregnancy or shortly after birth by means of a questionnaire and maternity files. Pre-pregnancy BMI was calculated from the weight and height data and dichotomized as normal weight (BMI < 25 kg/m2) or overweight (≥25 kg/m2). Educational level was categorized as low (no education, primary school, lower vocational, or lower general secondary education), middle (intermediate vocational training or higher secondary education) or high (higher vocational or university education) [34]. Ethnicity was defined as the country of birth of the mother and dichotomized as Dutch (mother being born in the Netherlands) or non-Dutch [35]. Child covariates included gestational age (weeks) and birth weight (g), which was rounded to the nearest 5 g. These data were reported by the midwives and obtained through the YHC registry. Birth weight was standardized according to gestational age- and sex-specific reference values based on the WHO reference [36]. These were derived using the Growth Analyzer Software, version 4.0 (Growth Analyzer BV). For 59 children, data on at least one of the covariates was missing. Due to the low number of missing data on the confounders, we decided not to impute missing data.
2.5. Statistical Analysis
Principal component analysis (PCA) with varimax rotation was used to identify dietary patterns among the total study population with valid dietary data (n = 1306). The number of patterns was selected considering eigenvalues of >1.50, the scree plot, and the interpretability of the patterns. We identified two dietary pattern components that had factor loadings >2 (2.76 and 2.02) and explained 14.5% of the variance in food intake. In the scree plot, a clear break was indicated after the second component, suggesting a two-component solution. The interpretability of the components was preferred over the second-best option, a five-component solution, which explained 29.6% of the total variance. Regarding the interpretability, the disadvantage of the five-component solution was that two components depicted meals rather than a diet (e.g., ‘breakfast’ with a high intake of food groups such as bread, butter/oil, and sweet bread toppings). For the two identified dietary patterns, regression-based factor scores were created by summing the observed standardized consumption per food group, which were weighted according to the PCA loadings. These factor scores were derived for each child and indicated the adherence to each dietary pattern.
Logistic regression analyses were used to study the associations between the dietary pattern scores (continuous variable) and overweight at 3 and 10 years (N = 938). First, we carried out an analysis to estimate cross-sectional associations between the dietary patterns and overweight at 3 years. Then, we analyzed prospective associations of the dietary patterns and overweight at 10 years. In both analyses, the pattern scores for both dietary patterns were used as determinants simultaneously in order to adjust for the adherence to the other pattern. At both ages, we estimated two models; a crude model including the dietary pattern scores and a second adjusted model including the a priori selected child and maternal covariates. As sensitivity analyses, we also repeated the logistic regression analyses using the definition of overweight according to WHO (Tables S2 and S3). According to this definition, overweight is defined as +2 BMI-SDS at 3 years [27] and +1 BMI-SDS at 10 years [28].
To assess the association between dietary pattern scores and BMI-SDS development between 3 to 10 years, a random effects linear regression model with robust standard errors, to correct for the nesting (several measurements per child), was used. These analyses included all children who had at least one BMI measurements available between 3 to 10 years (N = 1233, see Tables S4 and S5). On average, each child had 3.3 BMI measurements (min 1, max 4). We estimated one model including both dietary pattern scores and interactions between the dietary patterns and age (categorical: 3, 4, 5, and 10 years) to account for non-linearity between age and BMI-SDS development. This model was adjusted for all covariates.
Descriptive data analysis and the logistic regression analyses were conducted using the statistical program SPSS, version 19 (Chicago, IL, USA). The random effects linear regression model was conducted using Stata, version 16 (StataCorp. 2019. Stata Statistical Software: Release 16. College Station, TX, USA: StataCorp LLC).
3. Results
The mothers of the children in the study population were mainly Dutch, 28.6% had a low educational level, and 38.5% had overweight (Table 1). The percentage of children with overweight (according to Cole and Lobstein) at 3 and 10 years were 13.6% and 16.4%, respectively.

Table 1.
Characteristics of the study population (n=1306).
Table 2 shows the two dietary patterns identified, their factor loadings, and correlations with nutrients. The two patterns accounted for 14.5% of the variance in food consumption within our study population. For ease of description, we called these patterns ‘minimally processed foods’ and ‘ultra-processed foods’. The names were based on the characteristics of the foods that distinguished the two patterns. The first pattern ‘minimally processed foods’ was characterized by high intakes of vegetables, sauces, rice/pasta, and savory dishes. The second pattern, ‘ultra-processed foods’, indicated high intakes of white bread, crisps, savory snacks, and sugar-sweetened beverages (SSB), as well as low intakes of whole-grain bread.
Table 2.
Factor loadings for the identified dietary patterns.
3.1. Cross-Sectional and Prospective Associations between Dietary Patterns and Overweight at 3 and 10 Years
At 3 years, no associations between the two dietary patterns and overweight were observed (Table 3). At 10 years (Table 4), a 1 SD higher score for the ‘ultra-processed foods’ pattern was positively associated with 1.36 times (95% CI: 1.14, 1.61) higher odds of overweight (crude model). This association remained statistically significant after adjusting for confounders (OR 1.30; 95% CI: 1.08, 1.57). Results from the sensitivity analyses including overweight definition according to the WHO were comparable to the main results at both ages (Tables S2 and S3).
Table 3.
Associations between dietary patterns and overweight at 3 years (N = 938).
Table 4.
Associations between dietary patterns and overweight at 10 years (N = 938).
3.2. BMI-SDS Development
Children with a high adherence (Quartile 4) to the ‘minimally processed foods’ pattern showed higher BMI-SDS development between 3 and 10 years compared to those with a low (Quartile 1) adherence (Figure 1, left panel). The differences were significant at 4 and 10 years (p < 0.05; Table S4). Children with a high adherence (Quartile 4) to the ‘ultra-processed foods’ pattern had a BMI development towards a higher BMI-SDS from 5 years onwards, than children with a low adherence (Quartile 1) to this pattern (Figure 1, right panel). This difference was statistically significant at 10 years (p < 0.001; Table S4).
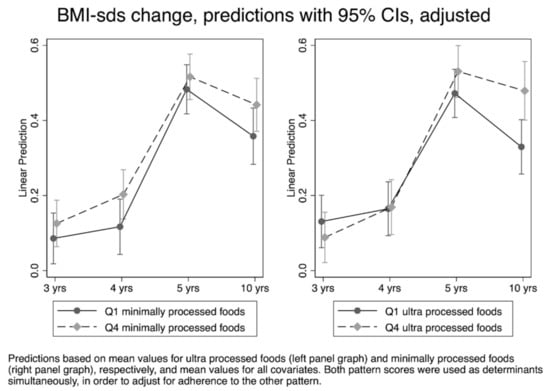
Figure 1.
Linear predicted values for BMI-SDS development between 3 and 10 years of age, adjusted predictions with 95% CIs (N = 1233).
4. Discussion
In this study, conducted in Dutch children aged 3 years at baseline, two dietary patterns, which we labelled as ‘minimally processed foods’ and ‘ultra-processed foods’, respectively, were identified. We observed that a greater adherence to the ‘ultra-processed foods’ pattern was associated with a statistically significant increase in the odds of overweight and development of a significantly higher BMI-SDS up to 10 years. No cross-sectional associations between the dietary patterns and overweight at 3 years were observed.
Most previous studies have identified a pattern featuring a mixture of nutrient-poor, low-fiber ultra-processed foods, often labeled either as ‘processed’ or ‘junk food’ pattern [7]. In our study, the ‘ultra-processed foods’ pattern was not cross-sectionally associated with overweight at 3 years, which is in line with some [9,11,13] but not all [8,10,12] previous cross-sectional studies in young children. One possible explanation for our finding is that until the age of 3, the diets of young children are still evolving due to the changes in parental feeding practices and/or child feeding behaviors (e.g., fussy eating) [37,38] and therefore, associations with overweight at this age may not yet be evident. However, cross-sectional studies, where dietary intake and weight status are assessed at the same time, do not allow us to make conclusions of the causality of the associations. For instance, if a child has overweight or obesity, parents may change the child’s diet in an effort to prevent further weight gain or encourage weight loss. As a result, associations reported in cross-sectional studies may reflect reverse causation and therefore should be interpreted with caution.
In contrast to the cross-sectional findings, our prospective findings on ‘ultra-processed foods’ and overweight development up to age 10 were in line with several previous prospective studies in children [14,15,16,17]. In these studies, a high adherence to a similar pattern was positively associated with the development of obesity, higher BMI [14], or other adiposity measures [14,16] during childhood. Previous prospective studies assessing dietary patterns among young children (2 to 5 years), showed in contrast to our results, that a ‘processed’ or ‘junk’ pattern was not associated with obesity [18], or that the association with BMI increase was observed only among girls [17]. One possible explanation why we, unlike the other studies, found an association between the ‘ultra-processed foods’ pattern and the development of overweight and BMI-SDS, may be that our study included a longer follow-up. The follow-up time in the other studies (2 to 3 years) might have been too short for obesity to have manifested at such a young age. Furthermore, some studies [16,39] suggested that a ‘junk food’ diet at a younger age may not lead to weight gain in the long term due to counter regulation of energy intake, because young children may compensate for high energy intakes from junk food at subsequent eating occasions. Our results suggest that this may not be the case as we showed that children as young as 3 years with a high adherence to an ultra-processed dietary pattern are at risk for developing overweight during childhood.
In the present study, the dietary patterns extracted with the PCA accounted for 14.5% of the total variance in food intake. This is in line with the findings of other studies in children [40,41,42]. The ‘minimally processed foods’ pattern identified in our study indicated a high consumption of fruits, vegetables, fish, and whole-grain bread, as endorsed by the Dutch dietary guidelines [43]. Nevertheless, this pattern also showed relatively high intakes of some (processed) foods considered less healthy, but traditionally consumed by Dutch children, such as fried potatoes, meat, sauces, and savory snacks. The ‘minimally processed foods’ pattern describes a combination of high factor loadings from two patterns described in previous studies: ‘traditional’ (meat, vegetables, and potatoes) [8,9,12] and ‘healthy’ (fruit, vegetables, and fish) [44]. In our study, this dietary pattern was not associated with overweight cross-sectionally or prospectively, which is in line with some [9,10] but not all [8,11] previous studies. However, we also observed that children with a high adherence to this pattern had a somewhat higher BMI-SDS at 4 and 10 years, but not at 5 years. Although we do not have a clear explanation for this finding, one other prospective study [44] found that a ‘healthy’ dietary pattern at 5 years was positively associated with weight development between 5 and 10 years.
A diet high in ultra-processed foods such as sugary drinks, crisps, and savory snacks can compromise healthy growth in different ways. These types of foods are high in added sugars and/or fats, contain low levels of fiber/nutrients, and have a high energy density [45]. In addition, such foods and beverages are also highly palatable and tend to be eaten at a fast rate [46]. A high palatability of the foods disrupts the innate appetite control [47], leading to greater energy consumption and weight gain [48]. Additionally, a fast eating rate in combination with a high energy density is suggested as a plausible mechanism by which increased consumption of highly palatable foods promotes higher body weight [49]. Part of the association between the ‘ultra-processed foods’ pattern and overweight may also be explained by the lack of fruits, vegetables, and other nutrient/fiber-rich foods, which was also evident in the ultra-processed pattern observed in our study. Our results suggest that a dietary pattern high in energy-dense, low-fiber ultra-processed foods during toddlerhood seems to be more strongly associated with the development of childhood overweight than a more healthy diet including whole foods [50].
This study has several strengths. The data analyzed come from a large population-based cohort, with a relatively high retention rate. The study population was representative of the educational level of the general Dutch population. Our study included a follow-up period of 7 years, with BMI measurements available at several timepoints. To the best of our knowledge, our study includes the longest follow-up so far among studies on dietary patterns in young children. For deriving the dietary patterns, we used a validated FFQ, which also assessed information on portion sizes. Additionally, the analyses were adjusted for several known confounders; however, information on sedentary and physical activity was not available. In the GECKO Drenthe cohort, objectively measured moderate-to-vigorous physical activity at 5–6 years of age was not associated with overweight [51].
Some limitations should also be acknowledged. First, compared to the full cohort population (ever active participation), the group of low educated mothers were less represented in the study population (due to missing FFQ data), which may have introduced some bias on educational level. However, the majority of the missing data on FFQ’s was due to logistical aspects and can be regarded as missing completely at random. Reassuringly, means of important weight-related outcomes and confounders of the included children were very comparable to the full cohort population. Second, because ethnic minorities were slightly underrepresented, our findings may therefore be less representative of the general Dutch population. Third, as in all dietary studies, recall bias and misreporting are potential sources of bias. Especially, food items high in sugar and fat, considered ‘unhealthy’, may have been underreported by the parent more often compared to ‘healthy’ foods [52]. This may have attenuated the association between the dietary patterns and the outcomes. Fourth, during the process of the PCA, certain decisions, such as the number of dietary patterns and the food group classification, are prone to subjectivity. Finally, as in all observational studies, we cannot rule out the possibility of residual confounding.
5. Conclusions
This study in Dutch children indicates that, at 3 years of age, a dietary pattern including high intakes of white bread, crisps, savory snacks, and sugary drinks is associated with a higher risk of overweight and a higher BMI-SDS later in childhood. In line with the current dietary guidelines, our results suggest that limiting the consumption of energy-dense and nutrient-poor ultra-processed foods during childhood may be important for the prevention of childhood overweight and obesity.
Supplementary Materials
The following are available online at https://www.mdpi.com/article/10.3390/nu13062046/s1, Figure S1: Selection of the study population, Table S1: Food grouping for PCA, Table S2: Associations between dietary patterns and overweight at 3 years, sensitivity analysis using the WHO definition of overweight (N = 938), Table S3: Associations between dietary patterns and overweight at 10 years, sensitivity analysis using the WHO definition of overweight (N = 938). Table S4: Mean differences in estimated BMI-SDS for quartile of adherence (Q1 vs. Q4) to the dietary patterns at each age, derived from the random effects linear regression model (N = 1233), Table S5: Associations between dietary patterns and BMI-SDS development between 3 and 10 years of age (N = 1233).
Author Contributions
Conceptualization, O.S., J.C.S., and E.C.; formal analysis, O.S and M.F.; writing—original draft preparation, O.S.; writing—review and editing, O.S., M.F., M.A.-B., J.H., M.R.O., J.C.S., and E.C. All authors have read and agreed to the published version of the manuscript.
Funding
The GECKO Drenthe birth cohort was funded by an unrestricted grant of Hutchison Whampoa Ltd., Hong Kong, and supported by the University of Groningen, Well Baby Clinic Foundation Icare, Noordlease, Paediatric Association Of The Netherlands, Youth Preventive Health Care Drenthe, and the European Union’s Horizon 2020 research and innovation programme (LifeCycle, Grant Agreement No. 733206 LifeCycle). The funding bodies had no role in the design of the study, collection, analysis, and interpretation of data, or in writing the manuscript.
Institutional Review Board Statement
The study was conducted according to the guidelines of the Declaration of Helsinki and was approved by the Medical Ethics Committee of the University Medical Center Groningen.
Informed Consent Statement
Written informed consent was obtained from the parents.
Data Availability Statement
The data presented in this study are available on request from E.C. (e.corpeleijn@umcg.nl). The data are not publicly available due to ethical reasons.
Acknowledgments
We are grateful to the families who took part in the GECKO Drenthe study, the midwives, gyneacologists, nurses, general practitioners, and all health professionals at the Preventive Child Healthcare Drenthe for their help in the recruitment and the measurements, and the GECKO Drenthe study team.
Conflicts of Interest
O.S. and M.A-B. are employees of Danone Nutricia Research. The other authors declare no conflict of interest.
References
- Singh, A.S.; Mulder, C.; Twisk, J.W.; van Mechelen, W.; Chinapaw, M.J. Tracking of childhood overweight into adulthood: A systematic review of the literature. Obes. Rev. 2008, 9, 474–488. [Google Scholar] [CrossRef] [PubMed]
- Reilly, J.J.; Kelly, J. Long-term impact of overweight and obesity in childhood and adolescence on morbidity and premature mortality in adulthood: Systematic review. Int. J. Obes. 2011, 35, 891–898. [Google Scholar] [CrossRef]
- Moreno, L.A.; Bel-Serrat, S.; Santaliestra-Pasías, A.M.; Rodríguez, G. Obesity prevention in children. World Rev. Nutr. Diet. 2013, 106, 119–126. [Google Scholar] [CrossRef]
- Robinson, S.; Fall, C. Infant nutrition and later health: A review of current evidence. Nutrients 2012, 4, 859–874. [Google Scholar] [CrossRef]
- Liberali, R.; Kupek, E.; Assis, M.A.A. Dietary Patterns and Childhood Obesity Risk: A Systematic Review. Child. Obes. 2020, 16, 70–85. [Google Scholar] [CrossRef]
- Hu, F.B. Dietary pattern analysis: A new direction in nutritional epidemiology. Curr. Opin. Lipidol. 2002, 13, 3–9. [Google Scholar] [CrossRef]
- Ambrosini, G.L. Childhood dietary patterns and later obesity: A review of the evidence. Proc. Nutr. Soc. 2014, 73, 137–146. [Google Scholar] [CrossRef]
- Flynn, A.C.; Thompson, J.M.D.; Dalrymple, K.V.; Wall, C.; Begum, S.; Pallippadan Johny, J.; Cutfield, W.S.; North, R.; McCowan, L.M.E.; Godfrey, K.M.; et al. Childhood dietary patterns and body composition at age 6 years: The Children of SCOPE study. Br. J. Nutr. 2020, 124, 217–224. [Google Scholar] [CrossRef] [PubMed]
- Shi, Z.; Makrides, M.; Zhou, S.J. Dietary patterns and obesity in preschool children in Australia: A cross-sectional study. Asia Pac. J. Clin. Nutr. 2018, 27, 406–412. [Google Scholar] [CrossRef] [PubMed]
- Dalrymple, K.V.; Flynn, A.C.; Seed, P.T.; Briley, A.L.; O’Keeffe, M.; Godfrey, K.M.; Poston, L. Associations between dietary patterns, eating behaviours, and body composition and adiposity in 3-year-old children of mothers with obesity. Pediatr. Obes. 2020, 15, e12608. [Google Scholar] [CrossRef] [PubMed]
- Nasreddine, L.; Shatila, H.; Itani, L.; Hwalla, N.; Jomaa, L.; Naja, F. A traditional dietary pattern is associated with lower odds of overweight and obesity among preschool children in Lebanon: A cross-sectional study. Eur. J. Nutr. 2019, 58, 91–102. [Google Scholar] [CrossRef] [PubMed]
- Vieira-Ribeiro, S.A.; Andreoli, C.S.; Fonseca, P.C.A.; Hermsdorff, H.H.M.; Pereira, P.F.; Ribeiro, A.Q.; Priore, S.E.; Franceschini, S.C.C. Dietary patterns and body adiposity in children in Brazil: A cross-sectional study. Public Health 2019, 166, 140–147. [Google Scholar] [CrossRef]
- Bell, L.K.; Golley, R.K.; Daniels, L.; Magarey, A.M. Dietary patterns of Australian children aged 14 and 24 months, and associations with socio-demographic factors and adiposity. Eur. J. Clin. Nutr. 2013, 67, 638–645. [Google Scholar] [CrossRef] [PubMed]
- Shroff, M.R.; Perng, W.; Baylin, A.; Mora-Plazas, M.; Marin, C.; Villamor, E. Adherence to a snacking dietary pattern and soda intake are related to the development of adiposity: A prospective study in school-age children. Public Health Nutr. 2014, 17, 1507–1513. [Google Scholar] [CrossRef] [PubMed]
- Fernandez-Alvira, J.M.; Bammann, K.; Eiben, G.; Hebestreit, A.; Kourides, Y.A.; Kovacs, E.; Michels, N.; Pala, V.; Reisch, L.; Russo, P.; et al. Prospective associations between dietary patterns and body composition changes in European children: The IDEFICS study. Public Health Nutr. 2017, 20, 3257–3265. [Google Scholar] [CrossRef][Green Version]
- Johnson, L.; Mander, A.P.; Jones, L.R.; Emmett, P.M.; Jebb, S.A. Energy-dense, low-fiber, high-fat dietary pattern is associated with increased fatness in childhood. Am. J. Clin. Nutr. 2008, 87, 846–854. [Google Scholar] [CrossRef]
- Durao, C.; Severo, M.; Oliveira, A.; Moreira, P.; Guerra, A.; Barros, H.; Lopes, C. Association between dietary patterns and adiposity from 4 to 7 years of age. Public Health Nutr. 2017, 20, 1973–1982. [Google Scholar] [CrossRef]
- Reilly, J.J.; Armstrong, J.; Dorosty, A.R.; Emmett, P.M.; Ness, A.; Rogers, I.; Steer, C.; Sherriff, A. Early life risk factors for obesity in childhood: Cohort study. BMJ 2005, 330, 1357. [Google Scholar] [CrossRef]
- Rashid, V.; Streppel, M.T.; Engberink, M.F.; Weijs, P.J.M.; Nicolaou, M.; Verhoeff, A.P. Weight development between age 5 and 10 years and its associations with dietary patterns at age 5 in the ABCD cohort. BMC Public Health 2020, 20, 427. [Google Scholar] [CrossRef]
- Luque, V.; Escribano, J.; Closa-Monasterolo, R.; Zaragoza-Jordana, M.; Ferré, N.; Grote, V.; Koletzko, B.; Totzauer, M.; Verduci, E.; ReDionigi, A.; et al. Unhealthy Dietary Patterns Established in Infancy Track to Mid-Childhood: The EU Childhood Obesity Project. J. Nutr. 2018, 148, 752–759. [Google Scholar] [CrossRef]
- Mikkilä, V.; Räsänen, L.; Raitakari, O.T.; Pietinen, P.; Viikari, J. Consistent dietary patterns identified from childhood to adulthood: The cardiovascular risk in Young Finns Study. Br. J. Nutr. 2005, 93, 923–931. [Google Scholar] [CrossRef] [PubMed]
- Lioret, S.; Betoko, A.; Forhan, A.; Charles, M.A.; Heude, B.; de Lauzon-Guillain, B. Dietary patterns track from infancy to preschool age: Cross-sectional and longitudinal perspectives. J. Nutr. 2015, 145, 775–782. [Google Scholar] [CrossRef] [PubMed]
- Bjelland, M.; Brantsæter, A.L.; Haugen, M.; Meltzer, H.M.; Nystad, W.; Andersen, L.F. Changes and tracking of fruit, vegetables and sugar-sweetened beverages intake from 18 months to 7 years in the Norwegian Mother and Child Cohort Study. BMC Public Health 2013, 13, 793. [Google Scholar] [CrossRef] [PubMed]
- L’Abée, C.; Sauer, P.J.; Damen, M.; Rake, J.P.; Cats, H.; Stolk, R.P. Cohort Profile: The GECKO Drenthe study, overweight programming during early childhood. Int. J. Epidemiol. 2008, 37, 486–489. [Google Scholar] [CrossRef] [PubMed][Green Version]
- Dutman, A.E.; Stafleu, A.; Kruizinga, A.; Brants, H.A.; Westerterp, K.R.; Kistemaker, C.; Meuling, W.J.; Goldbohm, R.A. Validation of an FFQ and options for data processing using the doubly labelled water method in children. Public Health Nutr. 2011, 14, 410–417. [Google Scholar] [CrossRef] [PubMed]
- RIVM/Voedingscentrum. NEVO-Tabel Nederlands Voedingsstoffenbestand; RIVM: Den Haag, The Netherlands, 2011. [Google Scholar]
- De Onis, M.; Garza, C.; Onyango, A.W.; Rolland-Cachera, M.F. WHO growth standards for infants and young children. Arch. Pediatr. 2009, 16, 47–53. [Google Scholar] [CrossRef] [PubMed]
- De Onis, M.; Onyango, A.W.; Borghi, E.; Siyam, A.; Nishida, C.; Siekmann, J. Development of a WHO growth reference for school-aged children and adolescents. Bull. World Health Organ. 2007, 85, 660–667. [Google Scholar] [CrossRef]
- Cole, T.J.; Lobstein, T. Extended international (IOTF) body mass index cut-offs for thinness, overweight and obesity. Pediatr. Obes. 2012, 7, 284–294. [Google Scholar] [CrossRef]
- Fredriks, A.M.; van Buuren, S.; Burgmeijer, R.J.F.; Verloove-Vanhorick, S.P.; de Wit, J.M. Groeidiagrammen 2010. Handleiding bij het Meten en Wegen van Kinderen en het Invullen van Groeidiagrammen; TNO: Leiden, The Netherlands, 2010. [Google Scholar]
- Northstone, K.; Emmett, P. Multivariate analysis of diet in children at four and seven years of age and associations with socio-demographic characteristics. Eur. J. Clin. Nutr. 2005, 59, 751–760. [Google Scholar] [CrossRef]
- North, K.; Emmett, P. Multivariate analysis of diet among three-year-old children and associations with socio-demographic characteristics. The Avon Longitudinal Study of Pregnancy and Childhood (ALSPAC) Study Team. Eur. J. Clin. Nutr. 2000, 54, 73–80. [Google Scholar] [CrossRef]
- Patrick, H.; Nicklas, T.A. A review of family and social determinants of children’s eating patterns and diet quality. J. Am. Coll. Nutr. 2005, 24, 83–92. [Google Scholar] [CrossRef] [PubMed]
- Statistics Netherlands (CBS). Level of Education. Available online: http://www.cbs.nl/en-GB/menu/methoden/toelichtingen/alfabet/l/level+of+education+1.htm (accessed on 12 February 2021).
- Stronks, K.; Kulu-Glasgow, I.; Agyemang, C. The utility of ‘country of birth’ for the classification of ethnic groups in health research: The Dutch experience. Ethn. Health 2009, 14, 255–269. [Google Scholar] [CrossRef] [PubMed]
- Villar, J.; Cheikh Ismail, L.; Victora, C.G.; Ohuma, E.O.; Bertino, E.; Altman, D.G.; Lambert, A.; Papageorghiou, A.T.; Carvalho, M.; Jaffer, Y.A.; et al. International standards for newborn weight, length, and head circumference by gestational age and sex: The Newborn Cross-Sectional Study of the INTERGROWTH-21st Project. Lancet 2014, 384, 857–868. [Google Scholar] [CrossRef]
- Birch, L.; Savage, J.S.; Ventura, A. Influences on the Development of Children’s Eating Behaviours: From Infancy to Adolescence. Can. J. Diet. Pract. Res. 2007, 68, s1–s56. [Google Scholar]
- Powell, F.; Farrow, C.; Meyer, C.; Haycraft, E. The Stability and Continuity of Maternally Reported and Observed Child Eating Behaviours and Feeding Practices across Early Childhood. Int. J. Environ. Res. Public Health 2018, 15, 1017. [Google Scholar] [CrossRef]
- Cecil, J.E.; Palmer, C.N.; Wrieden, W.; Murrie, I.; Bolton-Smith, C.; Watt, P.; Wallis, D.J.; Hetherington, M.M. Energy intakes of children after preloads: Adjustment, not compensation. Am. J. Clin. Nutr. 2005, 82, 302–308. [Google Scholar] [CrossRef]
- Northstone, K.; Emmett, P.M. Are dietary patterns stable throughout early and mid-childhood? A birth cohort study. Br. J. Nutr. 2008, 100, 1069–1076. [Google Scholar] [CrossRef]
- Craig, L.C.; McNeill, G.; Macdiarmid, J.I.; Masson, L.F.; Holmes, B.A. Dietary patterns of school-age children in Scotland: Association with socio-economic indicators, physical activity and obesity. Br. J. Nutr. 2010, 103, 319–334. [Google Scholar] [CrossRef]
- Zhen, S.; Ma, Y.; Zhao, Z.; Yang, X.; Wen, D. Dietary pattern is associated with obesity in Chinese children and adolescents: Data from China Health and Nutrition Survey (CHNS). Nutr. J. 2018, 17, 68. [Google Scholar] [CrossRef]
- Brink, E.; van Rossum, C.; Postma-Smeets, A.; Stafleu, A.; Wolvers, D.; van Dooren, C.; Toxopeus, I.; Buurma-Rethans, E.; Geurts, M.; Ocké, M. Development of healthy and sustainable food-based dietary guidelines for the Netherlands. Public Health Nutr. 2019, 22, 2419–2435. [Google Scholar] [CrossRef]
- Rashid, V.; Engberink, M.F.; van Eijsden, M.; Nicolaou, M.; Dekker, L.H.; Verhoeff, A.P.; Weijs, P.J.M. Ethnicity and socioeconomic status are related to dietary patterns at age 5 in the Amsterdam born children and their development (ABCD) cohort. BMC Public Health 2018, 18, 115. [Google Scholar] [CrossRef]
- Gibney, M.J. Ultra-Processed Foods: Definitions and Policy Issues. Curr. Dev. Nutr. 2019, 3, nzy077. [Google Scholar] [CrossRef]
- Viskaal-van Dongen, M.; Kok, F.J.; de Graaf, C. Eating rate of commonly consumed foods promotes food and energy intake. Appetite 2011, 56, 25–31. [Google Scholar] [CrossRef]
- Jebb, S.A. Dietary determinants of obesity. Obes. Rev. 2007, 8 (Suppl. S1), 93–97. [Google Scholar] [CrossRef]
- Hall, K.D.; Ayuketah, A.; Brychta, R.; Cai, H.; Cassimatis, T.; Chen, K.Y.; Chung, S.T.; Costa, E.; Courville, A.; Darcey, V.; et al. Ultra-Processed Diets Cause Excess Calorie Intake and Weight Gain: An Inpatient Randomized Controlled Trial of Ad Libitum Food Intake. Cell Metab. 2019, 30, 67–77.e63. [Google Scholar] [CrossRef] [PubMed]
- Forde, C.G.; Mars, M.; de Graaf, K. Ultra-Processing or Oral Processing? A Role for Energy Density and Eating Rate in Moderating Energy Intake from Processed Foods. Curr. Dev. Nutr. 2020, 4, nzaa019. [Google Scholar] [CrossRef]
- Khandpur, N.; Neri, D.A.; Monteiro, C.; Mazur, A.; Frelut, M.L.; Boyland, E.; Weghuber, D.; Thivel, D. Ultra-Processed Food Consumption among the Paediatric Population: An Overview and Call to Action from the European Childhood Obesity Group. Ann. Nutr. Metab. 2020, 76, 109–113. [Google Scholar] [CrossRef] [PubMed]
- Wiersma, R.; Hartman, E.; Boezen, H.M.; Corpeleijn, E. Adiposity and High Blood Pressure during Childhood: A Prospective Analysis of the Role of Physical Activity Intensity and Sedentary Time in the GECKO Drenthe Cohort. Int. J. Environ. Res. Public Health 2020, 17, 9526. [Google Scholar] [CrossRef] [PubMed]
- Olafsdottir, A.S.; Thorsdottir, I.; Gunnarsdottir, I.; Thorgeirsdottir, H.; Steingrimsdottir, L. Comparison of women’s diet assessed by FFQs and 24-hour recalls with and without underreporters: Associations with biomarkers. Ann. Nutr. Metab. 2006, 50, 450–460. [Google Scholar] [CrossRef] [PubMed]
Publisher’s Note: MDPI stays neutral with regard to jurisdictional claims in published maps and institutional affiliations. |
© 2021 by the authors. Licensee MDPI, Basel, Switzerland. This article is an open access article distributed under the terms and conditions of the Creative Commons Attribution (CC BY) license (https://creativecommons.org/licenses/by/4.0/).