
Identification and Validation of Nutrient State-Dependent Serum Protein Mediators of Human CD4+ T Cell Responsiveness

 ,
,  ,
,  ,
,  and
and 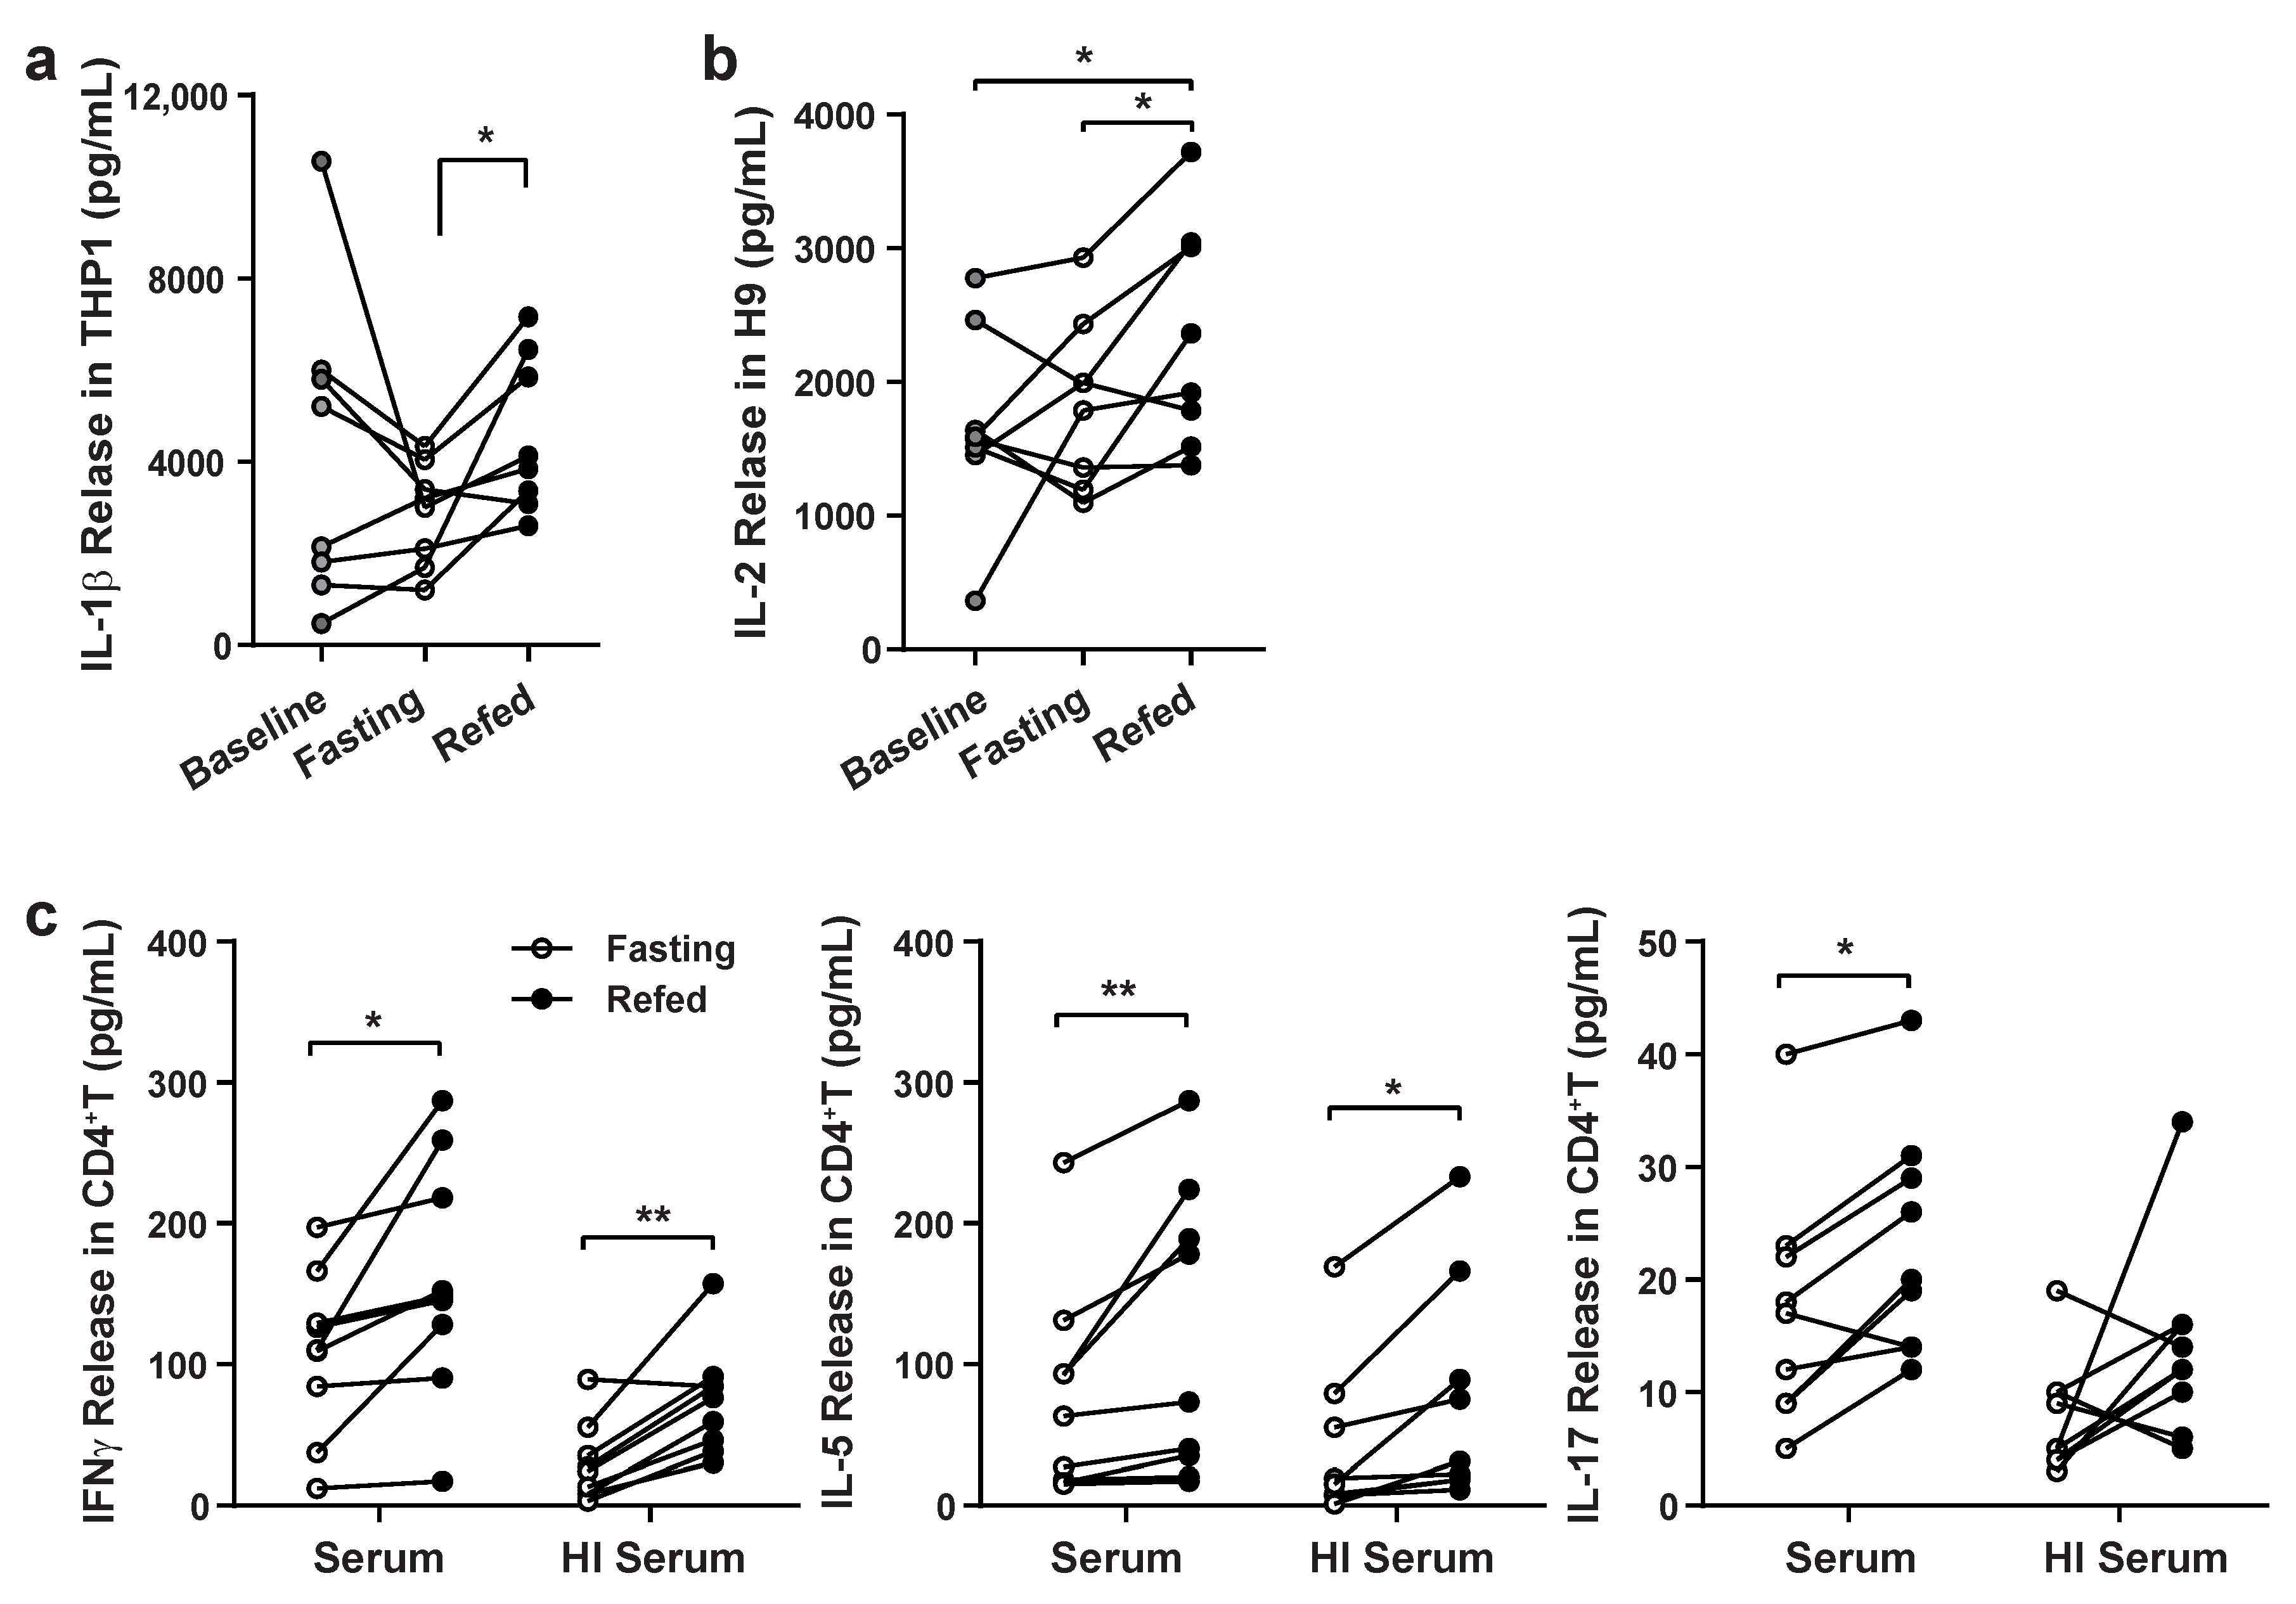
Abstract
1. Introduction
2. Material and Methods
2.1. Study Design and Subjects
2.2. Blood Preparation and Bioassay
2.3. PBMC RNAseq Analysis
RNA Sequencing and Bioinformatics Analysis
2.4. Cell Culture and Transfection
2.5. Cell Stimulation and Cytokine Assays
2.6. SOMAscan Assay and Data Analysis
2.7. Quantitative PCR Analysis
2.8. Statistical Analysis
3. Results
3.1. Validation of Paracrine Effects of Fasting and Refeeding Serum on Immune Cell Responsiveness
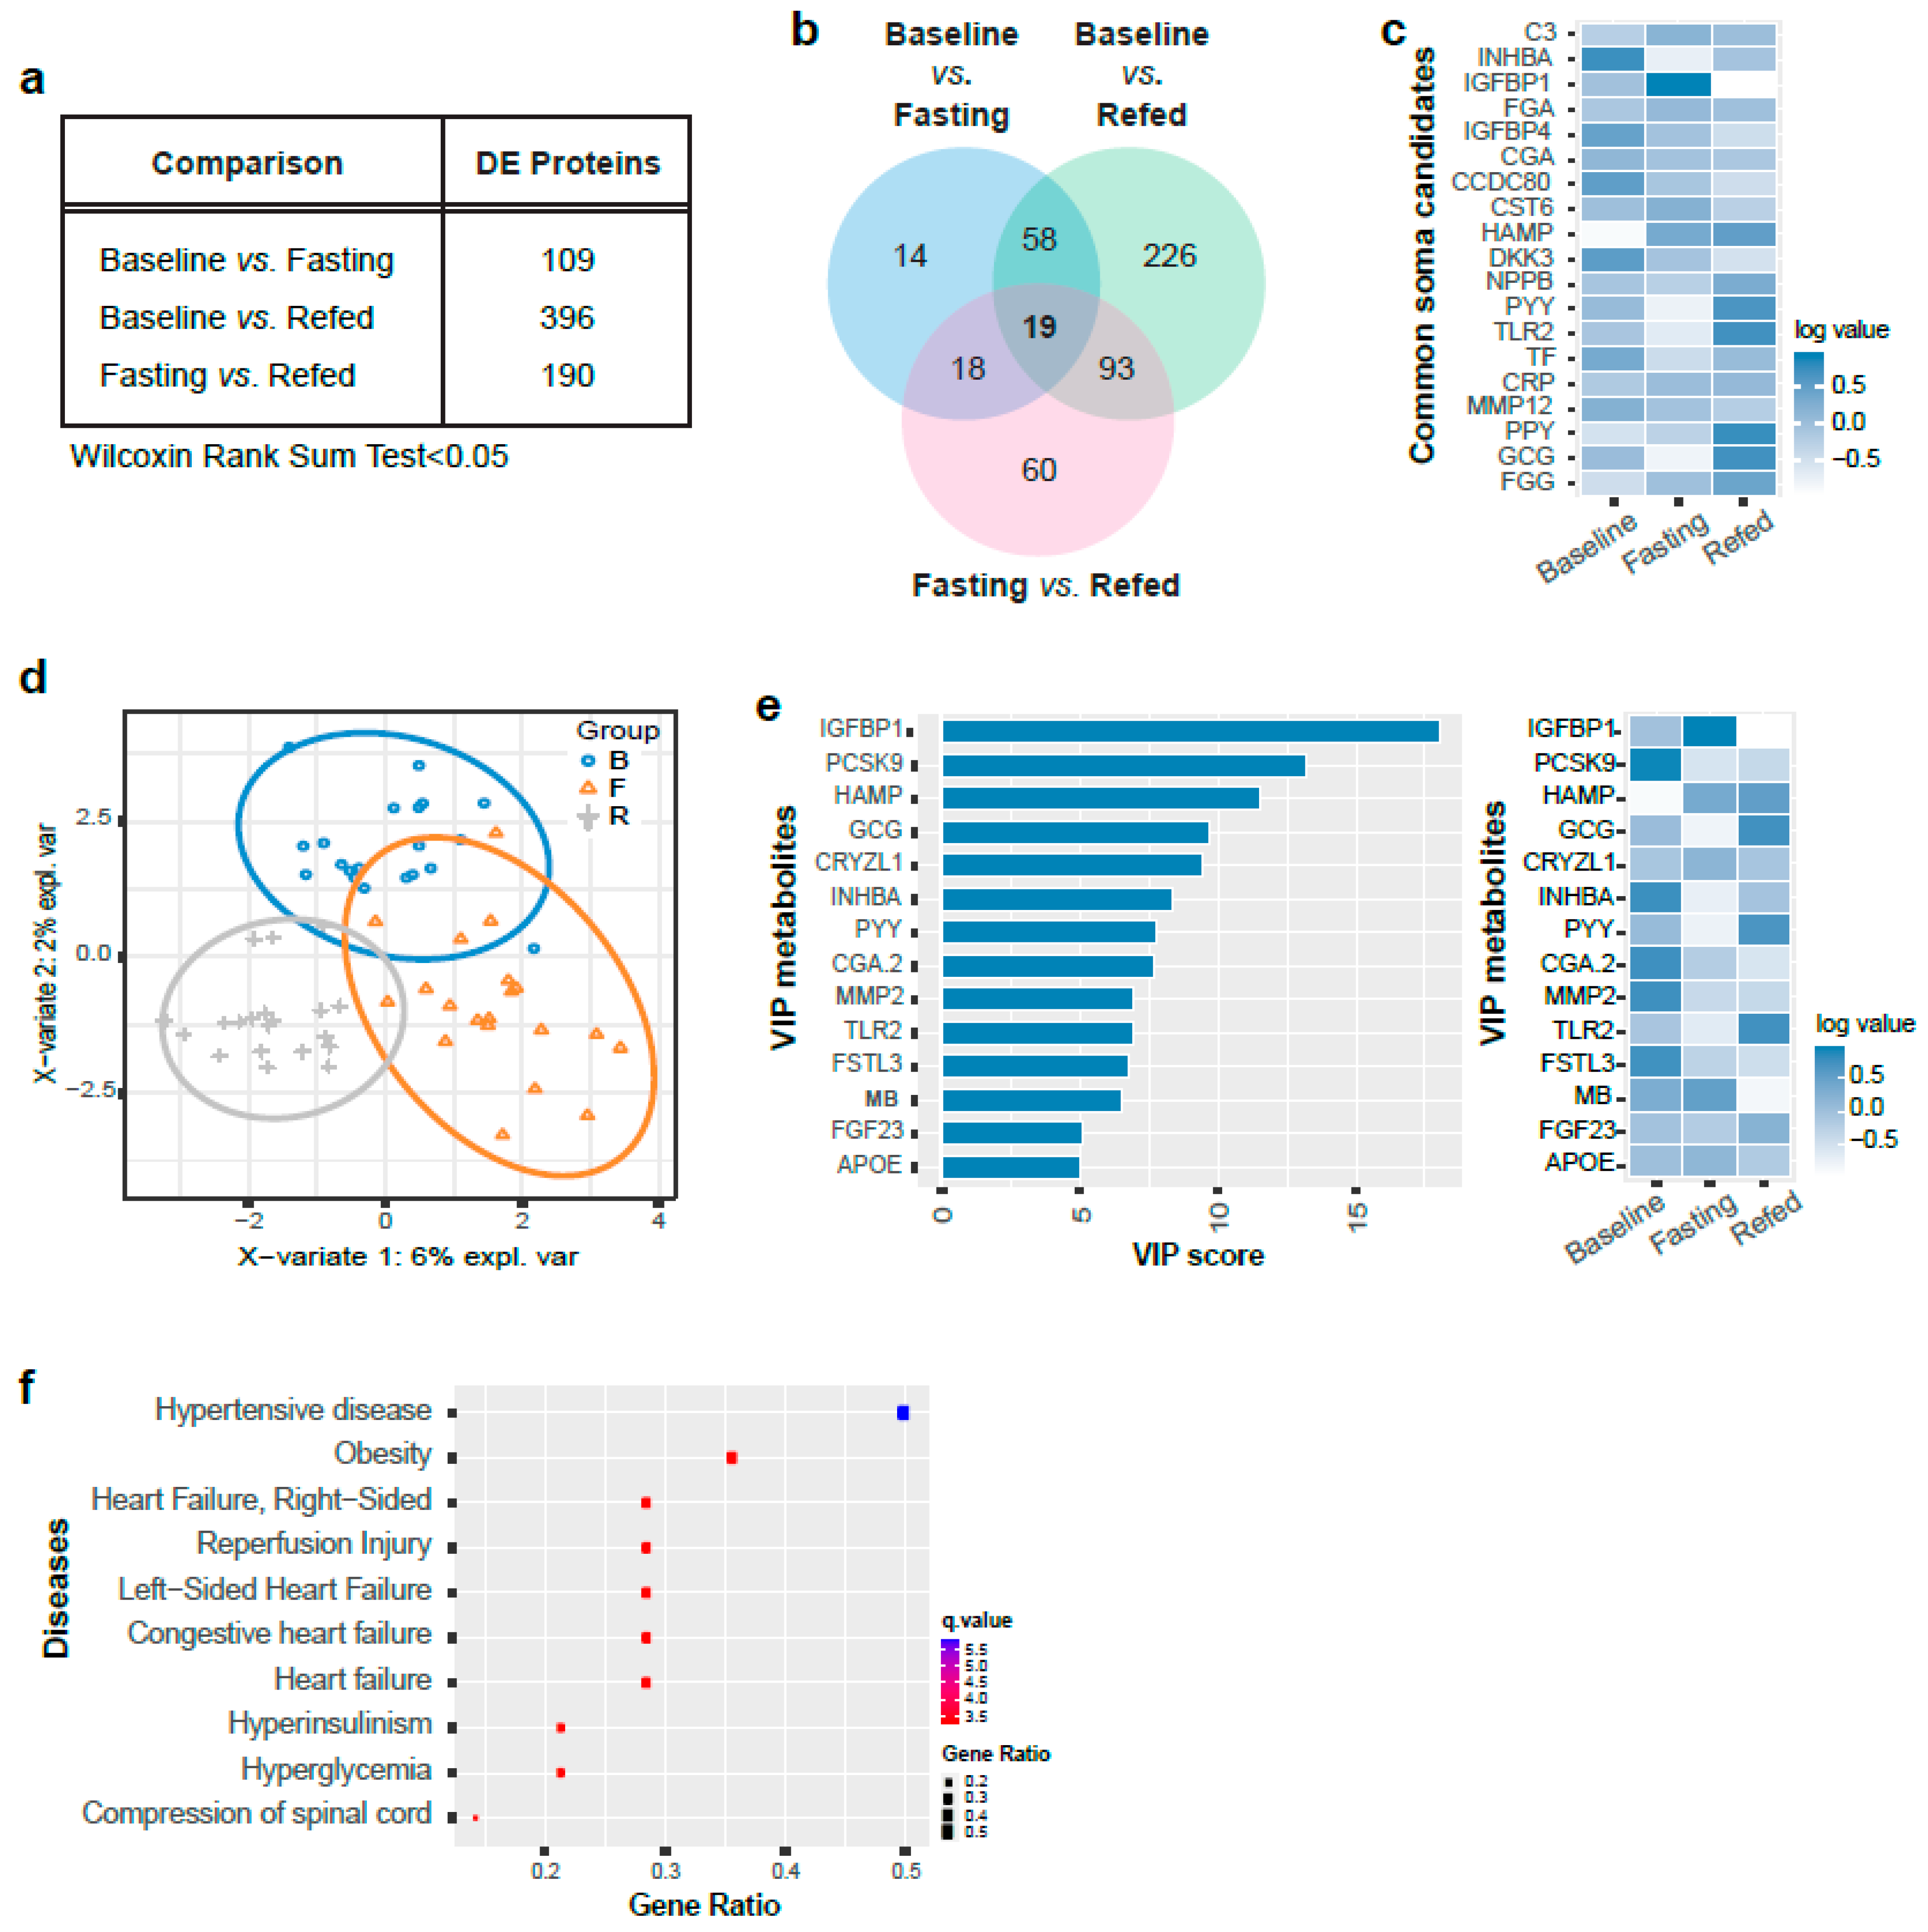
3.2. SomaLogic Serum Proteomic Analysis Identified Candidate Differentially Expressed Peptides from the Three Nutritional States
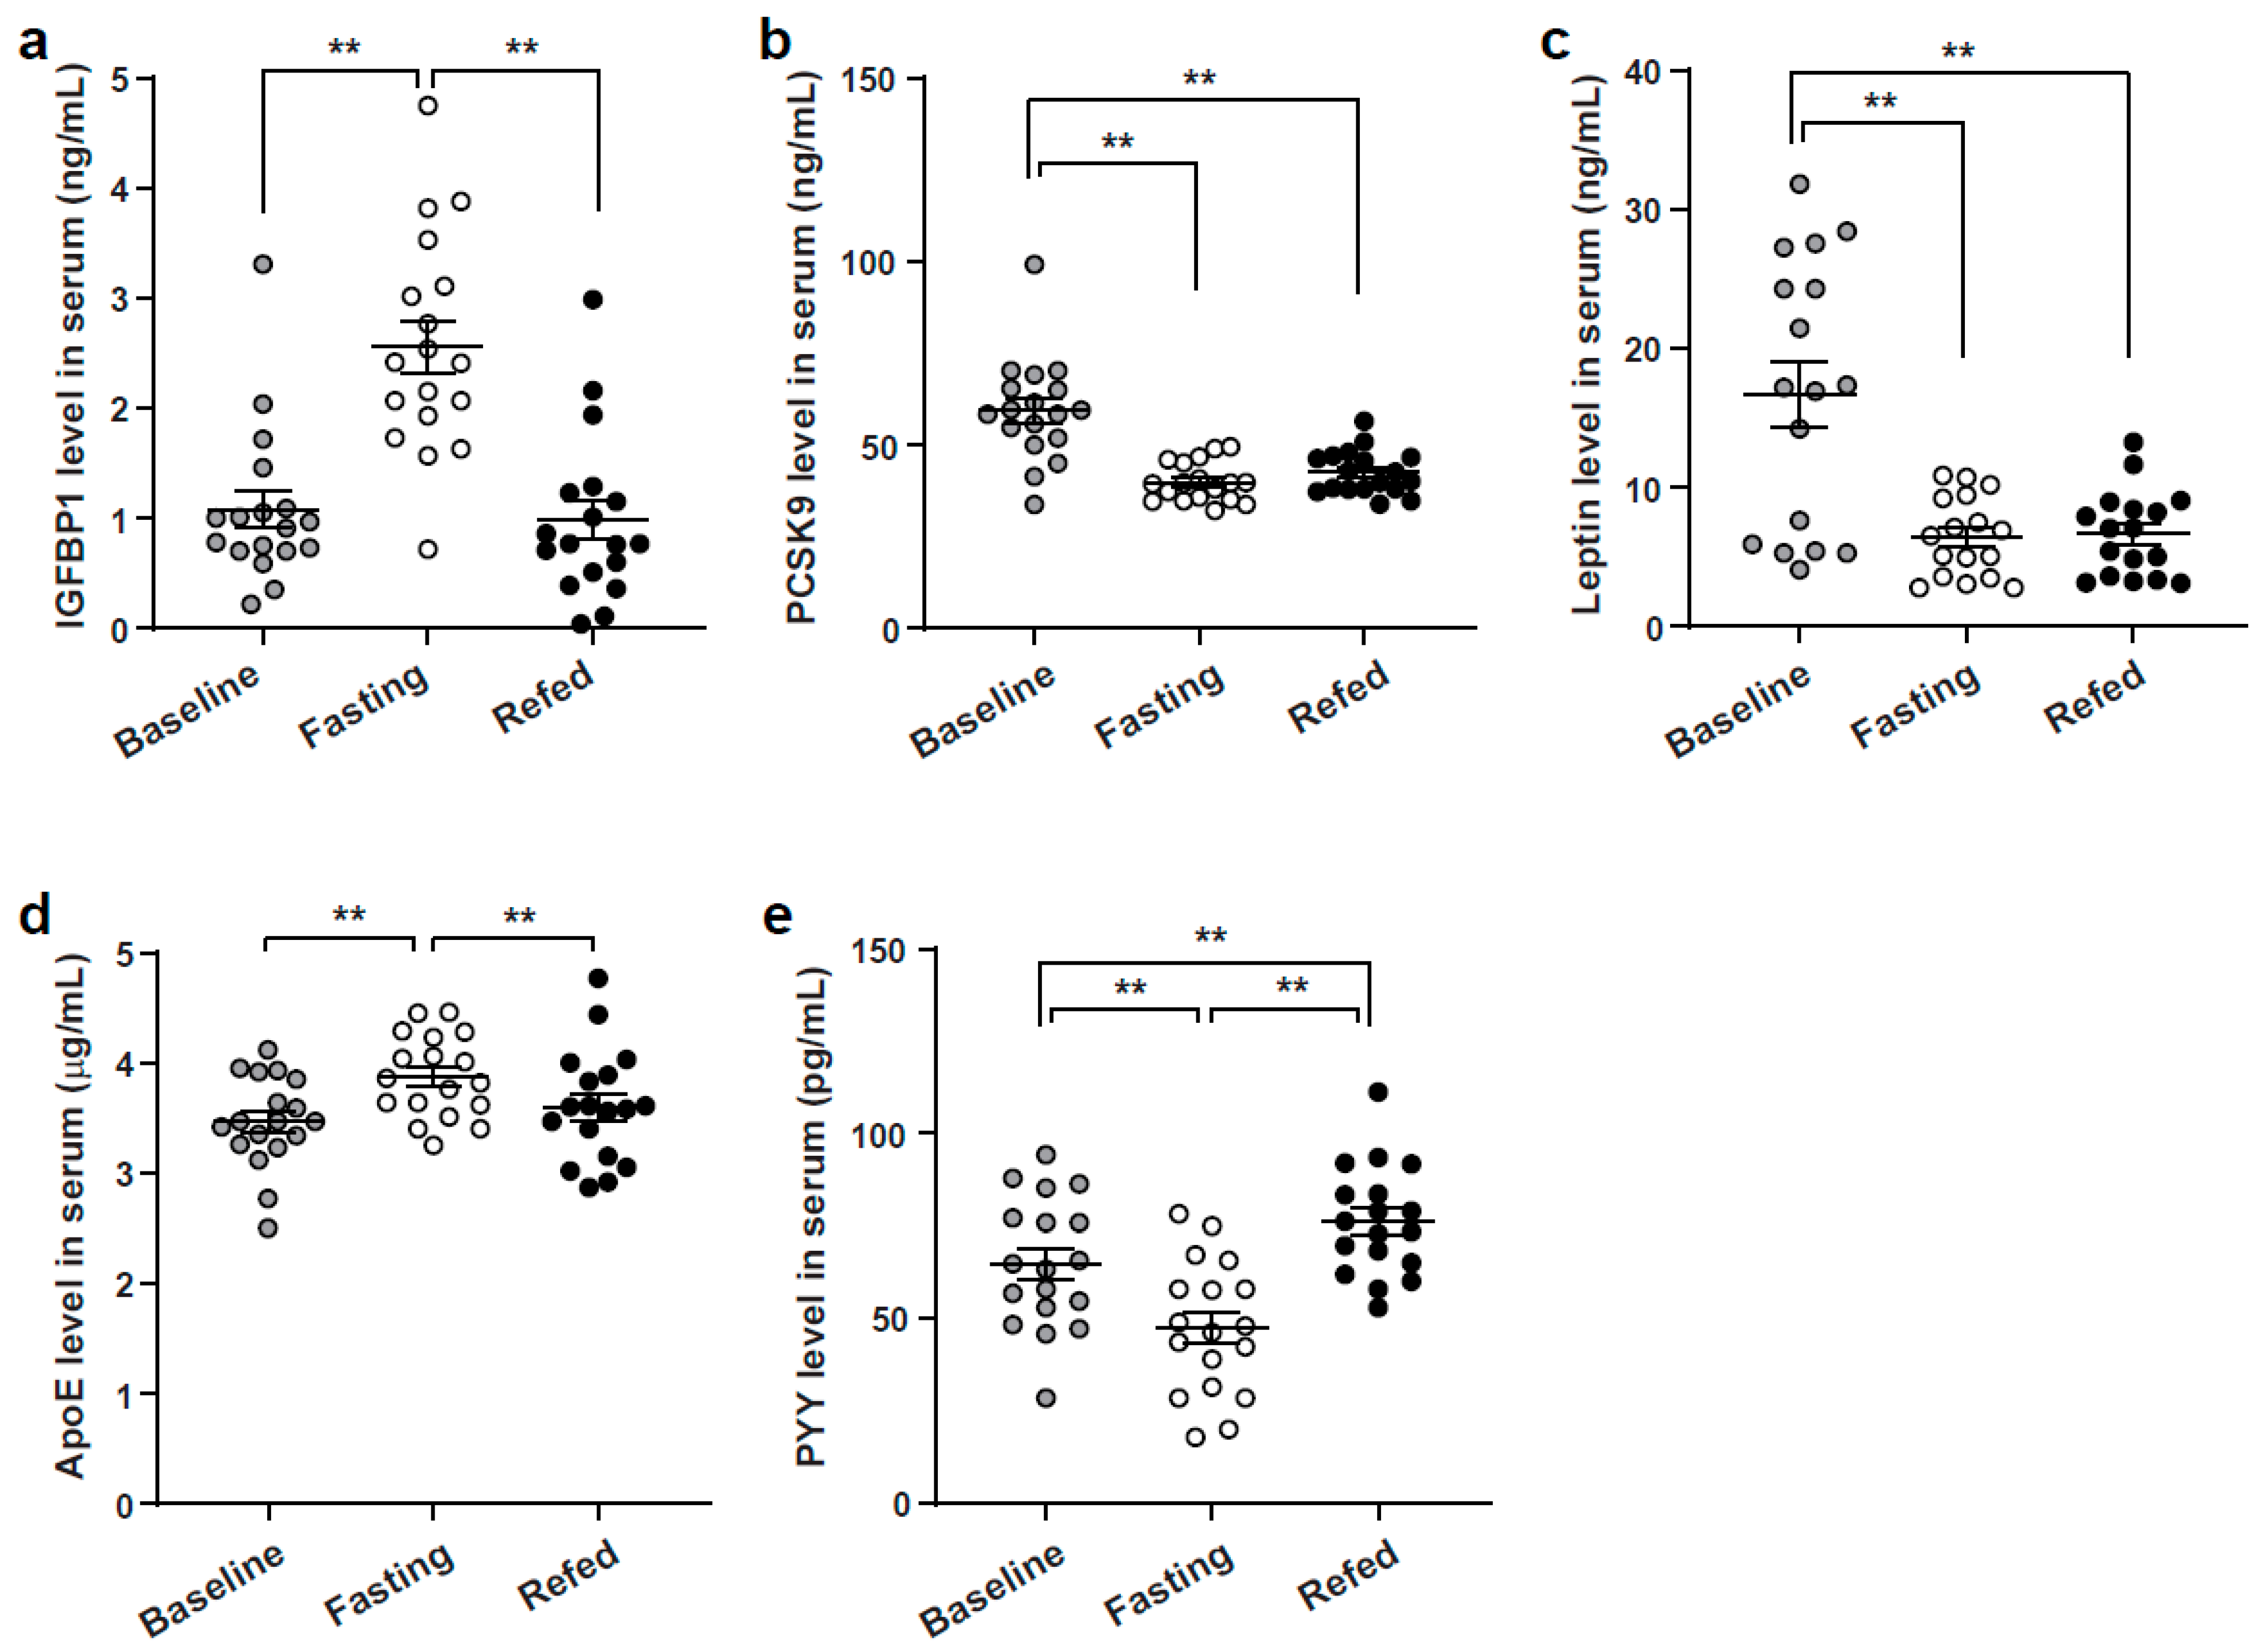
3.3. Enzyme-Linked Immunoassay Analysis Validation of Identified SOMAscan Candidate Peptides
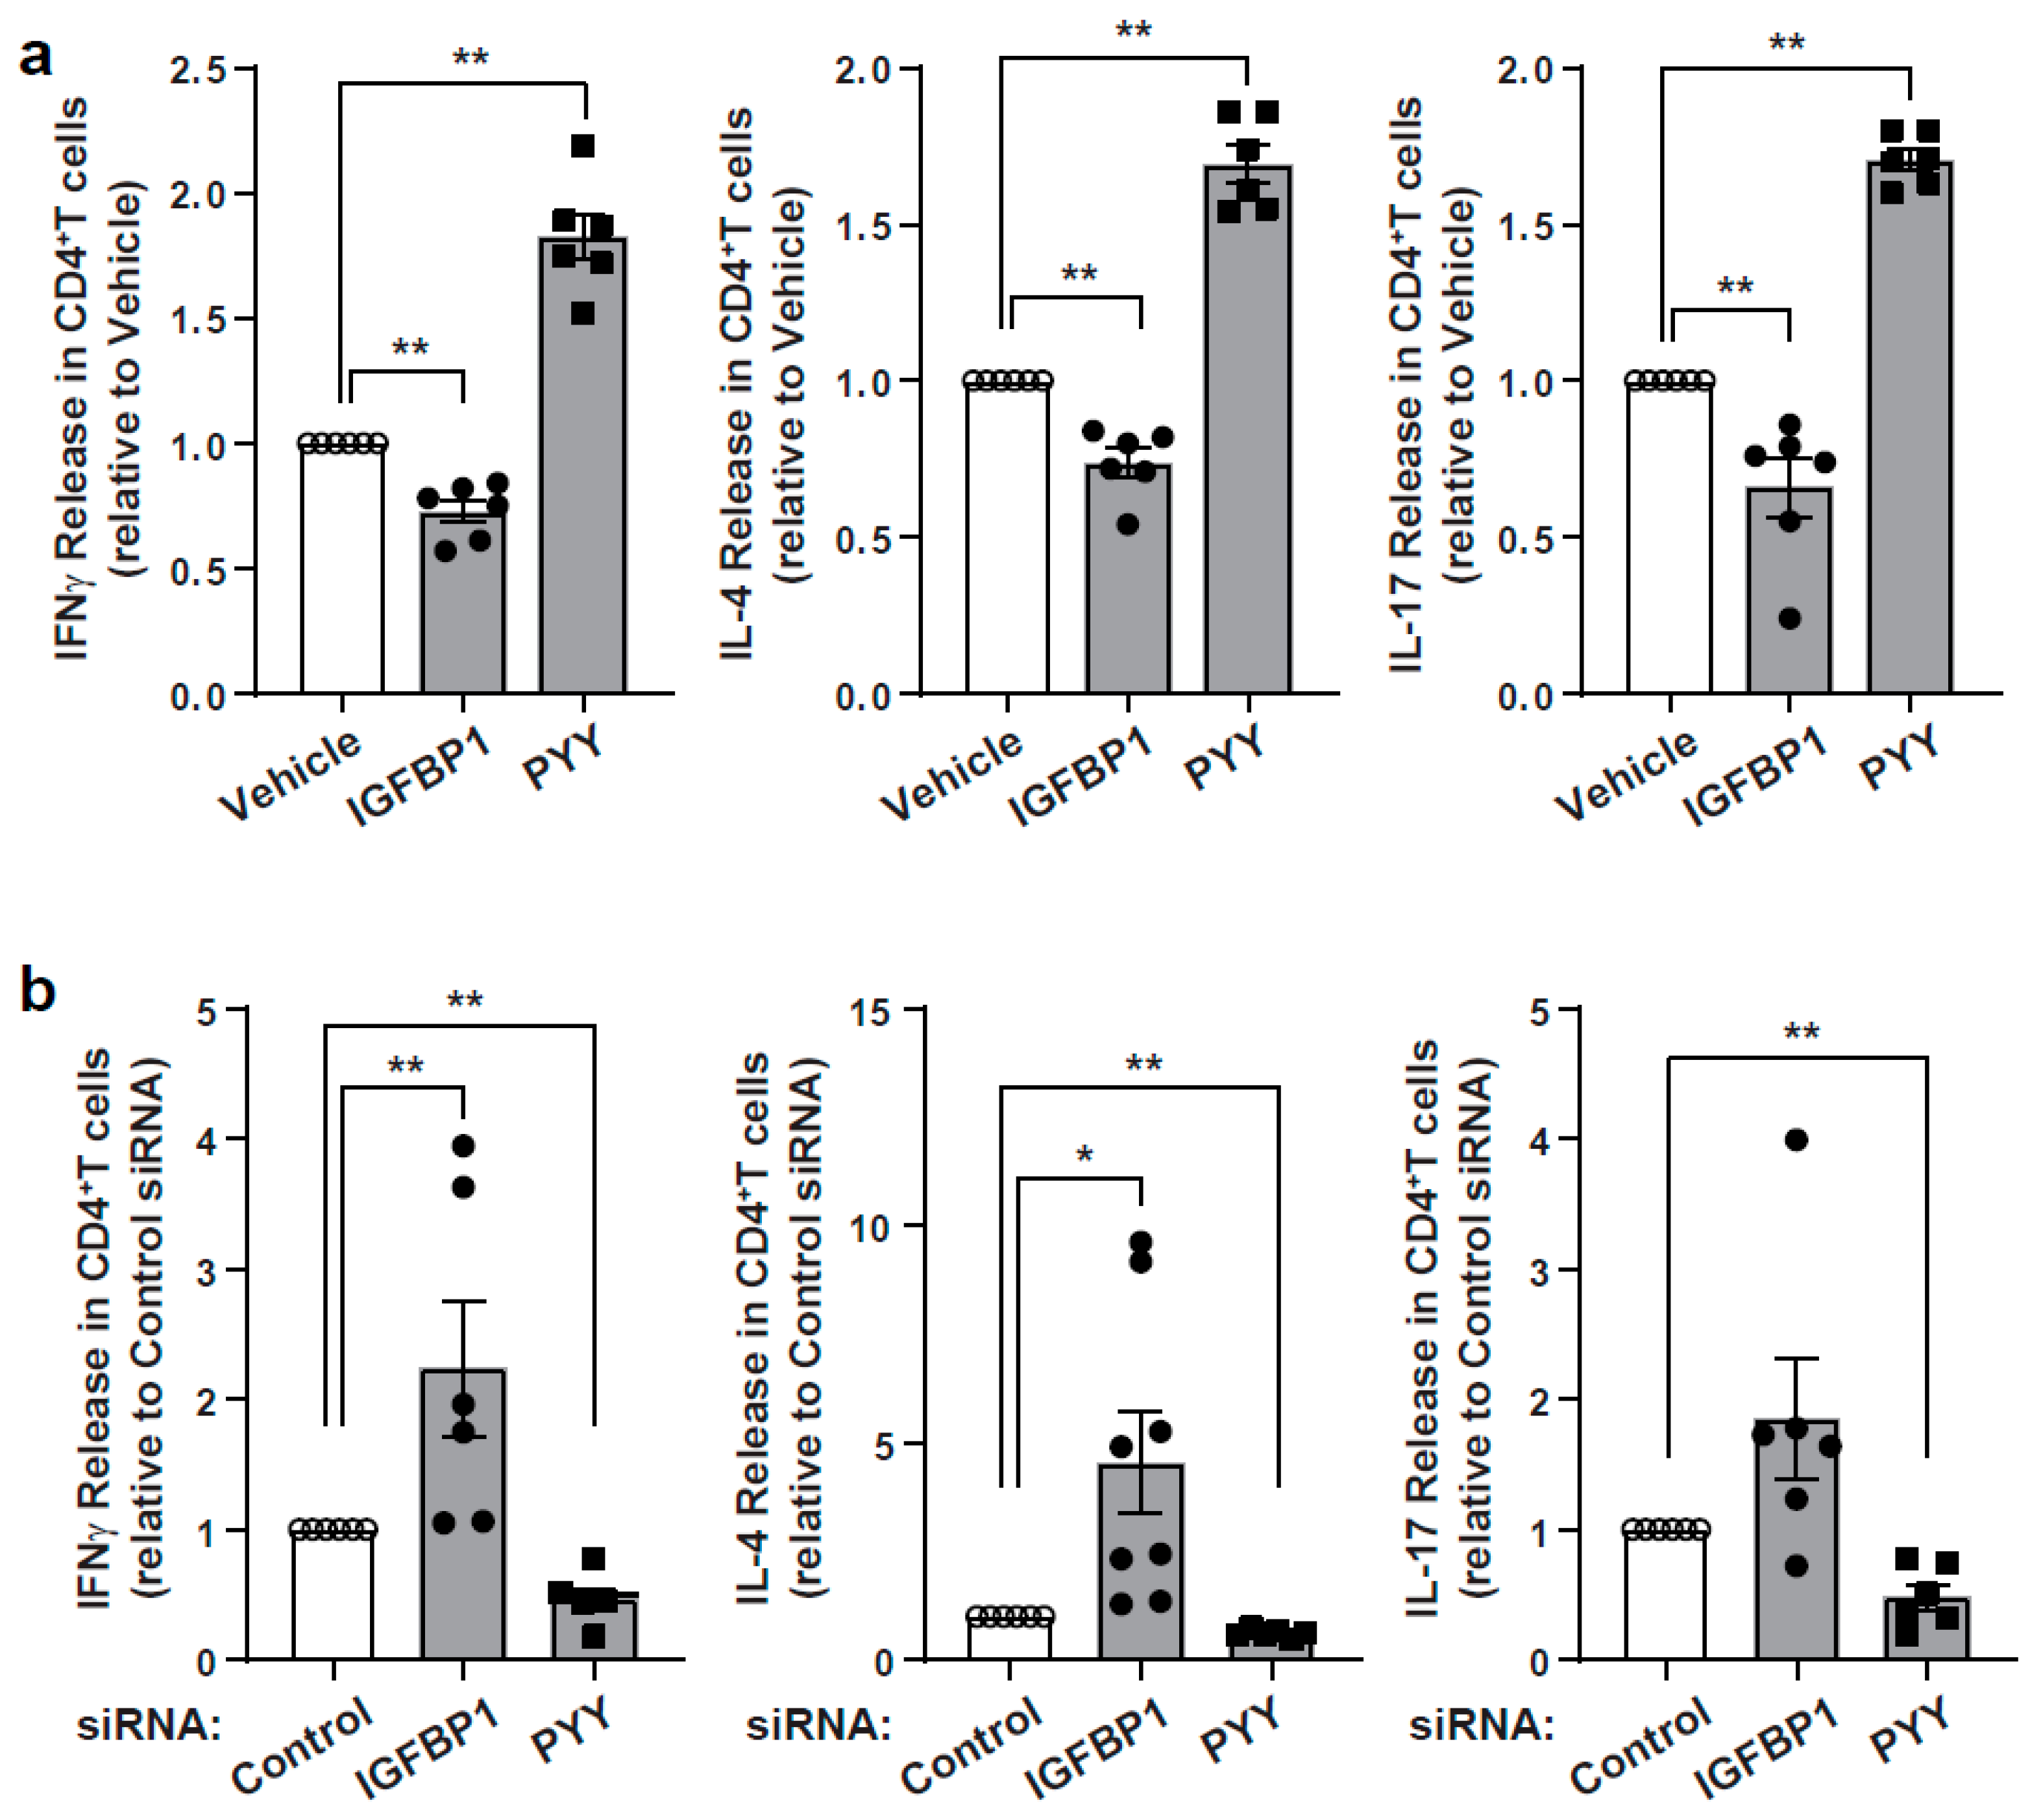
3.4. Characterization of Immunomodulatory Effects of IGFBP1 and PYY
3.5. Integration of SomaLogic and RNAseq Data to Identify Putative Interacting Pathways in the Modulation of T Cell Responsiveness
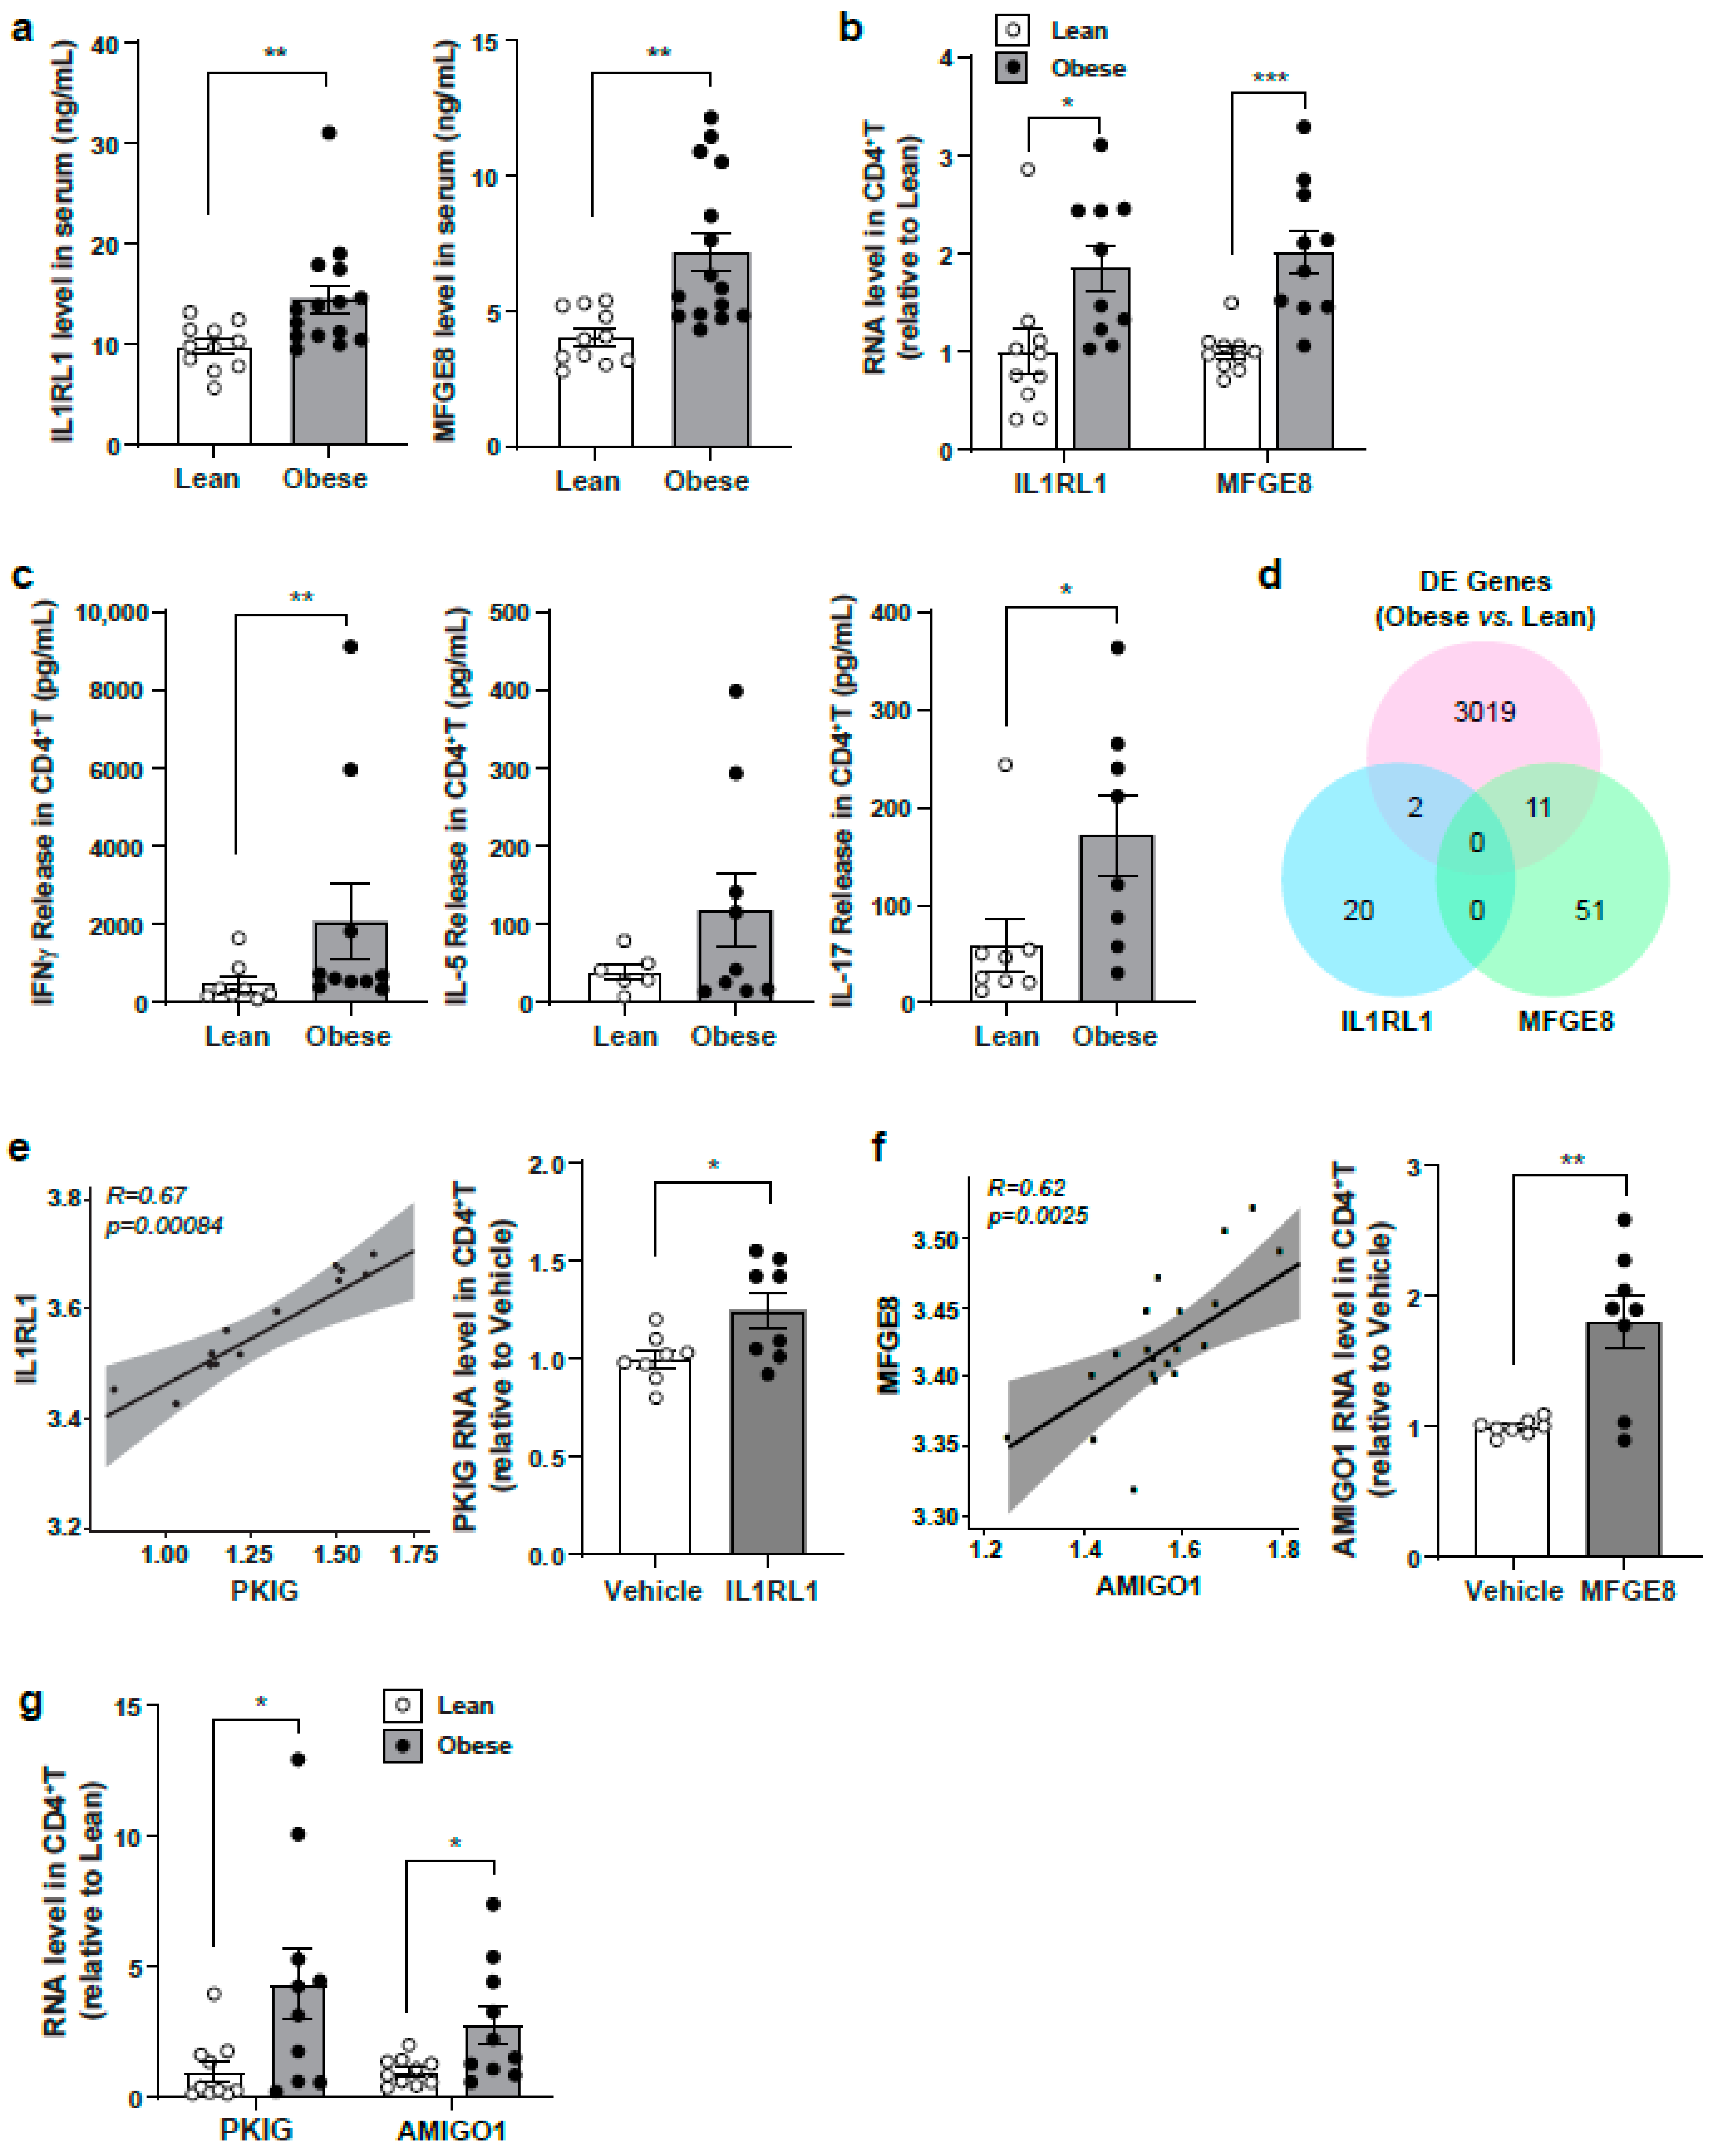
3.6. Evaluation of Identified Serum Protein Candidates in a Lean Versus Obese Subject Cohort
4. Discussion
5. Conclusions
Supplementary Materials
Author Contributions
Funding
Institutional Review Board Statements
Informed Consent
Data Availability Statement
Acknowledgments
Conflicts of Interest
References
- Piccio, L.; Stark, J.L.; Cross, A.H. Chronic calorie restriction attenuates experimental autoimmune encephalomyelitis. J. Leukoc. Biol. 2008, 84, 940–948. [Google Scholar] [CrossRef] [PubMed]
- Vasconcelos, A.R.; Yshii, L.M.; A Viel, T.; Buck, H.S.; Mattson, M.P.; Scavone, C.; Kawamoto, E.M. Intermittent fasting attenuates lipopolysaccharide-induced neuroinflammation and memory impairment. J. Neuroinflamm. 2014, 11, 85. [Google Scholar] [CrossRef] [PubMed]
- Choi, I.Y.; Piccio, L.; Childress, P.; Bollman, B.; Ghosh, A.; Brandhorst, S.; Suarez, J.; Michalsen, A.; Cross, A.H.; Morgan, T.E.; et al. A Diet Mimicking Fasting Promotes Regeneration and Reduces Autoimmunity and Multiple Sclerosis Symptoms. Cell Rep. 2016, 15, 2136–2146. [Google Scholar] [CrossRef] [PubMed]
- Traba, J.; Geiger, S.S.; Kwarteng-Siaw, M.; Han, K.; Ra, O.H.; Siegel, R.M.; Gius, D.; Sack, M.N. Prolonged fasting suppresses mitochondrial NLRP3 inflammasome assembly and activation via SIRT3-mediated activation of superoxide dismutase 2. J. Biol. Chem. 2017, 292, 12153–12164. [Google Scholar] [CrossRef]
- Fontana, L.; Meyer, T.E.; Klein, S.; Holloszy, J.O. Long-term calorie restriction is highly effective in reducing the risk for atherosclerosis in humans. Proc. Natl. Acad. Sci. USA 2004, 101, 6659–6663. [Google Scholar] [CrossRef] [PubMed]
- Traba, J.; Kwarteng-Siaw, M.; Okoli, T.C.; Li, J.; Huffstutler, R.D.; Bray, A.; Waclawiw, M.A.; Han, K.; Pelletier, M.; Sauve, A.A.; et al. Fasting and refeeding differentially regulate NLRP3 inflammasome activation in human subjects. J. Clin. Investig. 2015, 125, 4592–4600. [Google Scholar] [CrossRef] [PubMed]
- Brandhorst, S.; Choi, I.Y.; Wei, M.; Cheng, C.W.; Sedrakyan, S.; Navarrete, G.; Dubeau, L.; Yap, L.P.; Park, R.; Vinciguerra, M.; et al. A Periodic Diet that Mimics Fasting Promotes Multi-System Regeneration, Enhanced Cognitive Performance, and Healthspan. Cell Metab. 2015, 22, 86–99. [Google Scholar] [CrossRef]
- Meydani, S.N.; Das, S.K.; Pieper, C.F.; Lewis, M.R.; Klein, S.; Dixit, V.D.; Gupta, A.K.; Villareal, D.T.; Bhapkar, M.; Huang, M.; et al. Long-term moderate calorie restriction inhibits inflammation without impairing cell-mediated immunity: A randomized controlled trial in non-obese humans. Aging 2016, 8, 1416–1431. [Google Scholar] [CrossRef]
- Wei, M.; Brandhorst, S.; Shelehchi, M.; Mirzaei, H.; Cheng, C.W.; Budniak, J.; Groshen, S.; Mack, W.J.; Guen, E.; Di Biase, S.; et al. Fasting-mimicking diet and markers/risk factors for aging, diabetes, cancer, and cardiovascular disease. Sci. Transl. Med. 2017, 9, eaai8700. [Google Scholar] [CrossRef]
- A Fraser, D.; Thoen, J.; Djøseland, O.; Førre, O.; Kjeldsen-Kragh, J. Serum levels of interleukin-6 and dehydroepiandrosterone sulphate in response to either fasting or a ketogenic diet in rheumatoid arthritis patients. Clin. Exp. Rheumatol. 2000, 18, 357–362. [Google Scholar]
- Johnson, J.B.; Summer, W.; Cutler, R.G.; Martin, B.; Hyun, D.-H.; Dixit, V.D.; Pearson, M.; Nassar, M.; Tellejohan, R.; Maudsley, S.; et al. Alternate day calorie restriction improves clinical findings and reduces markers of oxidative stress and inflammation in overweight adults with moderate asthma. Free Radic. Biol. Med. 2007, 42, 665–674. [Google Scholar] [CrossRef]
- Han, K.; Nguyen, A.; Traba, J.; Yao, X.; Kaler, M.; Huffstutler, R.D.; Levine, S.J.; Sack, M.N. A Pilot Study to Investigate the Immune-Modulatory Effects of Fasting in Steroid-Naive Mild Asthmatics. J. Immunol. 2018, 201, 1382–1388. [Google Scholar] [CrossRef]
- Martinez-Lopez, N.; Tarabra, E.; Toledo, M.; Garcia-Macia, M.; Sahu, S.; Coletto, L.; Batista-Gonzalez, A.; Barzilai, N.; Pessin, J.E.; Schwartz, G.J.; et al. System-wide Benefits of Intermeal Fasting by Autophagy. Cell Metab. 2017, 26, 856–871.e5. [Google Scholar] [CrossRef] [PubMed]
- Zhang, C.; Li, S.; Yang, L.; Huang, P.; Li, W.; Wang, S.; Zhao, G.; Zhang, M.; Pang, X.; Yan, Z.; et al. Structural modulation of gut microbiota in life-long calorie-restricted mice. Nat. Commun. 2013, 4, 2163. [Google Scholar] [CrossRef] [PubMed]
- Griffin, N.W.; Ahern, P.P.; Cheng, J.; Heath, A.C.; Ilkayeva, O.; Newgard, C.B.; Fontana, L.; Gordon, J.I. Prior Dietary Practices and Connections to a Human Gut Microbial Metacommunity Alter Responses to Diet Interventions. Cell Host Microbe 2017, 21, 84–96. [Google Scholar] [CrossRef] [PubMed]
- Cignarella, F.; Cantoni, C.; Ghezzi, L.; Salter, A.; Dorsett, Y.; Chen, L.; Phillips, D.; Weinstock, G.M.; Fontana, L.; Cross, A.H.; et al. Intermittent Fasting Confers Protection in CNS Autoimmunity by Altering the Gut Microbiota. Cell Metab. 2018, 27, 1222–1235.e6. [Google Scholar] [CrossRef]
- Suárez-Souto, M.A.; Lara-Padilla, E.; Reyna-Garfias, H.; Viloria, M.; López-Sánchez, P.; Rivera-Aguilar, V.; Miliar-García, Á.; Kormanovski, A.; Domínguez-López, M.L.; Campos-Rodríguez, R. Caloric restriction modifies both innate and adaptive immunity in the mouse small intestine. J. Physiol. Biochem. 2011, 68, 163–173. [Google Scholar] [CrossRef] [PubMed]
- Nagai, M.; Noguchi, R.; Takahashi, D.; Morikawa, T.; Koshida, K.; Komiyama, S.; Ishihara, N.; Yamada, T.; Kawamura, Y.I.; Muroi, K.; et al. Fasting-Refeeding Impacts Immune Cell Dynamics and Mucosal Immune Responses. Cell 2019, 178, 1072–1087.e14. [Google Scholar] [CrossRef]
- Miyauchi, T.; Uchida, Y.; Kadono, K.; Hirao, H.; Kawasoe, J.; Watanabe, T.; Ueda, S.; Okajima, H.; Terajima, H.; Uemoto, S. Up-regulation of FOXO1 and reduced inflammation by β-hydroxybutyric acid are essential diet restriction benefits against liver injury. Proc. Natl. Acad. Sci. USA 2019, 116, 13533–13542. [Google Scholar] [CrossRef]
- Buono, R.; Longo, V.D. When Fasting Gets Tough, the Tough Immune Cells Get Going—or Die. Cell 2019, 178, 1038–1040. [Google Scholar] [CrossRef]
- Youm, Y.-H.; Nguyen, K.Y.; Grant, R.W.; Goldberg, E.L.; Bodogai, M.; Kim, D.; D’Agostino, D.; Planavsky, N.J.; Lupfer, C.; Kanneganti, T.D.; et al. The ketone metabolite β-hydroxybutyrate blocks NLRP3 inflammasome–mediated inflammatory disease. Nat. Med. 2015, 21, 263–269. [Google Scholar] [CrossRef]
- Cheng, C.-W.; Adams, G.B.; Perin, L.; Wei, M.; Zhou, X.; Lam, B.S.; Da Sacco, S.; Mirisola, M.; Quinn, D.I.; Dorff, T.B.; et al. Prolonged Fasting Reduces IGF-1/PKA to Promote Hematopoietic-Stem-Cell-Based Regeneration and Reverse Immunosuppression. Cell Stem Cell 2014, 14, 810–823. [Google Scholar] [CrossRef] [PubMed]
- Di Biase, S.; Lee, C.; Brandhorst, S.; Manes, B.; Buono, R.; Cheng, C.-W.; Cacciottolo, M.; Martin-Montalvo, A.; De Cabo, R.; Wei, M.; et al. Fasting-Mimicking Diet Reduces HO-1 to Promote T Cell-Mediated Tumor Cytotoxicity. Cancer Cell 2016, 30, 136–146. [Google Scholar] [CrossRef] [PubMed]
- Mitchell, S.J.; Bernier, M.; Mattison, J.A.; Aon, M.A.; Kaiser, T.A.; Anson, R.M.; Ikeno, Y.; Anderson, R.M.; Ingram, D.K.; De Cabo, R. Daily Fasting Improves Health and Survival in Male Mice Independent of Diet Composition and Calories. Cell Metab. 2019, 29, 221–228.e3. [Google Scholar] [CrossRef]
- Christ, A.; Günther, P.; Lauterbach, M.A.; Duewell, P.; Biswas, D.; Pelka, K.; Scholz, C.J.; Oosting, M.; Haendler, K.; Baßler, K.; et al. Western Diet Triggers NLRP3-Dependent Innate Immune Reprogramming. Cell 2018, 172, 162–175.e14. [Google Scholar] [CrossRef]
- Sutton, E.F.; Beyl, R.; Early, K.S.; Cefalu, W.T.; Ravussin, E.; Peterson, C.M. Early time-restricted feeding improves insulin sensitivity, blood pressure, and oxidative stress even without weight loss in men with prediabetes. Cell Metab. 2018, 27, 1212–1221.e3. [Google Scholar] [CrossRef] [PubMed]
- Calabrese, E.J.; A Baldwin, L. Defining hormesis. Hum. Exp. Toxicol. 2002, 21, 91–97. [Google Scholar] [CrossRef] [PubMed]
- Yun, J.; Finkel, T. Mitohormesis. Cell Metab. 2014, 19, 757–766. [Google Scholar] [CrossRef]
- Mattson, M.P. Dietary factors, hormesis and health. Ageing Res. Rev. 2008, 7, 43–48. [Google Scholar] [CrossRef]
- Calabrese, E.J.; Giordano, J.J.; Kozumbo, W.J.; Leak, R.K.; Bhatia, T.N. Hormesis Mediates Dose-Sensitive Shifts in Macrophage Activation Patterns. Pharmacol. Res. 2018, 137, 236–249. [Google Scholar] [CrossRef]
- Gucek, M.; Sack, M.N. Proteomic and metabolomic advances uncover biomarkers of mitochondrial disease pathophysiology and severity. J. Clin. Investig. 2021, 131, e145158. [Google Scholar] [CrossRef] [PubMed]
- Han, K.; Singh, K.; Rodman, M.J.; Hassanzadeh, S.; Wu, K.; Nguyen, A.; Huffstutler, R.D.; Seifuddin, F.; Dagur, P.K.; Saxena, A.; et al. Fasting-induced FOXO4 blunts human CD4+ T helper cell responsiveness. Nat. Metab. 2021, 3, 318–326. [Google Scholar] [CrossRef] [PubMed]
- Bolger, A.M.; Lohse, M.; Usadel, B. Trimmomatic: A flexible trimmer for Illumina sequence data. Bioinformatics 2014, 30, 2114–2120. [Google Scholar] [CrossRef]
- Dobin, A.; Davis, C.A.; Schlesinger, F.; Drenkow, J.; Zaleski, C.; Jha, S.; Batut, P.; Chaisson, M.; Gingeras, T.R. STAR: Ultrafast universal RNA-seq aligner. Bioinformatics 2013, 29, 15–21. [Google Scholar] [CrossRef]
- Liao, Y.; Smyth, G.K.; Shi, W. featureCounts: An efficient general purpose program for assigning sequence reads to genomic features. Bioinformatics 2013, 30, 923–930. [Google Scholar] [CrossRef]
- Law, C.W.; Chen, Y.; Shi, W.; Smyth, G.K. voom: Precision weights unlock linear model analysis tools for RNA-seq read counts. Genome Biol. 2014, 15, R29. [Google Scholar] [CrossRef] [PubMed]
- Rohloff, J.C.; Gelinas, A.D.; Jarvis, T.C.; A Ochsner, U.; Schneider, D.J.; Gold, L.; Janjic, N. Nucleic Acid Ligands With Protein-like Side Chains: Modified Aptamers and Their Use as Diagnostic and Therapeutic Agents. Mol. Ther. Nucleic Acids 2014, 3, e201. [Google Scholar] [CrossRef]
- Candia, J.; Cheung, F.; Kotliarov, Y.; Fantoni, G.; Sellers, B.; Griesman, T.; Huang, J.; Stuccio, S.; Zingone, A.; Ryan, B.M.; et al. Assessment of Variability in the SOMAscan Assay. Sci. Rep. 2017, 7, 1–13. [Google Scholar] [CrossRef]
- Cheung, F.; Fantoni, G.; Conner, M.; Sellers, B.A.; Kotliarov, Y.; Candia, J.; Stagliano, K.; Biancotto, A. Web Tool for Navigating and Plotting SomaLogic ADAT Files. J. Open Res. Softw. 2017, 5. [Google Scholar] [CrossRef]
- Rohart, F.; Gautier, B.; Singh, A.; Cao, K.-A.L. mixOmics: An R package for ‘omics feature selection and multiple data integration. PLoS Comput. Biol. 2017, 13, e1005752. [Google Scholar] [CrossRef]
- Li, S.; Rouphael, N.; Duraisingham, S.S.; Romero-Steiner, S.; Presnell, S.R.; Davis, C.; Schmidt, D.S.; E Johnson, S.; Milton, A.; Rajam, G.; et al. Molecular signatures of antibody responses derived from a systems biology study of five human vaccines. Nat. Immunol. 2014, 15, 195–204. [Google Scholar] [CrossRef] [PubMed]
- Yu, G.; Wang, L.-G.; Han, Y.; He, Q.-Y. clusterProfiler: An R Package for Comparing Biological Themes Among Gene Clusters. OMICS A J. Integr. Biol. 2012, 16, 284–287. [Google Scholar] [CrossRef]
- Piñero, J.; Ramírez-Anguita, J.M.; Saüch-Pitarch, J.; Ronzano, F.; Centeno, E.; Sanz, F.; I Furlong, L. The DisGeNET knowledge platform for disease genomics: 2019 update. Nucleic Acids Res. 2019, 48, D845–D855. [Google Scholar] [CrossRef] [PubMed]
- Uhlén, M.; Fagerberg, L.; Hallström, B.M.; Lindskog, C.; Oksvold, P.; Mardinoglu, A.; Sivertsson, A.; Kampf, C.; Sjöstedt, E.; Asplund, A.; et al. Tissue-based map of the human proteome. Science 2015, 347, 1260419. [Google Scholar] [CrossRef]
- Gordon, E.D.; Palandra, J.; Wesolowska-Andersen, A.; Ringel, L.; Rios, C.L.; Lachowicz-Scroggins, M.E.; Sharp, L.Z.; Everman, J.L.; MacLeod, H.J.; Lee, J.W.; et al. IL1RL1 asthma risk variants regulate airway type 2 inflammation. JCI Insight 2016, 1, e87871. [Google Scholar] [CrossRef]
- Hanayama, R.; Tanaka, M.; Miyasaka, K.; Aozasa, K.; Koike, M.; Uchiyama, Y.; Nagata, S. Autoimmune Disease and Impaired Uptake of Apoptotic Cells in MFG-E8-Deficient Mice. Science 2004, 304, 1147–1150. [Google Scholar] [CrossRef]
- Bekkering, S.; Saner, C.; Riksen, N.P.; Netea, M.G.; Sabin, M.A.; Saffery, R.; Stienstra, R.; Burgner, D.P. Trained Immunity: Linking Obesity and Cardiovascular Disease across the Life-Course? Trends Endocrinol. Metab. 2020, 31, 378–389. [Google Scholar] [CrossRef] [PubMed]
- Kelley, K.M.; Oh, Y.; Gargosky, S.E.; Gucev, Z.; Matsumoto, T.; Hwa, V.; Ng, L.; Simpson, D.M.; Rosenfeld, R.G. Insulin-like growth factor-binding proteins (IGFBPs) and their regulatory dynamics. Int. J. Biochem. Cell Biol. 1996, 28, 619–637. [Google Scholar] [CrossRef]
- Cotterill, A.M.; Holly, J.M.P.; Wass, J.A.H. The regulation of insulin-like growth factor binding protein (IGFBP)-1 during prolonged fasting. Clin. Endocrinol. 1993, 39, 357–362. [Google Scholar] [CrossRef] [PubMed]
- Cotterill, A.M.; Holly, J.M.P.; Amiel, S.; Wass, J.A.H. Suppression of endogenous insulin secretion regulates the rapid rise of insulin-like growth factor binding protein (IGFBP)-1 levels following acute hypoglycaemia. Clin. Endocrinol. 1993, 38, 633–639. [Google Scholar] [CrossRef] [PubMed]
- Rajwani, A.; Ezzat, V.; Smith, J.; Yuldasheva, N.Y.; Duncan, E.R.; Gage, M.; Cubbon, R.M.; Kahn, M.B.; Imrie, H.; Abbas, A.; et al. Increasing Circulating IGFBP1 Levels Improves Insulin Sensitivity, Promotes Nitric Oxide Production, Lowers Blood Pressure, and Protects Against Atherosclerosis. Diabetes 2012, 61, 915–924. [Google Scholar] [CrossRef] [PubMed]
- DiToro, D.; Harbour, S.N.; Bando, J.K.; Benavides, G.; Witte, S.; Laufer, V.A.; Moseley, C.; Singer, J.R.; Frey, B.; Turner, H.; et al. Insulin-Like Growth Factors Are Key Regulators of T Helper 17 Regulatory T Cell Balance in Autoimmunity. Immunity 2020, 52, 650–667.e10. [Google Scholar] [CrossRef] [PubMed]
- Khorram, O.; Vu, L.; Yen, S.S.C. Activation of Immune Function by Dehydroepiandrosterone (DHEA) in Age-Advanced Men. J. Gerontol. Sci. Ser. Biol. Sci. Méd. Sci. 1997, 52, M1–M7. [Google Scholar] [CrossRef] [PubMed]
- Liew, C.F.; Wise, S.D.; Yeo, K.P.; Lee, K.-O. Insulin-like growth factor binding protein-1 is independently affected by ethnicity, insulin sensitivity, and leptin in healthy, glucose-tolerant young men. J. Clin. Endocrinol. Metab. 2005, 90, 1483–1488. [Google Scholar] [CrossRef]
- Alderete, T.L.; Byrd-Williams, C.E.; Toledo-Corral, C.M.; Conti, D.V.; Weigensberg, M.J.; Goran, M.I. Relationships Between IGF-1 and IGFBP-1 and Adiposity in Obese African-American and Latino Adolescents. Obesity 2011, 19, 933–938. [Google Scholar] [CrossRef] [PubMed]
- De Silva, A.; Bloom, S.R. Gut Hormones and Appetite Control: A Focus on PYY and GLP-1 as Therapeutic Targets in Obesity. Gut Liver 2012, 6, 10–20. [Google Scholar] [CrossRef] [PubMed]
- Cooper, J.A. Factors affecting circulating levels of peptide YY in humans: A comprehensive review. Nutr. Res. Rev. 2014, 27, 186–197. [Google Scholar] [CrossRef]
- Larraufie, P.; Doré, J.; Lapaque, N.; Blottière, H.M. TLR ligands and butyrate increasePyyexpression through two distinct but inter-regulated pathways. Cell. Microbiol. 2016, 19, e12648. [Google Scholar] [CrossRef]
- Stanojević, S.; Vujić, V.; Kovačević-Jovanović, V.; Mitić, K.; Kosec, D.; Von Hörsten, S.; Dimitrijević, M. Age-related effect of peptide YY (PYY) on paw edema in the rat: The function of Y1 receptors on inflammatory cells. Exp. Gerontol. 2006, 41, 793–799. [Google Scholar] [CrossRef]
- Macia, L.; Yulyaningsih, E.; Pangon, L.; Nguyen, A.D.; Lin, S.; Shi, Y.C.; Zhang, L.; Bijker, M.; Grey, S.; Mackay, F.; et al. Neuropeptide Y1 Receptor in Immune Cells Regulates Inflammation and Insulin Resistance Associated With Diet-Induced Obesity. Diabetes 2012, 61, 3228–3238. [Google Scholar] [CrossRef]
- Reinhold, D.; Hemmer, B.; Gran, B.; Born, I.; Faust, J.; Neubert, K.; McFarland, H.F.; Martin, R.; Ansorge, S. Inhibitors of dipeptidyl peptidase IV/CD26 suppress activation of human MBP-specific CD4+ T cell clones. J. Neuroimmunol. 1998, 87, 203–209. [Google Scholar] [CrossRef]
- Schmitz, J.; Owyang, A.; Oldham, E.; Song, Y.; Murphy, E.; McClanahan, T.K.; Zurawski, G.; Moshrefi, M.; Qin, J.; Li, X.; et al. IL-33, an Interleukin-1-like Cytokine that Signals via the IL-1 Receptor-Related Protein ST2 and Induces T Helper Type 2-Associated Cytokines. Immunity 2005, 23, 479–490. [Google Scholar] [CrossRef]
- Griesenauer, B.; Paczesny, S. The ST2/IL-33 Axis in Immune Cells during Inflammatory Diseases. Front. Immunol. 2017, 8, 475. [Google Scholar] [CrossRef]
- Véron, P.; Segura, E.; Sugano, G.; Amigorena, S.; Théry, C. Accumulation of MFG-E8/lactadherin on exosomes from immature dendritic cells. Blood Cells Mol. Dis. 2005, 35, 81–88. [Google Scholar] [CrossRef] [PubMed]
- De Cabo, R.; Mattson, M.P. Effects of intermittent fasting on health, aging, and disease. N. Engl. J. Med. 2019, 381, 2541–2551. [Google Scholar] [CrossRef] [PubMed]
- Zhai, S.; Qin, S.; Li, L.; Zhu, L.; Zou, Z.; Wang, L. Dietary butyrate suppresses inflammation through modulating gut microbiota in high-fat diet-fed mice. FEMS Microbiol. Lett. 2019, 366. [Google Scholar] [CrossRef]
- Goldberg, E.L.; Asher, J.L.; Molony, R.D.; Shaw, A.C.; Zeiss, C.J.; Wang, C.; Morozova-Roche, L.A.; Herzog, R.I.; Iwasaki, A.; Dixit, V.D. β-Hydroxybutyrate Deactivates Neutrophil NLRP3 Inflammasome to Relieve Gout Flares. Cell Rep. 2017, 18, 2077–2087. [Google Scholar] [CrossRef] [PubMed]


Publisher’s Note: MDPI stays neutral with regard to jurisdictional claims in published maps and institutional affiliations. |
© 2021 by the authors. Licensee MDPI, Basel, Switzerland. This article is an open access article distributed under the terms and conditions of the Creative Commons Attribution (CC BY) license (https://creativecommons.org/licenses/by/4.0/).
Share and Cite
Han, K.; Singh, K.; Rodman, M.J.; Hassanzadeh, S.; Baumer, Y.; Huffstutler, R.D.; Chen, J.; Candia, J.; Cheung, F.; Stagliano, K.E.R.; et al. Identification and Validation of Nutrient State-Dependent Serum Protein Mediators of Human CD4+ T Cell Responsiveness. Nutrients 2021, 13, 1492. https://doi.org/10.3390/nu13051492
Han K, Singh K, Rodman MJ, Hassanzadeh S, Baumer Y, Huffstutler RD, Chen J, Candia J, Cheung F, Stagliano KER, et al. Identification and Validation of Nutrient State-Dependent Serum Protein Mediators of Human CD4+ T Cell Responsiveness. Nutrients. 2021; 13(5):1492. https://doi.org/10.3390/nu13051492
Chicago/Turabian StyleHan, Kim, Komudi Singh, Matthew J. Rodman, Shahin Hassanzadeh, Yvonne Baumer, Rebecca D. Huffstutler, Jinguo Chen, Julián Candia, Foo Cheung, Katherine E. R. Stagliano, and et al. 2021. "Identification and Validation of Nutrient State-Dependent Serum Protein Mediators of Human CD4+ T Cell Responsiveness" Nutrients 13, no. 5: 1492. https://doi.org/10.3390/nu13051492
APA StyleHan, K., Singh, K., Rodman, M. J., Hassanzadeh, S., Baumer, Y., Huffstutler, R. D., Chen, J., Candia, J., Cheung, F., Stagliano, K. E. R., Pirooznia, M., Powell-Wiley, T. M., & Sack, M. N. (2021). Identification and Validation of Nutrient State-Dependent Serum Protein Mediators of Human CD4+ T Cell Responsiveness. Nutrients, 13(5), 1492. https://doi.org/10.3390/nu13051492