
Fat and Carbohydrate Interact to Potentiate Food Reward in Healthy Weight but Not in Overweight or Obesity

 , , , , and
Abstract
1. Introduction
2. Materials and Methods
2.1. Participants
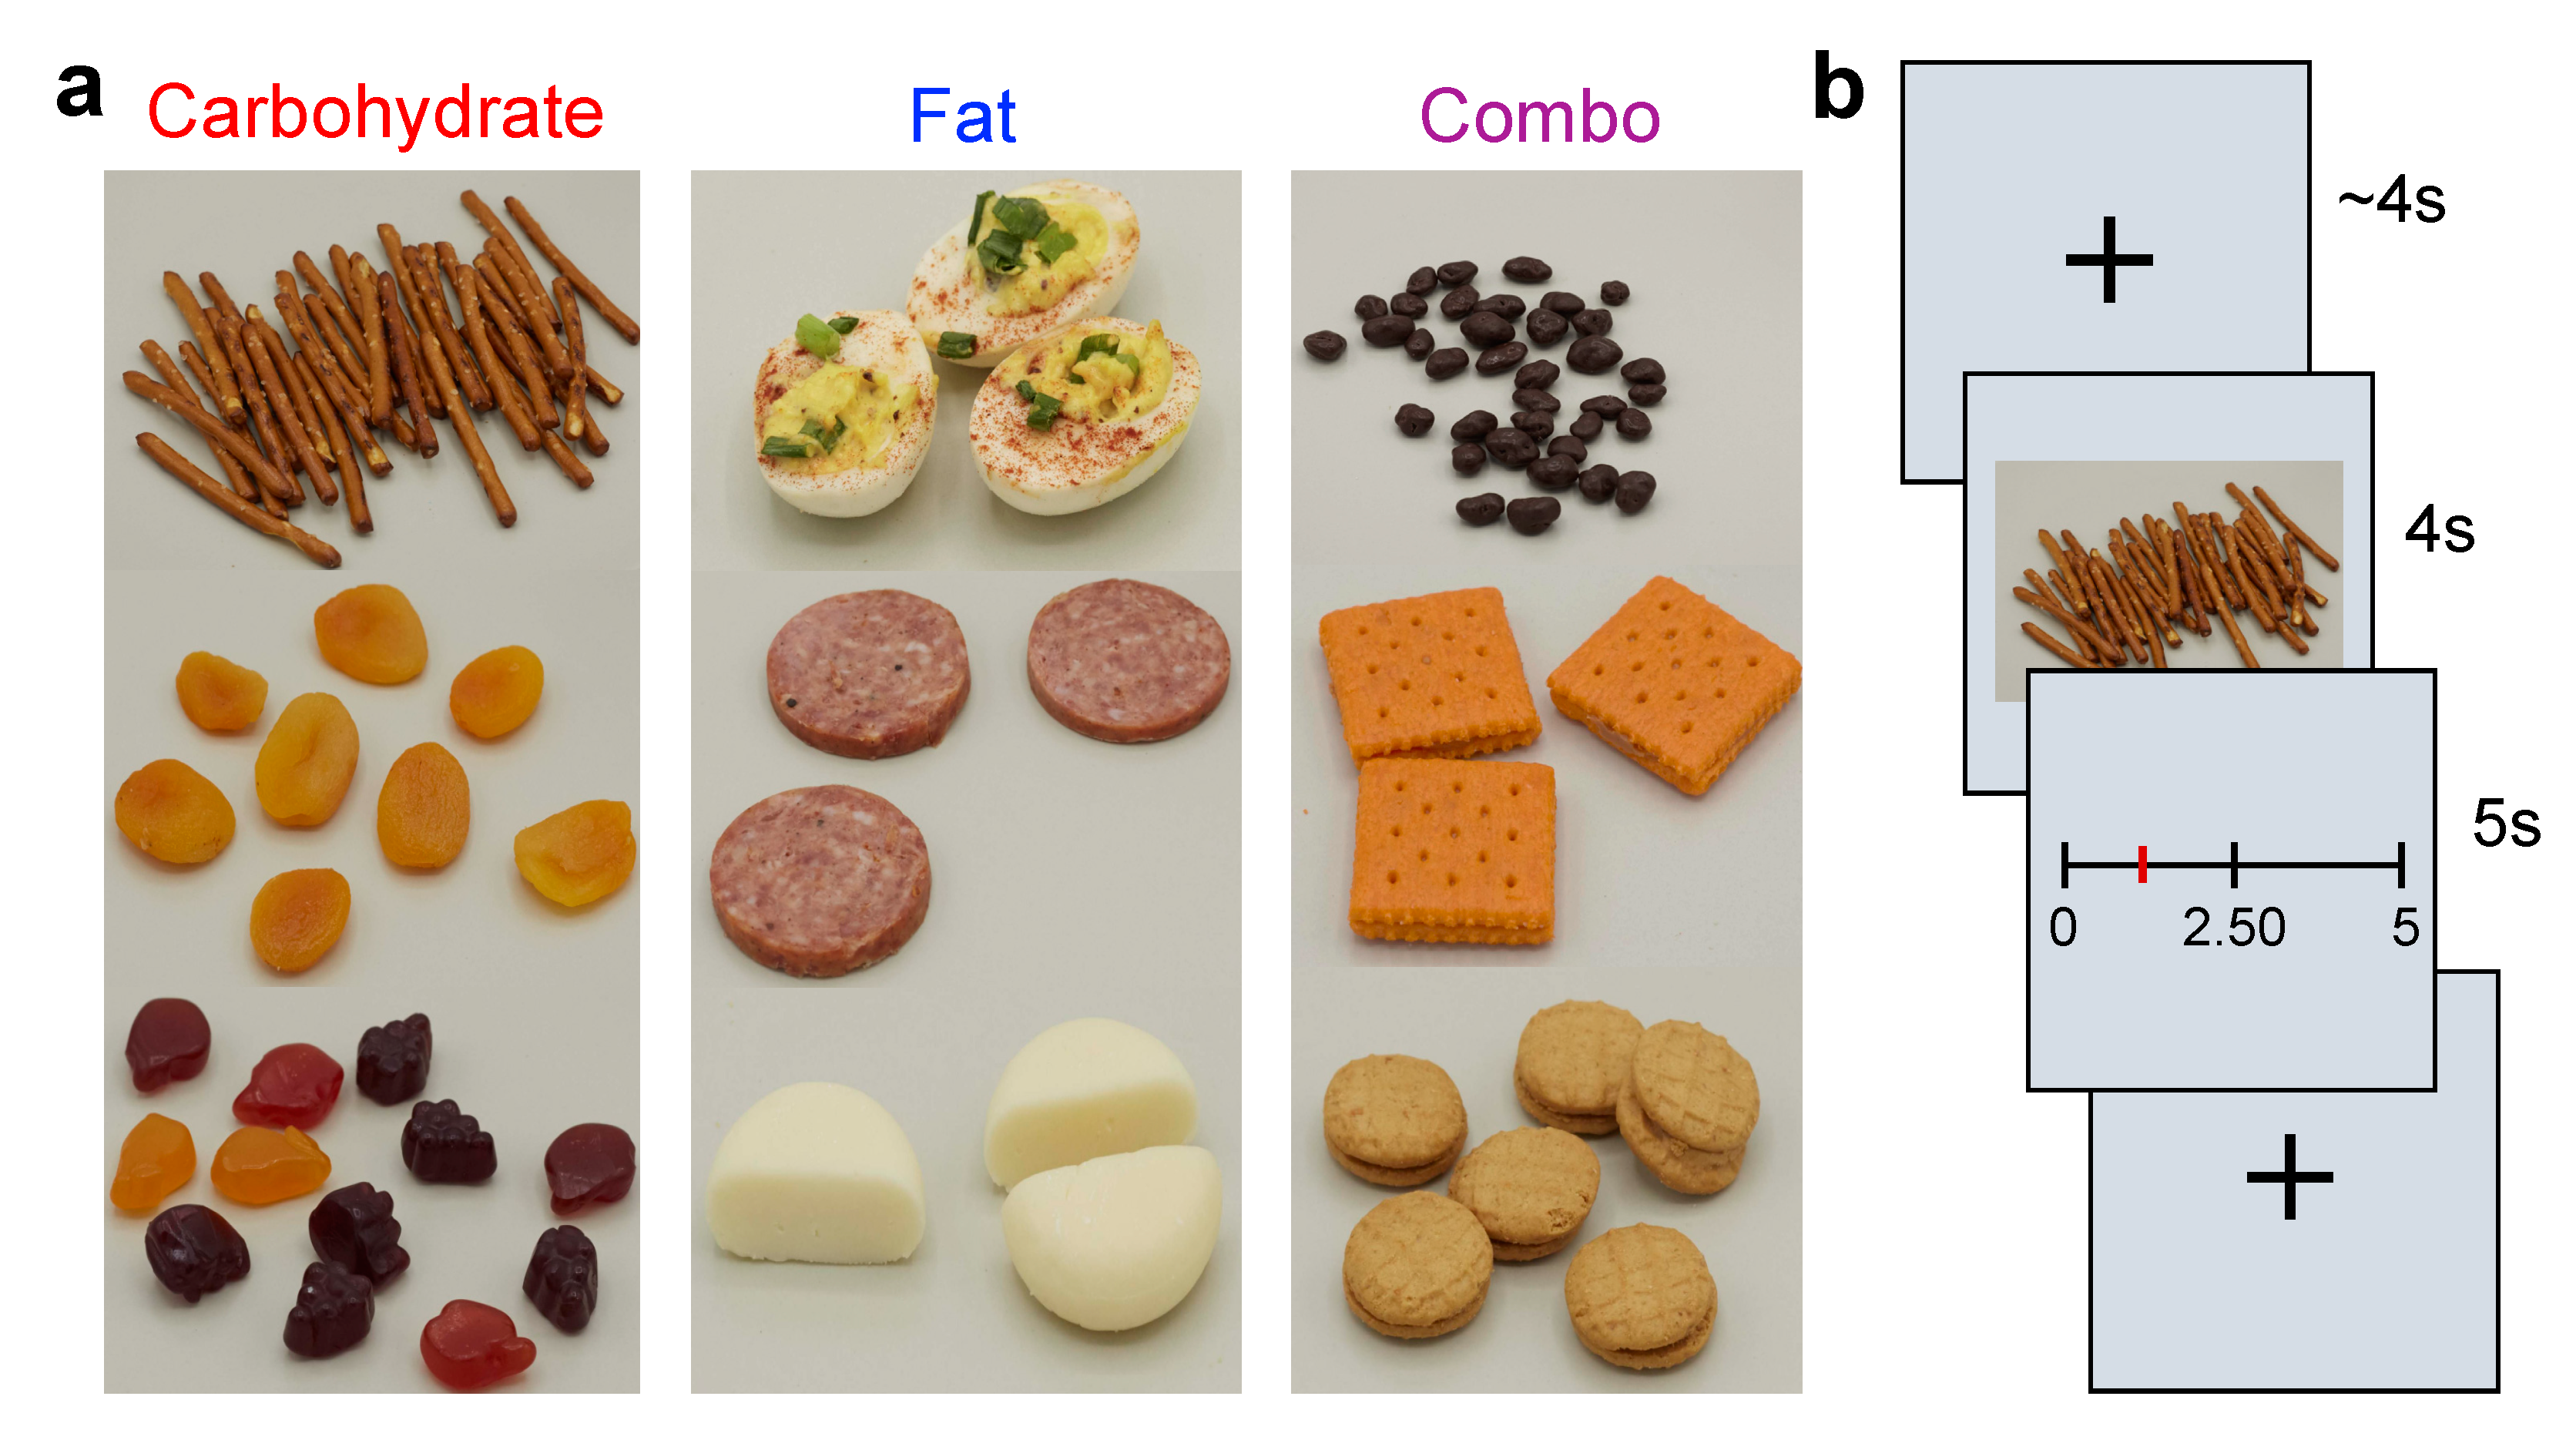
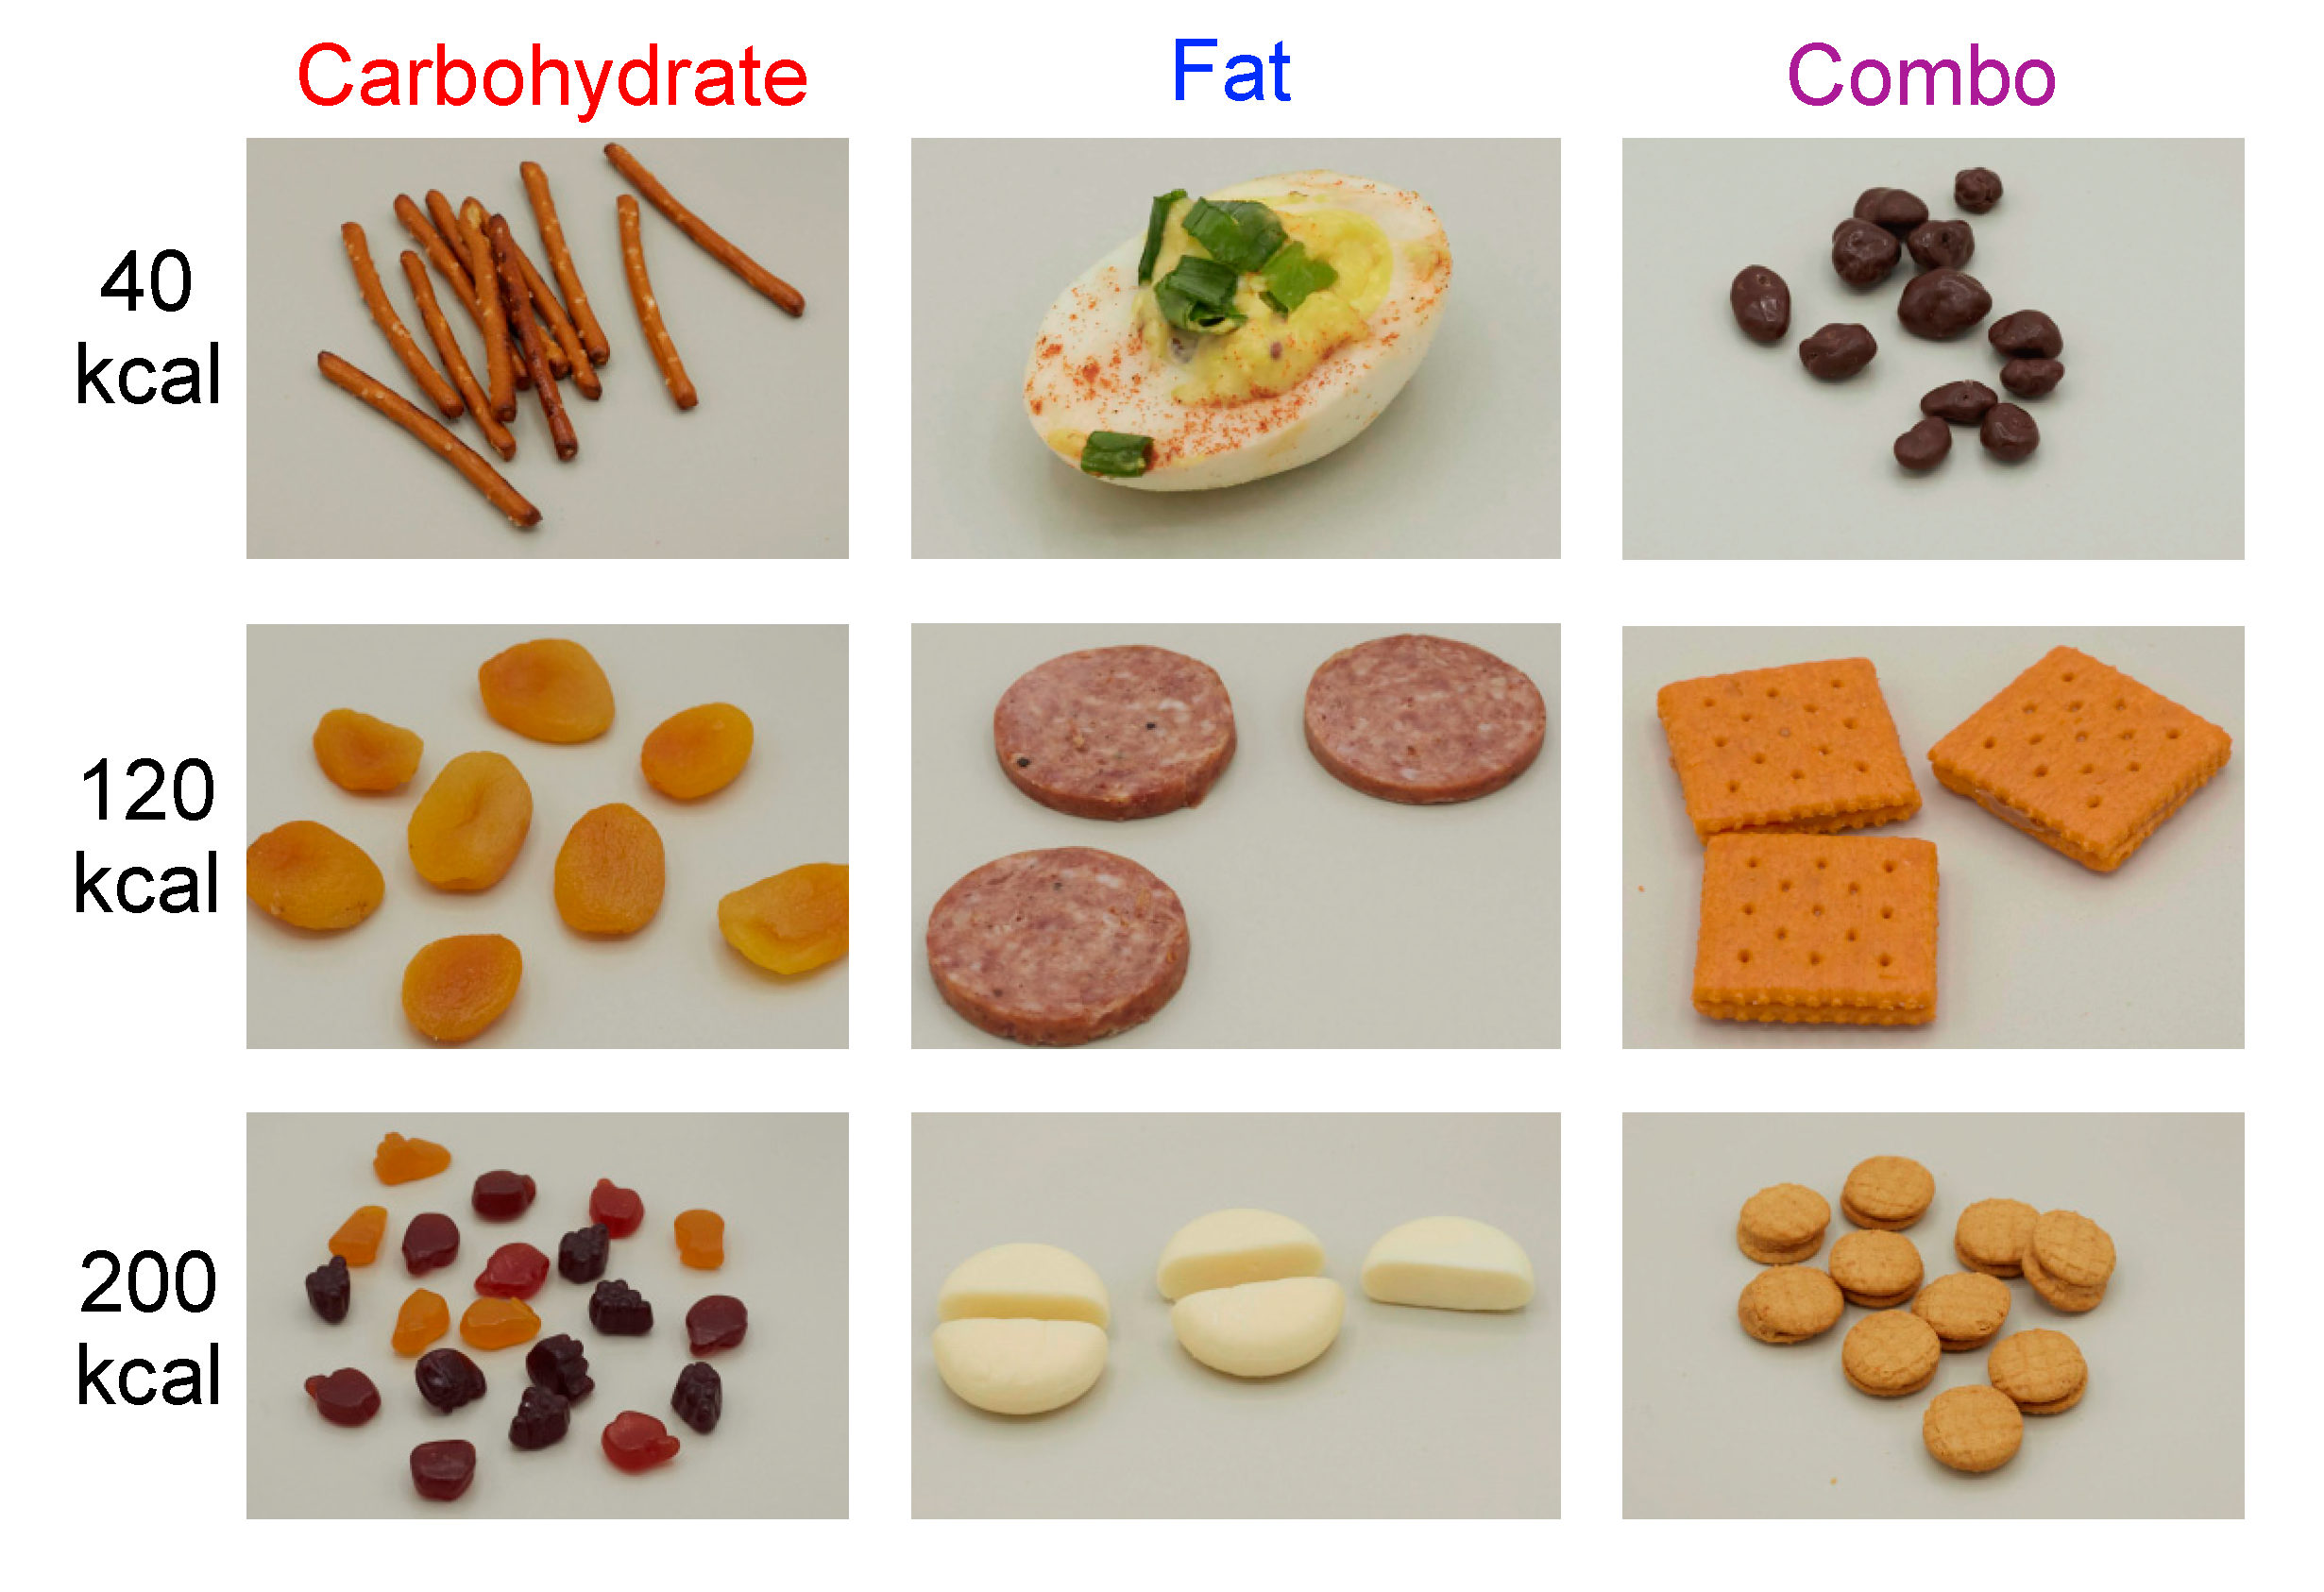
2.2. Food Pictures
2.3. Measures
2.3.1. Internal State
2.3.2. Subjective Ratings of the Food Pictures
2.3.3. Eating Behavior
2.3.4. Dietary Consumption of Fat and Sugar
2.3.5. Anthropometric Measures
2.3.6. Auction Task
2.4. Procedure
2.5. Statistical Analyses and Data Visualization
3. Results
3.1. Participant Characteristics
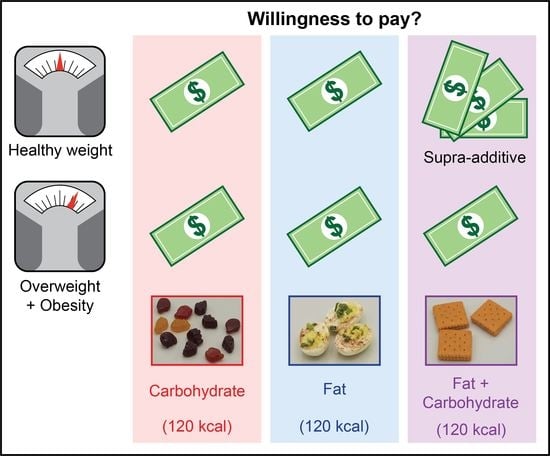
3.2. Macronutrient Content Impacts WTP for Food in Participants with HW, but Not with OW/OB
3.3. Fat and Carbohydrate Potentiate WTP for Food in Participants with HW
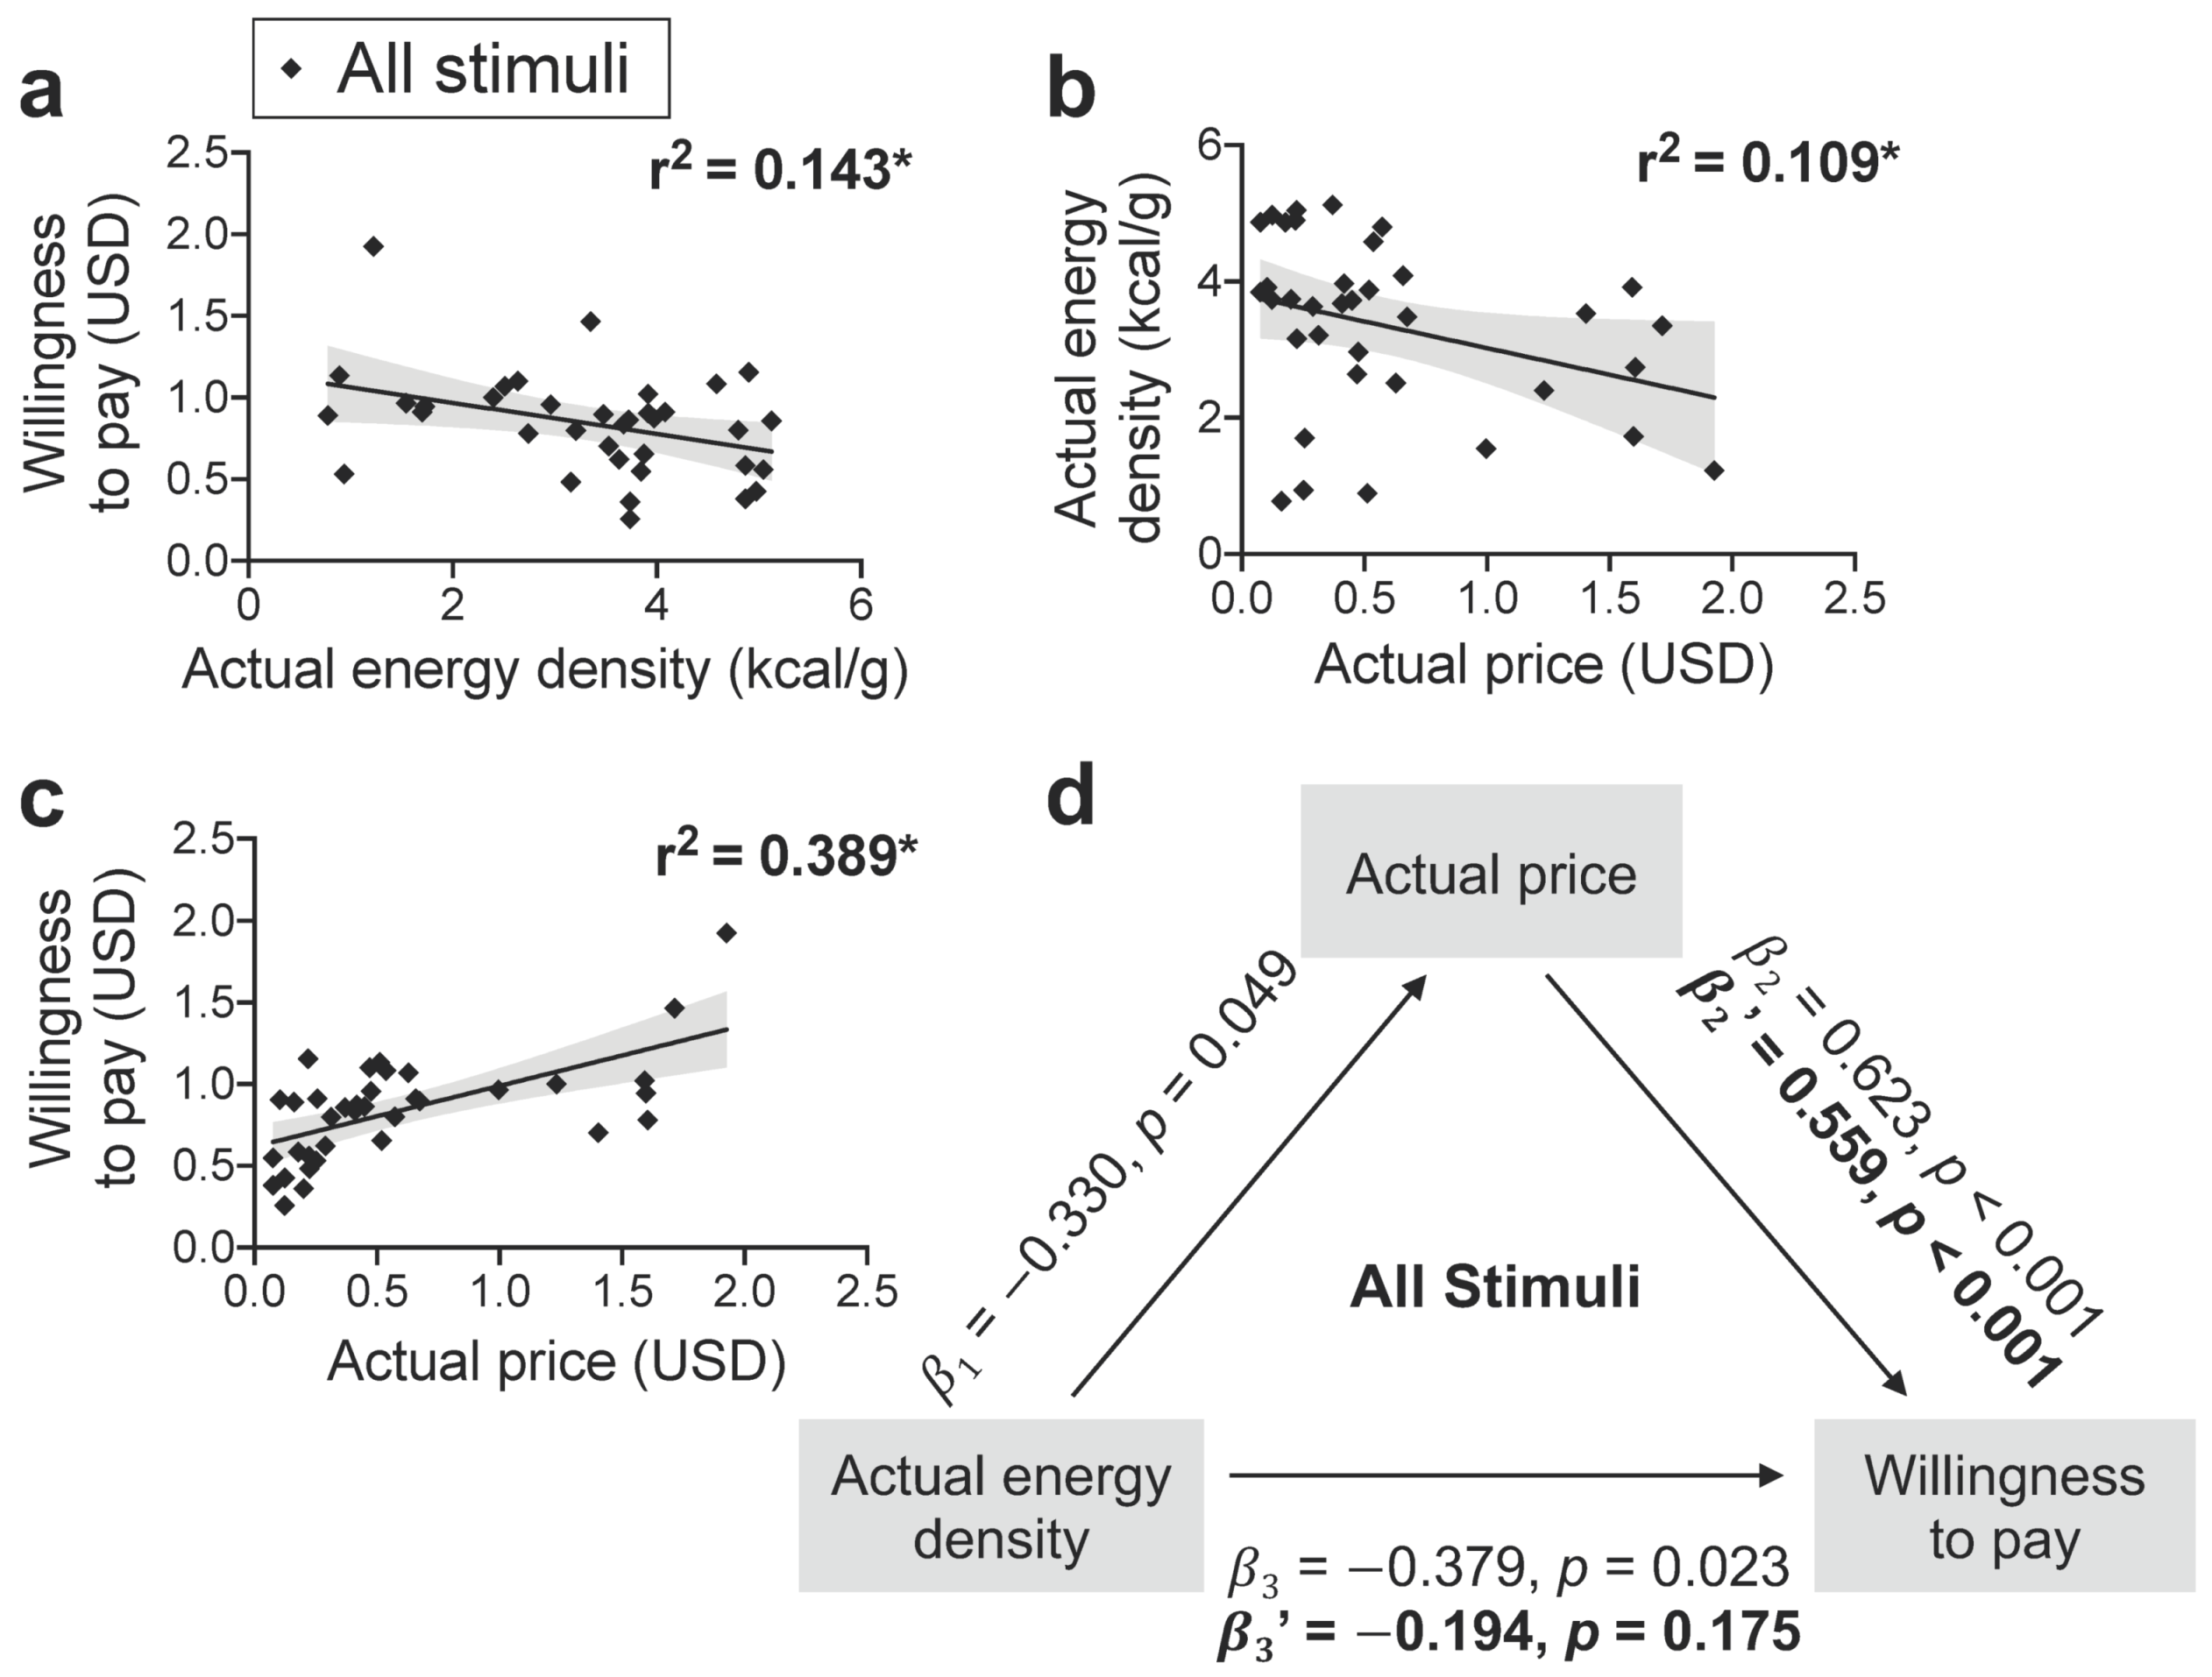
3.4. Associations among WTP and Actual and Estimated Energy Density
3.5. Food Price Mediates the Negative Relationship between Actual Energy Density and WTP
4. Discussion
4.1. Interaction of Carbohydrate and Fat on Food Reinforcement
4.2. Influence of BMI
4.3. Impact of the Food Environment
4.4. Study Strengths, Limitations, and Future Directions
5. Conclusions
Supplementary Materials
Author Contributions
Funding
Institutional Review Board Statement
Informed Consent Statement
Data Availability Statement
Acknowledgments
Conflicts of Interest
References
- De Araujo, I.E.; Schatzker, M.; Small, D.M. Rethinking Food Reward. Annu. Rev. Psychol. 2020, 71, 139–164. [Google Scholar] [CrossRef] [PubMed]
- Juul, F.; Martinez-Steele, E.; Parekh, N.; Monteiro, C.A.; Chang, V.W. Ultra-processed food consumption and excess weight among US adults. Br. J. Nutr. 2018, 120, 90–100. [Google Scholar] [CrossRef]
- Nardocci, M.; Leclerc, B.-S.; Louzada, M.-L.; Monteiro, C.A.; Batal, M.; Moubarac, J.-C. Consumption of ultra-processed foods and obesity in Canada. Can. J. Public Health 2019, 110, 4–14. [Google Scholar] [CrossRef] [PubMed]
- Gómez-Donoso, C.; Sánchez-Villegas, A.; Martínez-González, M.A.; Gea, A.; De Mendonça, R.D.; Lahortiga-Ramos, F.; Bes-Rastrollo, M. Ultra-processed food consumption and the incidence of depression in a Mediterranean cohort: The SUN Project. Eur. J. Nutr. 2019, 59, 1093–1103. [Google Scholar] [CrossRef]
- De Mendonça, R.D.; Lopes, A.C.S.; Pimenta, A.M.; Gea, A.; Martinez-Gonzalez, M.A.; Bes-Rastrollo, M. Ultra-Processed Food Consumption and the Incidence of Hypertension in a Mediterranean Cohort: The Seguimiento Universidad de Navarra Project. Am. J. Hypertens 2017, 30, 358–366. [Google Scholar] [CrossRef] [PubMed]
- Schnabel, L.; Kesse-Guyot, E.; Allès, B.; Touvier, M.; Srour, B.; Hercberg, S.; Buscail, C.; Julia, C. Association Between Ultraprocessed Food Consumption and Risk of Mortality Among Middle-aged Adults in France. JAMA Intern. Med. 2019, 179, 490–498. [Google Scholar] [CrossRef]
- Balter, V.; Braga, J.; Télouk, P.; Thackeray, J.F. Evidence for dietary change but not landscape use in South African early hominins. Nature 2012, 489, 558–560. [Google Scholar] [CrossRef] [PubMed]
- Dalenberg, J.R.; Patel, B.P.; Denis, R.; Veldhuizen, M.G.; Nakamura, Y.; Vinke, P.C.; Luquet, S.; Small, D.M. Short-Term Consumption of Sucralose with, but Not without, Carbohydrate Impairs Neural and Metabolic Sensitivity to Sugar in Humans. Cell Metab. 2020, 31, 493–502.e7. [Google Scholar] [CrossRef]
- Davidson, T.L.; Swithers, S.E. A Pavlovian approach to the problem of obesity. Int. J. Obes. 2004, 28, 933–935. [Google Scholar] [CrossRef]
- Nichol, A.D.; Salame, C.; Rother, K.I.; Pepino, M.Y. Effects of Sucralose Ingestion versus Sucralose Taste on Metabolic Responses to an Oral Glucose Tolerance Test in Participants with Normal Weight and Obesity: A Randomized Crossover Trial. Nutrients 2020, 12, 29. [Google Scholar] [CrossRef]
- Pepino, M.Y.; Tiemann, C.D.; Patterson, B.W.; Wice, B.M.; Klein, S. Sucralose Affects Glycemic and Hormonal Responses to an Oral Glucose Load. Diabetes Care 2013, 36, 2530–2535. [Google Scholar] [CrossRef]
- Brunstrom, J.M.; Drake, A.C.L.; Forde, C.G.; Rogers, P.J. Undervalued and ignored: Are humans poorly adapted to energy-dense foods? Appetite 2018, 120, 589–595. [Google Scholar] [CrossRef] [PubMed]
- Schur, E.A.; Kleinhans, N.M.; Goldberg, J.; Buchwald, D.; Schwartz, M.W.; Maravilla, K. Activation in brain energy regulation and reward centers by food cues varies with choice of visual stimulus. Int. J. Obes. 2009, 33, 653–661. [Google Scholar] [CrossRef] [PubMed]
- Mehta, S.; Melhorn, S.J.; Smeraglio, A.; Tyagi, V.; Grabowski, T.; Schwartz, M.W.; Schur, E.A. Regional brain response to visual food cues is a marker of satiety that predicts food choice. Am. J. Clin. Nutr. 2012, 96, 989–999. [Google Scholar] [CrossRef]
- Han, W.; Tellez, L.A.; Perkins, M.H.; Perez, I.O.; Qu, T.; Ferreira, J.; Ferreira, T.L.; Quinn, D.; Liu, Z.-W.; Gao, X.-B.; et al. A Neural Circuit for Gut-Induced Reward. Cell 2018, 175, 665–678.e23. [Google Scholar] [CrossRef] [PubMed]
- Tellez, L.A.; Ren, X.; Han, W.; Medina, S.; Ferreira, J.G.; Yeckel, C.W.; De Araujo, I.E. Glucose utilization rates regulate intake levels of artificial sweeteners: Glucose Utilization and Artificial Sweeteners. J. Physiol. 2013, 591, 5727–5744. [Google Scholar] [CrossRef]
- Tellez, L.A.; Medina, S.; Han, W.; Ferreira, J.G.; Licona-Limón, P.; Ren, X.; Lam, T.T.; Schwartz, G.J.; De Araujo, I.E. A Gut Lipid Messenger Links Excess Dietary Fat to Dopamine Deficiency. Science 2013, 341, 800–802. [Google Scholar] [CrossRef]
- Ren, X.; Ferreira, J.G.; Zhou, L.; Shammah-Lagnado, S.J.; Yeckel, C.W.; De Araujo, I.E. Nutrient Selection in the Absence of Taste Receptor Signaling. J. Neurosci. 2010, 30, 8012–8023. [Google Scholar] [CrossRef]
- Ritter, S.; Taylor, J.S. Vagal sensory neurons are required for lipoprivic but not glucoprivic feeding in rats. Am. J. Physiol. Regul. Integr. Comp. Physiol. 1990, 258, R1395–R1401. [Google Scholar] [CrossRef]
- Goldstein, N.; McKnight, A.D.; Carty, J.R.E.; Arnold, M.; Betley, J.N.; Alhadeff, A.L. Hypothalamic detection of macronutrients via multiple gut-brain pathways. Cell Metab. 2021, 33, 676–687.e5. [Google Scholar] [CrossRef]
- Zhang, L.; Han, W.; Lin, C.; Li, F.; De Araujo, I.E. Sugar Metabolism Regulates Flavor Preferences and Portal Glucose Sensing. Front. Integr. Neurosci. 2018, 12, 57. [Google Scholar] [CrossRef]
- McDougle, M.; Quinn, D.; Diepenbroek, C.; Singh, A.; de la Serre, C.; de Lartigue, G. Intact vagal gut-brain signalling prevents hyperphagia and excessive weight gain in response to high-fat high-sugar diet. Acta Physiol. 2021, 231, e13530. [Google Scholar] [CrossRef]
- DiFeliceantonio, A.G.; Coppin, G.; Rigoux, L.; Thanarajah, S.E.; Dagher, A.; Tittgemeyer, M.; Small, D.M. Supra-Additive Effects of Combining Fat and Carbohydrate on Food Reward. Cell Metab. 2018, 28, 33–44.e3. [Google Scholar] [CrossRef] [PubMed]
- Small, D.M.; DiFeliceantonio, A.G. Processed foods and food reward. Science 2019, 363, 346–347. [Google Scholar] [CrossRef] [PubMed]
- La Fleur, S.E.; Van Rozen, A.J.; Luijendijk, M.C.M.; Groeneweg, F.; Adan, R.A.H. A free-choice high-fat high-sugar diet induces changes in arcuate neuropeptide expression that support hyperphagia. Int. J. Obes. 2010, 34, 537–546. [Google Scholar] [CrossRef] [PubMed]
- Becker, G.M.; DeGroot, M.H.; Marschak, J. Measuring utility by a single-response sequential method. Behav. Sci. 1964, 9, 226–232. [Google Scholar] [CrossRef]
- De Araujo, I.E.; Lin, T.; Veldhuizen, M.G.; Small, D.M. Metabolic Regulation of Brain Response to Food Cues. Curr. Biol. 2013, 23, 878–883. [Google Scholar] [CrossRef]
- Tang, D.W.; Fellows, L.K.; Dagher, A. Behavioral and Neural Valuation of Foods Is Driven by Implicit Knowledge of Caloric Content. Psychol. Sci. 2014, 25, 2168–2176. [Google Scholar] [CrossRef]
- Saelens, B.E.; Epstein, L.H. Reinforcing Value of Food in Obese and Non-obese Women. Appetite 1996, 27, 41–50. [Google Scholar] [CrossRef]
- Epstein, L.H.; Temple, J.L.; Neaderhiser, B.J.; Salis, R.J.; Erbe, R.W.; Leddy, J.J. Food reinforcement, the dopamine D2 receptor genotype, and energy intake in obese and nonobese humans. Behav. Neurosci. 2007, 121, 877–886. [Google Scholar] [CrossRef]
- Temple, J.L.; Bulkley, A.M.; Badawy, R.L.; Krause, N.; McCann, S.; Epstein, L.H. Differential effects of daily snack food intake on the reinforcing value of food in obese and nonobese women. Am. J. Clin. Nutr. 2009, 90, 304–313. [Google Scholar] [CrossRef] [PubMed]
- Qualls-Creekmore, E.; Marlatt, K.L.; Aarts, E.; Bruce-Keller, A.; Church, T.S.; Clément, K.; Fisher, J.O.; Gordon-Larsen, P.; Morrison, C.D.; Raybould, H.E.; et al. What Should I Eat and Why? The Environmental, Genetic, and Behavioral Determinants of Food Choice: Summary from a Pennington Scientific Symposium. Obesity 2020, 28, 1386–1396. [Google Scholar] [CrossRef]
- Benoit, S.C.; Davis, J.F.; Davidson, T.L. Learned and cognitive controls of food intake. Brain Res. 2010, 1350, 71–76. [Google Scholar] [CrossRef]
- Da Louzada, M.L.C.; Baraldi, L.G.; Steele, E.M.; Martins, A.P.B.; Canella, D.S.; Moubarac, J.-C.; Levy, R.B.; Cannon, G.; Afshin, A.; Imamura, F.; et al. Consumption of ultra-processed foods and obesity in Brazilian adolescents and adults. Prev. Med. 2015, 81, 9–15. [Google Scholar] [CrossRef]
- Steele, E.M.; Baraldi, L.G.; Da Louzada, M.L.C.; Moubarac, J.-C.; Mozaffarian, D.; Monteiro, C.A. Ultra-processed foods and added sugars in the US diet: Evidence from a nationally representative cross-sectional study. BMJ Open 2016, 6, e009892. [Google Scholar] [CrossRef]
- Monteiro, C.A.; Moubarac, J.-C.; Levy, R.B.; Canella, D.S.; Da Louzada, M.L.C.; Cannon, G. Household availability of ultra-processed foods and obesity in nineteen European countries. Public Health Nutr. 2018, 21, 18–26. [Google Scholar] [CrossRef] [PubMed]
- Beck, A.T.; Epstein, N.; Brown, G.; Steer, R.A. An inventory for measuring clinical anxiety: Psychometric properties. J. Consult. Clin. Psychol. 1988, 56, 893–897. [Google Scholar] [CrossRef]
- Beck, A.; Steer, R.; Brown, G. Manual for the Beck Depression Inventory-II (BDI-II); Psychological Corporation: San Antonio, TX, USA, 1996. [Google Scholar]
- Mooreville, M.; Shomaker, L.B.; Reina, S.A.; Hannallah, L.M.; Cohen, L.A.; Courville, A.B.; Kozlosky, M.; Brady, S.M.; Condarco, T.; Yanovski, S.Z.; et al. Depressive symptoms and observed eating in youth. Appetite 2014, 75, 141–149. [Google Scholar] [CrossRef]
- Rosenbaum, D.L.; White, K.S. The relation of anxiety, depression, and stress to binge eating behavior. J. Health Psychol. 2015, 20, 887–898. [Google Scholar] [CrossRef] [PubMed]
- Faul, F.; Erdfelder, E.; Lang, A.-G.; Buchner, A. G*Power 3: A flexible statistical power analysis program for the social, behavioral, and biomedical sciences. Behav. Res. Methods 2007, 39, 175–191. [Google Scholar] [CrossRef]
- Fromm, S.; Perszyk, E.E.; Kanyamibwa, A.; Wall, K.M.; Hutelin, Z.; Trinh, J.; Davis, X.S.; Green, B.G.; Flack, K.D.; DiFeliceantonio, A.; et al. Development of MacroPics: A novel food picture set to dissociate the effects of carbohydrate and fat on eating behaviors. Appetite 2021, 159, 105051. [Google Scholar] [CrossRef]
- Brunstrom, J.M.; Shakeshaft, N.G.; Alexander, E. Familiarity changes expectations about fullness. Appetite 2010, 54, 587–590. [Google Scholar] [CrossRef] [PubMed]
- Brunstrom, J.M.; Shakeshaft, N.G. Measuring affective (liking) and non-affective (expected satiety) determinants of portion size and food reward. Appetite 2009, 52, 108–114. [Google Scholar] [CrossRef] [PubMed]
- Zuraikat, F.M.; Roe, L.S.; Smethers, A.D.; Reihart, L.W.; Rolls, B.J. Does the cost of a meal influence the portion size effect? Appetite 2018, 127, 341–348. [Google Scholar] [CrossRef] [PubMed]
- Drewnowski, A.; Specter, S.E. Poverty and obesity: The role of energy density and energy costs. Am. J. Clin. Nutr. 2004, 79, 6–16. [Google Scholar] [CrossRef] [PubMed]
- Peirce, J.W. PsychoPy—Psychophysics software in Python. J. Neurosci. Methods 2007, 162, 8–13. [Google Scholar] [CrossRef]
- Lim, J.; Wood, A.; Green, B.G. Derivation and Evaluation of a Labeled Hedonic Scale. Chem. Senses 2009, 34, 739–751. [Google Scholar] [CrossRef]
- Van Strien, T.; Frijters, J.E.R.; Bergers, G.P.A.; Defares, P.B. The Dutch Eating Behavior Questionnaire (DEBQ) for Assessment of Restrained, Emotional, and External Eating Behavior. Int. J. Eat. Disord. 1986, 5, 295–315. [Google Scholar] [CrossRef]
- Wardle, J. Eating style: A validation study of the Dutch eating behaviour questionnaire in normal subjects and women with eating disorders. J. Psychosom. Res. 1987, 31, 161–169. [Google Scholar] [CrossRef]
- Francis, H.; Stevenson, R. Validity and test-retest reliability of a short dietary questionnaire to assess intake of saturated fat and free sugars: A preliminary study. J. Hum. Nutr. Diet. 2013, 26, 234–242. [Google Scholar] [CrossRef]
- Baron, R.M.; Kenny, D.A. The moderator–mediator variable distinction in social psychological research: Conceptual, strategic, and statistical considerations. J. Pers. Soc. Psychol. 1986, 51, 1173–1182. [Google Scholar] [CrossRef]
- Holman, E.W. Immediate and delayed reinforcers for flavor preferences in rats. Learn. Motiv. 1975, 6, 91–100. [Google Scholar] [CrossRef]
- Sclafani, A.; Nissenbaum, J.W. Robust conditioned flavor preference produced by intragastric starch infusions in rats. Am. J. Physiol. Integr. Comp. Physiol. 1988, 255, R672–R675. [Google Scholar] [CrossRef]
- Lucas, F.; Sclafani, A. Flavor preferences conditioned by intragastric fat infusions in rats. Physiol. Behav. 1989, 46, 403–412. [Google Scholar] [CrossRef]
- Johnson, P.M.; Kenny, P.J. Dopamine D2 receptors in addiction-like reward dysfunction and compulsive eating in obese rats. Nat. Neurosci. 2010, 13, 635–641. [Google Scholar] [CrossRef] [PubMed]
- Robinson, M.J.; Burghardt, P.R.; Patterson, C.M.; Nobile, C.W.; Akil, H.; Watson, S.J.; Berridge, K.C.; Ferrario, C.R. Individual Differences in Cue-Induced Motivation and Striatal Systems in Rats Susceptible to Diet-Induced Obesity. Neuropsychopharmacology 2015, 40, 2113–2123. [Google Scholar] [CrossRef] [PubMed]
- Kroemer, N.B.; Small, D.M. Fuel not fun: Reinterpreting attenuated brain responses to reward in obesity. Physiol. Behav. 2016, 162, 37–45. [Google Scholar] [CrossRef] [PubMed]
- Kube, J.; Mathar, D.; Horstmann, A.; Kotz, S.A.; Villringer, A.; Neumann, J. Altered monetary loss processing and reinforcement-based learning in individuals with obesity. Brain Imaging Behav. 2018, 12, 1431–1449. [Google Scholar] [CrossRef]
- Coppin, G.; Nolan-Poupart, S.; Jones-Gotman, M.; Small, D.M. Working memory and reward association learning impairments in obesity. Neuropsychologia 2014, 65, 146–155. [Google Scholar] [CrossRef] [PubMed]
- Temple, J.L.; Epstein, L.H. Sensitization of food reinforcement is related to weight status and baseline food reinforcement. Int. J. Obes. 2012, 36, 1102–1107. [Google Scholar] [CrossRef]
- Reichelt, A.C.; Morris, M.J.; Westbrook, R.F. Cafeteria diet impairs expression of sensory-specific satiety and stimulus-outcome learning. Front. Psychol. 2014, 5, 852. [Google Scholar] [CrossRef] [PubMed]
- Kanoski, S.E.; Davidson, T.L. Western diet consumption and cognitive impairment: Links to hippocampal dysfunction and obesity. Physiol. Behav. 2011, 103, 59–68. [Google Scholar] [CrossRef] [PubMed]
- Figlewicz, D.P.; Benoit, S.C. Insulin, leptin, and food reward: Update 2008. Am. J. Physiol. Integr. Comp. Physiol. 2009, 296, R9–R19. [Google Scholar] [CrossRef]
- Liu, D.; Archer, N.; Duesing, K.; Hannan, G.; Keast, R. Mechanism of fat taste perception: Association with diet and obesity. Prog. Lipid Res. 2016, 63, 41–49. [Google Scholar] [CrossRef] [PubMed]
- Stewart, J.E.; Keast, R.S.J. Recent fat intake modulates fat taste sensitivity in lean and overweight subjects. Int. J. Obes. 2012, 36, 834–842. [Google Scholar] [CrossRef]
- Ferreira, J.G.; Tellez, L.A.; Ren, X.; Yeckel, C.W.; De Araujo, I.E. Regulation of fat intake in the absence of flavour signalling. J. Physiol. 2012, 590, 953–972. [Google Scholar] [CrossRef]
- Wise, P.M.; Nattress, L.; Flammer, L.J.; Beauchamp, G.K. Reduced dietary intake of simple sugars alters perceived sweet taste intensity but not perceived pleasantness. Am. J. Clin. Nutr. 2016, 103, 50–60. [Google Scholar] [CrossRef]
- May, C.E.; Vaziri, A.; Lin, Y.Q.; Grushko, O.; Khabiri, M.; Wang, Q.-P.; Holme, K.J.; Pletcher, S.D.; Freddolino, P.L.; Neely, G.G.; et al. High Dietary Sugar Reshapes Sweet Taste to Promote Feeding Behavior in Drosophila melanogaster. Cell Rep. 2019, 27, 1675–1685.e7. [Google Scholar] [CrossRef]
- Avena, N.M.; Long, K.A.; Hoebel, B.G. Sugar-dependent rats show enhanced responding for sugar after abstinence: Evidence of a sugar deprivation effect. Physiol. Behav. 2005, 84, 359–362. [Google Scholar] [CrossRef]
- Flack, K.D.; Ufholz, K.; Casperson, S.; Jahns, L.; Johnson, L.; Roemmich, J.N. Decreasing the Consumption of Foods with Sugar Increases Their Reinforcing Value: A Potential Barrier for Dietary Behavior Change. J. Acad. Nutr. Diet. 2019, 119, 1099–1108. [Google Scholar] [CrossRef]
- Tracy, A.L.; Wee, C.J.M.; Hazeltine, G.E.; Carter, R.A. Characterization of attenuated food motivation in high-fat diet-induced obesity: Critical roles for time on diet and reinforcer familiarity. Physiol. Behav. 2015, 141, 69–77. [Google Scholar] [CrossRef] [PubMed]
- Temple, J.L.; Chappel, A.; Shalik, J.; Volcy, S.; Epstein, L.H. Daily consumption of individual snack foods decreases their reinforcing value. Eat. Behav. 2008, 9, 267–276. [Google Scholar] [CrossRef]
- Hall, K.D.; Ayuketah, A.; Brychta, R.; Cai, H.; Cassimatis, T.; Chen, K.Y.; Chung, S.T.; Costa, E.; Courville, A.; Darcey, V.; et al. Ultra-Processed Diets Cause Excess Calorie Intake and Weight Gain: An Inpatient Randomized Controlled Trial of Ad Libitum Food Intake. Cell Metab. 2019, 30, 67–77.e3. [Google Scholar] [CrossRef] [PubMed]
- Pan, L.; Sherry, B.; Njai, R.; Blanck, H.M. Food Insecurity Is Associated with Obesity among US Adults in 12 States. J. Acad. Nutr. Diet. 2012, 112, 1403–1409. [Google Scholar] [CrossRef]
- Drewnowski, A. Obesity, diets, and social inequalities. Nutr. Rev. 2009, 67, S36–S39. [Google Scholar] [CrossRef] [PubMed]


| Internal State | Question | Anchors |
|---|---|---|
| Hunger | How hungry do you feel? | Not at all hungry, Extremely hungry |
| Fullness | How full do you feel? | Not at all full, Extremely full |
| Thirst | How thirsty do you feel? | Not at all thirsty, Extremely thirsty |
| Potential to eat | How much do you think you could eat right now? | Not another bite, Extremely large amount |
| Desire to eat | How much do you want to eat right now? | Not at all, Extremely |
| Subjective Variable | Question | Labels |
|---|---|---|
| Liking | How much do you like or dislike this food? | See Lim et al., 2009 [48] 1 |
| Familiarity | How familiar is this food? | Extremely unfamiliar, Extremely familiar |
| Frequency of consumption 2 | How often do you eat this food? | <1 per month, 2–3 per month, 1–2 per month, 3–4 per week, 5+ per week |
| Healthiness | How healthy is this food? | Extremely unhealthy, Extremely healthy |
| Expected satiety | How filling do you expect this food portion to be? | Not filling at all, Extremely filling |
| Estimated energy content 2 | How many calories are in this portion? | 0, 60, 120, 180, 240 |
| Estimated energy density | How energy-dense is this food? | Extremely low, Extremely high |
| Estimated price 2 | What is the grocery store price? | 0, 2.50, 5 USD |
| Characteristic (Units) | HW (n = 30) Mean ± SD, Range | OW/OB (n = 30) Mean ± SD, Range |
|---|---|---|
| Sex | 15 Male, 15 Female | 15 Male, 15 Female |
| Age (yr) | 23.6 ± 4.5, 18–34 | 24.7 ± 4.5, 18–37 |
| Education (yr) | 15.3 ± 1.8, 12–20 | 15.7 ± 2.0, 12–20 |
| Household income 1 | 5.6 ± 1.9, 3–8 | 4.7 ± 1.8, 1–8 |
| Height (m) | 1.70 ± 0.08, 1.59–1.91 | 1.69 ± 0.08, 1.58–1.90 |
| Weight (kg) * | 63.46 ± 8.66, 49.15–83.25 | 83.95 ± 14.57, 65.50–125.15 |
| Body mass index (kg/m2) * | 21.92 ± 1.77, 19.13–24.97 | 29.42 ± 4.44, 25.13–39.96 |
| Waist-hip ratio * | 0.81 ± 0.06, 0.68–0.90 | 0.88 ± 0.06, 0.77–0.99 |
| Body fat (%) * | 21.0 ± 8.3, 4.0–34.5 | 32.6 ± 7.71, 18.8–52.1 |
Publisher’s Note: MDPI stays neutral with regard to jurisdictional claims in published maps and institutional affiliations. |
© 2021 by the authors. Licensee MDPI, Basel, Switzerland. This article is an open access article distributed under the terms and conditions of the Creative Commons Attribution (CC BY) license (https://creativecommons.org/licenses/by/4.0/).
Share and Cite
Perszyk, E.E.; Hutelin, Z.; Trinh, J.; Kanyamibwa, A.; Fromm, S.; Davis, X.S.; Wall, K.M.; Flack, K.D.; DiFeliceantonio, A.G.; Small, D.M. Fat and Carbohydrate Interact to Potentiate Food Reward in Healthy Weight but Not in Overweight or Obesity. Nutrients 2021, 13, 1203. https://doi.org/10.3390/nu13041203
Perszyk EE, Hutelin Z, Trinh J, Kanyamibwa A, Fromm S, Davis XS, Wall KM, Flack KD, DiFeliceantonio AG, Small DM. Fat and Carbohydrate Interact to Potentiate Food Reward in Healthy Weight but Not in Overweight or Obesity. Nutrients. 2021; 13(4):1203. https://doi.org/10.3390/nu13041203
Chicago/Turabian StylePerszyk, Emily E., Zach Hutelin, Jessica Trinh, Arsene Kanyamibwa, Sophie Fromm, Xue S. Davis, Kathryn M. Wall, Kyle D. Flack, Alexandra G. DiFeliceantonio, and Dana M. Small. 2021. "Fat and Carbohydrate Interact to Potentiate Food Reward in Healthy Weight but Not in Overweight or Obesity" Nutrients 13, no. 4: 1203. https://doi.org/10.3390/nu13041203
APA StylePerszyk, E. E., Hutelin, Z., Trinh, J., Kanyamibwa, A., Fromm, S., Davis, X. S., Wall, K. M., Flack, K. D., DiFeliceantonio, A. G., & Small, D. M. (2021). Fat and Carbohydrate Interact to Potentiate Food Reward in Healthy Weight but Not in Overweight or Obesity. Nutrients, 13(4), 1203. https://doi.org/10.3390/nu13041203