
Zinc Nutritional Status in a Series of Children with Chronic Diseases: A Cross-Sectional Study

 ,
, 
 and
and
Abstract
1. Introduction
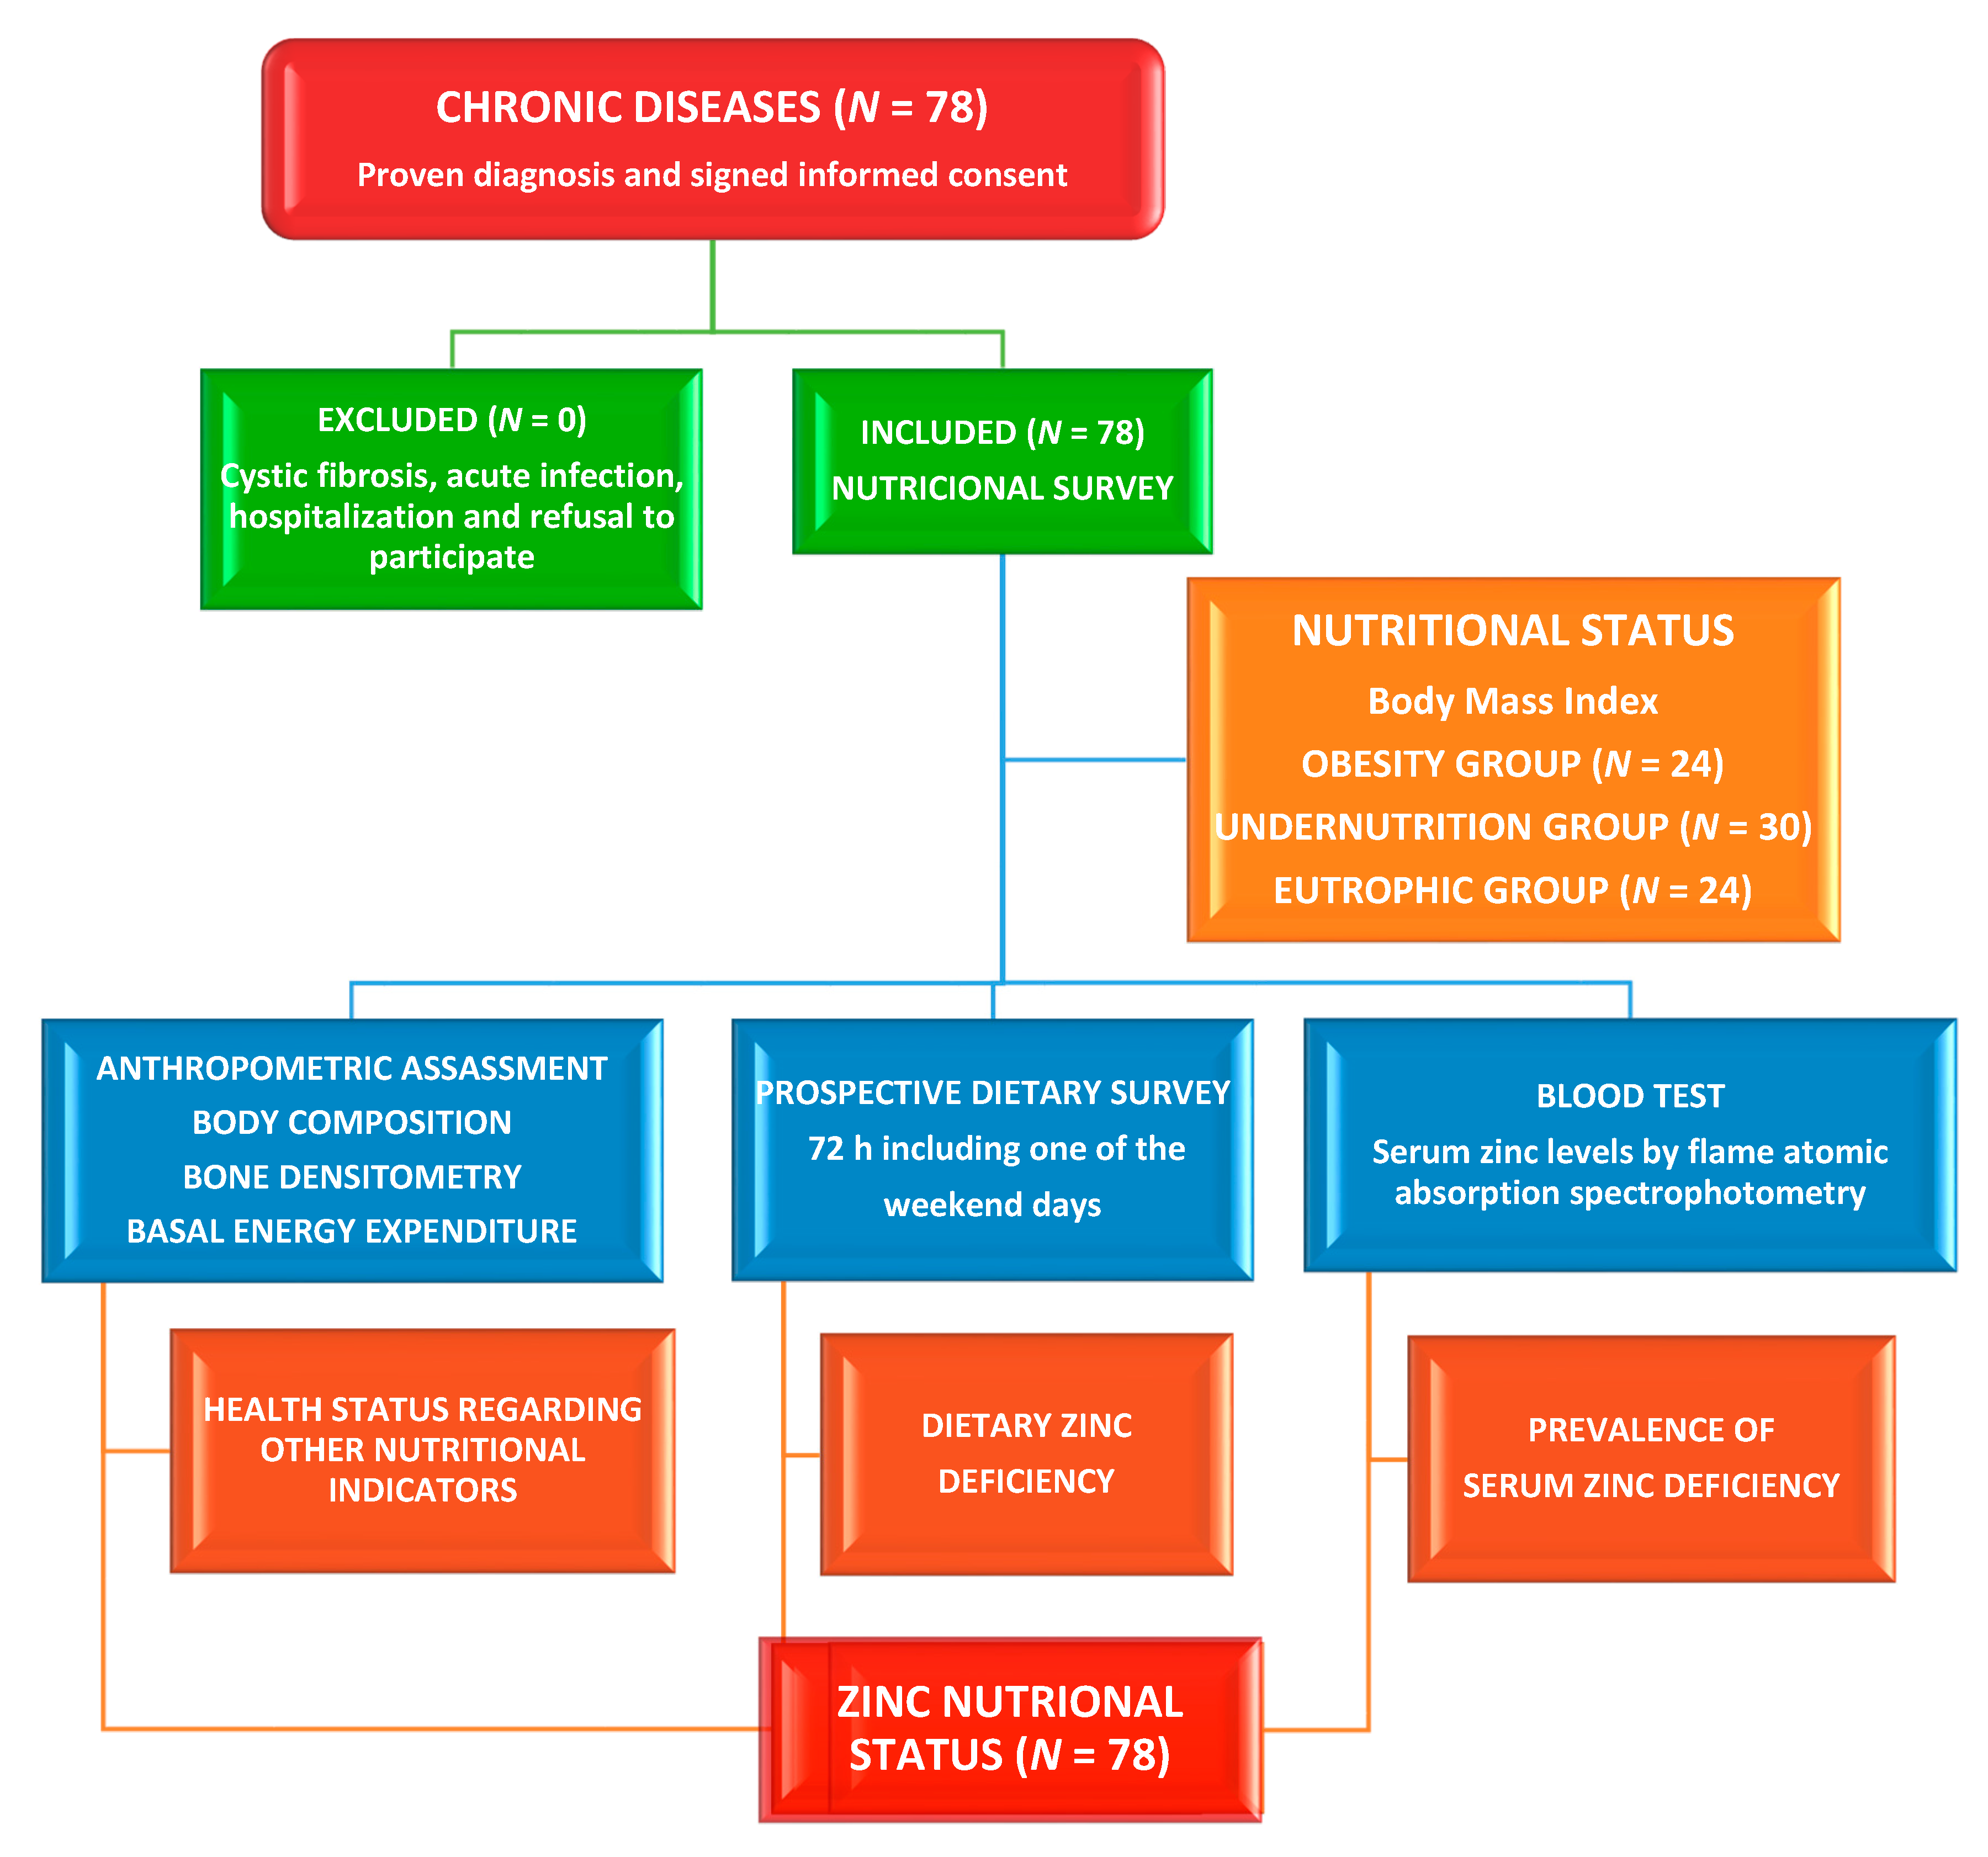
2. Materials and Methods
2.1. Study Site, Design, Participants, and Ethical Issues
2.2. Dietary Assessment
2.3. Assessment of Phenotypical Characteristics
2.4. Clinical Evaluation
2.5. Laboratory Methods
2.6. Statistical Analysis
3. Results
4. Discussion
5. Conclusions
Author Contributions
Funding
Institutional Review Board Statement
Informed Consent Statement
Acknowledgments
Conflicts of Interest
References
- Mokkink, L.B.; Van der Lee, J.H.; Grootenhuis, M.A.; Offringa, M.; Heymans, H.S.; The Dutch National Consensus Committee “Chronic Diseases and Health Conditions in Childhood”. Defining chronic diseases and health conditions in childhood (0–18 years of age): National consensus in the Netherlands. Eur. J. Pediatrics 2008, 167, 1441–1447. [Google Scholar] [CrossRef]
- Oeffinger, K.C.; Mertens, A.C.; Sklar, C.A.; Kawashima, T.; Hudson, M.M.; Meadows, A.T.; Friedman, D.L.; Marina, N.; Hobbie, W.; Kadan-Lottick, N.S.; et al. Chronic Health Conditions in Adult Survivors of Childhood Cancer. N. Engl. J. Med. 2006, 355, 1572–1582. [Google Scholar] [CrossRef] [PubMed]
- González, A.; Fragoso, Y.; Zerquera, G.; Marchena, H.; Guerra, C. CTS Bioética de las enfermedades crónicas de la infancia. Rev. Electr. Cien. Méd. Cienfuegos 2008, 6, 1–3. Available online: http://www.redalyc.org/revista.oa?id=1800 (accessed on 25 June 2010).
- World Health Organization. Malnutrition. Available online: https://www.who.int/news-room/fact-sheets/detail/malnutrition (accessed on 1 April 2020).
- Martins, V.J.B.; De Albuquerque, M.P.; Sawaya, A.L. Endocrine Changes in Undernutrition, Metabolic Programming, and Nutritional Recovery. In Handbook of Famine, Starvation, and Nutrient Deprivation; Preedy, V.R., Patel, V.B., Eds.; Springer International Publishing: New York, NY, USA, 2017. [Google Scholar] [CrossRef]
- Black, R.E.; Victora, C.G.; Walker, S.P.; Bhutta, Z.A.; Christian, P.; de Onis, M.; Ezzati, M.; Grantham-McGregor, S.; Katz, J.; Martorell, R.; et al. Maternal and child undernutrition and overweight in low-income and middle-income countries. Lancet 2013, 382, 427–451. [Google Scholar] [CrossRef]
- Kelishadi, R.; Hashemipour, M.; Adeli, K.; Tavakoli, N.; Movahedian-Attar, A.; Shapouri, J.; Poursafa, P.; Rouzbahani, A. Effect of Zinc Supplementation on Markers of Insulin Resistance, Oxidative Stress, and Inflammation among Prepubescent Children with Metabolic Syndrome. Metab. Syndr. Relat. Disord. 2010, 8, 505–510. [Google Scholar] [CrossRef] [PubMed]
- Uauy, R.; Kain, J.; Mericq, V.; Rojas, J.; Corvalán, C. Nutrition, child growth, and chronic disease prevention. Ann. Med. 2008, 40, 11–20. [Google Scholar] [CrossRef]
- Hara, T.; Takeda, T.-A.; Takagishi, T.; Fukue, K.; Kambe, T.; Fukada, T. Physiological roles of zinc transporters: Molecular and genetic importance in zinc homeostasis. J. Physiol. Sci. 2017, 67, 283–301. [Google Scholar] [CrossRef]
- Prasad, A.S. Clinical and biochemical manifestations of zinc deficiency in human subjects. J. Am. Coll. Nutr. 1985, 4, 65–72. [Google Scholar] [CrossRef]
- Maret, W. Zinc and human disease. Met. Ions. Life Sci. 2013, 13, 389–414. [Google Scholar]
- Prasad, A.S. Discovery of Human Zinc Deficiency: Its Impact on Human Health and Disease. Adv. Nutr. 2013, 4, 176–190. [Google Scholar] [CrossRef]
- Lopez, A.D.; Mathers, C.D.; Ezzati, M.; Jamison, D.T.; Murray, C.J. Global and regional burden of disease and risk factors, 2001: Systematic analysis of population health data. Lancet 2006, 367, 1747–1757. [Google Scholar] [CrossRef]
- Brown, K.H.; Wuehler, S.E. Zinc and Human Health: The Results of Recent Trials and Implications for Program Interventions and Research; Micronutrient Initiative: Ottawa, ON, Canada, 2000; pp. 1–69. [Google Scholar]
- De Benoist, B.; Darnton-Hill, I.; Davidsson, L.; Fontaine, O.; Hotz, C. Conclusions of the Joint WHO/UNICEF/IAEA/IZiNCG Interagency Meeting on Zinc Status Indicators. Food Nutr. Bull. 2007, 28, S480–S484. [Google Scholar] [CrossRef]
- Wessells, K.R.; Brown, K.H. Estimating the Global Prevalence of Zinc Deficiency: Results Based on Zinc Availability in National Food Supplies and the Prevalence of Stunting. PLoS ONE 2012, 7, e50568. [Google Scholar] [CrossRef] [PubMed]
- Wessells, K.R.; King, J.C.; Brown, K.H. Development of a Plasma Zinc Concentration Cutoff to Identify Individuals with Severe Zinc Deficiency Based on Results from Adults Undergoing Experimental Severe Dietary Zinc Restriction and Individuals with Acrodermatitis Enteropathica. J. Nutr. 2014, 144, 1204–1210. [Google Scholar] [CrossRef] [PubMed]
- Dibley, M.J.Z. Present Knowledge in Nutrition; International Life Sciences Institute Press: Washington, DC, USA, 2001; pp. 329–343. [Google Scholar]
- Monge, M.F.E.; Barrado, E.; Vicente, C.A.; Del Río, M.P.R.; De Miguelsanz, J.M.M. Zinc Nutritional Status in Patients with Cystic Fibrosis. Nutrients 2019, 11, 150. [Google Scholar] [CrossRef]
- Mataix Verdú, J.; García Diaz, J. NUTRIBER. V. 1.0; Fundación Universitaria Iberoamericana: Barcelona, Spain, 2005. [Google Scholar]
- Cuervo, M.; Corbalán, M.; Baladía, E.; Cabrerizo, L.; Formiguera, X.; Iglesias, C.; Lorenzo, H.; Polanco, I.; Quiles, J.; De Avila, M.D.R.; et al. Comparison of dietary reference intakes (DRI) between different countries of the European Union, The United States and the World Health Organization. Nutr. Hosp. 2009, 24, 384–414. [Google Scholar]
- EFSA—European Food Safety Authority. Scientific opinion on dietary reference values of zinc. EFSA Panel on dietetic products, nutrition and allergies (NDA). EFSA J. 2014, 12, 3844. [Google Scholar] [CrossRef]
- Frisancho, A.R. New norms of upper limb fat and muscle areas for assessment of nutritional status. Am. J. Clin. Nutr. 1981, 34, 2540–2545. [Google Scholar] [CrossRef]
- Hernández, M.; Sobradillo, B.; Aguirre, A.; Aresti, U.; Bilbao, A.; Fernández-Ramos, C.; Lizárraga, A.; Lorenzo, H.; Mada-riaga, L.; Rica, I.; et al. Curvas y Tablas de Crecimiento (Estudios Longitudinal y Transversal); Fundación Faustino Orbegozo: Bilbao, Spain, 1985. [Google Scholar]
- Alonso Franch, M.; Redondo Del Río, M.P.; Suárez Cortina, L. En Nombre del Comité de Nutrición de la Asociación Española de Pediatría. Nutrición infantil y salud ósea [Nutrition and bone health in children]. An Pediatr. (Barc.) 2010, 72, 1–11. (In Spanish) [Google Scholar] [CrossRef]
- Prasad, A.S. Lessons Learned from Experimental Human Model of Zinc Deficiency. J. Immunol. Res. 2020, 2020, 1–12. [Google Scholar] [CrossRef]
- Escobedo, M.F.; Barrado, E.; Alonso, C.; Marugán de Miguelsanz, J.M. Comparison study between colorimetric method and flame atomic absorption spectrophotometry in serum zinc status. Nutr. Clin. Diet. Hosp. 2018, 38, 128–133. [Google Scholar] [CrossRef]
- Gibson, R.S.; Hess, S.Y.; Hotz, C.; Brown, K.H. Indicators of zinc status at the population level: A review of the evidence. Br. J. Nutr. 2008, 99, S14–S23. [Google Scholar] [CrossRef]
- Hotz, C.; Peerson, J.M.; Brown, K.H. Suggested lower cutoffs of serum zinc concentrations for assessing zinc status: Reanalysis of the second National Health and Nutrition Examination Survey data (1976–1980). Am. J. Clin. Nutr. 2003, 78, 756–764. [Google Scholar] [CrossRef] [PubMed]
- Moran, V.H.; Stammers, A.-L.; Medina, M.W.; Patel, S.; Dykes, F.; Souverein, O.W.; Dullemeijer, C.; Pérez-Rodrigo, C.; Serra-Majem, L.; Nissensohn, M.; et al. The Relationship between Zinc Intake and Serum/Plasma Zinc Concentration in Children: A Systematic Review and Dose-Response Meta-Analysis. Nutrients 2012, 4, 841–858. [Google Scholar] [CrossRef] [PubMed]
- Roohani, N.; Hurrell, R.; Kelishadi, R.; Schulin, R. Zinc and its importance for human health: An integrative review. J. Res. Med. Sci. 2013, 18, 144–157. [Google Scholar] [PubMed]
- Maret, W.; Sandstead, H.H. Zinc requirements and the risks and benefits of zinc supplementation. J. Trace Elements Med. Biol. 2006, 20, 3–18. [Google Scholar] [CrossRef] [PubMed]
- Wieringa, F.T.; Dijkhuizen, M.A.; Fiorentino, M.; Laillou, A.; Berger, J. Determination of Zinc Status in Humans: Which Indicator Should We Use? Nutrients 2015, 7, 3252–3263. [Google Scholar] [CrossRef] [PubMed]
- Lowe, N.M.; Dykes, F.C.; Skinner, A.-L.; Patel, S.; Warthon-Medina, M.; Decsi, T.; Fekete, K.; Souverein, O.W.; Dullemeijer, C.; Cavelaars, A.E.; et al. EURRECA—Estimating Zinc Requirements for Deriving Dietary Reference Values. Crit. Rev. Food Sci. Nutr. 2013, 53, 1110–1123. [Google Scholar] [CrossRef]
- Serra-Majem, L.; Pfrimer, K.; Doreste-Alonso, J.; Ribas-Barba, L.; Sánchez-Villegas, A.; Ortiz-Andrellucchi, A.; Henriquez-Sanchez, P. Dietary assessment methods for intakes of iron, calcium, selenium, zinc and iodine. Br. J. Nutr. 2009, 102, S38–S55. [Google Scholar] [CrossRef]
- NHANES 1999–2000 Data Files, National Health and Nutrition Survey Data; Public Health Survey, Center for Disease Control and Prevention: Hyattsville, MD, USA, 2004.
- Olza, J.; Aranceta-Bartrina, J.; González-Gross, M.; Ortega, R.M.; Serra-Majem, L.; Varela-Moreiras, G.; Gil, Á. Reported Dietary Intake and Food Sources of Zinc, Selenium, and Vitamins A, E and C in the Spanish Population: Findings from the ANIBES Study. Nutrients 2017, 9, 697. [Google Scholar] [CrossRef]
- Morales-Suárez-Varela, M.; Rubio-López, N.; Ruso, C.; Llopis-Gonzalez, A.; Ruiz-Rojo, E.; Redondo, M.; Pico, Y. Anthropometric Status and Nutritional Intake in Children (6–9 Years) in Valencia (Spain): The ANIVA Study. Int. J. Environ. Res. Public Health 2015, 12, 16082–16095. [Google Scholar] [CrossRef]
- King, J.C.; Brown, K.H.; Gibson, R.S.; Krebs, N.F.; Lowe, N.M.; Siekmann, J.H.; Raiten, D.J. Biomarkers of Nutrition for Development (BOND)—Zinc Review. J. Nutr. 2015, 146, 858S–885S. [Google Scholar] [CrossRef] [PubMed]
- Wapnir, R.A. Zinc Deficiency, Malnutrition and the Gastrointestinal Tract. J. Nutr. 2000, 130, 1388S–1392S. [Google Scholar] [CrossRef]
- Hess, S.Y.; Peerson, J.M.; King, J.C.; Brown, K.H. Use of Serum Zinc Concentration as an Indicator of Population Zinc Status. Food Nutr. Bull. 2007, 28, S403–S429. [Google Scholar] [CrossRef] [PubMed]
- Shakur, S.; Malek, M.A.; Bano, N.; Rahman, M.; Ahmed, M. Serum and hair zinc in severely malnourished Bangladeshi children associated with or without acute lower respiratory infection. Indian J. Pediatr. 2009, 76, 609–614. [Google Scholar] [CrossRef]
- Brown, K.H.; Rivera, J.A.; Bhutta, Z.; Gibson, R.S.; King, J.C.; Lönnerdal, B.; Ruel, M.T.; Sandström, B.; Wasantwisut, E.; Hotz, C. International Zinc Nutrition Consultative Group (IZiNCG) technical document #1: Assessment of the risk of zinc deficiency in populations and options for its control. Food Nutr. Bull. 2004, 25, S99–S203. [Google Scholar] [PubMed]
- Sandström, B.; Cederblad, A. Zinc absorption from composite meals II. Influence of the main protein source. Am. J. Clin. Nutr. 1980, 33, 1778–1783. [Google Scholar] [CrossRef] [PubMed]
- Institute of Medicine, Food and Nutrition Board. Dietary Reference Intakes for Vitamin A, Vitamin K, Arsenic, Boron, Chro-mium, Copper, Iodine, Iron, Manganese, Molybdenum, Nickel, Silicon, Vanadium, and Zinc External Link Disclaimer; National Academy Press: Washington, DC, USA, 2001. [Google Scholar]
- Lönnerdal, B. Dietary Factors Influencing Zinc Absorption. J. Nutr. 2000, 130, 1378S–1383S. [Google Scholar] [CrossRef] [PubMed]
- Cakmak, I. Enrichment of cereal grains with zinc: Agronomic or genetic biofortification? Plant Soil 2008, 302, 1–17. [Google Scholar] [CrossRef]
- Rea, I.M. Sex and age changes in serum zinc levels. Nutr. Res. 1989, 9, 121–125. [Google Scholar] [CrossRef]
- Hennigar, S.R.; Lieberman, H.R.; Fulgoni, V.L.; McClung, J.P. Serum Zinc Concentrations in the US Population Are Related to Sex, Age, and Time of Blood Draw but Not Dietary or Supplemental Zinc. J. Nutr. 2018, 148, 1341–1351. [Google Scholar] [CrossRef]
- López, T.E.; Elízaga, I.V.; Garde, J.I.G.; Pérez, A.M.; Pujada, J.N.; Blasco, I.N.; Madre, M.I.A. Cardiovascular risk factors m relation to the serum concentrations of copper and zinc: Epidemiological study on children and adolescents in the Spanish province of Navarra. Acta Paediatr. 1997, 86, 248–253. [Google Scholar] [CrossRef]
- Ortega, R.M.; Rodríguez-Rodríguez, E.; Aparicio, A.; Jiménez, A.I.; López-Sobaler, A.M.; González-Rodríguez, L.G.; Andrés, P. Poor zinc status is associated with increased risk of insulin resistance in Spanish children. Br. J. Nutr. 2011, 107, 398–404. [Google Scholar] [CrossRef]
- Fan, Y.; Zhang, C.; Bu, J. Relationship between Selected Serum Metallic Elements and Obesity in Children and Adolescent in the U.S. Nutrients 2017, 9, 104. [Google Scholar] [CrossRef]
- López-Sobaler, A.M.; Aparicio, A.; González-Rodríguez, L.G.; Cuadrado-Soto, E.; Rubio, J.; Marcos, V.; Sanchidrián, R.; Santos, S.; Pérez-Farinós, N.; Re, M.; et al. Adequacy of Usual Vitamin and Mineral Intake in Spanish Children and Adolescents: ENALIA Study. Nutrients 2017, 9, 131. [Google Scholar] [CrossRef]
- Johnson, P.E.; Hunt, C.D.; Milne, D.B.; Mullen, L.K. Homeostatic control of zinc metabolism in men: Zinc excretion and balance in men fed diets low in zinc. Am. J. Clin. Nutr. 1993, 57, 557–565. [Google Scholar] [CrossRef]
- Jackson, M.J.; Jones, D.A.; Edwards, R.H.T. Tissue zinc levels as an index of body zinc status. Clin. Physiol. 1982, 2, 333–343. [Google Scholar] [CrossRef]
- Lowe, N.; Woodhouse, L.; King, J. A comparison of the short-term kinetics of zinc metabolism in women during fasting and following a breakfast meal. Br. J. Nutr. 1998, 80, 363–370. [Google Scholar] [CrossRef] [PubMed]
- Lowe, N.M.; Medina, M.W.; Stammers, A.-L.; Patel, S.; Souverein, O.W.; Dullemeijer, C.; Serra-Majem, L.; Nissensohn, M.; Moran, V.H. The relationship between zinc intake and serum/plasma zinc concentration in adults: A systematic review and dose–response meta-analysis by the EURRECA Network. Br. J. Nutr. 2012, 108, 1962–1971. [Google Scholar] [CrossRef] [PubMed]
- Moran, V.H.; Skinner, A.L.; Medina, M.W.; Patel, S.; Dykes, F.; Souverein, O.W.; Dullemeijer, C.; Lowe, M.N. The relationship between zinc intake and serum/plasma zinc concentration in pregnant and lactating women: A systematic review with dose-response me-ta-analyses. J. Trace Elem. Med. Biol. 2012, 26, 74–79. [Google Scholar] [CrossRef] [PubMed]
- Kondaiah, P.; Yaduvanshi, P.S.; Sharp, A.P.; Pullakhandam, R. Iron and Zinc Homeostasis and Interactions: Does Enteric Zinc Excretion Cross-Talk with Intestinal Iron Absorption? Nutrients 2019, 11, 1885. [Google Scholar] [CrossRef] [PubMed]
- Houghton, L.A.; Parnell, W.R.; Thomson, C.D.; Green, T.J.; Gibson, R.S. Serum Zinc Is a Major Predictor of Anemia and Mediates the Effect of Selenium on Hemoglobin in School-Aged Children in a Nationally Representative Survey in New Zealand. J. Nutr. 2016, 146, 1670–1676. [Google Scholar] [CrossRef]
- Fleet, J.C. Zinc, copper, and manganese. In Biochemical and Physiological Aspects of Human Nutrition; Stipanuk, M.H., Ed.; W.B. Saunders Company: Philadelpia, PA, USA, 2012; pp. 741–760. [Google Scholar]
- Azab, S.F.A.; Saleh, S.H.; Elsaeed, W.F.; Elshafie, M.A.; Sherief, L.M.; Esh, A.M.H. Serum trace elements in obese Egyptian children: A case–control study. Ital. J. Pediatr. 2014, 40, 20. [Google Scholar] [CrossRef] [PubMed]
- Perrone, L.; Gialanella, G.; Moro, R.; Feng, S.L.; Boccia, E.; Palombo, G.; Carbone, M.T.; Di Toro, R. Zinc, copper, and iron in obese children and adolescents. Nutr. Res. 1998, 18, 183–189. [Google Scholar] [CrossRef]
- Öztürk, A.; Çiçek, B.; Mazıcıoğlu, M.M.; Zararsız, G.; Kurtoğlu, S. Wrist Circumference and Frame Size Percentiles in 6-17-Year-Old Turkish Children and Adolescents in Kayseri. J. Clin. Res. Pediatr. Endocrinol. 2017, 9, 329–336. [Google Scholar] [CrossRef] [PubMed]
- Kelishadi, R.; Heidari-Beni, M.; Qorbani, M.; Motamed-Gorji, N.; Motlagh, M.E.; Ziaodini, H.; Taheri, M.; Ahadi, Z.; Aminaee, T.; Heshmat, R. Association between neck and wrist circumferences and cardiometabolic risk in children and adolescents: The CASPIAN-V study. Nutrition 2017, 43–44, 32–38. [Google Scholar] [CrossRef] [PubMed]
- Suliburska, J.; Coftal, S.; Gajewska, E.; Kalmus, G.; Sobieska, M.; Samborski, W.; Krejpcio, Z.; Drzymala, C.S.; Bogdanski, P. The evaluation of selected serum min-eral concentrations and their association with insulin resistance in obese adolescents. Eur. Rev. Med. Pharmacol. Sci. 2013, 17, 2396–2400. [Google Scholar]
- Nielsen, F.H. Marginal Zinc Deficiency Increases Magnesium Retention and Impairs Calcium Utilization in Rats. Biol. Trace Element Res. 2008, 128, 220–231. [Google Scholar] [CrossRef]
- Tuerk, M.J.; Fazel, N. Zinc deficiency. Curr. Opin. Gastroenterol. 2009, 25, 136–143. [Google Scholar] [CrossRef]
- Golden, M.H.N.; Golden, B.E. Effect of zinc supplementation on the dietary intake, rate of weight gain, and energy cost of tissue deposition in children recovering from severe malnutrition. Am. J. Clin. Nutr. 1981, 34, 900–908. [Google Scholar] [CrossRef]
- Mocchegiani, E.; Malavolta, M.; Muti, E.; Costarelli, L.; Cipriano, C.; Piacenza, F.; Tesei, S.; Giacconi, R.; Lattanzio, F. Zinc, Metallothioneins and Longevity: Interrelationships with Niacin and Selenium. Curr. Pharm. Des. 2008, 14, 2719–2732. [Google Scholar] [CrossRef]
- Vannucchi, H.; Moreno, F.S. Interaction of niacin and zinc metabolism in patients with alcoholic pellagra. Am. J. Clin. Nutr. 1989, 50, 364–369. [Google Scholar] [CrossRef]
- Wada, L.; King, J.C. Effect of low zinc intakes on basal metabolic rate, thyroid hormones and protein utilization in adult men. J. Nutr. 1986, 116, 1045–1053. [Google Scholar] [CrossRef]
- Prasad, A.S. Zinc in Human Health: Effect of Zinc on Immune Cells. Mol. Med. 2008, 14, 353–357. [Google Scholar] [CrossRef]
- Shankar, A.H.; Prasad, A.S. Zinc and immune function: The biological basis of altered resistance to infection. Am. J. Clin. Nutr. 1998, 68, 447S–463S. [Google Scholar] [CrossRef]
- Bonaventura, P.; Benedetti, G.; Albarède, F.; Miossec, P. Zinc and its role in immunity and inflammation. Autoimmun. Rev. 2015, 14, 277–285. [Google Scholar] [CrossRef]
- Zamarron, B.F.; Chen, W. Dual Roles of Immune Cells and Their Factors in Cancer Development and Progression. Int. J. Biol. Sci. 2011, 7, 651–658. [Google Scholar] [CrossRef]
- Hasan, R.; Rink, L.; Haase, H. Chelation of Free Zn2+ Impairs Chemotaxis, Phagocytosis, Oxidative Burst, Degranulation, and Cytokine Production by Neutrophil Granulocytes. Biol. Trace Elem. Res. 2016, 171, 79–88. [Google Scholar] [CrossRef]
- Freire, S.C.; Fisberg, M.; Cozzolino, S.M.F. Dietary Intervention Causes Redistribution of Zinc in Obese Adolescents. Biol. Trace Element Res. 2013, 154, 168–177. [Google Scholar] [CrossRef]
- Escobedo-Monge, M.F.; Ayala-Macedo, G.; Sakihara, G.; Peralta, S.; Almaraz-Gómez, A.; Barrado, E.; Marugán-Miguelsanz, J.M. Effects of Zinc Supplementation on Nutritional Status in Children with Chronic Kidney Disease: A Randomized Trial. Nutrients 2019, 11, 2671. [Google Scholar] [CrossRef]
- Escobedo-Monge, M.A.; Aparicio, S.; Escobedo-Monge, M.F.; Marugán-Miguelsanz, J.M. Long-Term Effects of the Application of Urban Waste Compost and Other Organic Amendments on Solanum tuberosum L. Agronomy 2020, 10, 1575. [Google Scholar] [CrossRef]


| Characteristics | Obesity (N = 24) | Undernutrition (N = 30) | Eutrophic (N = 24) | p-Value |
|---|---|---|---|---|
| Mean ± SD | Mean ± SD | Mean ± SD | ||
| Female (%) | 15 (62.5) | 17 (56.7) | 11 (45.8) | 0.472 |
| Age (years) | 11.3 ± 3.9 | 7.2 ± 4.9 | 10.5 ± 4.7 | 0.240 |
| Children (age in years) | 6.9 ± 2.8 | 4.5 ± 2.8 * | 7.2 ± 3.3 | 0.026 *** |
| Adolescent (age in years) | 13.4 ± 2.1 | 13.5 ± 1.8 | 14.5 ± 2.3 | 0.363 |
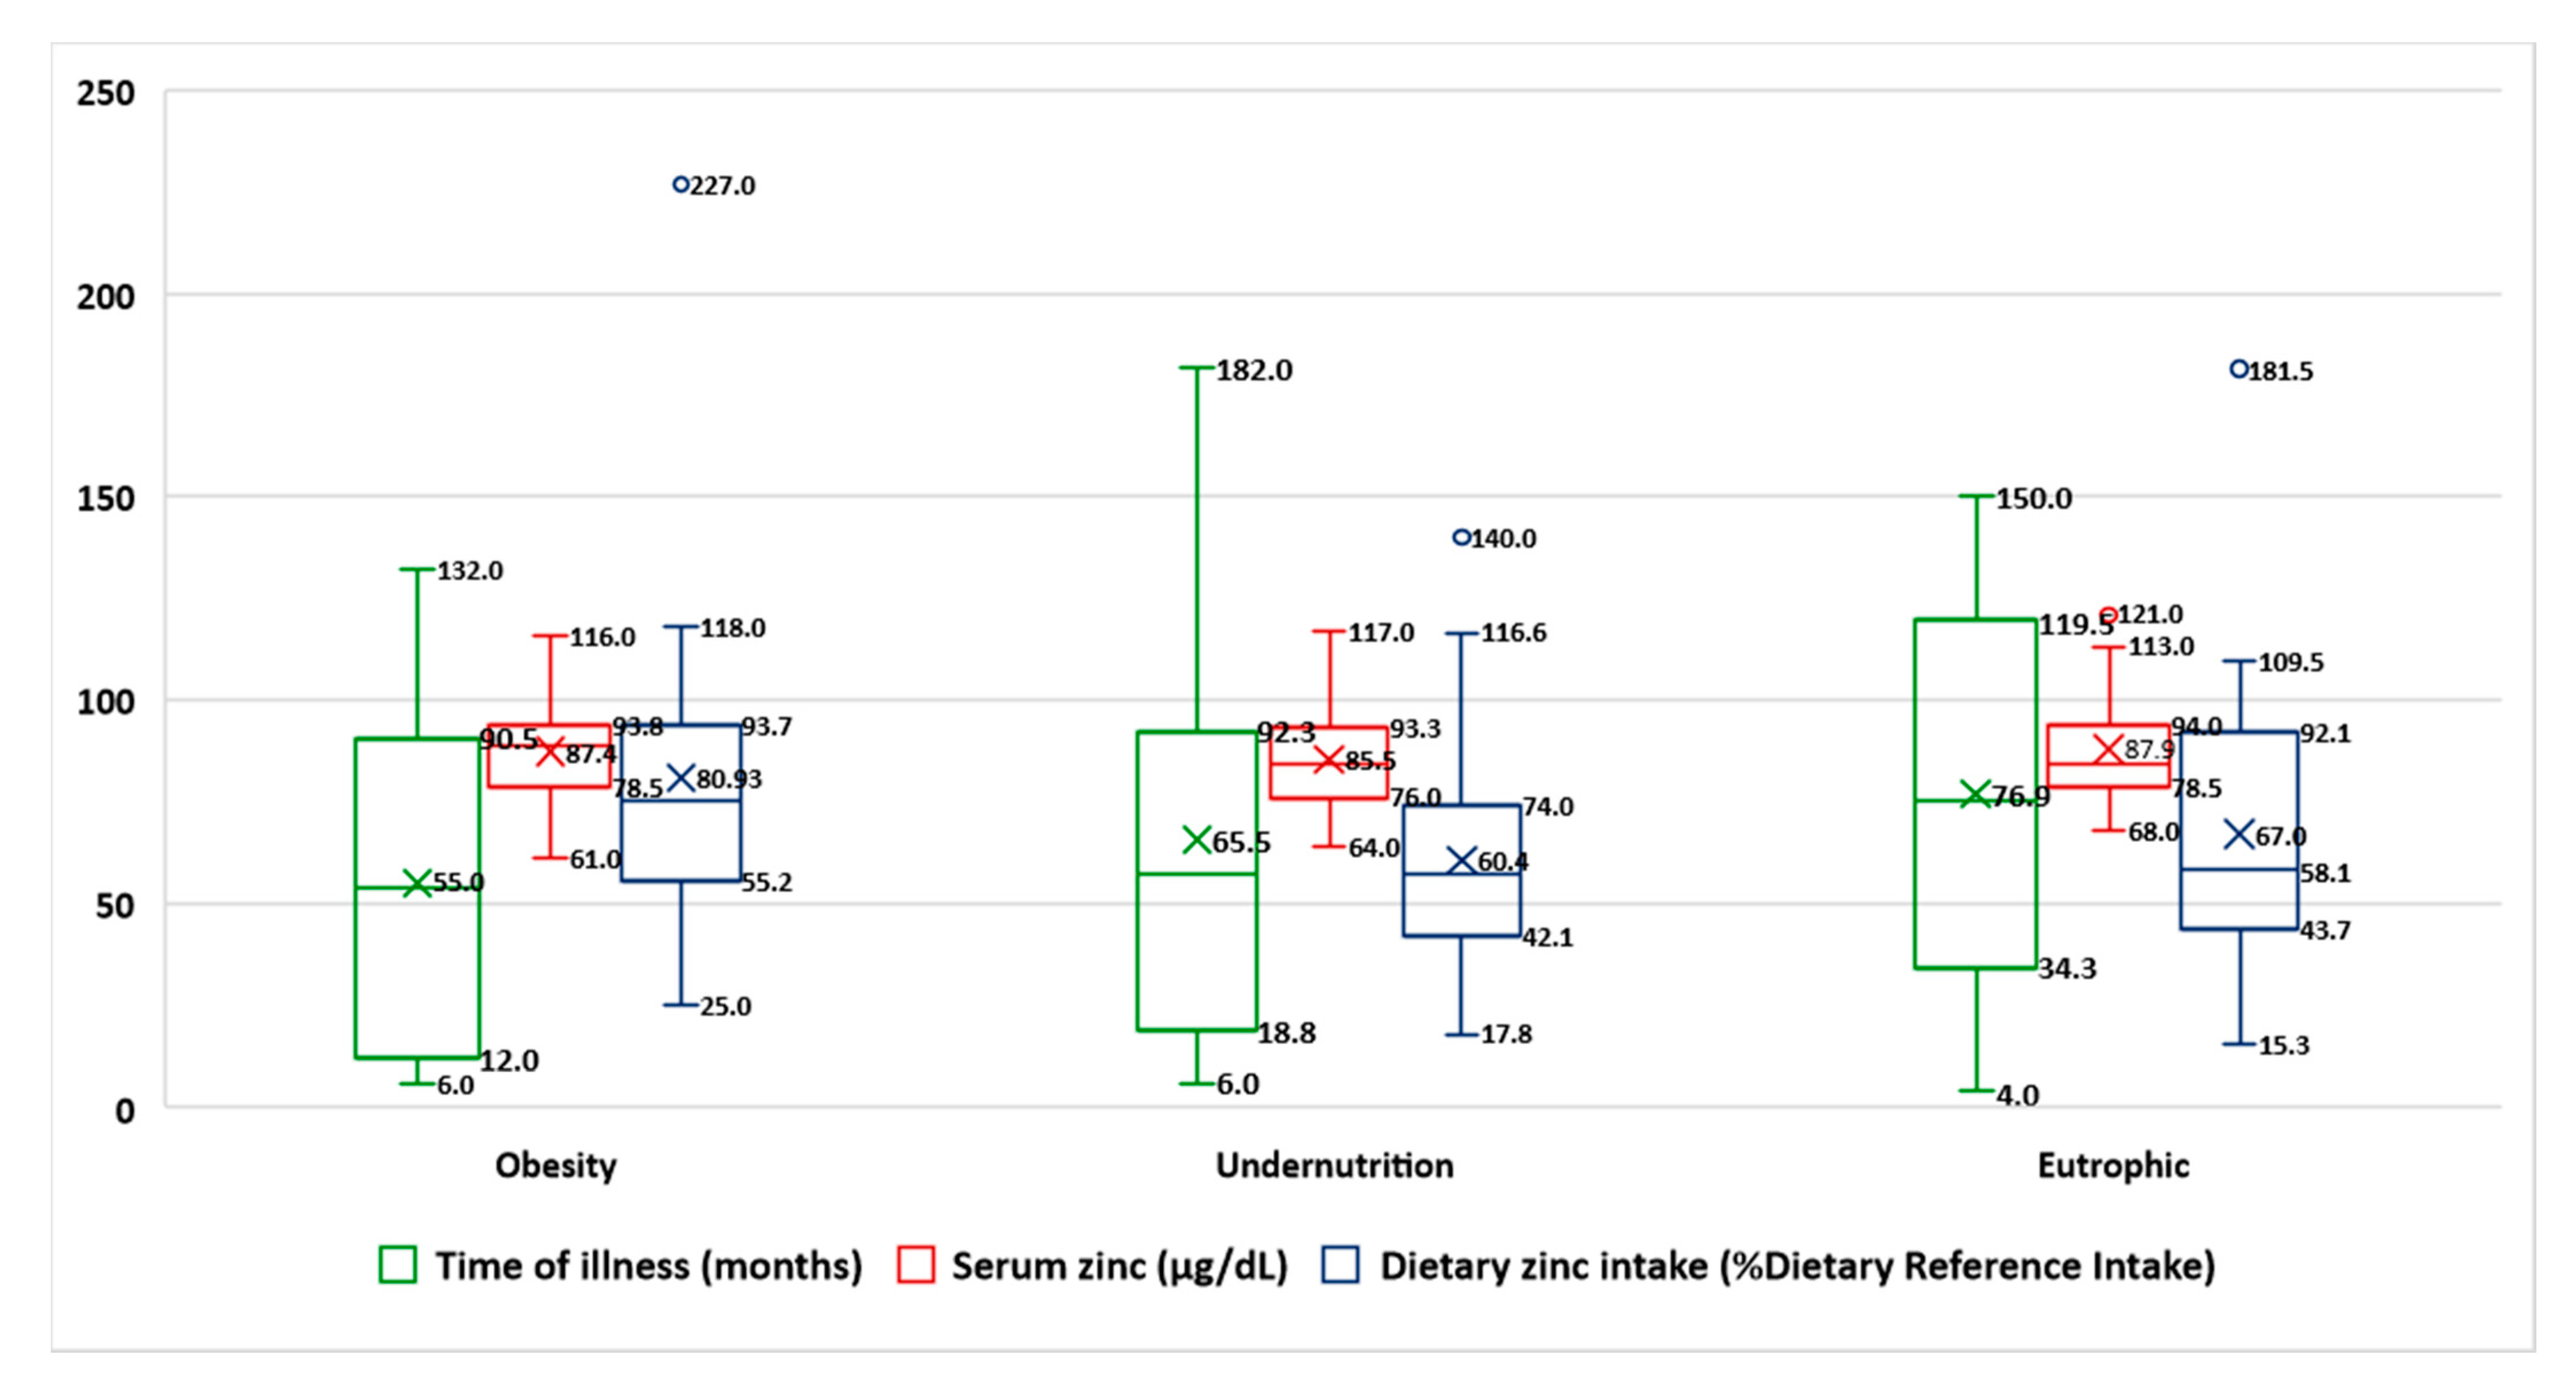
| Time of chronic disease (months) | 55 ± 38.4 | 65.5 ± 52.8 | 76.9 ± 47.5 | 0.282 |
| Wrist circumference (cm) | 16.6 ± 3.3 | 11.6 ± 2.4 | 14 ± 3.3 | 0.000 *** |
| Biceps skinfold Z-score | 2 ± 1.9 | −1.9 ± 0.6 | −0.7 ± 1.2 | 0.000 *** |
| Blood Analytic | ||||
| Prealbumin (NV > 18 mg/dL) | 23.7 ± 5.6 | 20.9 ± 5.8 | 21 ± 5.8 | 0.185 |
| Zinc (NV 70–120 µg/dL) | 87.4 ± 12.2 | 85.8 ± 12.6 | 87.9 ± 13 | 0.761 |
| Iron (NV 60–100 µg/dL) | 80.7 ± 20.7 | 75.6 ± 39.9 | 80.4 ± 28 | 0.806 |
| Lymphocytes (NV > 2000 cell/mm3) | 2887 ± 1527 | 3605 ± 1641 | 2615 ± 719 | 0.028 *** |
| Hypozincemia cases (%) | 2 (8.3) | 2 (6.7) | 1 (4.2) | |
| Prospective Dietary Survey | ||||
| Dietary zinc (NV 80–120% DRI) | 80.9 ± 40 | 60.4 ± 30 | 66.9 ± 35 | 0.110 |
| Dietary zinc intake (mg/day) ** | 12 ± 6.1 | 9 ± 4.5 | 10 ± 5.2 | 0.109 |
| Carbohydrates (NV 80–120% DRI) | 81.3 ± 50 | 79.6 ±25.9 | 77.5 ± 27.4 | 0.182 |
| Energy (NV 80–120% DRI) | 87 ± 22.7 | 95.6 ± 25.5 | 97.8 ± 23.2 | 0.276 |
| Niacin (NV 80–120% DRI) | 154 ± 49.3 | 126 ± 56 | 142 ± 50.3 | 0.161 |
| Magnesium (NV 80–120% DRI) | 107 ± 41 | 103.5 ± 41.1 | 103.7 ± 34.5 | 0.942 |
| Iron (NV 80–120% DRI) | 157 ± 127 | 181 ± 118 | 205 ± 145.6 | 0.531 |
| Dietary zinc deficiency cases (%) | 14 (58.3) | 22 (73.3) | 17 (70.8) | 0.388 |
| Obesity (N = 24) | Undernutrition (N = 30) | Eutrophic (N = 24) | ||||
|---|---|---|---|---|---|---|
| Serum Zinc Concentration | Dietary Zinc Intake | Serum Zinc Concentration | Dietary Zinc Intake | Serum Zinc Concentration | Dietary Zinc Intake | |
| Linear regression analysis | Wrist circumference r = 0.229, p = 0.018 Magnesium intake r = 0.244, p = 0.0014 Serum iron r = 0.228, p = 0.021 | Iron intake r = 0.366, p = 0.002 Prealbumin r = 0.303, p = 0.010 | Biceps skinfold Z-score r = 0.260, p = 0.008 | Energy intake p = 0.278, p = 0.003 Carbohydrates intake r = 0.331, p = 0.001 Niacin intake r = 0.254, p = 0.005 Magnesium intake r = 0.442, p = 0.000 Iron intake (r = 0.222, p = 0.002 | Lymphocytes r = 0.269, p = 0.009 | Niacin intake r = 0.203, p = 0.027 |
| Multiple regression analysis | Wrist circumference and Serum iron r = 0.487, p = 0.008 | Carbohydrates and Magnesium intake r = 0.572, p = 0.009 | ||||
Publisher’s Note: MDPI stays neutral with regard to jurisdictional claims in published maps and institutional affiliations. |
© 2021 by the authors. Licensee MDPI, Basel, Switzerland. This article is an open access article distributed under the terms and conditions of the Creative Commons Attribution (CC BY) license (http://creativecommons.org/licenses/by/4.0/).
Share and Cite
Escobedo-Monge, M.F.; Torres-Hinojal, M.C.; Barrado, E.; Escobedo-Monge, M.A.; Marugán-Miguelsanz, J.M. Zinc Nutritional Status in a Series of Children with Chronic Diseases: A Cross-Sectional Study. Nutrients 2021, 13, 1121. https://doi.org/10.3390/nu13041121
Escobedo-Monge MF, Torres-Hinojal MC, Barrado E, Escobedo-Monge MA, Marugán-Miguelsanz JM. Zinc Nutritional Status in a Series of Children with Chronic Diseases: A Cross-Sectional Study. Nutrients. 2021; 13(4):1121. https://doi.org/10.3390/nu13041121
Chicago/Turabian StyleEscobedo-Monge, Marlene Fabiola, María Carmen Torres-Hinojal, Enrique Barrado, María Antonieta Escobedo-Monge, and José Manuel Marugán-Miguelsanz. 2021. "Zinc Nutritional Status in a Series of Children with Chronic Diseases: A Cross-Sectional Study" Nutrients 13, no. 4: 1121. https://doi.org/10.3390/nu13041121
APA StyleEscobedo-Monge, M. F., Torres-Hinojal, M. C., Barrado, E., Escobedo-Monge, M. A., & Marugán-Miguelsanz, J. M. (2021). Zinc Nutritional Status in a Series of Children with Chronic Diseases: A Cross-Sectional Study. Nutrients, 13(4), 1121. https://doi.org/10.3390/nu13041121