
Development and Reliability of the Oxford Meat Frequency Questionnaire


Abstract

1. Introduction
2. Materials and Methods
2.1. Development of the MFQ
Objectives
2.2. Development Process
2.3. MFQ Format
2.4. Reliability Study
2.5. Participants
2.6. Statistical Analysis
2.7. Data Preparation
2.8. Sample Exploration
2.9. Primary Analysis
2.10. Secondary Analysis
3. Results
3.1. Sample
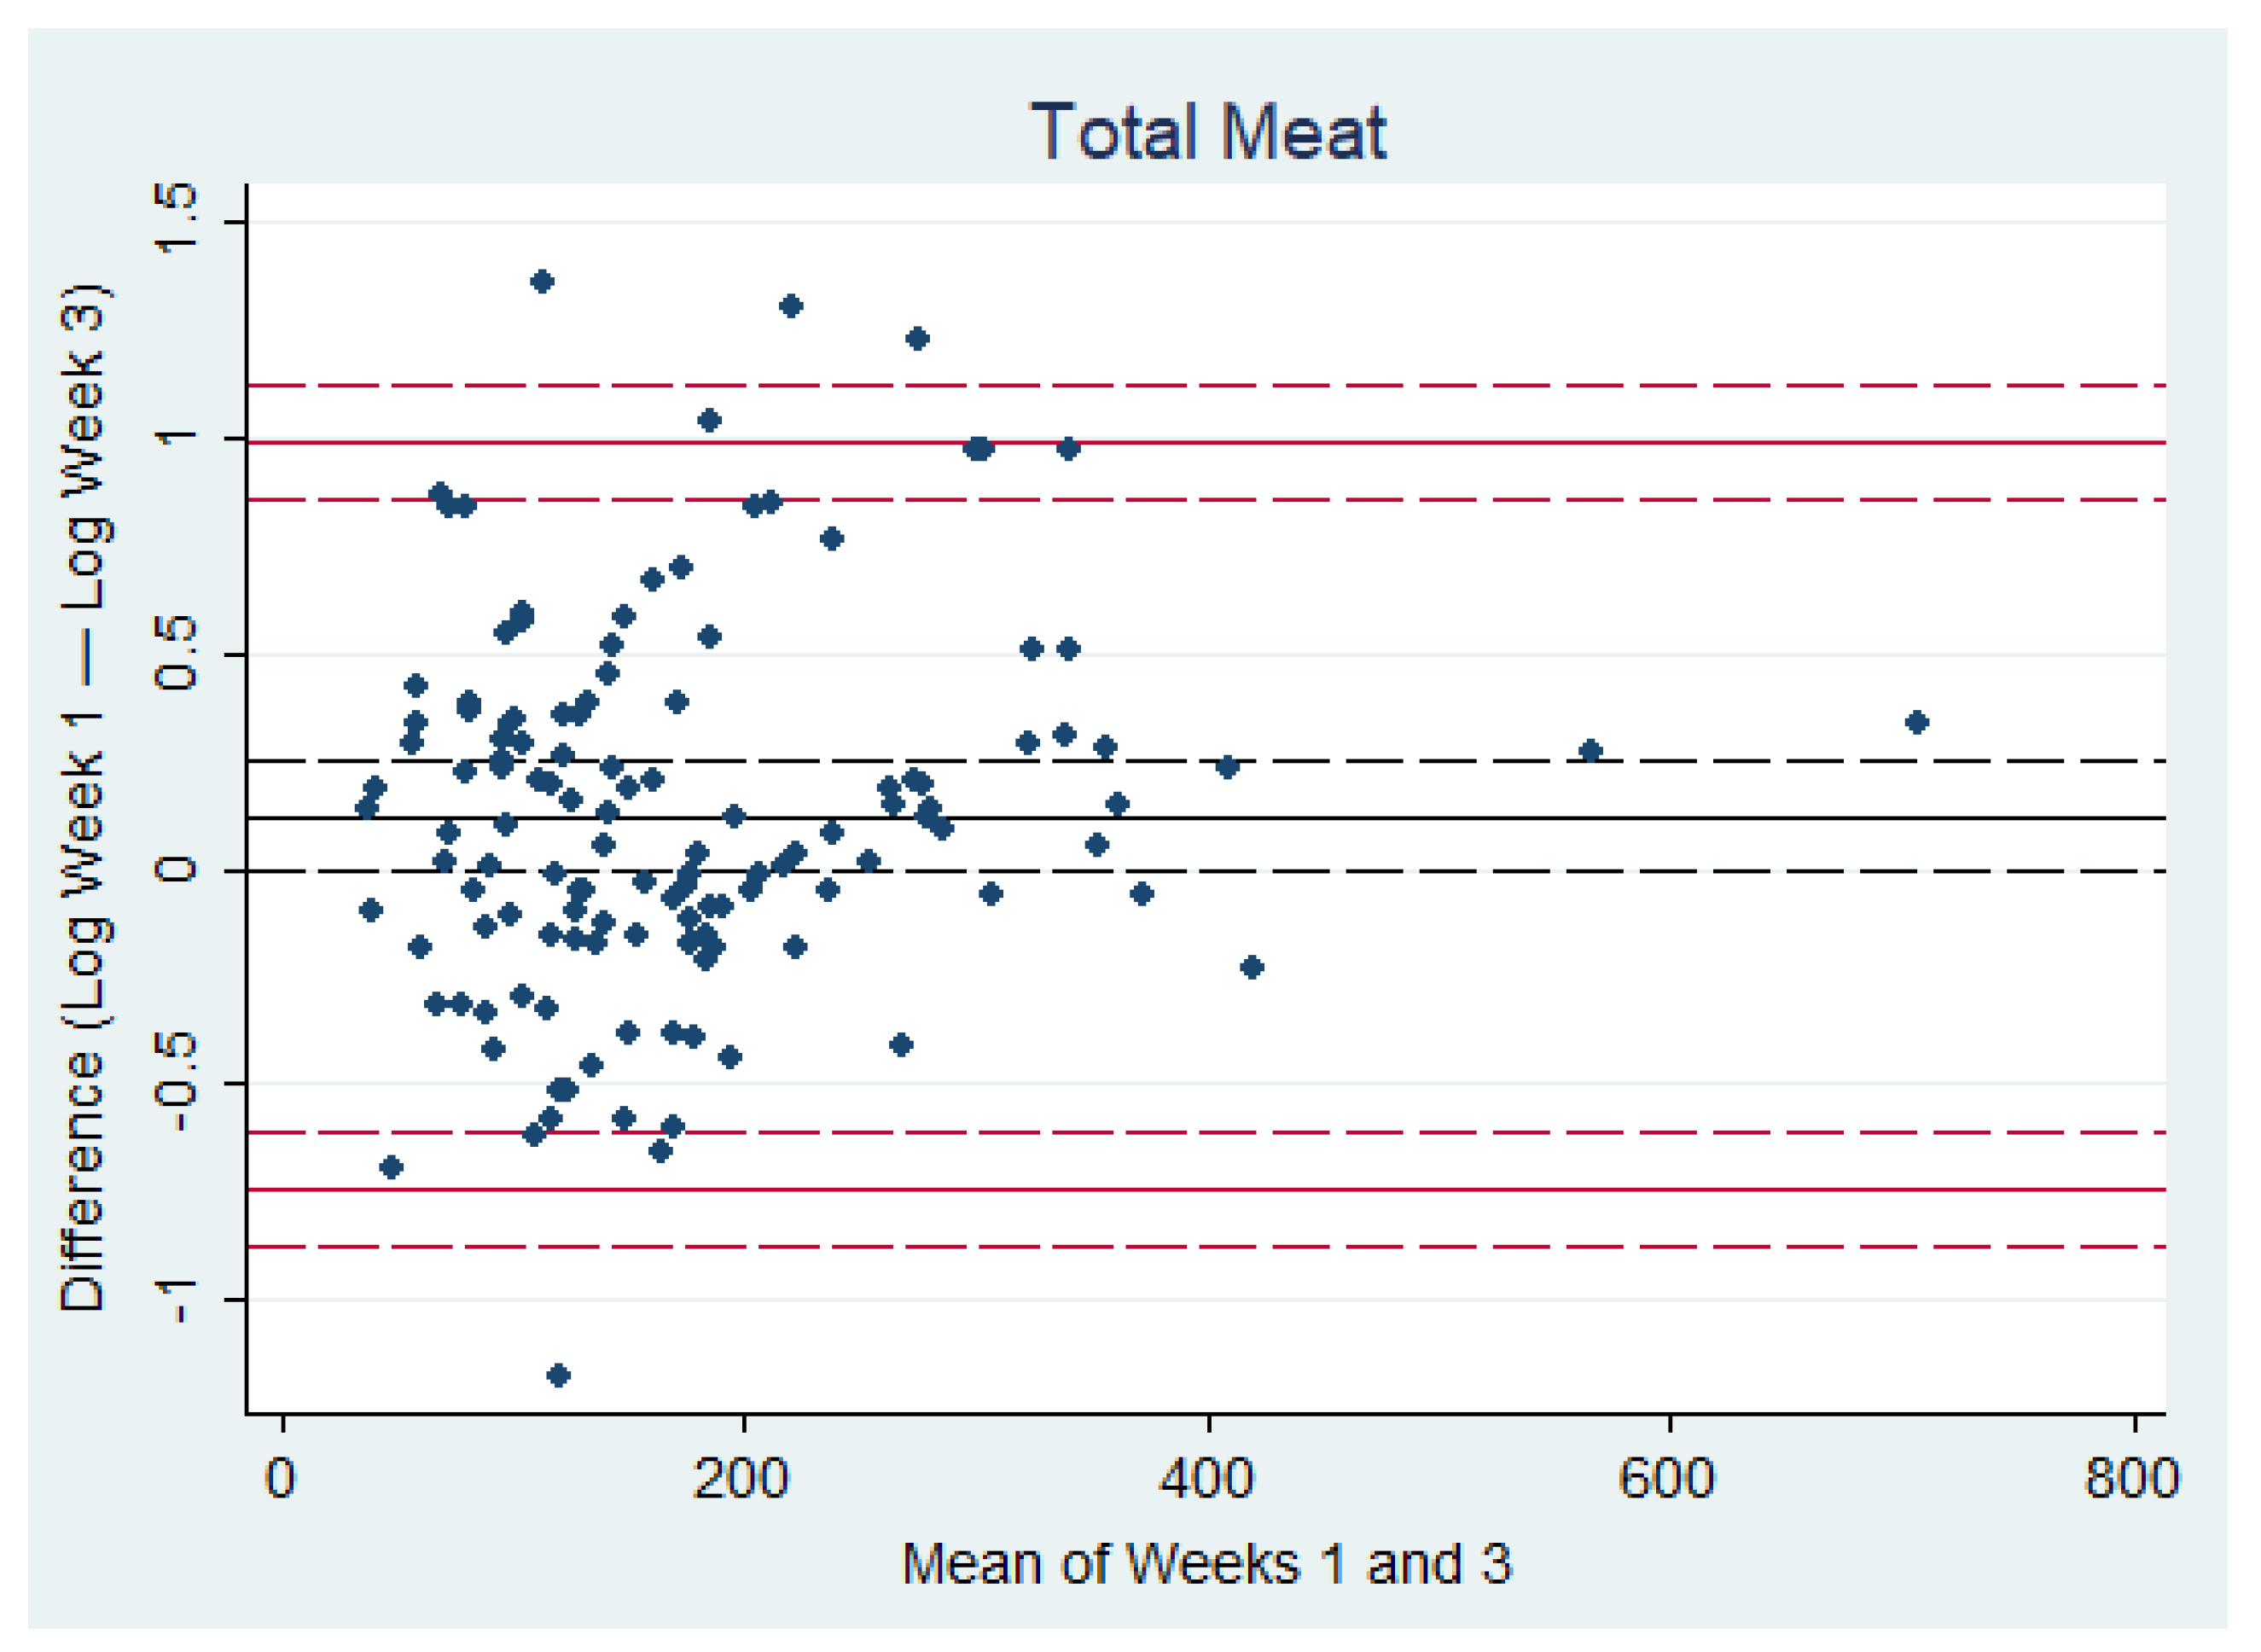
3.2. ICC and Test–Retest Reliability
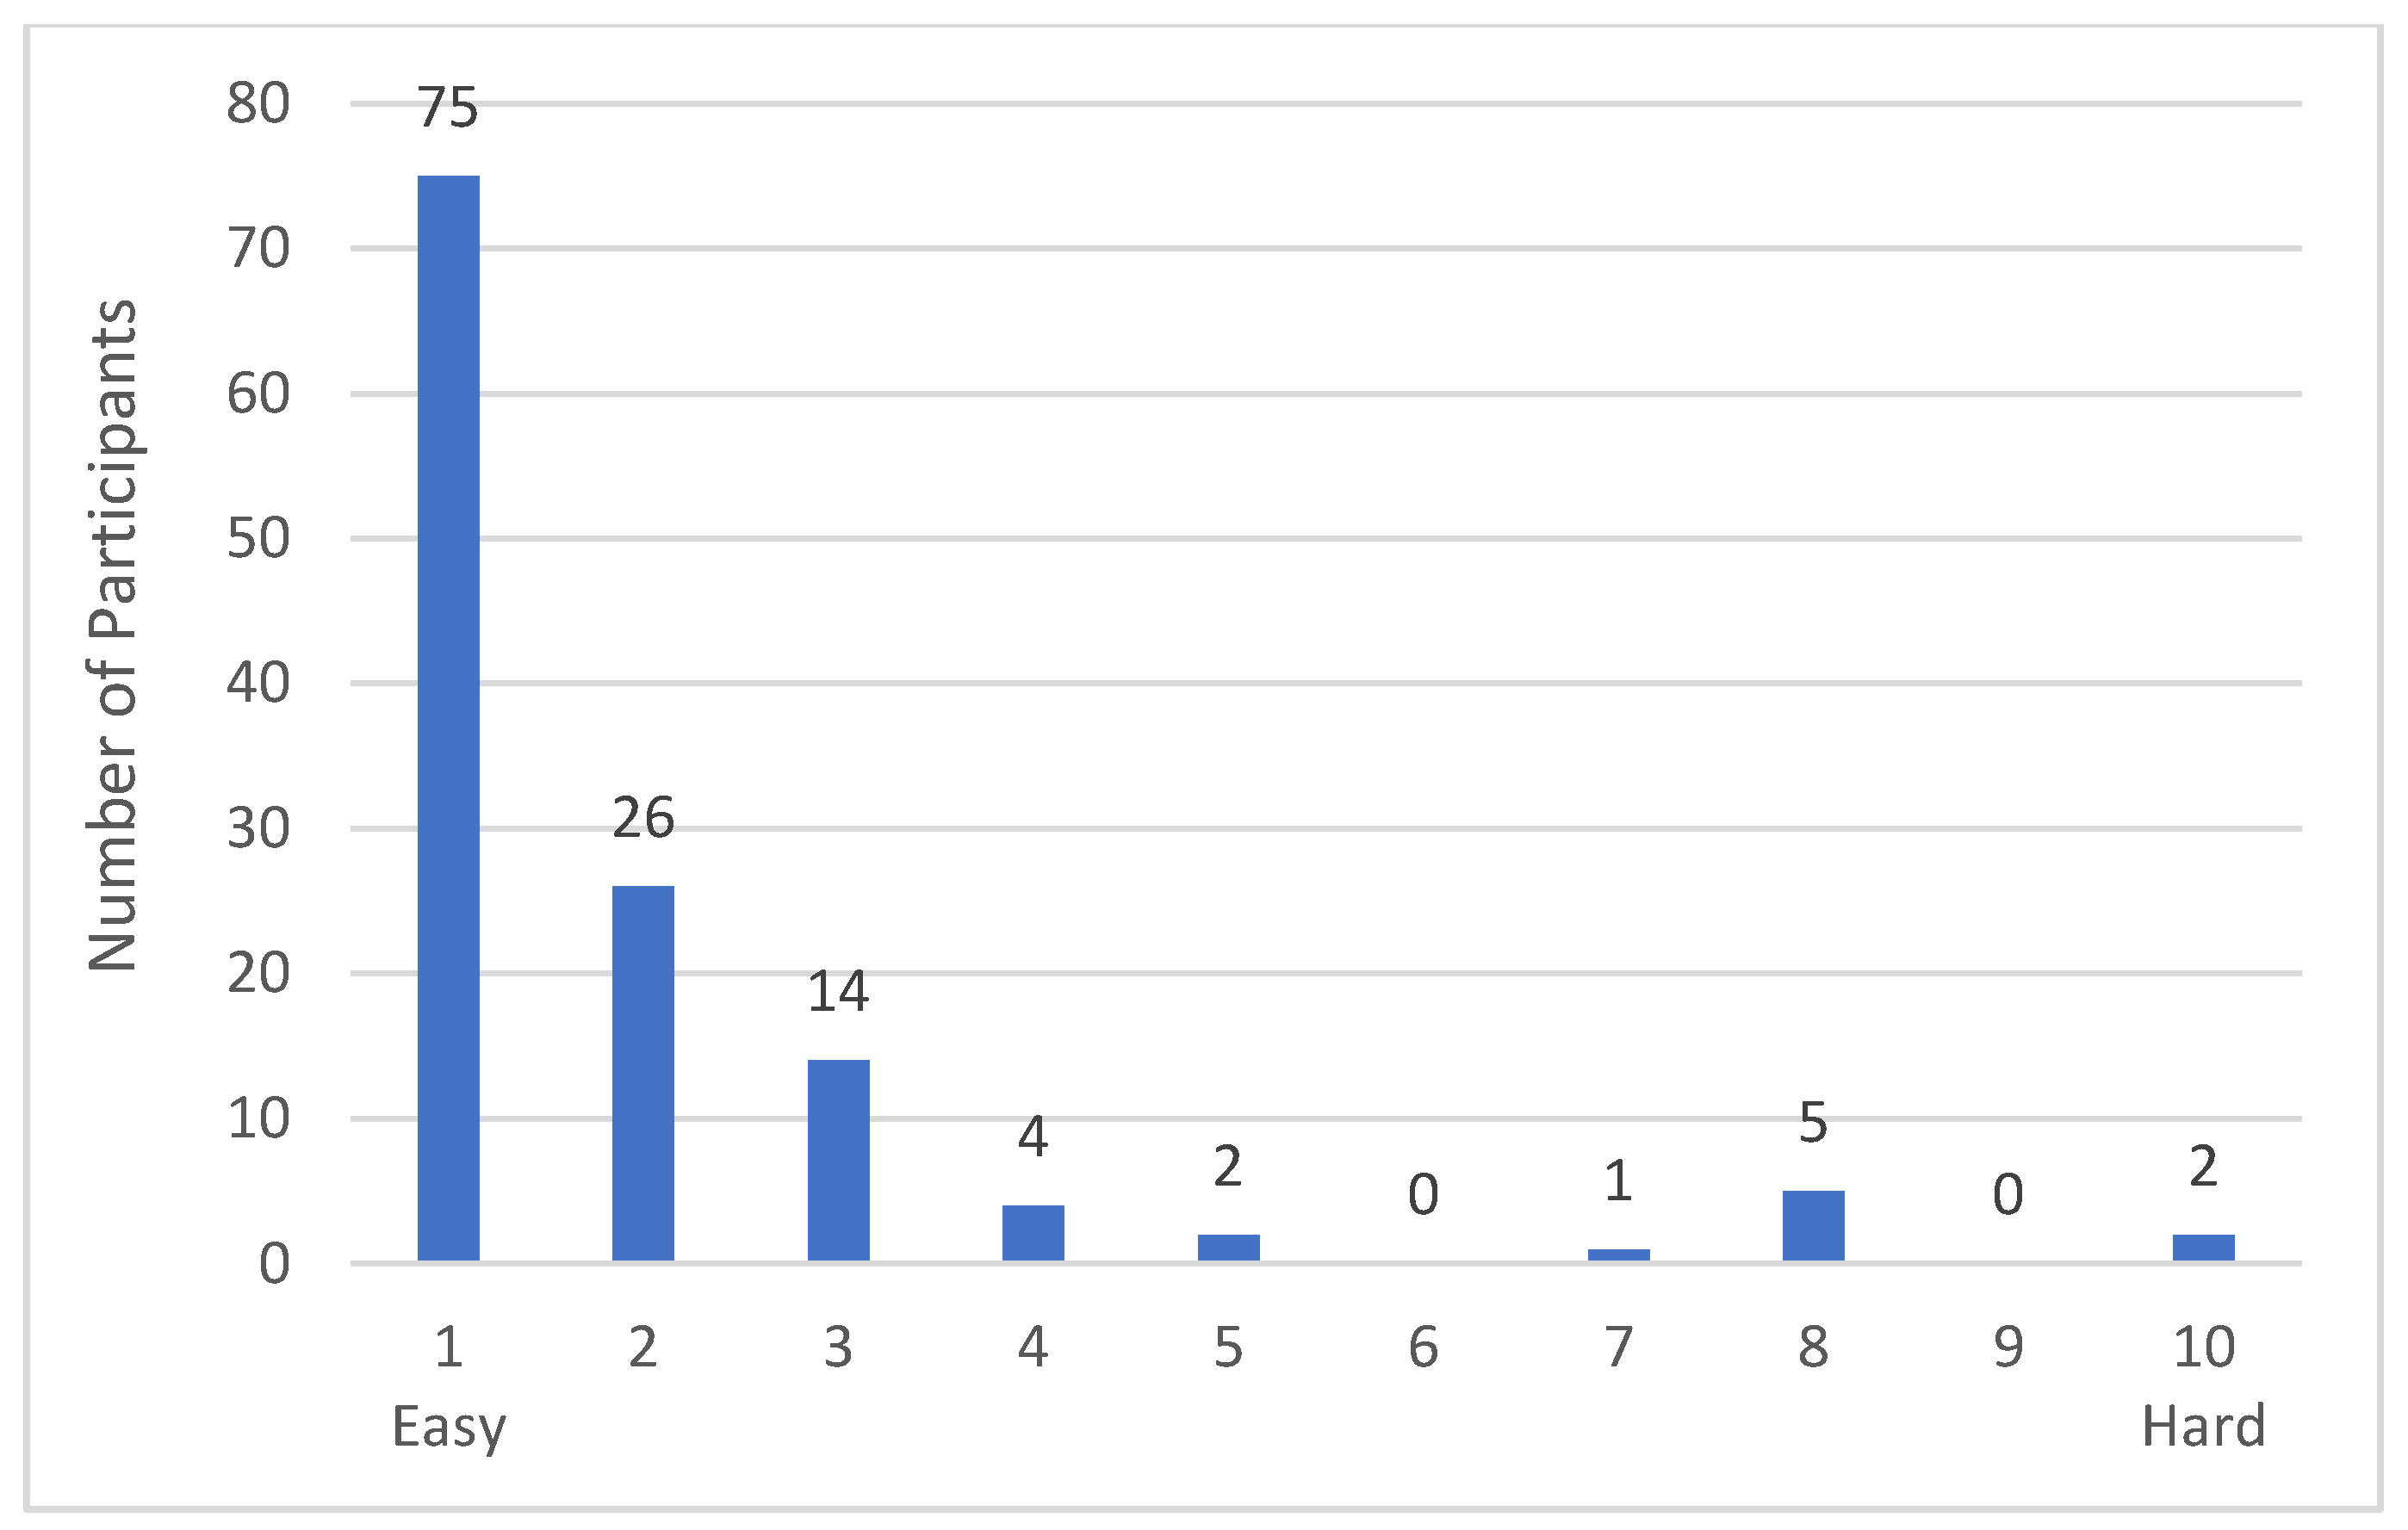
3.3. Instrument Evaluation
“It actually just made me realise how often I eat meat, every single day apparently!”
“This has kind of made me realize I eat more meat each week than I thought.”
“It’s made me think about the amount of meat I eat, and following a discussion with my wife, we have now decided to start with 1 no meat day a week and work towards more.”
“The study has made me think about what I am eating and I have promised myself to keep a food diary going forwards.”
“Some food stuffs I felt were unclear—does dried sausage such as saucisson sec or kabanos count as a ‘slice’, or a sausage, or in the sausage roll category?”
“When scrolling on my mobile, sometimes I would catch the sliders for other answers. It was a minor annoyance but could lead to an incorrect entry if a participant didn’t notice they’d done it before submitting their answer.”
“Could easily put a poultry sausage in when it was meant to be a pork sausage, for example, as you see “sausage” (which in the UK is usually pork), forgetting you are in the poultry section and the pork section is below.”
4. Discussion
5. Strengths and Limitations
6. Conclusions
Supplementary Materials
Author Contributions
Funding
Institutional Review Board Statement
Informed Consent Statement
Data Availability Statement
Acknowledgments
Conflicts of Interest
References
- Waruni, S.; Rupasinghe, W.A.; Harashani Perera, T.S.; Niramali Wickramaratne, M. A comprehensive review on dietary assessment methods in epidemiological research. J. Pub Health Nutr. 2020, 3, 204–211. [Google Scholar]
- Shim, J.-S.; Oh, K.; Kim, H.C. Dietary assessment methods in epidemiologic studies. Epidemiol. Health 2014, 36, e2014009. [Google Scholar] [CrossRef] [PubMed]
- Cade, J.; Thompson, R.; Burley, V.; Warm, D. Development, validation and utilisation of food-frequency questionnaires—A review. Public Health Nutr. 2002, 5, 567–587. [Google Scholar] [CrossRef]
- Bradbury, K.E.; Young, H.J.; Guo, W.; Key, T.J. Dietary assessment in UK Biobank: An evaluation of the performance of the touchscreen dietary questionnaire. J. Nutr. Sci. 2018, 7, e6. [Google Scholar] [CrossRef] [PubMed]
- Sebring, N.G.; Denkinger, B.I.; Menzie, C.M.; Yanoff, L.B.; Parikh, S.J.; Yanovski, J.A. Validation of three food frequency questionnaires to assess dietary calcium intake in adults. J. Am. Diet. Assoc. 2007, 107, 752–759. [Google Scholar] [CrossRef] [PubMed]
- Combet, E.; Lean, M.E. Validation of a short food frequency questionnaire specific for iodine in U.K. females of childbearing age. J. Hum. Nutr. Diet. 2014, 27, 599–605. [Google Scholar] [CrossRef]
- Godfray, H.C.J.; Aveyard, P.; Garnett, T.; Hall, J.W.; Key, T.J.; Lorimer, J.; Pierrehumbert, R.T.; Scarborough, P.; Springmann, M.; Jebb, S.A. Meat consumption, health, and the environment. Science 2018, 361. [Google Scholar] [CrossRef]
- Springmann, M.; Clark, M.; Mason-D’Croz, D.; Wiebe, K.; Bodirsky, B.L.; Lassaletta, L.; de Vries, W.; Vermeulen, S.J.; Herrero, M.; Carlson, K.M.; et al. Options for keeping the food system within environmental limits. Nature 2018, 562, 519–525. [Google Scholar] [CrossRef]
- Keating, G.A.; Bogen, K.T.; Chan, J.M. Development of a meat frequency questionnaire for use in diet and cancer studies. J. Am. Diet. Assoc. 2007, 107, 1356–1362. [Google Scholar] [CrossRef]
- Dahl, L.; Maeland, C.A.; Bjorkkjaer, T. A short food frequency questionnaire to assess intake of seafood and n-3 supplements: Validation with biomarkers. Nutr. J. 2011, 10, 127. [Google Scholar] [CrossRef]
- Perez Rodrigo, C.; Aranceta, J.; Salvador, G.; Varela-Moreiras, G. Food frequency questionnaires. Nutr. Hosp. 2015, 31 (Suppl. 3), 49–56. [Google Scholar] [CrossRef]
- FSA. Food Portion Sizes, 3rd ed.; TSO: Norwich, UK, 2002. [Google Scholar]
- Fitt, E.; Mak, T.N.; Stephen, A.M.; Prynne, C.; Roberts, C.; Swan, G.; Farron-Wilson, M. Disaggregating composite food codes in the UK National Diet and Nutrition Survey food composition databank. Eur. J. Clin. Nutr. 2010, 64 (Suppl. 3), S32–S36. [Google Scholar] [CrossRef]
- British Nutrition Foundation. Find Your Balance—Get Portion Wise! Available online: https://www.nutrition.org.uk/healthyliving/find-your-balance/portionwise.html (accessed on 19 May 2020).
- The British Dietetic Association. Available online: https://www.bda.uk.com/resourceDetail/printPdf/?resource=food-facts-portion-sizes (accessed on 19 May 2020).
- Frie, K.; Stewart, C.; Cook, B.; Jebb, S. The Meat Frequency Questionnaire (MFQ) Study—A Test-Retest Reliability Study. Available online: https://osf.io/7z9s2/ (accessed on 12 April 2020).
- McGraw, K.O.; Wong, S.P. Forming Inferences About Some Intraclass Correlation Coefficients. Psychol. Methods 1996, 1, 30–46. [Google Scholar] [CrossRef]
- Landis, J.R.; Koch, G.G. The measurement of observer agreement for categorical data. Biometrics 1977, 33, 159–174. [Google Scholar] [CrossRef]
- Gevers, D.W.M.; Kremers, S.P.J.; de Vries, N.K.; van Assema, P. The Comprehensive Snack Parenting Questionnaire (CSPQ): Development and Test-Retest Reliability. Int. J. Environ. Res. Public Health 2018, 15, 862. [Google Scholar] [CrossRef]
- Bland, J.M.; Altman, D.G. Statistical methods for assessing agreement between two methods of clinical measurement. Lancet 1986, 327, 307–310. [Google Scholar] [CrossRef]
- Bland, J.M.; Altman, D.G. Measuring agreement in method comparison studies. Stat. Methods Med. Res. 1999, 8, 135–160. [Google Scholar] [CrossRef] [PubMed]
- Braun, V.; Clarke, V. Thematic Analysis. In APA Handbook of Research Methods in Psychology, Vol. 2. Research Designs: Quantitative, Qualitative, Neuropsychological, and Biological; Cooper, H., Camic, P.M., Long, D.L., Panter, A.T., Rindskopf, D., Sher, K.J., Eds.; American Psychological Association: Washington, DC, USA, 2012; pp. 57–71. [Google Scholar]
- Cantin, J.; Latour, E.; Ferland-Verry, R.; Morales Salgado, S.; Lambert, J.; Faraj, M.; Nigam, A. Validity and reproducibility of a food frequency questionnaire focused on the Mediterranean diet for the Quebec population. Nutr. Metab. Cardiovasc. Dis. 2016, 26, 154–161. [Google Scholar] [CrossRef]
- Labonte, M.E.; Cyr, A.; Baril-Gravel, L.; Royer, M.M.; Lamarche, B. Validity and reproducibility of a web-based, self-administered food frequency questionnaire. Eur. J. Clin. Nutr. 2012, 66, 166–173. [Google Scholar] [CrossRef]
- Hebden, L.; Kostan, E.; O’Leary, F.; Hodge, A.; Allman-Farinelli, M. Validity and reproducibility of a food frequency questionnaire as a measure of recent dietary intake in young adults. PLoS ONE 2013, 8, e75156. [Google Scholar] [CrossRef]
- Van Dinh, T.; Van Dong, H.; Chung, N.T.; Lee, A.H. Validity and reliability of a food frequency questionnaire to assess habitual dietary intake in Northern Vietnam. Vietnam J. Public Health 2013, 1, 57–64. [Google Scholar]
- Stewart, C.; Piernas, C.; Cook, B.; Jebb, S.A. Trends in meat consumption in the UK: Analysis of the National Diet and Nutrition Survey Rolling Programme Year 1–9 (2008/09–2016/17). 2020; (Manuscript submitted for publication). [Google Scholar]
- Jackson, K.A.; Byrne, N.M.; Magarey, A.M.; Hills, A.P. Minimizing random error in dietary intakes assessed by 24-h recall, in overweight and obese adults. Eur. J. Clin. Nutr. 2008, 62, 537–543. [Google Scholar] [CrossRef] [PubMed]
- Post, B.; Kemper, H.C.; Storm-Van Essen, L. Longitudinal changes in nutritional habits of teenagers: Differences in intake between schooldays and weekend days. Br. J. Nutr. 1987, 57, 161–176. [Google Scholar] [CrossRef]
- Kanfer, F.H. Self-Monitoring—Methodological Limitations and Clinical Applications. J. Consult. Clin. Psych. 1970, 35, 148–152. [Google Scholar] [CrossRef]
- Kanfer, F.H.; Karoly, P. Self-Control: A Behavioristic Excursion into the Lion’s Den. Behav. Ther. 1972, 3, 398–416. [Google Scholar] [CrossRef]
- Carfora, V.; Caso, D.; Conner, M. Correlational study and randomised controlled trial for understanding and changing red meat consumption: The role of eating identities. Soc. Sci. Med. 2017, 175, 244–252. [Google Scholar] [CrossRef] [PubMed]
- Carfora, V.; Caso, D.; Conner, M. Randomised controlled trial of a text messaging intervention for reducing processed meat consumption: The mediating roles of anticipated regret and intention. Appetite 2017, 117, 152–160. [Google Scholar] [CrossRef]
- Rippin, H.L.; Hutchinson, J.; Jewell, J.; Breda, J.J.; Cade, J.E. Comparison of consumed portion sizes and on-pack serving sizes of UK energy dense foods. Appetite 2019, 134, 193–203. [Google Scholar] [CrossRef] [PubMed]
- Steenhuis, I.; Poelman, M. Portion Size: Latest Developments and Interventions. Curr. Obes. Rep. 2017, 6, 10–17. [Google Scholar] [CrossRef]


| Study Participants | |
|---|---|
| Age, median (IQR) (Minimum–Maximum: 18–76 years) | 37 (23) |
| Gender, n (%) | |
| Female | 60 (48.0) |
| Ethnicity, n (%) | |
| White-British | 103 (79.8) |
| White Other | 14 (10.9) |
| Asian or Asian-British | 5 (3.9) |
| Black or Black-British | 4 (3.1) |
| Mixed/Other | 3 (2.3) |
| UK Region of Residence, n (%) | |
| South East | 26 (20.2) |
| East Midlands | 15 (11.6) |
| North West | 14 (10.9) |
| Greater London | 12 (9.3) |
| Yorkshire and the Humber | 11 (8.5) |
| Scotland | 11 (8.5) |
| West Midlands | 10 (7.8) |
| South West | 9 (7.0) |
| East of England | 7 (5.4) |
| Wales | 6 (4.7) |
| North East | 5 (3.9) |
| Northern Ireland | 3 (2.3) |
| Household Size, n (%) | |
| 1 | 28 (21.7) |
| 2–3 | 66 (51.2) |
| 4–5 | 30 (23.3) |
| 6+ | 5 (3.9) |
| Meat Identity, n (%) | |
| Omnivore | 81 (62.8) |
| Meat Eater | 47 (36.4) |
| White Meat Only | 1 (0.8) |
| Pescatarian | 0 (0.0) |
| Flexitarian | 0 (0.0) |
| Dairy-free | 0 (0.0) |
| Vegetarian | 0 (0.0) |
| Plant-based | 0 (0.0) |
| Vegan | 0 (0.0) |
| Meat Identity Since, n (%) | |
| For more than 2 years | 129 (100.0) |
| For 1–2 years | 0 (0.0) |
| For 6–12 months | 0 (0.0) |
| For 1–6 months | 0 (0.0) |
| For less than a month | 0 (0.0) |
| Week 1 | Week 3 | |||
|---|---|---|---|---|
| Mean (SD) | % of Total Meat | Mean (SD) | % of Total Meat | |
| Total Meat | 189.0 (126.7) | - | 161.9 (94.5) | - |
| Red Meat | 84.8 (57.9) | 44.9% | 78.2 (55.5) | 48.3% |
| Processed Meat | 42.0 (36.6) | 22.2% | 43.0 (44.1) | 26.6% |
| Red and Processed Meat | 126.8 (81.4) | 67.1% | 121.2 (88.4) | 74.9% |
| Poultry | 76.7 (80.4) | 40.6% | 64.7 (60.9) | 39.9% |
| Fish and Seafood | 24.5 (47.6) | 13.0% | 17.9 (23.4) | 11.0% |
| Beef | 33.6 (39.5) | 17.8% | 33.6 (34.2) | 20.8% |
| Pork | 44.4 (41.6) | 23.5% | 38.6 (36.6) | 23.8% |
| Lamb | 6.8 (16.0) | 3.6% | 6.0 (17.4) | 3.7% |
| Game | 2.9 (18.3) | 1.5% | 1.2 (6.3) | 0.7% |
| Weekday | 191.0 (134.2) | - | 162.7 (101.4) | - |
| Weekend | 183.4 (157.1) | - | 163.3 (110.3) | - |
| Total Meat Without Outliers | 182.1 (119.0) | - | 161.9 (94.5) | - |
| Measure | ICC | ICC Interpretation | p-Value | Confidence Interval ICC | |
|---|---|---|---|---|---|
| Primary Outcome | Mean Total Daily Meat Intake | 0.716 | good | <0.001 | 0.621, 0.788 |
| Secondary Outcomes | Red Meat | 0.531 | moderate | <0.001 | 0.419, 0.628 |
| Processed Meat | 0.650 | good | <0.001 | 0.558, 0.727 | |
| Red and Processed Meat | 0.677 | good | <0.001 | 0.591, 0.749 | |
| Poultry | 0.680 | good | <0.001 | 0.592, 0.752 | |
| Fish and Seafood | 0.257 | fair | 0.001 | 0.118, 0.387 | |
| Sensitivity Analyses | Without Outlier Data | 0.777 | good | <0.001 | 0.703, 0.832 |
| Weekday | 0.649 | good | <0.001 | 0.547, 0.730 | |
| Weekend | 0.448 | moderate | <0.001 | 0.325, 0.556 | |
| Mean | 0.598 | ||||
| Mean Difference (Bias) | Regression Coefficient | p-Value | 95% CI | |
|---|---|---|---|---|
| Mean total daily meat intake | 0.12 | 0.08 | 0.271 | −0.06, 0.21 |
| Red meat | 0.09 | −0.05 | 0.615 | −0.26, 0.16 |
| Processed meat | 0.01 | −0.00 | 0.969 | −0.22, 0.21 |
| Red and processed meat | 0.06 | −0.01 | 0.909 | −0.17, 0.15 |
| Poultry | 0.05 | 0.25 | 0.015 | 0.05, 0.45 |
| Fish and Seafood | 0.15 | 0.47 | 0.038 | 0.03, 0.91 |
| Sensitivity analysis–weekday | 0.13 | 0.05 | 0.503 | −0.10, 0.21 |
| Sensitivity analysis–weekend | 0.02 | 0.20 | 0.032 | 0.02, 0.38 |
| Sensitivity analysis–without outlier data | 0.10 | 0.03 | 0.620 | −0.10, 0.16 |
Publisher’s Note: MDPI stays neutral with regard to jurisdictional claims in published maps and institutional affiliations. |
© 2021 by the authors. Licensee MDPI, Basel, Switzerland. This article is an open access article distributed under the terms and conditions of the Creative Commons Attribution (CC BY) license (http://creativecommons.org/licenses/by/4.0/).
Share and Cite
Stewart, C.; Frie, K.; Piernas, C.; Jebb, S.A. Development and Reliability of the Oxford Meat Frequency Questionnaire. Nutrients 2021, 13, 922. https://doi.org/10.3390/nu13030922
Stewart C, Frie K, Piernas C, Jebb SA. Development and Reliability of the Oxford Meat Frequency Questionnaire. Nutrients. 2021; 13(3):922. https://doi.org/10.3390/nu13030922
Chicago/Turabian StyleStewart, Cristina, Kerstin Frie, Carmen Piernas, and Susan A. Jebb. 2021. "Development and Reliability of the Oxford Meat Frequency Questionnaire" Nutrients 13, no. 3: 922. https://doi.org/10.3390/nu13030922
APA StyleStewart, C., Frie, K., Piernas, C., & Jebb, S. A. (2021). Development and Reliability of the Oxford Meat Frequency Questionnaire. Nutrients, 13(3), 922. https://doi.org/10.3390/nu13030922