
The Effect of Protein Supplementation versus Carbohydrate Supplementation on Muscle Damage Markers and Soreness Following a 15-km Road Race: A Double-Blind Randomized Controlled Trial

 , , , , , and
Abstract
1. Introduction
2. Methods
2.1. Participants
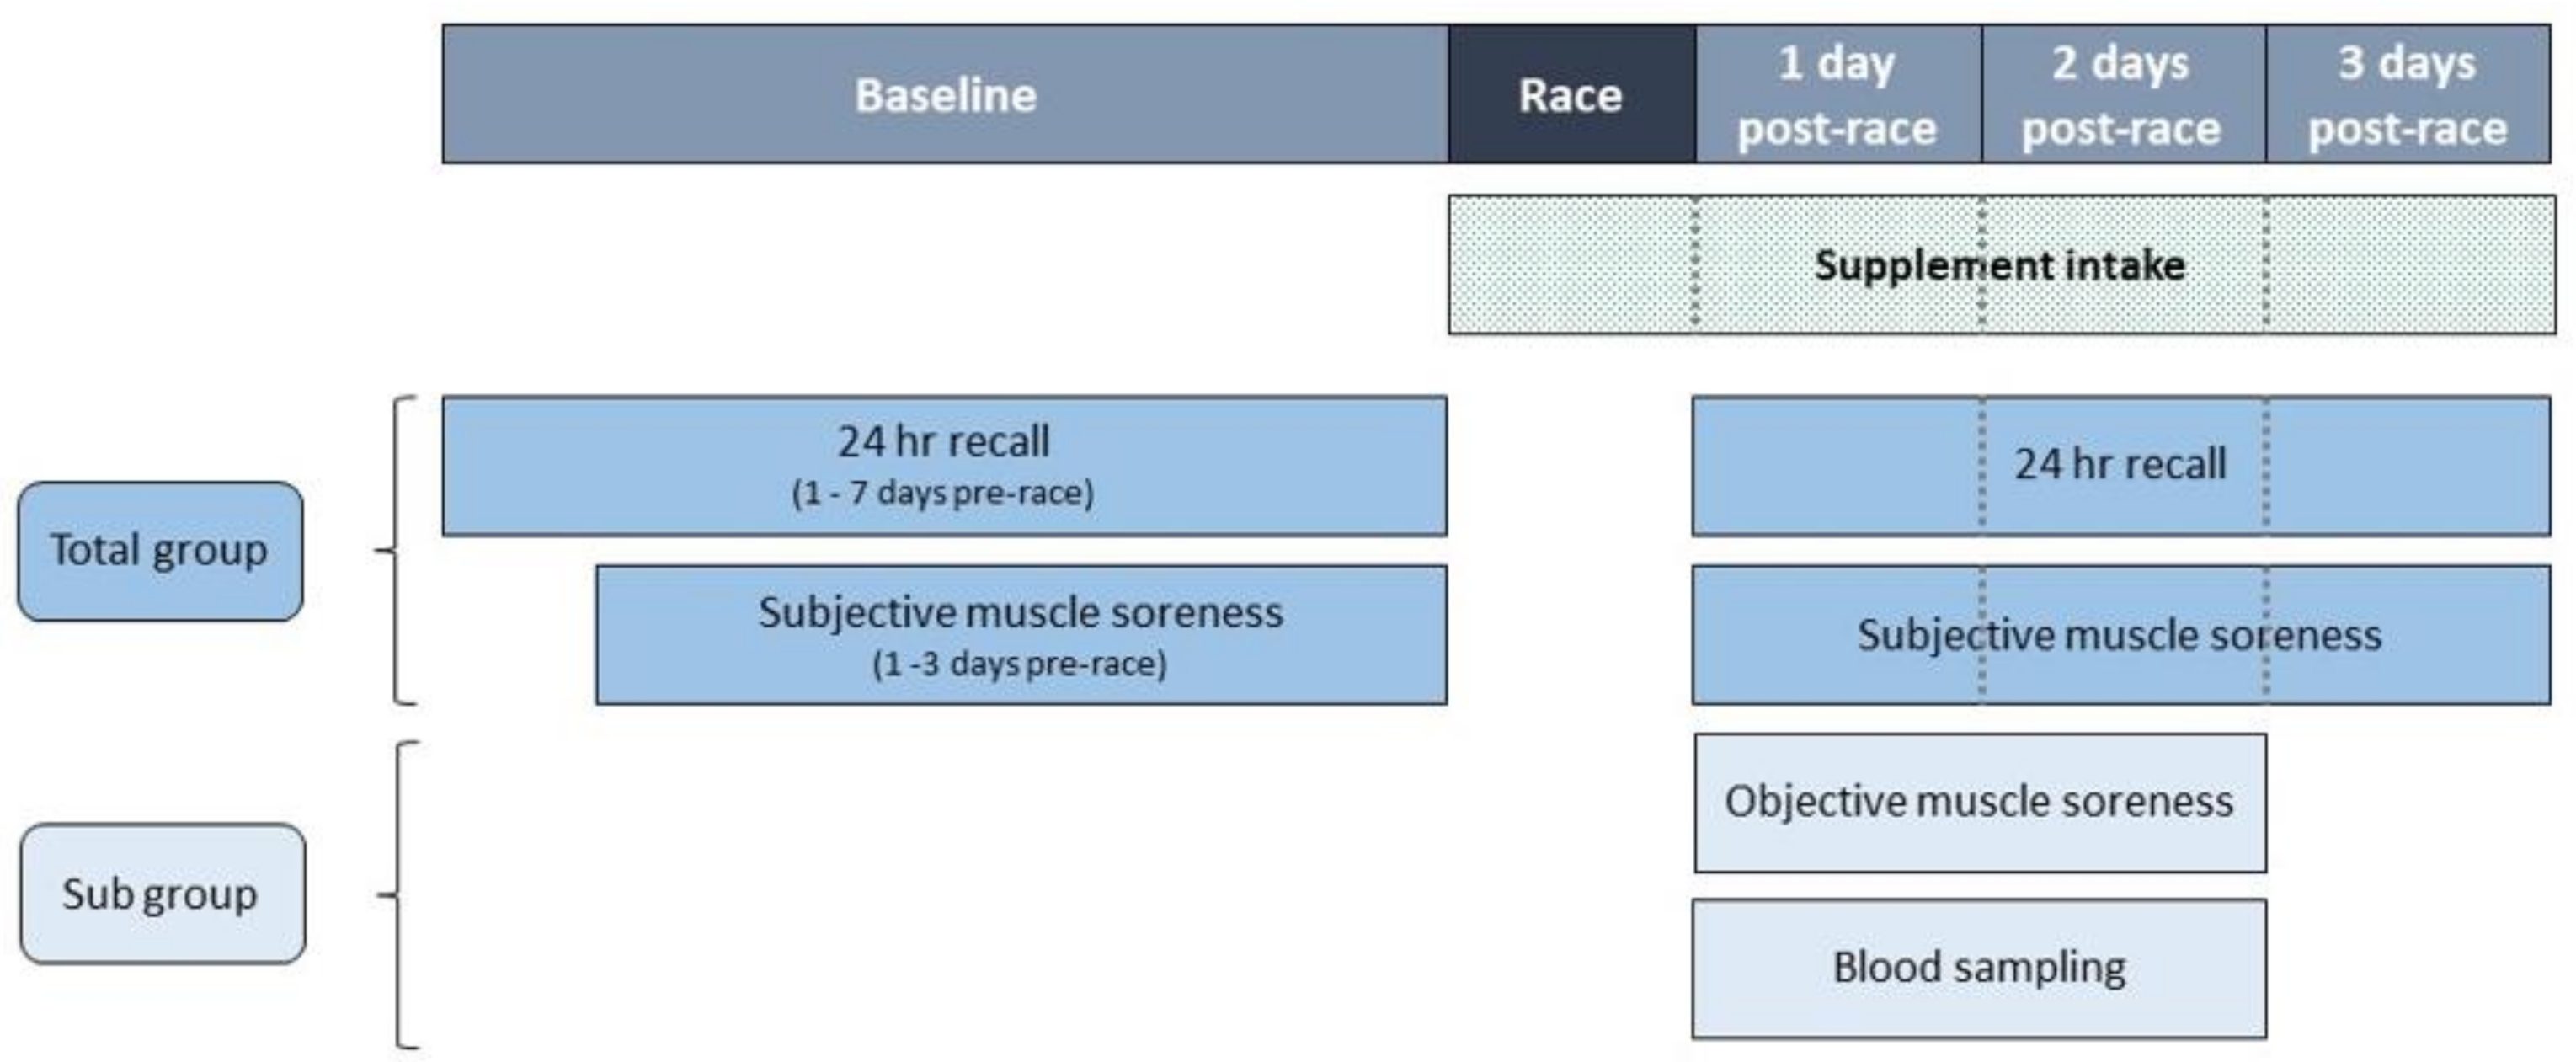
2.2. Study Design
2.3. Supplementation Protocol
2.4. Measurements
2.4.1. Demographics
2.4.2. Race Characteristics
2.4.3. Subjective Muscle Soreness
2.4.4. Objective Muscle Soreness
2.4.5. Measures that Could Influence Muscle Soreness
2.4.6. Muscle Damage Biomarkers
2.4.7. Dietary Intake
2.5. Statistical Analysis
3. Results
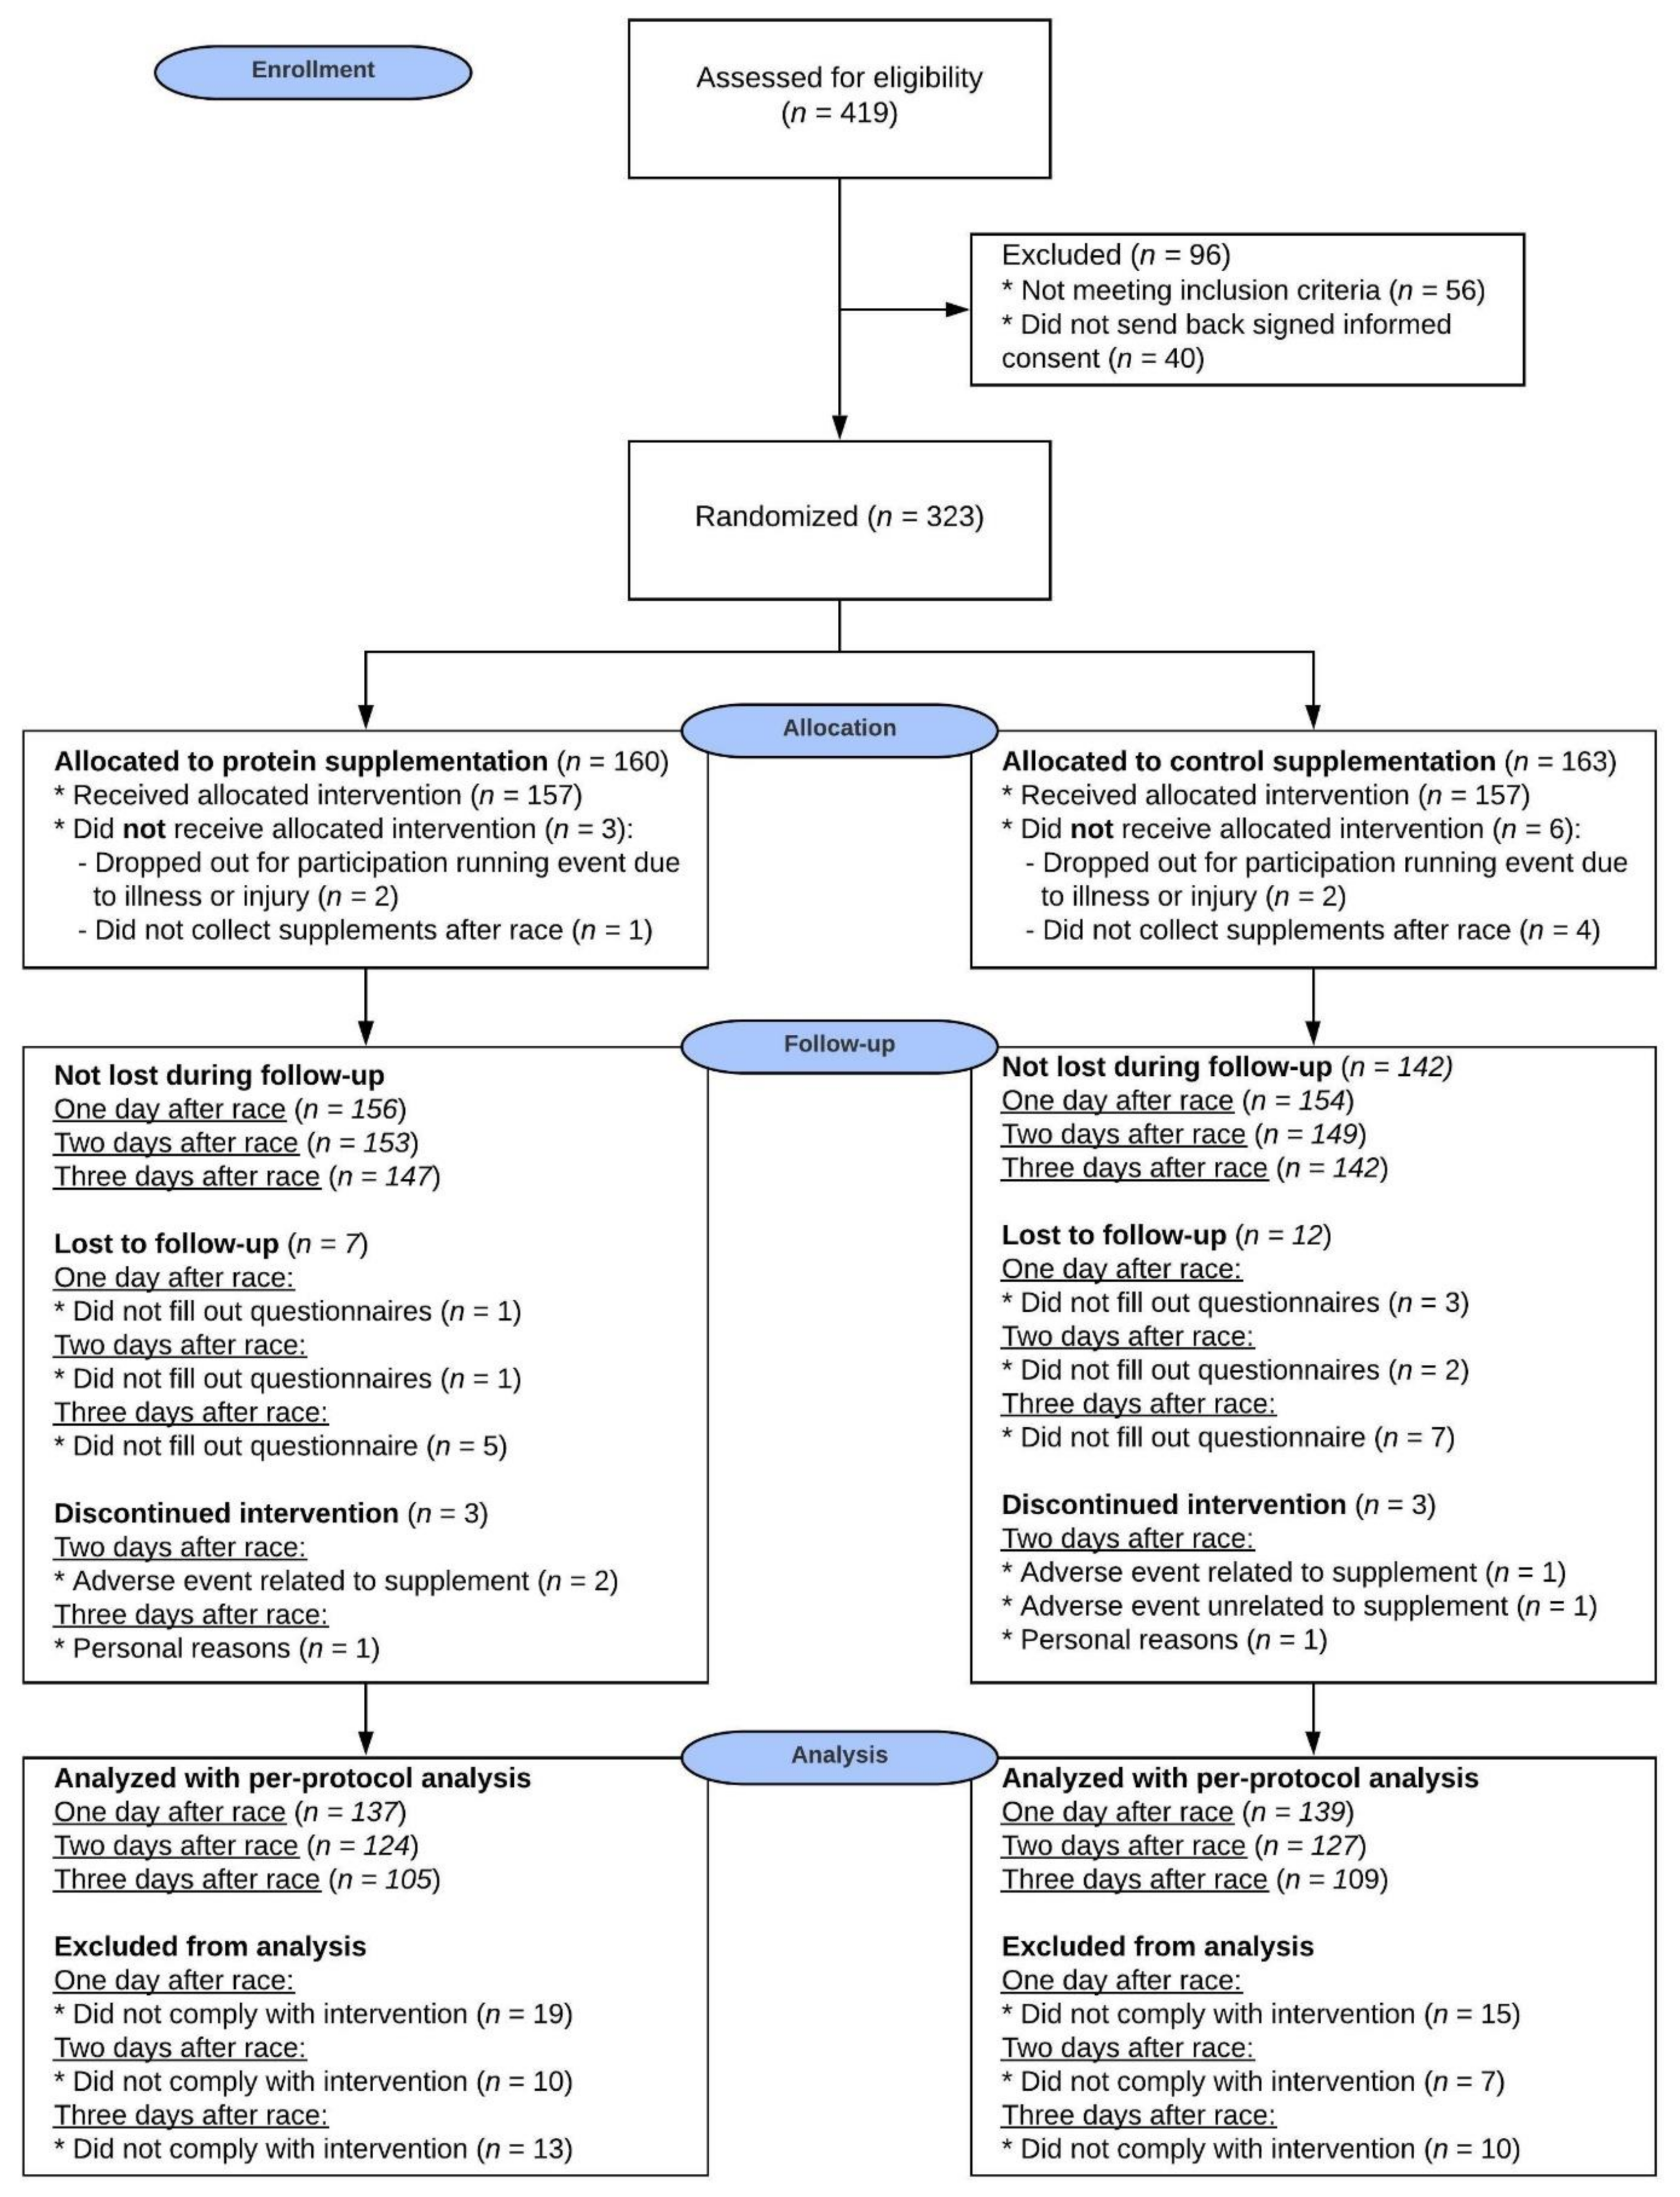
3.1. Participants
3.2. Race Characteristics
3.3. Dietary Intake
3.4. Compliance
3.5. Adverse Events
3.6. Muscle Soreness and Damage Markers
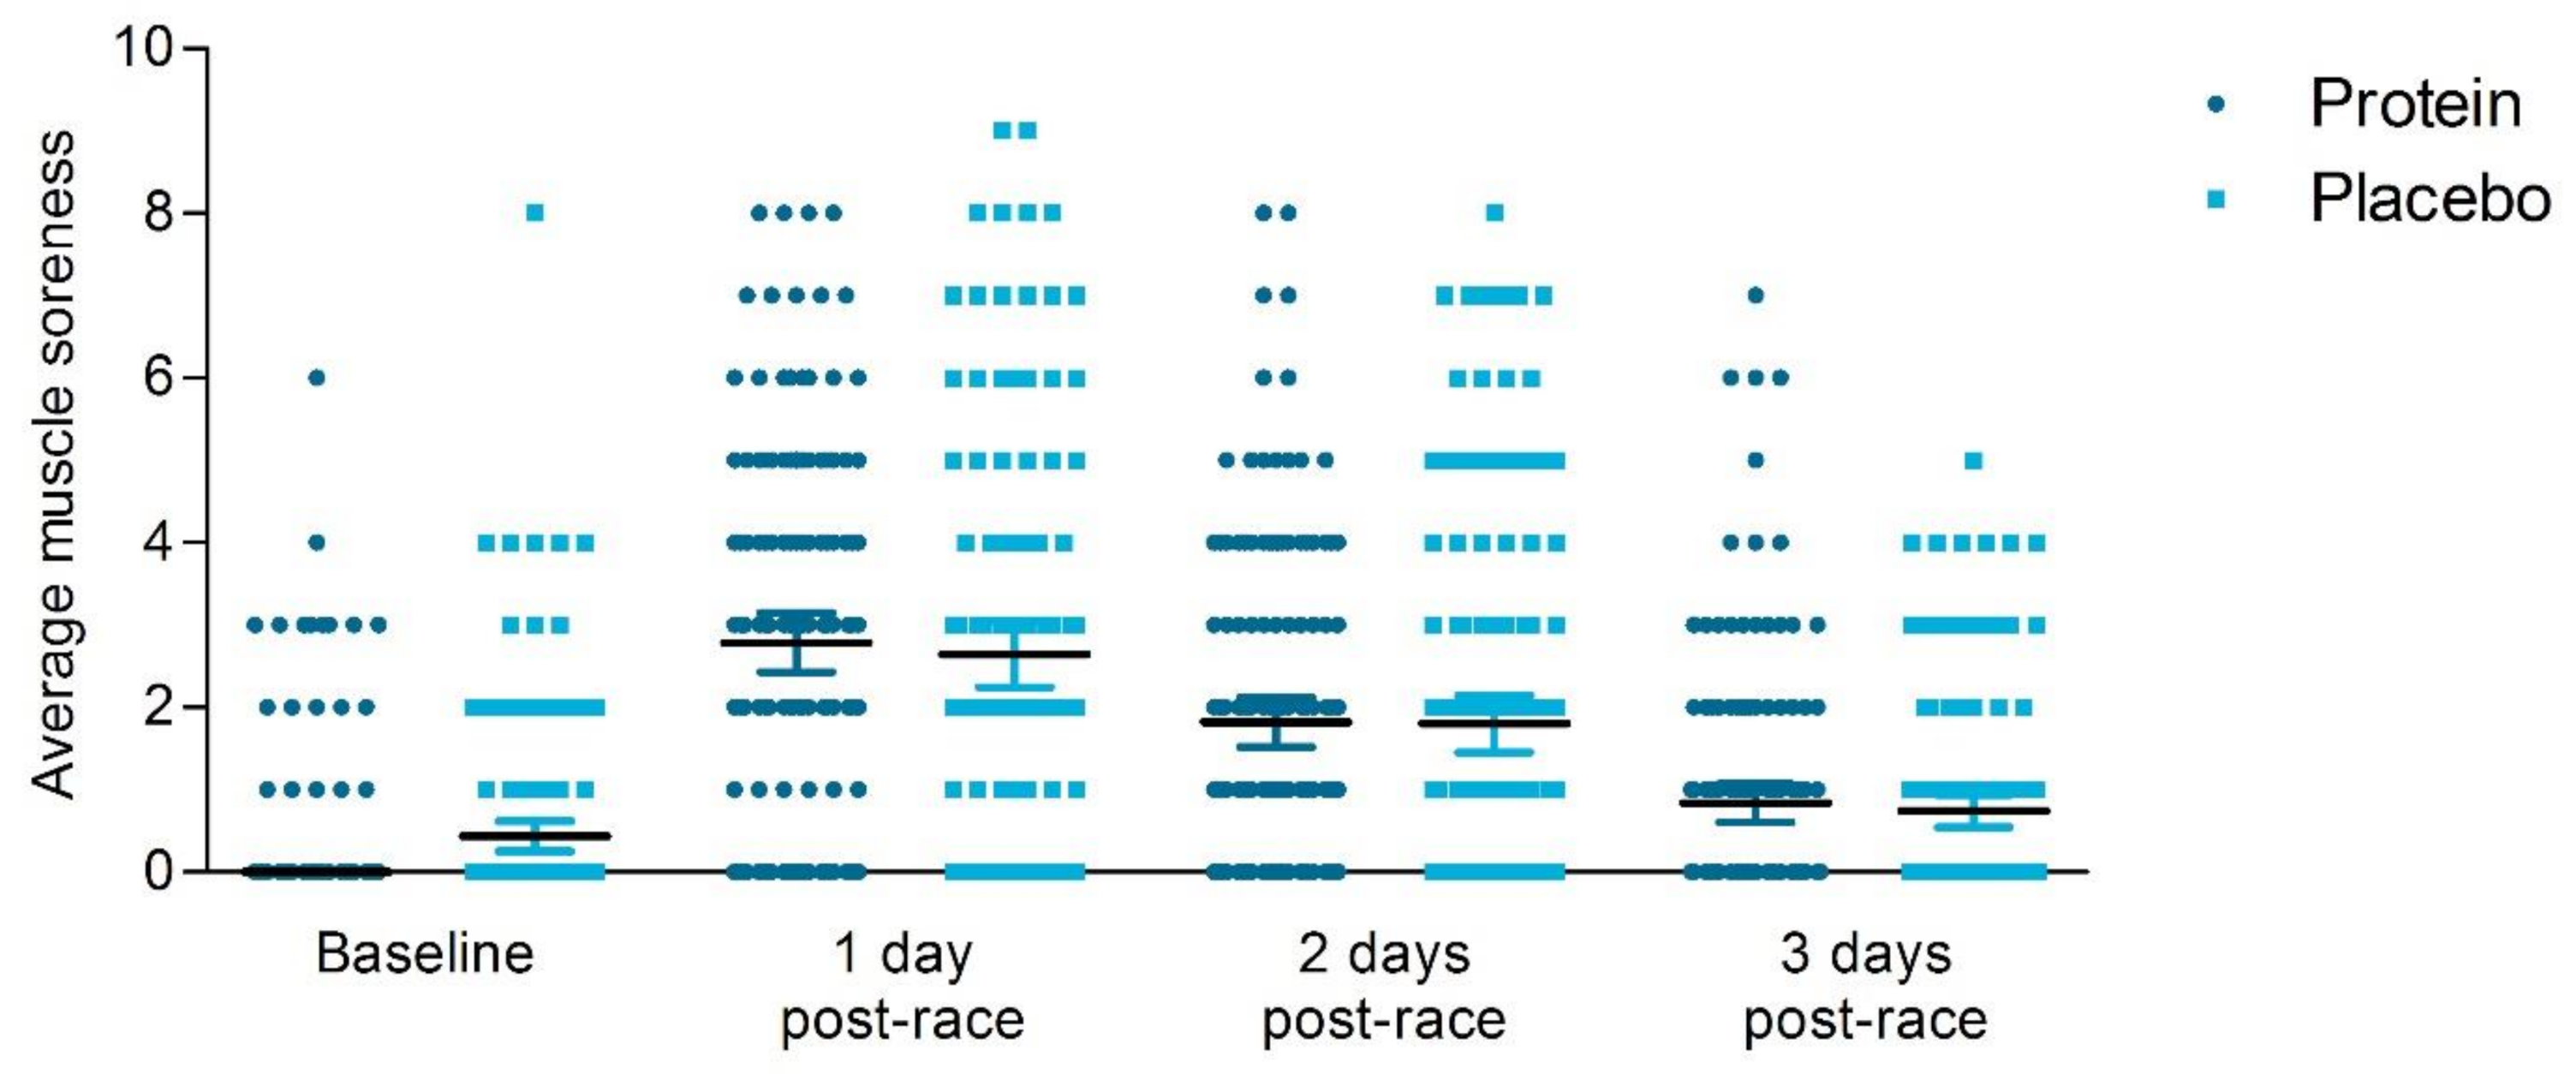
3.6.1. Subjective Muscle Soreness
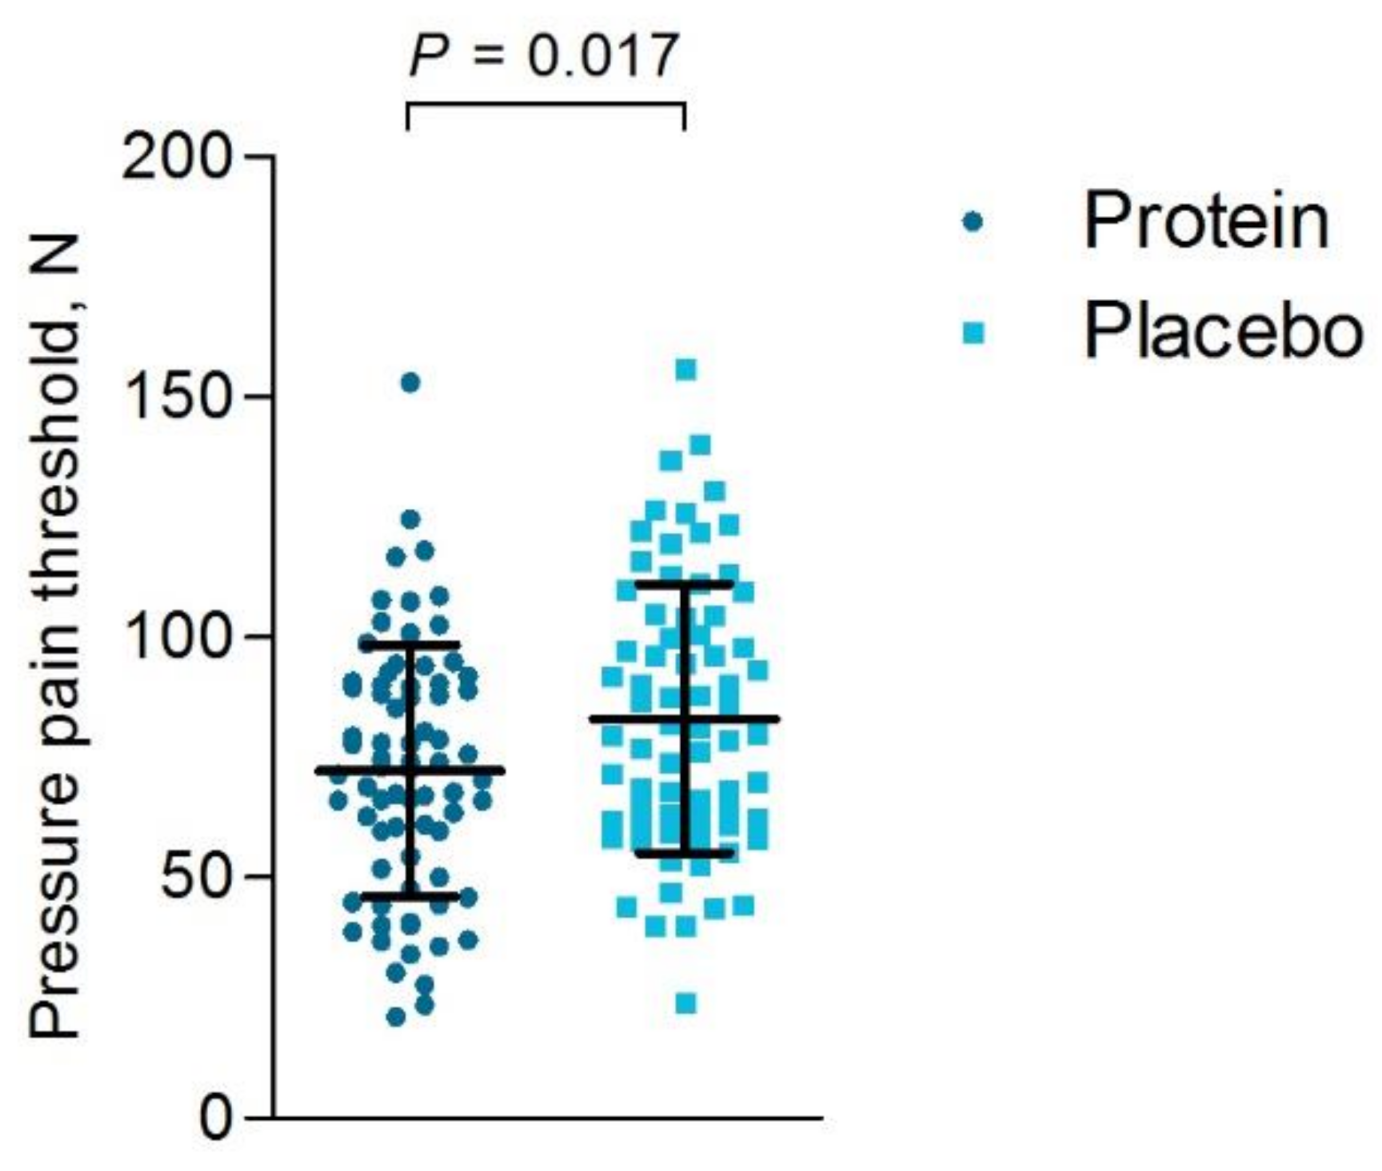
3.6.2. Objective Muscle Soreness
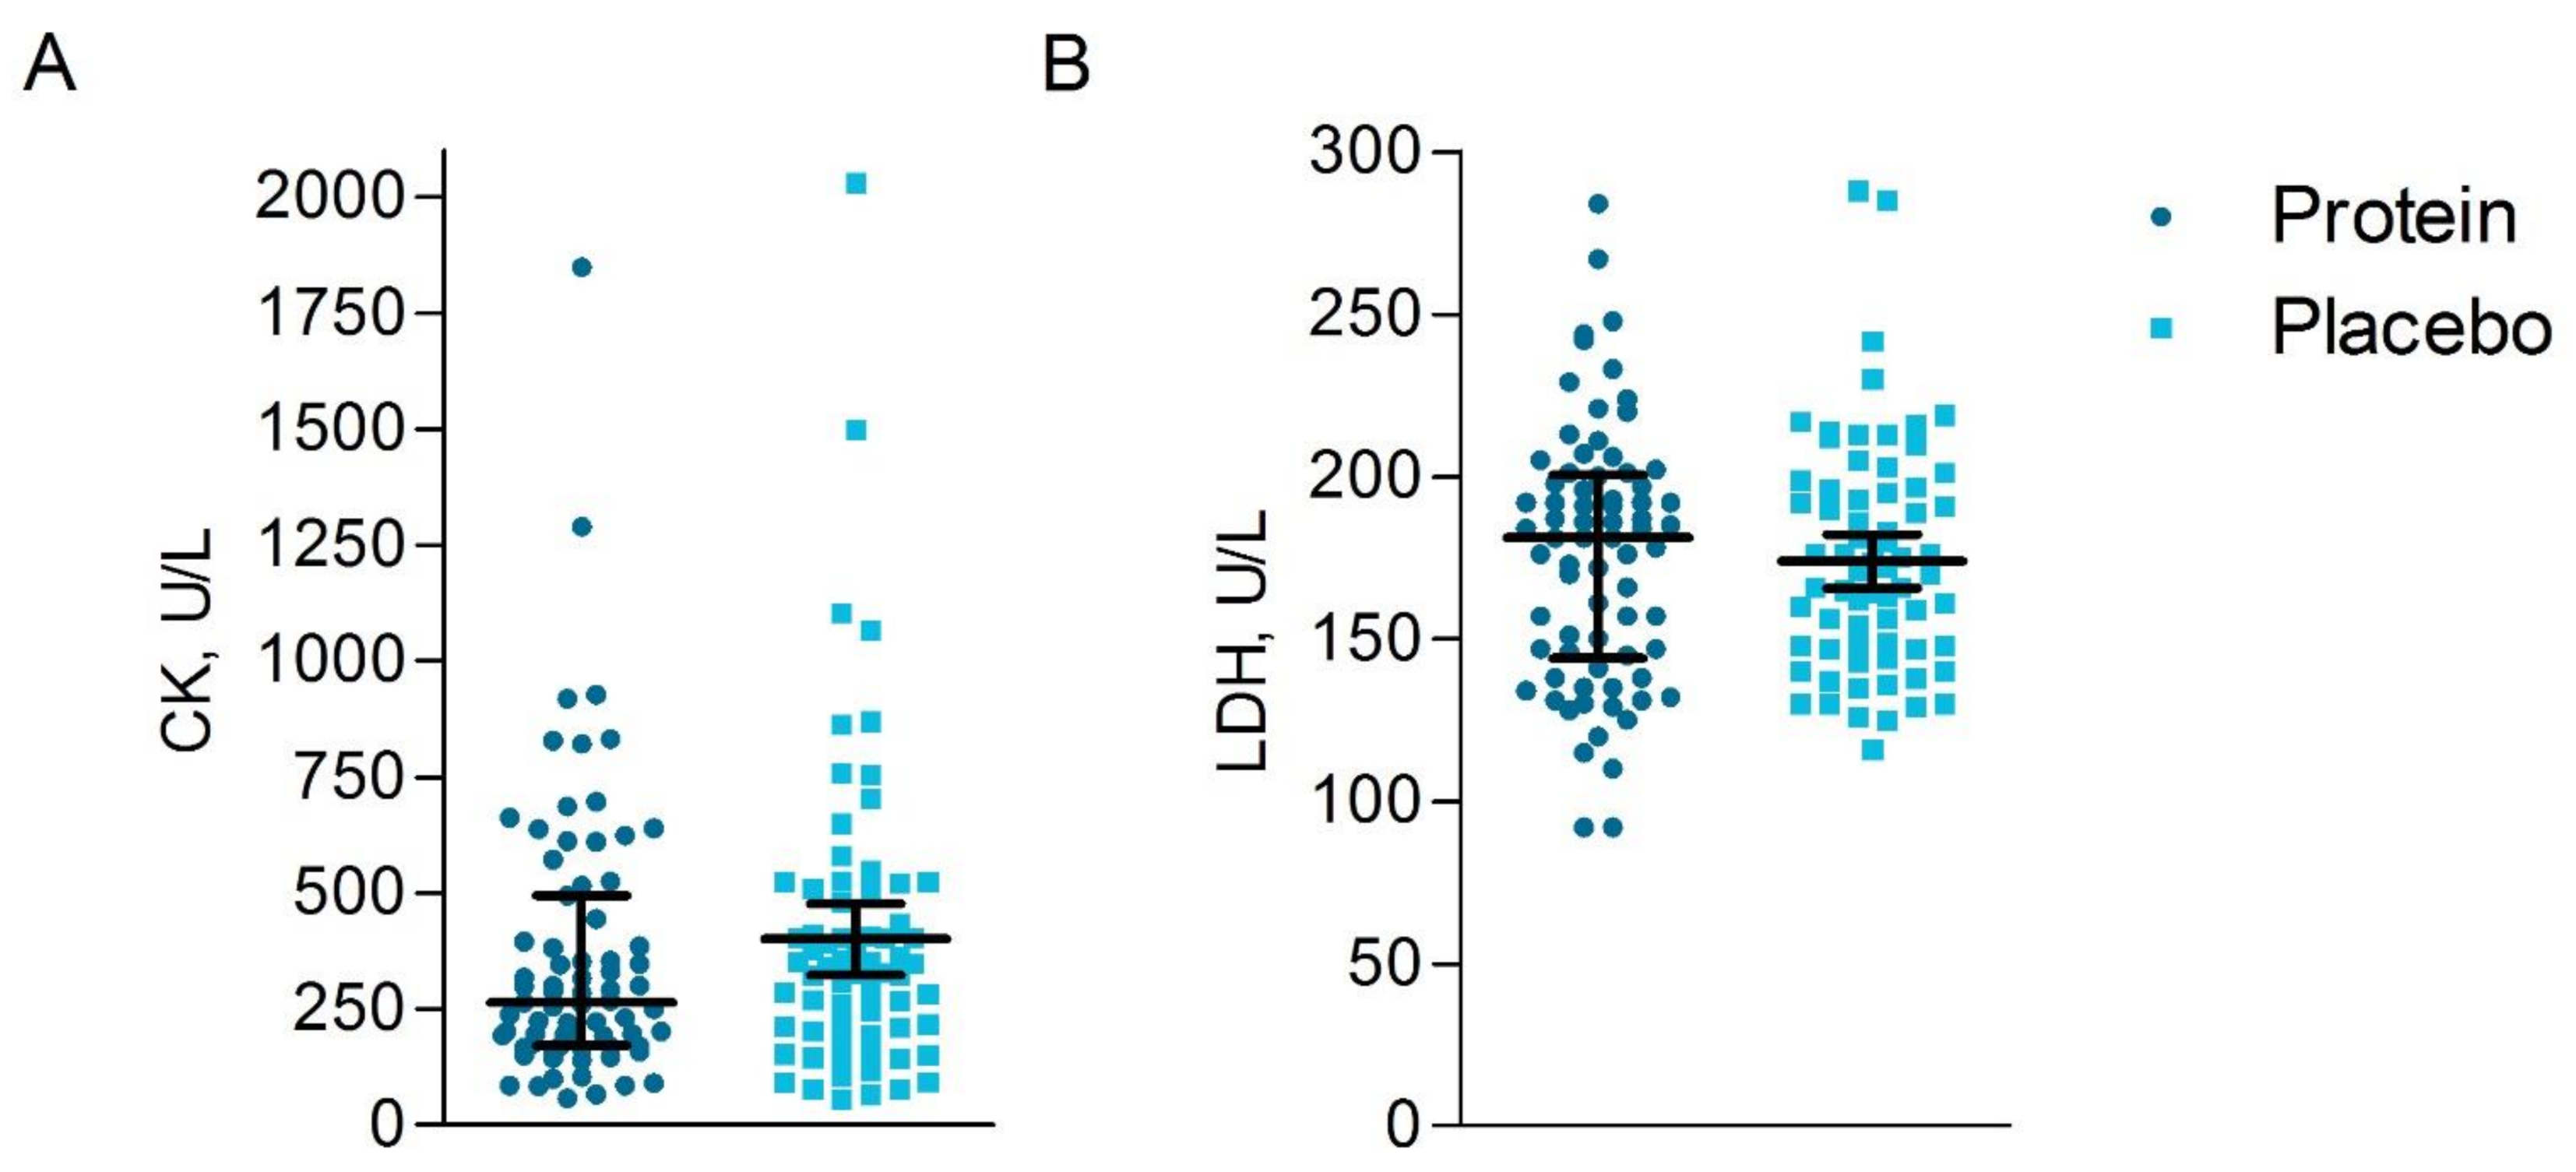
3.6.3. Blood Analyses
3.7. Measures That Could Influence Muscle Soreness
4. Discussion
5. Practical Relevance
6. Limitations
7. Conclusions
Supplementary Materials
Author Contributions
Funding
Institutional Review Board Statement
Informed Consent Statement
Data Availability Statement
Acknowledgments
Conflicts of Interest
Ethics Approval and Consent to Participate
Availability of Data and Materials
Abbreviations
| BMI | Body mass index |
| BPI-SF | Short-Form Brief Pain Inventory |
| Bpm | beats per minute |
| CK | Creatine Kinase |
| En% | energy percentage |
| g/kg/day | gram per kilogram body weight per day |
| HRmax | maximal heart rate |
| ITT | Intention-to-treat |
| IQR | Interquartile range |
| LDH | Lactate dehydrogenase |
| NPRS | Numeric Pain Rating Scale |
| PP | Per-protocol |
| U/L | unit/liter |
| VO2max | Maximal rate of oxygen consumption |
References
- Thompson, P.D.; Eijsvogels, T.M.H. New Physical Activity Guidelines: A Call to Activity for Clinicians and Patients. JAMA 2018, 320, 1983–1984. [Google Scholar] [CrossRef] [PubMed]
- Brancaccio, P.; Maffulli, N.; Limongelli, F.M. Creatine kinase monitoring in sport medicine. Br. Med. Bull. 2007, 81–82, 209–230. [Google Scholar] [CrossRef]
- Levenhagen, D.K.; Carr, C.; Carlson, M.G.; Maron, D.J.; Borel, M.J.; Flakoll, P.J. Postexercise protein intake enhances whole-body and leg protein accretion in humans. Med. Sci. Sports Exerc. 2002, 34, 828–837. [Google Scholar] [CrossRef] [PubMed]
- Pasiakos, S.M.; Lieberman, H.R.; McLellan, T.M. Effects of protein supplements on muscle damage, soreness and recovery of mus-cle function and physical performance: A systematic review. Sports Med. 2014, 44, 655–670. [Google Scholar] [CrossRef]
- Biolo, G.; Maggi, S.P.; Williams, B.D.; Tipton, K.D.; Wolfe, R.R. Increased rates of muscle protein turnover and amino acid transport after resistance exercise in humans. Am. J. Physiol. Metab. 1995, 268, E514–E520. [Google Scholar] [CrossRef]
- Coombes, J.S.; McNaughton, L.R. Effects of branched-chain amino acid supplementation on serum creatine kinase and lactate dehydrogenase after prolonged exercise. J. Sports Med. Phys. Fit. 2000, 40, 240–246. [Google Scholar]
- Greer, B.K.; Woodard, J.L.; White, J.P.; Arguello, E.M.; Haymes, E.M. Branched-chain amino acid supplementation and indicators of muscle damage after endurance exercise. Int. J. Sport Nutr. Exerc. Metab. 2007, 17, 595–607. [Google Scholar] [CrossRef] [PubMed]
- Huang, W.-C.; Chang, Y.-C.; Chen, Y.-M.; Hsu, Y.-J.; Huang, C.-C.; Kan, N.-W.; Chen, S.-S. Whey Protein Improves Marathon-Induced Injury and Exercise Performance in Elite Track Runners. Int. J. Med. Sci. 2017, 14, 648–654. [Google Scholar] [CrossRef]
- Valentine, R.J.; Saunders, M.J.; Todd, M.K.; Laurent, T.G.S. Influence of carbohydrate-protein beverage on cycling endurance and indices of muscle disruption. Int. J. Sport Nutr. Exerc. Metab. 2008, 18, 363–378. [Google Scholar] [CrossRef]
- Betts, J.A.; Toone, R.J.; Stokes, K.A.; Thompson, D. Systemic indices of skeletal muscle damage and recovery of muscle function after exercise: Effect of combined carbohydrate–protein ingestion. Appl. Physiol. Nutr. Metab. 2009, 34, 773–784. [Google Scholar] [CrossRef]
- Etheridge, T.; Philp, A.; Watt, P.W. A single protein meal increases recovery of muscle function following an acute eccentric exercise bout. Appl. Physiol. Nutr. Metab. 2008, 33, 483–488. [Google Scholar] [CrossRef]
- Green, M.S.; Corona, B.T.; Doyle, J.A.; Ingalls, C.P. Carbohydrate-Protein Drinks Do Not Enhance Recovery from Exercise-Induced Muscle Injury. Int. J. Sport Nutr. Exerc. Metab. 2008, 18, 1–18. [Google Scholar] [CrossRef]
- McHugh, M.P. Recent advances in the understanding of the repeated bout effect: The protective effect against muscle damage from a single bout of eccentric exercise. Scand. J. Med. Sci. Sports 2003, 13, 88–97. [Google Scholar] [CrossRef] [PubMed]
- Burd, N.A.; Gorissen, S.H.; Van Vliet, S.; Snijders, T.; Van Loon, L.J. Differences in postprandial protein handling after beef compared with milk ingestion during postexercise recovery: A randomized controlled trial. Am. J. Clin. Nutr. 2015, 102, 828–836. [Google Scholar] [CrossRef] [PubMed]
- Hoffman, J.R.; Falvo, M.J. Protein—Which is Best? J. Sport. Sci. Med. 2004, 3, 118–130. [Google Scholar]
- Paddon-Jones, D.; Rasmussen, B.B. Dietary protein recommendations and the prevention of sarcopenia. Curr. Opin. Clin. Nutr. Metab. Care 2009, 12, 86–90. [Google Scholar] [CrossRef]
- Witard, O.C.; Wardle, S.L.; Macnaughton, L.S.; Hodgson, A.B.; Tipton, K.D. Protein Considerations for Optimising Skeletal Muscle Mass in Healthy Young and Older Adults. Nutrients 2016, 8, 181. [Google Scholar] [CrossRef] [PubMed]
- Mamerow, M.M.; Mettler, J.A.; English, K.L.; Casperson, S.L.; Arentson-Lantz, E.; Sheffield-Moore, M.; Layman, D.K.; Paddon-Jones, D. Dietary protein distribu-tion positively influences 24-h muscle protein synthesis in healthy adults. J. Nutr. 2014, 144, 876–880. [Google Scholar] [CrossRef]
- Areta, J.L.; Burke, L.M.; Ross, M.L.; Camera, D.M.; West, D.W.D.; Broad, E.M.; Jeacocke, N.A.; Moore, D.R.; Stellingwerff, T.; Phillips, S.M.; et al. Timing and distribution of protein ingestion during prolonged recovery from resistance exercise alters myofibrillar protein synthesis. J. Physiol. 2013, 591, 2319–2331. [Google Scholar] [CrossRef]
- Moore, D.R.; Robinson, M.J.; Fry, J.L.; Tang, J.E.; Glover, E.I.; Wilkinson, S.B.; Prior, T.; Tarnopolsky, M.A.; Phillips, S.M. Ingested protein dose response of muscle and albu-min protein synthesis after resistance exercise in young men. Am. J. Clin. Nutr. 2009, 89, 161–168. [Google Scholar] [CrossRef] [PubMed]
- Trommelen, J.; van Loon, L.J. Pre-Sleep Protein Ingestion to Improve the Skeletal Muscle Adaptive Response to Exercise Train-ing. Nutrients 2016, 8, 763. [Google Scholar] [CrossRef]
- Res, P.T.; Groen, B.; Pennings, B.; Beelen, M.; Wallis, G.A.; Gijsen, A.P.; Senden, J.M.G.; VAN Loon, L.J.C. Protein Ingestion before Sleep Improves Postexercise Overnight Recovery. Med. Sci. Sports Exerc. 2012, 44, 1560–1569. [Google Scholar] [CrossRef] [PubMed]
- Kouw, I.W.; Holwerda, A.M.; Trommelen, J.; Kramer, I.F.; Bastiaanse, J.; Halson, S.L.; Wodzig, W.K.; Verdijk, L.B.; Van Loon, L.J. Protein Ingestion before Sleep Increases Overnight Muscle Protein Synthesis Rates in Healthy Older Men: A Randomized Controlled Trial. J. Nutr. 2017, 147, 2252–2261. [Google Scholar] [CrossRef] [PubMed]
- Trommelen, J.; Kouw, I.W.K.; Holwerda, A.M.; Snijders, T.; Halson, S.L.; Rollo, I.; Verdijk, L.B.; Van Loon, L.J.C. Presleep dietary protein-derived amino acids are incorporated in myofibrillar protein during postexercise overnight recovery. Am. J. Physiol. Metab. 2018, 314, E457–E467. [Google Scholar] [CrossRef] [PubMed]
- Berner, L.A.; Becker, G.; Wise, M.; Doi, J. Characterization of Dietary Protein among Older Adults in the United States: Amount, Animal Sources, and Meal Patterns. J. Acad. Nutr. Diet. 2013, 113, 809–815. [Google Scholar] [CrossRef]
- Gillen, J.B.; Trommelen, J.; Wardenaar, F.C.; Brinkmans, N.Y.; Versteegen, J.J.; Jonvik, K.L.; Kapp, C.; de Vries, J.; van den Borne, J.J.G.C.; Gibala, M.J.; et al. Dietary Protein Intake and Distribu-tion Patterns of Well-Trained Dutch Athletes. Int. J. Sport Nutr. Exerc. Metab. 2017, 27, 105–114. [Google Scholar] [CrossRef]
- Koopman, R.; Wagenmakers, A.J.M.; Manders, R.J.F.; Zorenc, A.H.G.; Senden, J.M.G.; Gorselink, M.; Keizer, H.A.; Van Loon, L.J.C. Combined ingestion of protein and free leucine with carbohydrate increases postexercise muscle protein synthesis in vivo in male subjects. Am. J. Physiol. Metab. 2005, 288, E645–E653. [Google Scholar] [CrossRef] [PubMed]
- Manninen, A.H. Hyperinsulinaemia, hyperaminoacidaemia and post-exercise muscle anabolism: The search for the optimal recovery drink. Br. J. Sports Med. 2006, 40, 900–905. [Google Scholar] [CrossRef] [PubMed]
- Maessen, M.F.; Verbeek, A.L.; Bakker, E.A.; Thompson, P.D.; Hopman, M.T.; Eijsvogels, T.M. Lifelong Exercise Patterns and Cardiovascular Health. Mayo Clin. Proc. 2016, 91, 745–754. [Google Scholar] [CrossRef]
- Tan, G.; Jensen, M.P.; Thornby, J.I.; Shanti, B.F. Validation of the brief pain inventory for chronic nonmalignant pain. J. Pain 2004, 5, 133–137. [Google Scholar] [CrossRef]
- Tanaka, H.; Monahan, K.D.; Seals, D.R. Age-predicted maximal heart rate revisited. J. Am. Coll. Cardiol. 2001, 37, 153–156. [Google Scholar] [CrossRef]
- Hjermstad, M.J.; Fayers, P.M.; Haugen, D.F.; Caraceni, A.; Hanks, G.W.; Loge, J.H.; Fainsinger, R.; Aass, N.; Kaasa, S. Studies Comparing Numerical Rating Scales, Verbal Rating Scales, and Visual Analogue Scales for Assessment of Pain Intensity in Adults: A Systematic Literature Review. J. Pain Symptom Manag. 2011, 41, 1073–1093. [Google Scholar] [CrossRef] [PubMed]
- Boonstra, A.M.; Stewart, R.E.; Köke, A.J.A.; Oosterwijk, R.F.A.; Swaan, J.L.; Schreurs, K.M.G.; Preuper, H.R.S. Cut-Off Points for Mild, Moderate, and Severe Pain on the Numeric Rating Scale for Pain in Patients with Chronic Musculoskeletal Pain: Variability and Influence of Sex and Catastrophizing. Front. Psychol. 2016, 7, 1466. [Google Scholar] [CrossRef]
- Antonaci, F.; Sand, T.; Lucas, G.A. Pressure algometry in healthy subjects: Inter-examiner variability. Scand. J. Rehabil. Med. 1998, 30, 3–8. [Google Scholar] [CrossRef]
- Chesterton, L.S.; Sim, J.; Wright, C.C.; Foster, N.E. Interrater Reliability of Algometry in Measuring Pressure Pain Thresholds in Healthy Humans, Using Multiple Raters. Clin. J. Pain 2007, 23, 760–766. [Google Scholar] [CrossRef] [PubMed]
- Lacourt, T.E.; Houtveen, J.H.; Van Doornen, L.J. Experimental pressure-pain assessments: Test-retest reliability, convergence and dimensionality. Scand. J. Pain 2012, 3, 31–37. [Google Scholar] [CrossRef] [PubMed]
- Crispim, S.P.; De Vries, J.H.M.; Geelen, A.; Souverein, O.W.; Hulshof, P.J.M.; Lafay, L.; Rousseau, A.-S.; Lillegaard, I.T.L.; Andersen, L.F.; Huybrechts, I.; et al. Two non-consecutive 24 h recalls using EPIC-Soft software are sufficiently valid for comparing protein and potassium intake between five European centres—Results from the European Food Consumption Validation (EFCOVAL) study. Br. J. Nutr. 2010, 105, 447–458. [Google Scholar] [CrossRef] [PubMed]
- RIVM. NEVO Online Version 2013/4.0; RIVM: Bilthoven, The Netherlands, 2013. [Google Scholar]
- Vella, L.D.; Cameron-Smith, D. Alcohol, Athletic Performance and Recovery. Nutrients 2010, 2, 781–789. [Google Scholar] [CrossRef]
- U.S. Department of Health and Human Services and U.S. Department of Agriculture. 2015—2020 Dietary Guidelines for Americans, 8th ed.2015. Available online: https://health.gov/dietaryguidelines/2015/guidelines/ (accessed on 5 February 2019).
- Moher, D.; Hopewell, S.; Schulz, K.F.; Montori, V.; Gøtzsche, P.C.; Devereaux, P.J.; Elbourne, D.; Egger, M.; Altman, D.G. CONSORT 2010 Explanation and Elaboration: Updated guidelines for reporting parallel group randomised trials. BMJ 2010, 340, c869. [Google Scholar] [CrossRef]
- USDA. 2015–2020 Dietary Guidelines for Americans, 8th ed.; USDA: Washington, DC, USA, 2015. [Google Scholar]
- Rodriguez, N.R.; DiMarco, N.M.; Langley, S. Position of the American Dietetic Association, Dietitians of Canada, and the Ameri-can College of Sports Medicine: Nutrition and athletic performance. J. Am. Diet. Assoc. 2009, 109, 509–527. [Google Scholar] [PubMed]
- Cintineo, H.P.; Arent, M.A.; Antonio, J.; Arent, S.M. Effects of Protein Supplementation on Performance and Recovery in Re-sistance and Endurance Training. Front. Nutr. 2018, 5, 83. [Google Scholar] [CrossRef] [PubMed]
- Koopman, R.; Pannemans, D.L.E.; Jeukendrup, A.E.; Gijsen, A.P.; Senden, J.M.G.; Halliday, D.; Saris, W.H.M.; Van Loon, L.J.C.; Wagenmakers, A.J.M. Combined ingestion of protein and carbohydrate improves protein balance during ultra-endurance exercise. Am. J. Physiol. Metab. 2004, 287, E712–E720. [Google Scholar] [CrossRef] [PubMed]
- Ferguson-Stegall, L.; McCleave, E.L.; Ding, Z.; Doerner, P.G., 3rd; Wang, B.; Liao, Y.H.; Kammer, L.; Liu, Y.; Hwang, J.; Dessard, B.M.; et al. Postexercise carbohydrate-protein sup-plementation improves subsequent exercise performance and intracellular signaling for protein synthesis. J. Strength Cond. Res. 2011, 25, 1210–1224. [Google Scholar] [CrossRef]
- Brown, M.A.; Stevenson, E.J.; Howatson, G. Whey protein hydrolysate supplementation accelerates recovery from exercise-induced muscle damage in females. Appl. Physiol. Nutr. Metab. 2018, 43, 324–330. [Google Scholar] [CrossRef]
- Chang, M.; Hamilton, J.A.; Scholz, G.M.; Masendycz, P.; Macaulay, S.L.; Elsegood, C.L. Phosphatidylinostitol-3 kinase and phospho-lipase C enhance CSF-1-dependent macrophage survival by controlling glucose uptake. Cell Signal. 2009, 21, 1361–1369. [Google Scholar] [CrossRef] [PubMed]
- Gong, W.Y.; Abdelhamid, R.E.; Carvalho, C.S.; Sluka, K.A. Resident Macrophages in Muscle Contribute to Development of Hyperalgesia in a Mouse Model of Noninflammatory Muscle Pain. J. Pain 2016, 17, 1081–1094. [Google Scholar] [CrossRef]
- Ortenblad, N.; Nielsen, J.; Saltin, B.; Holmberg, H.C. Role of glycogen availability in sarcoplasmic reticulum Ca2+ kinetics in hu-man skeletal muscle. J. Physiol. 2011, 589 Pt 3, 711–725. [Google Scholar] [CrossRef]


| Total Group n = 323 | Protein n = 160 | Placebo n = 163 | p-Value | |
|---|---|---|---|---|
| Demographics | ||||
| Age, years | 44 ± 11 | 44 ± 12 | 44 ± 10 | 0.64 |
| Men, n (%) | 181 (56) | 88 (55) | 93 (57) | 0.71 § |
| Weight, kg | 71.6 ± 11.0 a | 71.4 ± 10.5 b | 71.4 ± 10.5 c | 0.89 |
| BMI, kg/m2 | 22.7 ± 2.2 a | 22.6 ± 2.2 b | 22.8 ± 2.2 c | 0.51 |
| Running training | ||||
| Weeks of training, nr | 48 (40–52) a | 50 (40–52) b | 48 (40–52) c | 0.65 ‡ |
| Number of times per week | 2 (2–3) a | 2 (2–3) b | 2 (3–3) c | 0.76 ‡ |
| Average distance per training, km | 10 (8–12) a | 10 (8–12) b | 10 (8–12) c | 0.61 ‡ |
| Race | ||||
| Finish time, min | 76 ± 13 d | 77 ± 13 e | 76 ± 13 f | 0.88 |
| Running speed, km/hr | 12.1 ± 2.2 d | 12.2 ± 2.2 e | 12.0 ± 2.1 f | 0.48 |
| Average heart rate, bpm | 168 ± 12 g | 170 ± 10 h | 166 ± 13 i | 0.13 |
| Exercise intensity, % | 94 ± 6 g | 95 ± 5 h | 94 ± 7 i | 0.48 |
| Diet | ||||
| Energy intake, kcal | 2031 ± 632 j | 2017 ± 622 k | 2046 ± 644 l | 0.69 |
| Protein intake, g | 80.9 ± 26.6 j | 79.9 ± 26.5 k | 82.0 ± 26.8 l | 0.49 |
| Protein intake, g/kg/d | 1.14 ± 0.35 m | 1.11 ± 0.33 n | 1.17 ± 0.37 o | 0.21 |
| Animal protein, % | 52.0 ± 14.2 j | 52.0 ± 14.1 k | 51.9 ± 14.3 l | 0.94 |
| Plant protein, % | 47.7 ± 14.2 j | 47.9 ± 14.0 k | 47.5 ± 14.5 l | 0.82 |
| Protein, en% | 16.7 ± 4.1 j | 16.6 ± 4.0 k | 16.8 ± 4.1 l | 0.70 |
| Fat intake, en% | 33.3 ± 8.0 j | 33.2 ± 8.7 k | 33.4 ± 7.3 l | 0.79 |
| Carbohydrate intake, en% | 45.7 ± 9.0 j | 46.1 ± 10.4 k | 45.3 ± 7.4 l | 0.41 |
| Alcohol intake, g | 0.0 (0.0–9.6) | 0.0 (0.0–9.6) | 0.0 (0.0–9.3) | 0.43 ‡ |
| Day of the Race | 1 Day Post-Race | 2 Days Post-Race | |||||||
|---|---|---|---|---|---|---|---|---|---|
| Protein n = 134 | Placebo n = 127 | p-Value | Protein n = 119 | Placebo n = 115 | p-Value | Protein n = 119 | Placebo n = 112 | p-Value | |
| Energy intake, kcal | 2293 ± 790 | 2277 ± 697 | 0.86 | 1916 ± 596 | 1942 ± 717 | 0.76 | 1807 ± 580 | 1910 ± 624 | 0.20 |
| Protein intake, g | 76.5 ± 30.8 | 79.4 ± 36.1 | 0.49 | 75.4 ± 26.0 | 75.4 ± 29.0 | 0.99 | 73.6 ± 27.6 | 77.5 ± 26.7 | 0.27 |
| Protein intake, g/kg/d | 1.05 ± 0.38 a | 1.10 ± 0.40 b | 0.43 | 1.07 ± 0.38 c | 1.09 ± 0.39 d | 0.78 | 1.05 ± 0.36 e | 1.12 ± 0.34 f | 0.17 |
| Animal protein, % | 49.4 ± 18.0 | 50.0 ± 17.3 | 0.77 | 49.7 ± 17.8 | 51.4 ± 18.1 | 0.47 | 51.0 ± 18.2 | 53.3 ± 15.3 | 0.30 |
| Plant protein, % | 50.6 ± 18.1 | 49.9 ± 17.3 | 0.77 | 50.3 ± 17.8 | 48.4 ± 17.6 | 0.41 | 49.0 ± 18.2 | 46.7 ± 15.4 | 0.31 |
| Protein, en% | 13.9 ± 4.4 | 14.2 ± 4.2 | 0.62 | 16.3 ± 4.0 | 16.4 ± 5.1 | 0.77 | 16.8 ± 4.1 | 17.0 ± 4.1 | 0.73 |
| Fat intake, en% | 30.5 ± 9.2 | 31.3 ± 8.7 | 0.49 | 33.3 ± 9.4 | 34.9 ± 10.5 | 0.22 | 32.5 ± 9.3 | 34.6 ± 8.5 | 0.07 |
| Carbohydrate intake, en% | 48.7 ± 10.5 | 48.1 ± 10.0 | 0.65 | 46.1 ± 9.7 | 45.1 ± 9.4 | 0.44 | 46.2 ± 10.1 | 44.6 ± 8.7 | 0.22 |
| Alcohol intake, g | 7.9 (0.0–25.9) | 0.0 (0.0–18.9) | 0.25 ‡ | 0.0 (0.0–0.0) | 0.0 (0.0–0.3) | 0.48 ‡ | 0.0 (0.0–0.0) | 0.0 (0.0–0.0) | 0.58 ‡ |
| Protein | Placebo | p-Value | ||
|---|---|---|---|---|
| n = 150 | n = 150 | |||
| Baseline | Worst muscle soreness | 0.67 ± 1.61 | 0.66 ± 1.58 | 0.93 |
| Least muscle soreness | 0.27 ± 0.78 | 0.20 ± 0.69 | 0.53 | |
| Average muscle soreness past 24 h | 0.45 ± 1.08 | 0.44 ± 1.14 | 0.96 | |
| n = 155 | n = 152 | |||
| 1 day post-race | Worst muscle soreness | 3.83 ± 2.84 | 3.67 ± 3.01 | 0.61 |
| Least muscle soreness | 1.65 ± 1.93 | 1.43 ± 1.96 | 0.16 | |
| Average muscle soreness past 24 h | 2.79 ± 2.26 | 2.53 ± 2.47 | 0.17 | |
| n = 129 | n = 125 | |||
| 2 days post-race | Worst muscle soreness | 2.54 ± 2.38 | 2.54 ± 2.71 | 0.69 |
| Least muscle soreness | 1.19 ± 1.58 | 1.17 ± 1.68 | 0.49 | |
| Average muscle soreness past 24 h | 1.82 ± 1.88 | 1.8 ± 2.16 | 0.44 | |
| n = 148 | n = 144 | |||
| 3 days post-race | Worst muscle soreness | 1.26 ± 1.96 | 1.08 ± 1.70 | 0.74 |
| Least muscle soreness in | 0.49 ± 1.01 | 0.42 ± 0.80 | 0.78 | |
| Average muscle soreness past 24 h | 0.84 ± 1.42 | 0.74 ± 1.20 | 0.76 |
| Protein n = 74 a | Placebo n = 74 | p-value | |
|---|---|---|---|
| M. vastus lateralis, N | 73.8 ± 29.4 | 82.7 ± 33.5 | 0.088 |
| M. rectus femoris, N | 81.5 ± 31.0 | 92.4 ± 31.1 | 0.034 |
| M. vastus medialis, N | 61.6 ± 25.4 | 74.0 ± 30.0 | 0.007 |
| Average 3 muscles, N | 72.3 ± 26.1 | 83.1 ± 28.0 | 0.017 |
Publisher’s Note: MDPI stays neutral with regard to jurisdictional claims in published maps and institutional affiliations. |
© 2021 by the authors. Licensee MDPI, Basel, Switzerland. This article is an open access article distributed under the terms and conditions of the Creative Commons Attribution (CC BY) license (http://creativecommons.org/licenses/by/4.0/).
Share and Cite
ten Haaf, D.S.M.; Flipsen, M.A.; Horstman, A.M.H.; Timmerman, H.; Steegers, M.A.H.; de Groot, L.C.P.G.M.; Eijsvogels, T.M.H.; Hopman, M.T.E. The Effect of Protein Supplementation versus Carbohydrate Supplementation on Muscle Damage Markers and Soreness Following a 15-km Road Race: A Double-Blind Randomized Controlled Trial. Nutrients 2021, 13, 858. https://doi.org/10.3390/nu13030858
ten Haaf DSM, Flipsen MA, Horstman AMH, Timmerman H, Steegers MAH, de Groot LCPGM, Eijsvogels TMH, Hopman MTE. The Effect of Protein Supplementation versus Carbohydrate Supplementation on Muscle Damage Markers and Soreness Following a 15-km Road Race: A Double-Blind Randomized Controlled Trial. Nutrients. 2021; 13(3):858. https://doi.org/10.3390/nu13030858
Chicago/Turabian Styleten Haaf, Dominique S. M., Martin A. Flipsen, Astrid M. H. Horstman, Hans Timmerman, Monique A. H. Steegers, Lisette C. P. G. M. de Groot, Thijs M. H. Eijsvogels, and Maria T. E. Hopman. 2021. "The Effect of Protein Supplementation versus Carbohydrate Supplementation on Muscle Damage Markers and Soreness Following a 15-km Road Race: A Double-Blind Randomized Controlled Trial" Nutrients 13, no. 3: 858. https://doi.org/10.3390/nu13030858
APA Styleten Haaf, D. S. M., Flipsen, M. A., Horstman, A. M. H., Timmerman, H., Steegers, M. A. H., de Groot, L. C. P. G. M., Eijsvogels, T. M. H., & Hopman, M. T. E. (2021). The Effect of Protein Supplementation versus Carbohydrate Supplementation on Muscle Damage Markers and Soreness Following a 15-km Road Race: A Double-Blind Randomized Controlled Trial. Nutrients, 13(3), 858. https://doi.org/10.3390/nu13030858