
Is It What They Eat or How Much They Eat That Matters More in Adults with Food Insecurity in a Wealthy-Country Context?


Abstract
1. Introduction
2. Materials and Methods
2.1. Study Design and Subjects
2.2. Socio-Demographic Factors
2.3. Household Food Security Measurement
2.4. Nutrients Intake Measurement
2.5. Korean Healthy Eating Index (KHEI)
2.6. Statistical Analysis
3. Results
3.1. Socio-Demographic Characteristics According to Food Security Status
3.2. Nutritional Adequacy According to Household Food Security Status
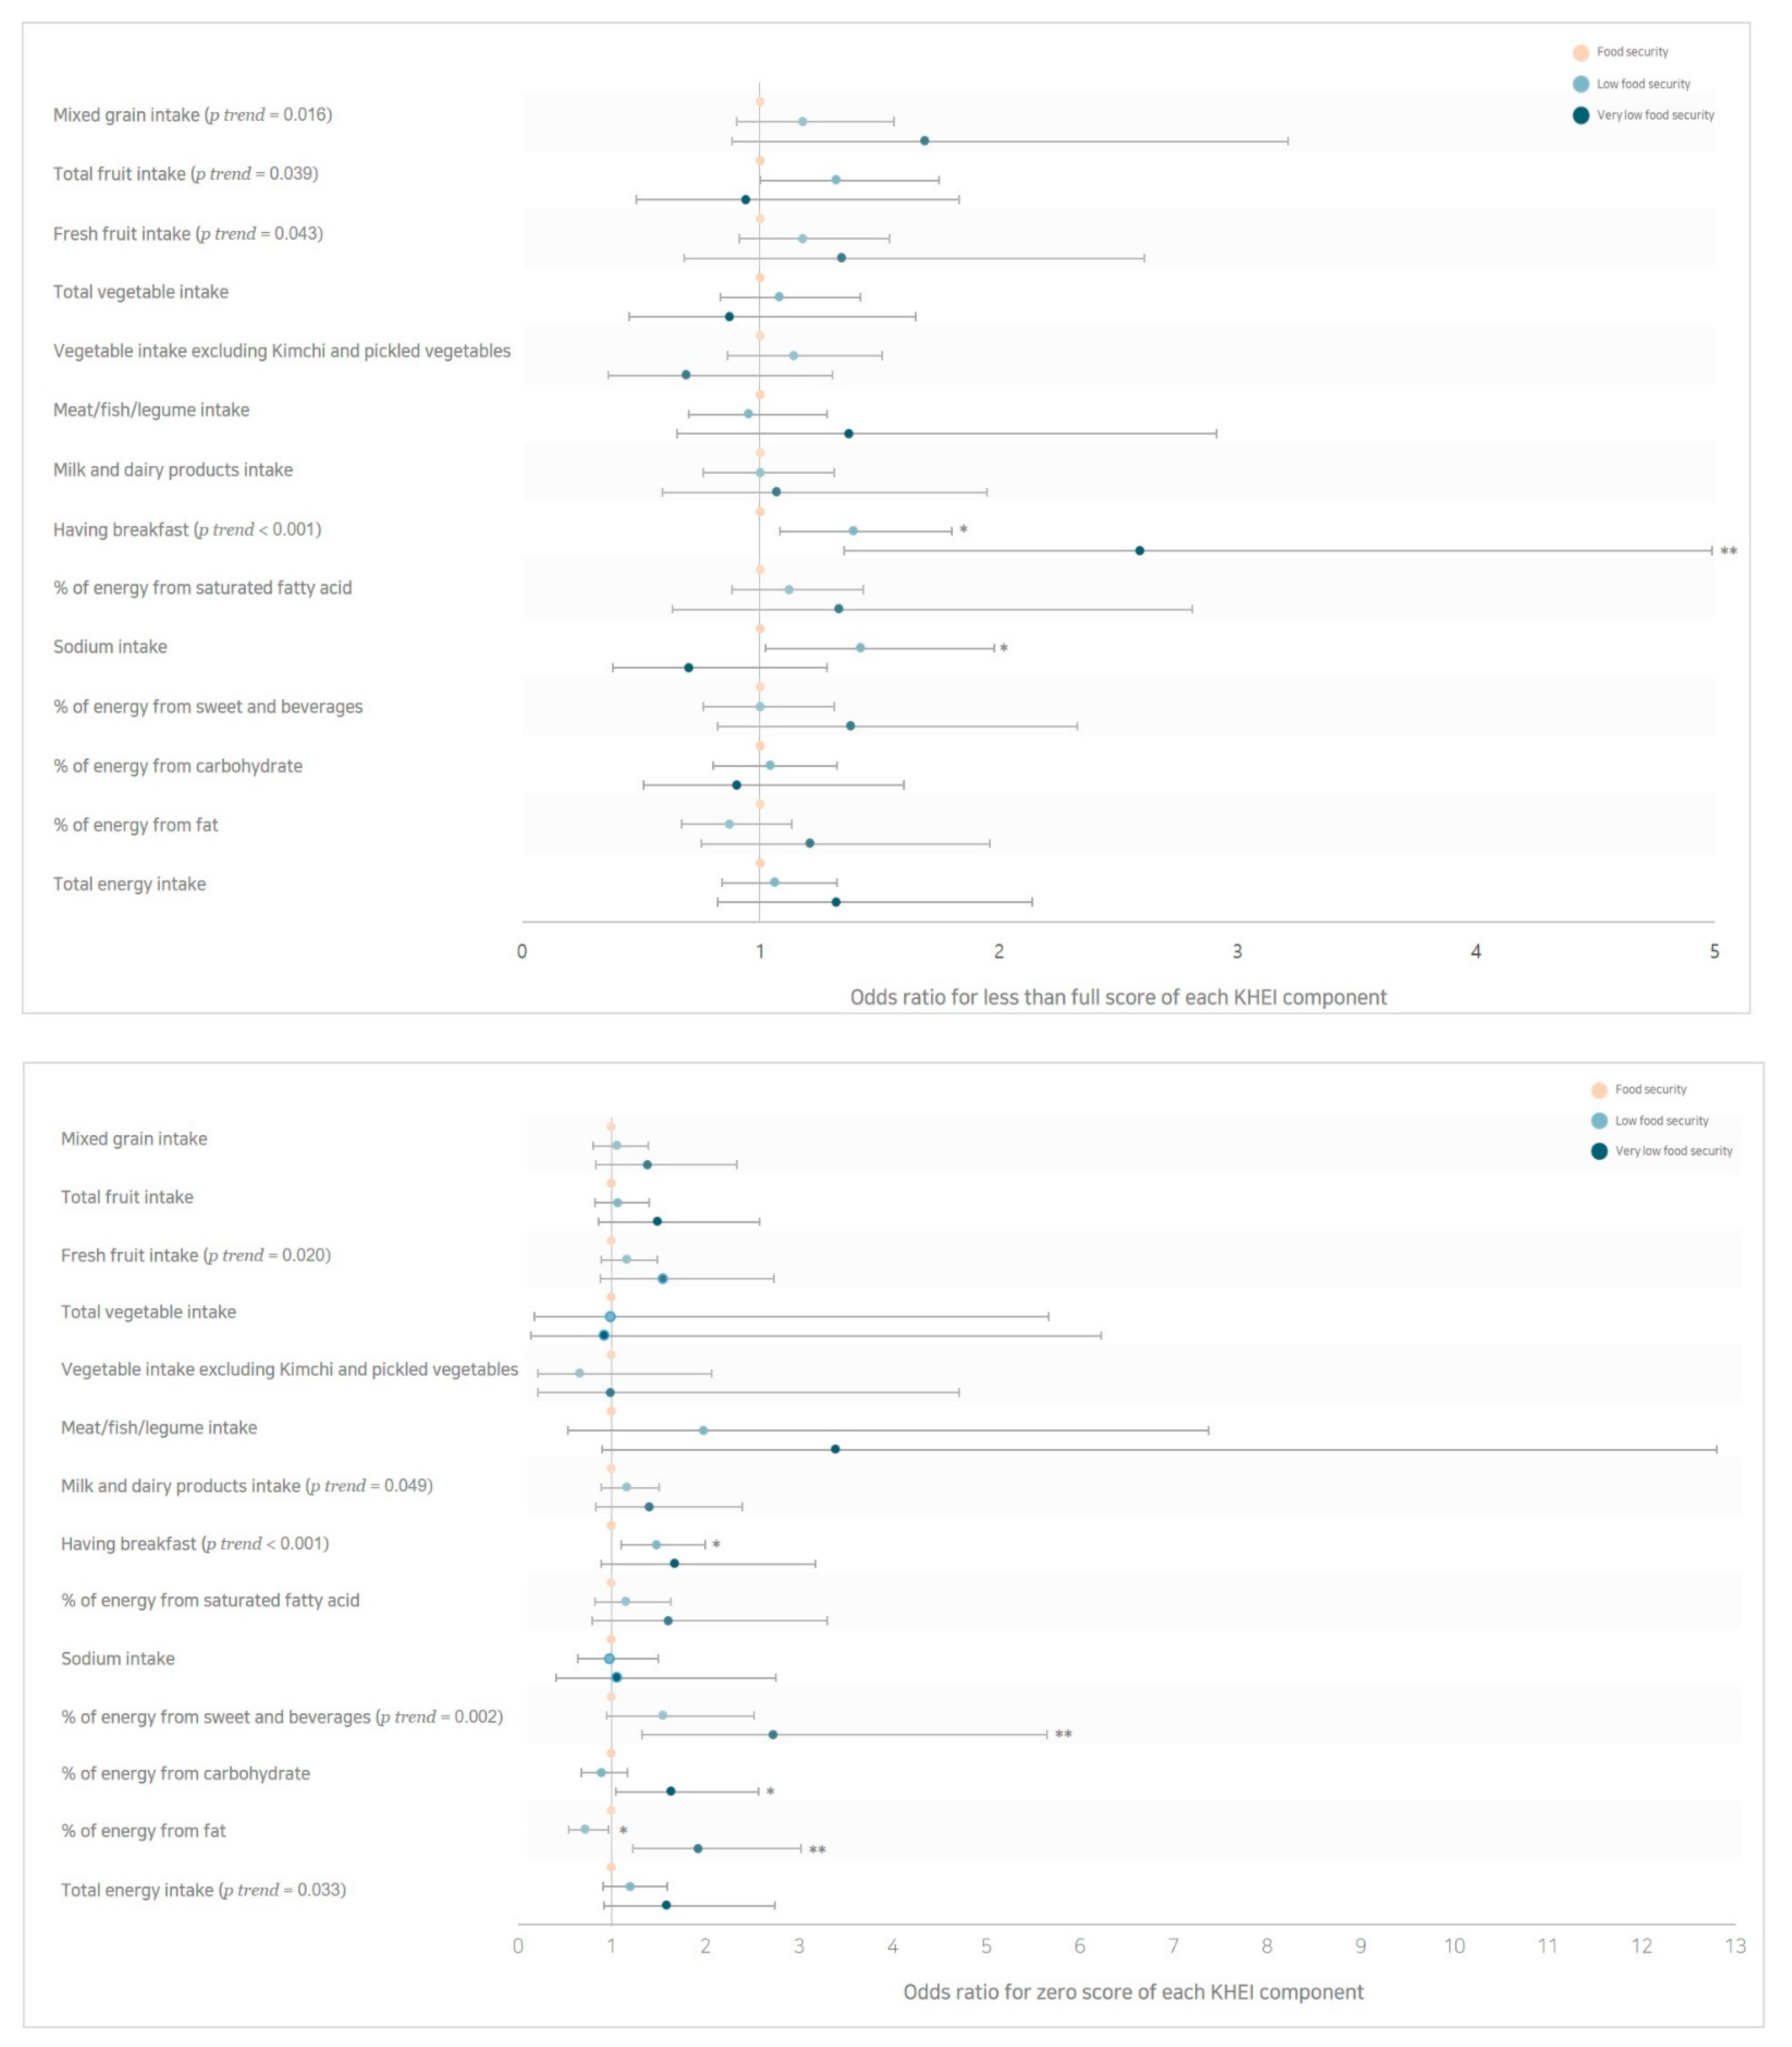
3.3. Dietary Quality Measured by the KHEI According to Household Food Security Status
4. Discussion
5. Conclusions
Author Contributions
Funding
Institutional Review Board Statement
Informed Consent Statement
Data Availability Statement
Conflicts of Interest
References
- GBD 2017 Diet Collaborators; Afshin, A.; Sur, P.J.; Fay, K.A.; Cornaby, L.; Ferrara, G.; Salama, J.S.; Mullany, E.C.; Abate, K.H.; Abbafati, C.; et al. Health effects of dietary risks in 195 countries, 1990–2017: A systematic analysis for the Global Burden of Disease Study 2017. Lancet 2019, 393, 1958–1972. [Google Scholar] [CrossRef]
- Leung, C.W.; Epel, E.S.; Ritchie, L.D.; Crawford, P.B.; Laraia, B.A. Food insecurity is inversely associated with diet quality of lower-income adults. J. Acad. Nutr. Diet. 2014, 114, 1943–1953. [Google Scholar] [CrossRef]
- Kim, H.R. Nutrition transition and shiting diet linked noncommunicable diseases and policy issues. Health Welf Policy Forum 2013, 198, 27–37. [Google Scholar]
- Guthrie, J.F.; Nord, M. Federal activities to monitor food security. J. Acad. Nutr. Diet. 2002, 102, 904–906. [Google Scholar] [CrossRef]
- Champagne, C.M.; Casey, P.H.; Connell, C.L.; Stuff, J.E.; Gossett, J.M.; Harsha, D.W.; McCabe-Sellers, B.; Robbins, J.M.; Simpson, P.M.; Weber, J.L.; et al. Poverty and food intake in rural America: Diet quality is lower in food insecure adults in the Mississippi Delta. J. Am. Diet. Assoc. 2007, 107, 1886–1894. [Google Scholar] [CrossRef] [PubMed]
- Pei, C.S.; Appannah, G.; Sulaiman, N. Household food insecurity, diet quality, and weight status among indigenous women (Mah Meri) in Peninsular Malaysia. Nutr. Res. Pract. 2018, 12, 135–142. [Google Scholar] [CrossRef] [PubMed]
- Rodríguez, L.A.; Mundo-Rosas, V.; Méndez-Gómez-Humarán, I.; Pérez-Escamilla, R.; Shamah-Levy, T. Dietary quality and household food insecurity among Mexican children and adolescents. Matern. Child Nutr. 2017, 13, e12372. [Google Scholar] [CrossRef] [PubMed]
- Huet, C.; Rosol, R.; Egeland, G.M. The prevalence of food insecurity is high and the diet quality poor in Inuit communities. J. Nutr. 2012, 142, 541–547. [Google Scholar] [CrossRef] [PubMed]
- Tarasuk, V.S.; Beaton, G.H. Women’s dietary intakes in the context of household food insecurity. J. Nutr. 1999, 129, 672–679. [Google Scholar] [CrossRef]
- Kirkpatrick, S.I.; Tarasuk, V. Food insecurity is associated with nutrient inadequacies among Canadian adults and adolescents. J. Nutr. 2008, 138, 604–612. [Google Scholar] [CrossRef]
- Mclaughlin, C.; Tarasuk, V.; Kreiger, N. An examination of at-home food preparation activity among low-income, food-insecure women. J. Am. Diet. Assoc. 2003, 103, 1506–1512. [Google Scholar] [CrossRef]
- Olson, C.M. Symposium: Advances in Measuring Food Insecurity and Hunger in the US Introduction. J. Nutr. 1999, 129 (Suppl. 2S), 504S–505S. [Google Scholar] [CrossRef]
- Yang, Y.J. Socio-demographic characteristics, nutrient intakes and mental health status of older Korean adults depending on household food security: Based on the 2008-2010 Korea National Health and Nutrition Examination Survey. Korean J. Commun. Nutr. 2015, 20, 30–40. [Google Scholar] [CrossRef]
- Jun, S.; Hong, E.; Joung, H. Flavonoid intake according to food security in Korean adults: Based on the Korea National Health and Nutrition Examination Survey 2007–2012. J. Nutr. Health 2015, 48, 507–518. [Google Scholar] [CrossRef]
- Lane, G.; Nisbet, C.; Vatanparast, H. Food Insecurity and Nutritional Risk among Canadian Newcomer Children in Saskatchewan. Nutrients 2019, 11, 1744. [Google Scholar] [CrossRef]
- Kim, H.J.; Oh, K. Household food insecurity and dietary intake in Korea: Results from the 2012 Korea National Health and Nutrition Examination Survey. Public Health Nutr. 2015, 18, 3317–3325. [Google Scholar] [CrossRef]
- Shim, J.S.; Oh, K.W.; Nam, C.M. Association of Household Food Security with Dietary Intake; Based on the Third (2005) Korea National Health and Nutrition Examination Survey (KNHANES III). J. Nutr. Health 2008, 41, 174–183. [Google Scholar]
- Lim, H.S.; Park, Y.H.; Lee, H.H.; Kim, T.H.; Kim, S.K. Comparison of calcium intake status by region and socioeconomic status in Korea: The 2011-2013 Korea National Health and Nutrition Examination Survey. J. Bone Metab. 2015, 22, 119–126. [Google Scholar] [CrossRef]
- Hur, I.; Jang, M.J.; Oh, K. Food and nutrient intakes according to income in Korean men and women. Osong Public Health Res. Perspect. 2011, 2, 192–197. [Google Scholar] [CrossRef]
- Shim, J.E.; Yoon, J.; Lee, K.; Kwon, S. Evaluation of dietary intake of Korean school-aged children from low-income families by comparing with the Korean food guide: Analysis of the data from the 2001 National Health and Nutrition Survey. Korean J. Nutr. 2009, 42, 691–701. [Google Scholar] [CrossRef][Green Version]
- Chun, I.; Ryu, S.Y.; Park, J.; Ro, H.K.; Han, M.A. Associations between food insecurity and healthy behaviors among Korean adults. Nutr. Res. Pract. 2015, 9, 425–432. [Google Scholar] [CrossRef]
- Lee, S.E.; Song, Y.J.; Kim, Y.; Choe, J.; Paik, H.Y. Household food insufficiency is associated with dietary intake in Korean adults. Public Health Nutr. 2016, 19, 1112–1121. [Google Scholar] [CrossRef]
- Chung, H.K.; Kim, O.Y.; Kwak, S.Y.; Cho, Y.; Lee, K.W.; Shin, M.J. Household food insecurity is associated with adverse mental health indicators and lower quality of life among Koreans: Results from the Korea National Health and Nutrition Examination Survey 2012–2013. Nutrients 2016, 8, 819. [Google Scholar] [CrossRef]
- Oh, S.Y.; Hong, M.J. Food insecurity is associated with dietary intake and body size of Korean children from low-income families in urban areas. Eur. J. Clin. Nutr. 2003, 57, 1598–1604. [Google Scholar] [CrossRef]
- Kwon, S.O.; Oh, S.Y. Associations of household food insecurity with socioeconomic measures, health status and nutrient intake in low income elderly. J. Nutr. Health 2007, 40, 762–768. [Google Scholar]
- Lee, K.; Yoo, H.S. Association of food insecurity and depression in Korean adults. JKAIS 2016, 17, 62–71. [Google Scholar]
- Kim, K.; Kim, M.K.; Shin, Y.J. Household food insecurity and its characteristics in Korea. Health Soc. Welf Rev. 2009, 29, 268–292. [Google Scholar]
- Trijsburg, L.; Talsma, E.F.; De Vries, J.H.; Kennedy, G.; Kuijsten, A.; Brouwer, I.D. Diet quality indices for research in low-and middle-income countries: A systematic review. Nutr. Rev. 2019, 77, 515–540. [Google Scholar] [CrossRef]
- Guenther, P.M.; Reedy, J.; Krebs-Smith, S.M.; Reeve, B.B.; Basiotis, P.P. Development and Evaluation of the Healthy Eating Index-2005; Technical Report; Department of Agriculture, Center for Nutrition Policy and Promotion: Alexandria, VA, USA, 2007. [Google Scholar]
- Krebs-Smith, S.M.; Pannucci, T.E.; Subar, A.F.; Kirkpatrick, S.I.; Lerman, J.L.; Tooze, J.A.; Wilson, M.M.; Reedy, J. Update of the healthy eating index: HEI-2015. J. Acad. Nutr. Diet. 2018, 118, 1591–1602. [Google Scholar] [CrossRef]
- Woodruff, S.J.; Hanning, R.M. Development and implications of a revised Canadian healthy eating index (HEIC-2009). Public Health Nutr. 2010, 13, 820–825. [Google Scholar] [CrossRef]
- Hiza, H.A.; Casavale, K.O.; Guenther, P.M.; Davis, C.A. Diet quality of Americans differs by age, sex, race/ethnicity, income, and education level. J. Acad. Nutr. Diet. 2013, 113, 297–306. [Google Scholar] [CrossRef]
- Korea Centers for Disease Control and Prevention. Korea Health Statistics 2015: Korea National Health and Nutrition Examination Survey (KNHANES VI-3); Korea Centers for Disease Control and Prevention: Osong, Korea, 2016. [Google Scholar]
- English site for Food Composition Database. Available online: http://koreanfood.rda.go.kr/eng/fctFoodSrchEng/main (accessed on 25 February 2021).
- Yook, S.M.; Park, S.; Moon, H.K.; Kim, K.; Shim, J.E.; Hwang, J.Y. Development of Korean healthy eating index for adults using the Korea national health and nutrition examination survey data. J. Nutr. Health 2015, 48, 419–428. [Google Scholar] [CrossRef]
- Yun, S.; Oh, K. Development and status of Korean Healthy Eating Index for adults based on the Korea National Health and Nutrition Examination Survey. Public Health Wkly Rep. 2018, 11, 1764–1772. [Google Scholar]
- Banna, J.C.; McCrory, M.A.; Fialkowski, M.K.; Boushey, C. Examining plausibility of self-reported energy intake data: Considerations for method selection. Front. Nutr. 2017, 4, 45. [Google Scholar] [CrossRef]
- Korea Centers for Disease Control and Prevention. The Sixth Korea National Health and Nutrition Examination Survey (KNHANES VI-3); Korea Centers for Disease Control and Prevention: Osong, Korea, 2019. [Google Scholar]
- The Ministry of Health and Welfare. The Korean Nutrition Society. Dietary Reference Intakes for Koreans 2015; The Ministry of Health and Welfare: Sejong, Korea, 2015. [Google Scholar]
- Tugault-Lafleur, C.N.; Black, J.L.; Barr, S.I. A systematic review of methods to assess children’s diets in the school context. Adv. Nutr. 2017, 8, 63–79. [Google Scholar] [CrossRef]
- Lynch, S.R. Why nutritional iron deficiency persists as a worldwide problem. J. Nutr. 2011, 141, 763S–768S. [Google Scholar] [CrossRef]
- Workicho, A.; Belachew, T.; Feyissa, G.T.; Wondafrash, B.; Lachat, C.; Verstraeten, R.; Kolsteren, P. Household dietary diversity and Animal Source Food consumption in Ethiopia: Evidence from the 2011 Welfare Monitoring Survey. BMC Public Health 2016, 16, 1192. [Google Scholar] [CrossRef]
- Lee, Y.S.; Kim, T.H. Household food insecurity and breakfast skipping: Their association with depressive symptoms. Psychiatry Res. 2019, 271, 83–88. [Google Scholar] [CrossRef]
- Crews, D.C.; Kuczmarski, M.F.; Grubbs, V.; Hedgeman, E.; Shahinian, V.B.; Evans, M.K.; Zonderman, A.B.; Burrows, N.R.; Williams, D.E.; Saran, R.; et al. Effect of food insecurity on chronic kidney disease in lower-income Americans. Am. J. Nephrol. 2014, 39, 27–35. [Google Scholar] [CrossRef]
- Kim, D.W.; Lee, M.S.; Na, B.J.; Hong, J.Y. Health-related dietary behaviors and lifestyle factors associated with sodium hyperingestion in Korean adults. JKAIS 2013, 14, 3326–3337. [Google Scholar]
- Kim, J.H.; Lim, G.E.; Kang, S.; Lee, K.; Park, T.J.; Kim, J. The relationship between daily sodium intake and obesity in Korean adults. Korean J. Health Promot. 2015, 15, 175–184. [Google Scholar] [CrossRef]
- Kim, N.; Kim, G.U.; Kim, H. Comparative Study of Dietary Patterns by Living Arrangements: The Korea National Health and Nutrition Examination Survey (KNHANES) 2013–2015. Int. J. Environ. Res. Public Health 2020, 17, 2371. [Google Scholar] [CrossRef] [PubMed]
- Shim, J.E.; Paik, H.Y.; Moon, H.K. Breakfast consumption pattern, diet quality and health outcomes in adults from 2001 National Health and Nutrition Survey. J. Nutr. Health 2007, 40, 451. [Google Scholar]
- Tarasuk, V.S. Household food insecurity with hunger is associated with women’s food intakes, health and household circumstances. J. Nutr. 2001, 131, 2670–2676. [Google Scholar] [CrossRef] [PubMed]
- Lee, S.H.; Chung, S.J.; Choi, K.R. Relationship between nutrient intake and biochemical index with breakfast eating in Korean adults: Analysis of data from the 2007 National Health and Nutrition Survey. Korean J. Food Cult. 2011, 26, 94–99. [Google Scholar]
- Gundersen, C.; Kreider, B.; Pepper, J. The economics of food insecurity in the United States. Appl. Econ. Perspect. Policy 2011, 33, 281–303. [Google Scholar] [CrossRef]
- Lee, J.; Shin, A. Vegetable and fruit intake in one person household: The Korean National Health and Nutrition Examination Survey (2010–2012). J. Nutr. Health 2015, 48, 269–276. [Google Scholar] [CrossRef]
- Kendall, A.; Olson, C.M.; Frongillo, E.A., Jr. Relationship of hunger and food insecurity to food availability and consumption. J. Am. Diet. Assoc. 1996, 96, 1019–1024. [Google Scholar] [CrossRef]
- Bawadi, H.A.; Tayyem, R.F.; Dwairy, A.N.; Al-Akour, N. Prevalence of food insecurity among women in northern Jordan. J. Health Popul. Nutr. 2012, 30, 49. [Google Scholar] [CrossRef]
- Taylor, C.A.; Spees, C.K.; Markwordt, A.M.; Watowicz, R.P.; Clark, J.K.; Hooker, N.H. Differences in US adult dietary patterns by food security status. J. Consum. Aff. 2017, 51, 549–565. [Google Scholar] [CrossRef]
- Lee, J.S.; Kim, H.Y.; Hwang, J.Y.; Kwon, S.; Chung, H.R.; Kwak, T.K.; Kang, M.H.; Choi, Y.S. Development of Nutrition Quotient for Korean adults: Item selection and validation of factor structure. J. Nutr. Health 2018, 51, 340–356. [Google Scholar] [CrossRef]
- Jang, H.B.; Park, J.Y.; Lee, H.J.; Kang, J.H.; Park, K.H.; Song, J. Association between parental socioeconomic level, overweight, and eating habits with diet quality in Korean sixth grade school children. Korean J. Nutr. 2011, 44, 416–427. [Google Scholar] [CrossRef][Green Version]
- Alaimo, K.; Briefel, R.R.; Frongillo, E.A., Jr.; Olson, C.M. Food insufficiency exists in the United States: Results from the third National Health and Nutrition Examination Survey (NHANES III). Am. J. Public Health 1998, 88, 419–426. [Google Scholar] [CrossRef] [PubMed]
- Wolfson, J.A.; Leung, C.W. Food insecurity and COVID-19: Disparities in early effects for US adults. Nutrients 2020, 12, 1648. [Google Scholar] [CrossRef] [PubMed]


| Characteristics | Food Security | Low Food Security | Very Low Food Security | p-Value |
|---|---|---|---|---|
| (n = 6605) | (n = 452) | (n = 87) | ||
| mean ± SE or n (weighted %) | ||||
| Age, years | 41.3 ± 0.2 | 42.1 ± 0.7 | 42.6 ± 1.7 | 0.335 |
| Household size, n | 3.3 ± 0.02 a | 3.4 ± 0.08 a | 2.9 ± 0.19 b | 0.004 |
| Body mass index, kg/m2 | 23.5 ± 0.1 | 23.6 ± 0.2 | 23.6 ± 0.4 | 0.812 |
| Female, n | 3830 (58.0) | 295 (65.3) | 49 (56.3) | 0.047 |
| Disease history | 1406 (21.3) | 114 (25.2) | 24 (27.6) | 0.249 |
| Education | <0.001 | |||
| ≤Elementary school graduate | 716 (10.8) | 96 (21.2) | 25 (28.7) | |
| Middle school graduate | 640 (9.7) | 65 (14.4) | 21 (24.1) | |
| High school graduate | 2620 (39.7) | 198 (43.8) | 27 (31.0) | |
| ≥College graduate | 2629 (39.8) | 93 (20.6) | 14 (16.1) | |
| Marital status | <0.001 | |||
| Married | 4875 (73.8) | 284 (62.8) | 36 (41.4) | |
| Never married | 1310 (19.8) | 88 (19.5) | 25 (28.7) | |
| Separated, widowed, divorced | 420 (6.4) | 80 (17.7) | 26 (29.9) | |
| Household income | <0.001 | |||
| Low | 496 (7.5) | 132 (29.2) | 47 (54.0) | |
| Middle low | 1590 (24.1) | 197 (43.6) | 23 (26.4) | |
| Middle high | 2160 (32.7) | 104 (23.0) | 16 (18.4) | |
| High | 2359 (35.7) | 19 (4.2) | 1 (1.1) | |
| Smoking behavior | 0.346 | |||
| Nonsmoker | 4108 (62.2) | 273(60.4) | 45 (51.7) | |
| Former smoker | 1121 (17.0) | 63(13.9) | 13 (14.9) | |
| <20 cigarettes/day | 854 (12.9) | 76(16.8) | 18 (20.7) | |
| ≥20 cigarettes/day | 522 (7.9) | 40(8.8) | 11 (12.6) | |
| Alcohol drinking | 0.039 | |||
| Non-drinker | 519 (7.9) | 49 (10.8) | 8 (9.2) | |
| <1 drink/month | 2156 (32.6) | 176 (38.9) | 32 (36.8) | |
| ≥1 drink–4 drinks/month | 1915 (29.0) | 114 (25.2) | 21 (24.1) | |
| ≥5 drinks/month | 2015 (30.5) | 113 (25.0) | 26 (29.9) | |
| Physical Activity | 0.010 | |||
| Low | 2959 (44.8) | 210 (46.5) | 50 (57.5) | |
| Middle Low | 1913 (29.0) | 153 (33.8) | 19 (21.8) | |
| Middle high | 881 (13.3) | 36 (8.0) | 10 (11.5) | |
| High | 852 (12.9) | 53 (11.7) | 8 (9.2) | |
| Mean | Median | 10th, 90th Percentile | % Meeting Guideline 1 | Model 1 2 | Model 2 3 | Model 3 4 | p Trend | ||||
|---|---|---|---|---|---|---|---|---|---|---|---|
| OR | 95% CI | OR | 95% CI | OR | 95% CI | ||||||
| Total energy (kcal/day) | 0.479 | ||||||||||
| Food security | 2084 | 2012 | 1167, 3015 | 35.4 (32.7) | 1.0 | 1.0 | 1.0 | ||||
| Low food security | 1960 | 1862 | 1088, 2925 | 31.6 (2.0) | 1.13 | 0.89–1.44 | 1.14 | 0.90–1.44 | 1.03 | 0.80–1.32 | |
| Very low food security | 1674 | 1593 | 884, 2428 | 24.1 (0.3) | 1.37 | 0.83–2.26 | 1.38 | 0.84–2.29 | 1.20 | 0.72–2.00 | |
| p = 0.289 | |||||||||||
| Carbohydrate (g/day) | 0.202 | ||||||||||
| Food security | 313 | 301 | 180, 455 | 27.9 (25.8) | 1.0 | 1.0 | 1.0 | ||||
| Low food security | 300 | 293 | 163, 442 | 27.7 (1.7) | 0.95 | 0.74–1.24 | 0.92 | 0.72–1.21 | 0.84 | 0.64–1.10 | |
| Very low food security | 261 | 239 | 138, 415 | 24.1 (0.3) | 1.00 | 0.57–1.74 | 0.97 | 0.57–1.66 | 0.84 | 0.49–1.46 | |
| p = 0.936 | |||||||||||
| Fat (g/day) | 0.676 | ||||||||||
| Food security | 47 | 42 | 15, 81 | 55.4 (51.2) | 1.0 | 1.0 | 1.0 | ||||
| Low food security | 43 | 35 | 13, 77 | 53.1 (3.4) | 1.05 | 0.82–1.33 | 1.01 | 0.79–1.29 | 0.87 | 0.67–1.13 | |
| Very low food security | 33 | 29 | 8, 63 | 43.7 (0.5) | 1.52 | 0.94–2.48 | 1.39 | 0.87–2.24 | 1.11 | 0.69–1.80 | |
| p = 0.253 | |||||||||||
| N-6 fatty acid (g/day) | 0.753 | ||||||||||
| Food security | 10.0 | 8.3 | 2.7, 18.1 | 41.9 (38.7) | 1.0 | 1.0 | 1.0 | ||||
| Low food security | 9.0 | 7.0 | 2.4, 16.5 | 36.1 (2.3) | 1.17 | 0.93–1.48 | 1.11 | 0.87–1.41 | 0.93 | 0.74–1.20 | |
| Very low food security | 7.6 | 5.0 | 1.8, 15.9 | 34.5 (0.4) | 1.36 | 0.80–2.29 | 1.13 | 0.68–1.89 | 0.87 | 0.52–1.45 | |
| p = 0.220 | |||||||||||
| N-3 fatty acid (g/day) | 0.938 | ||||||||||
| Food security | 1.6 | 1.2 | 0.4, 3.2 | 48.3 (44.7) | 1.0 | 1.0 | 1.0 | ||||
| Low food security | 1.5 | 1.0 | 0.3, 3.3 | 45.1 (2.9) | 1.12 | 0.89–1.40 | 1.09 | 0.88–1.37 | 0.95 | 0.76–1.20 | |
| Very low food security | 1.2 | 0.8 | 0.1, 2.4 | 40.2 (0.5) | 1.28 | 0.73–2.27 | 1.19 | 0.68–2.08 | 0.930 | 0.54–1.60 | |
| p = 0.443 | |||||||||||
| Saturated fat (g/day) | 0.842 | ||||||||||
| Food security | 14 | 12 | 4, 24 | 72.2 (66.8) | 1.0 | 1.0 | 1.0 | ||||
| Low food security | 13 | 10 | 3, 23 | 72.3 (4.6) | 0.96 | 0.76–1.22 | 1.04 | 0.81–1.34 | 1.13 | 0.87–1.45 | |
| Very low food security | 9 | 8 | 2, 20 | 74.7 (0.9) | 0.79 | 0.40–1.54 | 0.93 | 0.44–1.95 | 1.05 | 0.48–2.31 | |
| p = 0.717 | |||||||||||
| Dietary cholesterol (mg/day) | 0.185 | ||||||||||
| Food security | 262 | 208 | 37, 538 | 69.4 (64.2) | 1.0 | 1.0 | 1.0 | ||||
| Low food security | 253 | 170 | 26, 590 | 70.6 (4.5) | 0.90 | 0.70–1.15 | 1.04 | 0.79–1.36 | 1.29 | 0.97–1.72 | |
| Very low food security | 202 | 96 | 8, 493 | 80.5 (1.0) | 0.73 | 0.41–1.31 | 1.20 | 0.66–2.20 | 1.73 | 0.95–3.16 | |
| p = 0.405 | |||||||||||
| Protein (g/day) | 0.021 | ||||||||||
| Food security | 73 | 67 | 35, 111 | 64.8 (60.0) | 1.0 | 1.0 | 1.0 | ||||
| Low food security | 66 | 62 | 29, 104 | 55.3 (3.5) | 1.49 ** | 1.19–1.85 | 1.32 | 0.97–1.80 | 0.99 | 0.72–1.37 | |
| Very low food security | 52 | 44 | 25, 93 | 37.9 (0.5) | 3.06 *** | 1.84–5.08 | 1.72 | 0.72–4.10 | 1.17 | 0.51–2.68 | |
| p < 0.001 | |||||||||||
| Dietary fiber (g/day) | 0.744 | ||||||||||
| Food security | 24 | 21 | 11, 40 | 48.4 (44.7) | 1.0 | 1.0 | 1.0 | ||||
| Low food security | 21 | 20 | 9, 37 | 46.9 (3.0) | 1.07 | 0.85–1.35 | 1.02 | 0.79–1.32 | 0.86 | 0.66–1.12 | |
| Very low food security | 19 | 19 | 6, 35 | 37.9 (0.5) | 1.65 | 0.97–2.80 | 1.01 | 0.52–1.94 | 0.79 | 0.41–1.55 | |
| p = 0.149 | |||||||||||
| Vitamin A (μgRE/day) | 0.403 | ||||||||||
| Food security | 729 | 536 | 196, 1333 | 33.8 (31.2) | 1.0 | 1.0 | 1.0 | ||||
| Low food security | 734 | 486 | 165, 1390 | 31.6 (2.0) | 0.99 | 0.77–1.28 | 0.932 | 0.71–1.22 | 0.83 | 0.63–1.09 | |
| Very low food security | 662 | 408 | 109, 1422 | 24.1 (0.3) | 1.24 | 0.71–2.18 | 0.855 | 0.47–1.55 | 0.71 | 0.39–1.29 | |
| p = 0.752 | |||||||||||
| Thiamin (mg/day) | 0.072 | ||||||||||
| Food security | 2.1 | 1.9 | 1.0, 3.1 | 86.6 (80.0) | 1.0 | 1.0 | 1.0 | ||||
| Low food security | 2.0 | 1.8 | 0.9, 3.0 | 81.9 (5.2) | 1.41 * | 1.05–1.90 | 1.12 | 0.80–1.57 | 0.99 | 0.69–1.42 | |
| Very low food security | 1.6 | 1.4 | 0.7, 2.8 | 73.6 (0.9) | 2.61 ** | 1.55–4.39 | 1.19 | 0.57–2.46 | 0.94 | 0.46–1.91 | |
| p < 0.001 | |||||||||||
| Riboflavin (mg/day) | 0.841 | ||||||||||
| Food security | 1.4 | 1.3 | 0.6, 2.3 | 45.0 (41.6) | 1.0 | 1.0 | 1.0 | ||||
| Low food security | 1.3 | 1.2 | 0.5, 2.0 | 40.0 (2.5) | 1.24 | 0.98–1.55 | 1.06 | 0.81–1.40 | 0.84 | 0.63–1.12 | |
| Very low food security | 1.1 | 0.8 | 0.3, 2.2 | 27.6 (0.3) | 1.99 * | 1.14–3.47 | 0.97 | 0.48–1.95 | 0.66 | 0.33–1.32 | |
| p = 0.009 | |||||||||||
| Niacin (mg/day) | 0.406 | ||||||||||
| Food security | 17 | 15 | 8, 27 | 48.0 (44.4) | 1.0 | 1.0 | 1.0 | ||||
| Low food security | 15 | 14 | 7, 24 | 43.1 (2.7) | 1.24 * | 1.00–1.54 | 1.10 | 0.88–1.37 | 0.91 | 0.72–1.14 | |
| Very low food security | 12 | 11 | 5, 22 | 28.7 (0.3) | 2.26 ** | 1.30–3.92 | 1.32 | 0.71–2.47 | 0.95 | 0.51–1.75 | |
| p = 0.002 | |||||||||||
| Vitamin C (mg/day) | 0.080 | ||||||||||
| Food security | 98 | 59 | 18, 235 | 33.9 (31.3) | 1.0 | 1.0 | 1.0 | ||||
| Low food security | 84 | 50 | 15, 198 | 27.0 (1.7) | 1.37 * | 1.07–1.74 | 1.38 * | 1.07–1.78 | 1.14 | 0.87–1.48 | |
| Very low food security | 58 | 34 | 9, 136 | 21.8 (0.3) | 2.17 * | 1.12–4.21 | 1.80 | 0.87–3.71 | 1.32 | 0.65–2.71 | |
| p = 0.003 | |||||||||||
| Calcium (mg/day) | 0.306 | ||||||||||
| Food security | 498 | 442 | 215, 822 | 13.4 (12.4) | 1.0 | 1.0 | 1.0 | ||||
| Low food security | 463 | 406 | 199, 765 | 11.1 (0.7) | 1.19 | 0.83–1.69 | 1.09 | 0.75–1.57 | 0.90 | 0.61–1.33 | |
| Very low food security | 368 | 378 | 127, 631 | 3.4 (0.0) | 4.75 ** | 1.48–15.25 | 3.11 | 0.88–10.91 | 2.35 | 0.68–8.12 | |
| p = 0.022 | |||||||||||
| Phosphorus (mg/day) | 0.002 | ||||||||||
| Food security | 1103 | 1047 | 568, 1655 | 80.4 (74.3) | 1.0 | 1.0 | 1.0 | ||||
| Low food security | 1010 | 942 | 514, 1530 | 73.9 (4.7) | 1.47 ** | 1.15–1.88 | 1.19 | 0.88–1.62 | 0.88 | 0.63–1.23 | |
| Very low food security | 828 | 759 | 387, 1273 | 56.3 (0.7) | 4.10 *** | 2.51–6.68 | 3.12* | 1.07–9.12 | 1.81 | 0.65–5.02 | |
| p < 0.001 | |||||||||||
| Sodium (mg/day) | 0.736 | ||||||||||
| Food security | 4055 | 3608 | 1573, 6713 | 8.8(8.1) | 1.0 | 1.0 | 1.0 | ||||
| Low food security | 3776 | 3384 | 1426, 6171 | 9.5(0.6) | 1.07 | 0.73–1.56 | 1.31 | 0.89–1.94 | 1.38 | 0.92–2.07 | |
| Very low food security | 3151 | 2747 | 1151, 5911 | 17.2(0.2) | 0.61 | 0.31–1.21 | 1.03 | 0.52–2.05 | 0.97 | 0.50–1.88 | |
| p = 0.331 | |||||||||||
| Potassium (mg/day) | 0.278 | ||||||||||
| Food security | 3072 | 2830 | 1534, 4772 | 30.2(27.9) | 1.0 | 1.0 | 1.0 | ||||
| Low food security | 2708 | 2470 | 1304, 4322 | 24.6(1.6) | 1.39 * | 1.08–1.78 | 1.30 | 0.95–1.79 | 1.01 | 0.72–1.40 | |
| Very low food security | 2251 | 2217 | 1015, 3696 | 17.2(0.2) | 2.38 ** | 1.31–4.32 | 1.27 | 0.61–2.65 | 0.90 | 0.43–1.88 | |
| p = 0.009 | |||||||||||
| Iron (mg/day) | 0.106 | ||||||||||
| Food security | 17 | 15 | 8, 28 | 72.1(66.7) | 1.0 | 1.0 | 1.0 | ||||
| Low food security | 16 | 14 | 7, 28 | 69.5(4.4) | 1.16 | 0.92–1.46 | 0.98 | 0.75–1.28 | 0.90 | 0.68–1.19 | |
| Very low food security | 14 | 12 | 5, 24 | 59.8(0.7) | 2.02 ** | 1.24–3.29 | 1.58 | 0.78–3.18 | 1.40 | 0.72–2.75 | |
| p = 0.009 | |||||||||||
| Median | 10th, 90th Percentile | Mean ± SE 1 | p-Value 1 | |
|---|---|---|---|---|
| Mixed grain intake | 0.153 | |||
| Food security | 1.7 | 0, 5.0 | 2.2 ± 0.04 | |
| Low food security | 1.0 | 0, 5.0 | 2.0 ± 0.13 | |
| Very low food security | 0 | 0, 5.0 | 1.8 ± 0.24 | |
| Total fruit intake | 0.195 | |||
| Food security | 1.6 | 0, 5.0 | 2.2 ± 0.04 | |
| Low food security | 0.3 | 0, 5.0 | 1.8 ± 0.11 | |
| Very low food security | 0 | 0, 5.0 | 1.4 ± 0.24 | |
| Fresh fruit intake | 0.081 | |||
| Food security | 2.1 | 0, 5.0 | 2.4 ± 0.04 | |
| Low food security | 0 | 0, 5.0 | 2.0 ± 0.13 | |
| Very low food security | 0 | 0, 5.0 | 1.4 ± 0.27 | |
| Total vegetable intake | 0.822 | |||
| Food security | 3.9 | 1.5, 5.0 | 3.6 ± 0.02 | |
| Low food security | 3.5 | 1.3, 5.0 | 3.4 ± 0.09 | |
| Very low food security | 3.5 | 1.0, 5.0 | 3.2 ± 0.19 | |
| Vegetable intake excluding kimchi and pickled vegetables | 0.528 | |||
| Food security | 3.5 | 1.0, 5.0 | 3.3 ± 0.02 | |
| Low food security | 3.0 | 0.7, 5.0 | 3.1 ± 0.09 | |
| Very low food security | 3.0 | 0.3, 5.0 | 2.9 ± 0.23 | |
| Meat/fish/egg/legume intake | 0.141 | |||
| Food security | 7.8 | 2.4, 10.0 | 7.1 ± 0.05 | |
| Low food security | 7.4 | 1.6, 10.0 | 6.7 ± 0.19 | |
| Very low food security | 5.3 | 0.4, 10.0 | 5.3 ± 0.43 | |
| Milk and dairy products intake | 0.583 | |||
| Food security | 0 | 0, 10.0 | 3.3 ± 0.07 | |
| Low food security | 0 | 0, 10.0 | 2.8 ± 0.24 | |
| Very low food security | 0 | 0, 10.0 | 2.2 ± 0.48 | |
| Having breakfast | <0.001 | |||
| Food security | 6.5 | 0, 10.0 | 6.9 ± 0.07 a | |
| Low food security | 6.1 | 0, 10.0 | 6.4 ± 0.25 ab | |
| Very low food security | 4.5 | 0, 10.0 | 5.6 ± 0.53 b | |
| % of energy from saturated fatty acid | 0.411 | |||
| Food security | 10.0 | 0, 10.0 | 7.8 ± 0.06 | |
| Low food security | 9.9 | 0, 10.0 | 7.8 ± 0.19 | |
| Very low food security | 10.0 | 0, 10.0 | 8.1 ± 0.42 | |
| Sodium intake | 0.650 | |||
| Food security | 6.4 | 0, 10.0 | 5.8 ± 0.05 | |
| Low food security | 6.9 | 0.7, 10.0 | 6.2 ± 0.17 | |
| Very low food security | 8.2 | 1.3, 10.0 | 7.0 ± 0.37 | |
| % of energy from sweets and beverages | 0.080 | |||
| Food security | 10.0 | 6.0, 10.0 | 9.0 ± 0.04 | |
| Low food security | 9.9 | 3.7, 10.0 | 8.8 ± 0.17 | |
| Very low food security | 9.7 | 0, 10.0 | 8.2 ± 0.37 | |
| % of energy from carbohydrate | 0.110 | |||
| Food security | 2.9 | 0, 5.0 | 2.7 ± 0.03 | |
| Low food security | 3.0 | 0, 5.0 | 2.6 ± 0.12 | |
| Very low food security | 0.7 | 0, 5.0 | 2.0 ± 0.25 | |
| % of energy from fat | 0.020 | |||
| Food security | 5.0 | 0, 5.0 | 3.5 ± 0.03 | |
| Low food security | 5.0 | 0, 5.0 | 3.6 ± 0.11 | |
| Very low food security | 4.1 | 0, 5.0 | 2.8 ± 0.25 | |
| Total energy intake | 0.097 | |||
| Food security | 5.0 | 0, 5.0 | 3.4 ± 0.03 | |
| Low food security | 5.0 | 0, 5.0 | 3.2 ± 0.12 | |
| Very low food security | 3.8 | 0, 5.0 | 2.7 ± 0.27 | |
| Total score | <0.001 | |||
| Food security | 63.9 | 47.4, 80.1 | 63.2 ± 0.22 a | |
| Low food security | 60.6 | 44.6, 77.8 | 60.3 ± 0.71 ab | |
| Very low food security | 55.4 | 37.2, 71.2 | 54.6 ± 1.66 b | |
| % Full Score of KHEI 1 | Less than Full Score | % Zero Score of KHEI 2 | Zero Score | |||||||||||
|---|---|---|---|---|---|---|---|---|---|---|---|---|---|---|
| Model 1 3 | Model 2 4 | Model 3 5 | Model 1 3 | Model 2 4 | Model 3 5 | |||||||||
| OR | 95% CI | OR | 95% CI | OR | 95% CI | OR | 95% CI | OR | 95% CI | OR | 95% CI | |||
| Mixed grain intake | (30.9) | (38.5) | ||||||||||||
| Food security | 31.1 (28.8) | 1.0 | 1.0 | 1.0 | 38.3 (35.4) | 1.0 | 1.0 | 1.0 | ||||||
| Low food security | 29.6 (1.9) | 1.21 | 0.93–1.57 | 1.22 | 0.94–1.59 | 1.18 | 0.90–1.56 | 38.7 (2.4) | 1.08 | 0.84–1.38 | 1.11 | 0.86–1.44 | 1.06 | 0.80–1.39 |
| Very low food security | 19.5 (0.2) | 1.73 | 0.92–3.24 | 1.71 | 0.91–3.20 | 1.69 | 0.88–3.21 | 48.3 (0.6) | 1.50 | 0.92–2.44 | 1.54 | 0.93–2.52 | 1.39 | 0.83–2.34 |
| p = 0.093 | p trend = 0.016 | p = 0.265 | p trend = 0.106 | |||||||||||
| Total fruit intake | (29.6) | (31.8) | ||||||||||||
| Food security | 30.2 (27.9) | 1.0 | 1.0 | 1.0 | 31.1 (28.8) | 1.0 | 1.0 | 1.0 | ||||||
| Low food security | 22.8 (1.4) | 1.54 ** | 1.18–2.00 | 1.65 ** | 1.26–2.16 | 1.32 | 1.00–1.75 | 38.1 (2.4) | 1.38 * | 1.07–1.78 | 1.43 ** | 1.10–1.86 | 1.07 | 0.82–1.40 |
| Very low food security | 19.5 (0.2) | 1.66 | 0.90–3.05 | 1.42 | 0.74–2.71 | 0.94 | 0.48–1.83 | 52.9 (0.6) | 2.56 ** | 1.53–4.29 | 2.35 ** | 1.34–4.10 | 1.49 | 0.86–2.58 |
| p = 0.002 | p trend = 0.039 | p < 0.001 | p trend = 0.059 | |||||||||||
| Fresh fruit intake | (42.7) | (42.8) | ||||||||||||
| Food security | 43.3 (40.1) | 1.0 | 1.0 | 1.0 | 42.0 (38.8) | 1.0 | 1.0 | 1.0 | ||||||
| Low food security | 36.5 (2.3) | 1.36 * | 1.07–1.74 | 1.47 ** | 1.14–1.89 | 1.18 | 0.91–1.54 | 50.0 (3.2) | 1.39 ** | 1.10–1.76 | 1.49 ** | 1.16–1.91 | 1.16 | 0.89–1.49 |
| Very low food security | 25.3 (0.3) | 2.04 * | 1.12–3.72 | 1.88 | 0.98–3.61 | 1.34 | 0.68–2.61 | 64.4 (0.8) | 2.34 ** | 1.41–3.86 | 2.28 ** | 1.30–3.97 | 1.55 | 0.88–2.73 |
| p = 0.003 | p trend = 0.043 | p < 0.001 | p trend = 0.020 | |||||||||||
| Total vegetable intake | (34.2) | (0.4) | ||||||||||||
| Food security | 34.5 (31.9) | 1.0 | 1.0 | 1.0 | 0.4 (0.4) | 1.0 | 1.0 | 1.0 | ||||||
| Low food security | 30.5 (1.9) | 1.22 | 0.97–1.55 | 1.14 | 0.88–1.48 | 1.08 | 0.83–1.42 | 0.7 (0.0) | 1.82 | 0.48–6.91 | 1.70 | 0.39–7.37 | 0.99 | 0.17–5.67 |
| Very low food security | 27.6 (0.3) | 1.33 | 0.73–2.40 | 0.95 | 0.49–1.86 | 0.87 | 0.45–1.65 | 2.3 (0.0) | 2.45 | 0.57–10.50 | 1.54 | 0.27–8.70 | 0.92 | 0.14–6.23 |
| p = 0.184 | p trend = 0.465 | p = 0.397 | p trend = 0.645 | |||||||||||
| Vegetable intake excluding kimchi and pickled vegetables | (31.1) | (1.4) | ||||||||||||
| Food security | 31.5 (29.1) | 1.0 | 1.0 | 1.0 | 1.3 (1.2) | 1.0 | 1.0 | 1.0 | ||||||
| Low food security | 25.2 (1.6) | 1.34 * | 1.03–1.73 | 1.27 | 0.96–1.67 | 1.14 | 0.86–1.51 | 1.8 (0.1) | 1.14 | 0.46–2.88 | 1.04 | 0.39–2.77 | 0.66 | 0.21–2.07 |
| Very low food security | 28.7 (0.3) | 1.11 | 0.62–1.99 | 0.81 | 0.43–1.52 | 0.69 | 0.36–1.30 | 3.4 (0.0) | 2.77 | 0.65–11.92 | 1.88 | 0.34–10.37 | 0.99 | 0.21–4.71 |
| p = 0.094 | p trend = 0.739 | p = 0.328 | p trend = 0.799 | |||||||||||
| Meat/fish/egg/legume intake | (34.7) | (0.5) | ||||||||||||
| Food security | 35.3 (32.6) | 1.0 | 1.0 | 1.0 | 0.4 (0.4) | 1.0 | 1.0 | 1.0 | ||||||
| Low food security | 29.0 (1.8) | 1.27 | 1.00–1.61 | 1.12 | 0.84–1.49 | 0.95 | 0.70–1.28 | 1.3 (0.1) | 3.15 * | 1.09–9.16 | 2.96 | 0.94–9.35 | 1.98 | 0.53–7.38 |
| Very low food security | 18.4 (0.2) | 2.79 ** | 1.53–5.09 | 1.67 | 0.80–3.49 | 1.37 | 0.65–2.91 | 3.4 (0.0) | 10.11 ** | 2.21–46.33 | 6.52 * | 1.13–37.53 | 3.39 | 0.90–12.80 |
| p = 0.001 | p trend = 0.123 | p < 0.001 | p trend = 0.054 | |||||||||||
| Milk and dairy products intake | (23.7) | (59.0) | ||||||||||||
| Food security | 24.0 (22.2) | 1.0 | 1.0 | 1.0 | 58.5 (54.1) | 1.0 | 1.0 | 1.0 | ||||||
| Low food security | 20.8 (1.3) | 1.20 | 0.92–1.56 | 1.16 | 0.89–1.51 | 1.00 | 0.76–1.31 | 64.2 (4.1) | 1.35 * | 1.05–1.74 | 1.34 * | 1.04–1.73 | 1.16 | 0.89–1.51 |
| Very low food security | 19.5 (0.2) | 1.64 | 0.89–3.00 | 1.40 | 0.77–2.56 | 1.07 | 0.59–1.95 | 71.3 (0.9) | 2.06 ** | 1.21–3.49 | 1.83 * | 1.07–3.12 | 1.41 | 0.83–2.39 |
| p = 0.119 | p trend = 0.491 | p = 0.002 | p trend = 0.049 | |||||||||||
| Having breakfast | (60.9) | (14.6) | ||||||||||||
| Food security | 61.5 (56.9) | 1.0 | 1.0 | 1.0 | 14.3 (13.2) | 1.0 | 1.0 | 1.0 | ||||||
| Low food security | 56.2 (3.6) | 1.23 | 0.99–1.54 | 1.35 * | 1.06–1.72 | 1.39 * | 1.08–1.80 | 16.6 (1.0) | 1.44 * | 1.07–1.96 | 1.51 ** | 1.12–2.03 | 1.48 * | 1.10–2.00 |
| Very low food security | 41.4 (0.5) | 2.06* | 1.17–3.63 | 2.35 ** | 1.27–4.36 | 2.59 ** | 1.35–4.99 | 29. 9 (0.4) | 1.77 * | 1.07–2.93 | 1.72 | 0.99–2.96 | 1.68 | 0.89–3.18 |
| p = 0.007 | p trend < 0.001 | p = 0.005 | p trend < 0.001 | |||||||||||
| % of energy from saturated fatty acid | (68.9) | (10.4) | ||||||||||||
| Food security | 68.8 (63.6) | 1.0 | 1.0 | 1.0 | 10.3 (9.5) | 1.0 | 1.0 | 1.0 | ||||||
| Low food security | 69.7 (4.4) | 0.95 | 0.76–1.20 | 1.05 | 0.82–1.33 | 1.12 | 0.88–1.43 | 10.6 (0.7) | 0.99 | 0.71–1.38 | 1.09 | 0.78–1.54 | 1.15 | 0.82–1.63 |
| Very low food security | 67.8 (0.8) | 0.95 | 0.50–1.77 | 1.21 | 0.59–2.46 | 1.33 | 0.63–2.81 | 13.8 (0.2) | 1.20 | 0.65–2.22 | 1.53 | 0.77–3.03 | 1.61 | 0.79–3.30 |
| p = 0.919 | p trend = 0.484 | p = 0.862 | p trend = 0.331 | |||||||||||
| Sodium intake | (18.1) | (11.2) | ||||||||||||
| Food security | 17.6 (16.3) | 1.0 | 1.0 | 1.0 | 11.4 (10.5) | 1.0 | 1.0 | 1.0 | ||||||
| Low food security | 21.7 (1.4) | 0.89 | 0.68–1.17 | 1.19 | 0.87–1.62 | 1.42 * | 1.02–1.98 | 9.3 (0.6) | 0.83 | 0.59–1.19 | 0.96 | 0.64–1.45 | 0.98 | 0.64–1.50 |
| Very low food security | 37.9 (0.5) | 0.32 *** | 0.20–0.53 | 0.54 | 0.29–1.03 | 0.70 | 0.38–1.28 | 6.9 (0.1) | 0.557 | 0.25–1.26 | 1.01 | 0.39–2.62 | 1.06 | 0.41–2.75 |
| p < 0.001 | p trend = 0.153 | p = 0.239 | p trend = 0.607 | |||||||||||
| % of energy from sweets and beverages | (79.6) | (3.6) | ||||||||||||
| Food security | 79.8 (73.8) | 1.0 | 1.0 | 1.0 | 3.3 (3.1) | 1.0 | 1.0 | 1.0 | ||||||
| Low food security | 77.9 (4.9) | 1.01 | 0.78–1.31 | 0.99 | 0.76–1.30 | 1.00 | 0.76–1.31 | 6.0 (0.4) | 1.58 | 0.98–2.52 | 1.55 | 0.95–2.52 | 1.55 | 0.95–2.52 |
| Very low food security | 70.1 (0.9) | 1.60 | 0.96–2.67 | 1.45 | 0.87–2.43 | 1.38 | 0.82–2.33 | 10.3 (0.1) | 3.21 ** | 1.55–6.61 | 2.84 ** | 1.45–5.55 | 2.73 ** | 1.32–5.65 |
| p = 0.192 | p trend = 0.204 | p = 0.001 | p trend = 0.002 | |||||||||||
| % of energy from carbohydrate | (29.0) | (27.2) | ||||||||||||
| Food security | 29.3 (27.1) | 1.0 | 1.0 | 1.0 | 26.8 (24.7) | 1.0 | 1.0 | 1.0 | ||||||
| Low food security | 25.7 (1.6) | 1.20 | 0.94–1.54 | 1.16 | 0.91–1.49 | 1.04 | 0.80–1.32 | 30.3 (1.9) | 1.09 | 0.84–1.41 | 1.05 | 0.80–1.36 | 0.89 | 0.68–1.17 |
| Very low food security | 24.1 (0.3) | 1.21 | 0.69–2.11 | 1.09 | 0.63–1.90 | 0.90 | 0.51–1.60 | 43.7 (0.5) | 2.28 ** | 1.46–3.56 | 2.14 ** | 1.38–3.31 | 1.64 * | 1.04–2.57 |
| p = 0.290 | p trend = 0.891 | p = 0.003 | p trend = 0.264 | |||||||||||
| % of energy from fat | (55.3) | (18.6) | ||||||||||||
| Food security | 55.5 (51.4) | 1.0 | 1.0 | 1.0 | 18.3 (16.9) | 1.0 | 1.0 | 1.0 | ||||||
| Low food security | 54.2 (3.4) | 1.02 | 0.80–1.29 | 0.99 | 0.78–1.26 | 0.87 | 0.67–1.13 | 20.1 (1.3) | 0.91 | 0.69–1.19 | 0.88 | 0.67–1.15 | 0.72 * | 0.54–0.97 |
| Very low food security | 43.7 (0.5) | 1.59 | 0.98–2.59 | 1.50 | 0.94–2.40 | 1.21 | 0.75–1.96 | 36.8 (0.4) | 2.82 *** | 1.80–4.42 | 2.68 *** | 1.73–4.13 | 1.93 ** | 1.23–3.02 |
| p = 0.178 | p trend = 0.772 | p < 0.001 | p trend = 0.589 | |||||||||||
| Total energy intake | (55.1) | (21.7) | ||||||||||||
| Food security | 55.4 (51.3) | 1.0 | 1.0 | 1.0 | 21.3 (19.7) | 1.0 | 1.0 | 1.0 | ||||||
| Low food security | 52.4 (3.3) | 1.11 | 0.90–1.38 | 1.12 | 0.90–1.38 | 1.06 | 0.84–1.32 | 24.8 (1.6) | 1.29 | 0.99–1.69 | 1.30 | 0.99–1.70 | 1.20 | 0.91–1.59 |
| Very low food security | 43.7 (0.5) | 1.47 | 0.92–2.36 | 1.49 | 0.93–2.39 | 1.32 | 0.82–2.14 | 33.3 (0.4) | 1.84 * | 1.09–3.12 | 1.87 * | 1.11–3.13 | 1.59 | 0.92–2.74 |
| p = 0.178 | p trend = 0.205 | p = 0.015 | p trend = 0.033 | |||||||||||
Publisher’s Note: MDPI stays neutral with regard to jurisdictional claims in published maps and institutional affiliations. |
© 2021 by the authors. Licensee MDPI, Basel, Switzerland. This article is an open access article distributed under the terms and conditions of the Creative Commons Attribution (CC BY) license (http://creativecommons.org/licenses/by/4.0/).
Share and Cite
Kang, M.G.; Yook, S.-M.; Hwang, J.-Y. Is It What They Eat or How Much They Eat That Matters More in Adults with Food Insecurity in a Wealthy-Country Context? Nutrients 2021, 13, 851. https://doi.org/10.3390/nu13030851
Kang MG, Yook S-M, Hwang J-Y. Is It What They Eat or How Much They Eat That Matters More in Adults with Food Insecurity in a Wealthy-Country Context? Nutrients. 2021; 13(3):851. https://doi.org/10.3390/nu13030851
Chicago/Turabian StyleKang, Min Gyeong, Sung-Min Yook, and Ji-Yun Hwang. 2021. "Is It What They Eat or How Much They Eat That Matters More in Adults with Food Insecurity in a Wealthy-Country Context?" Nutrients 13, no. 3: 851. https://doi.org/10.3390/nu13030851
APA StyleKang, M. G., Yook, S.-M., & Hwang, J.-Y. (2021). Is It What They Eat or How Much They Eat That Matters More in Adults with Food Insecurity in a Wealthy-Country Context? Nutrients, 13(3), 851. https://doi.org/10.3390/nu13030851