
Relationship between Vitamin Intake and Health-Related Quality of Life in a Japanese Population: A Cross-Sectional Analysis of the Shika Study

 , , , , , , , , ,
  and add
Show full author list
and add
Show full author list
Abstract
1. Introduction
2. Materials and Methods
2.1. Participants
2.2. Evaluation of QOL
2.3. Evaluation of Nutritional Intake
2.4. Questionnaire on the Demographics
2.5. Statistical Analysis
3. Results
3.1. Particpant Characteristics
3.2. Differences in Nutritional Intake between High and Low PCS/RCS/MCS Groups by Sex
3.3. Multiple Regression Analysis
4. Discussion
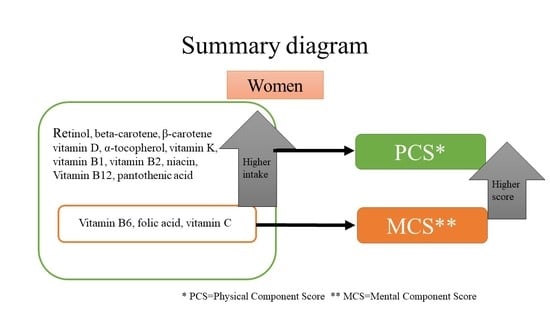
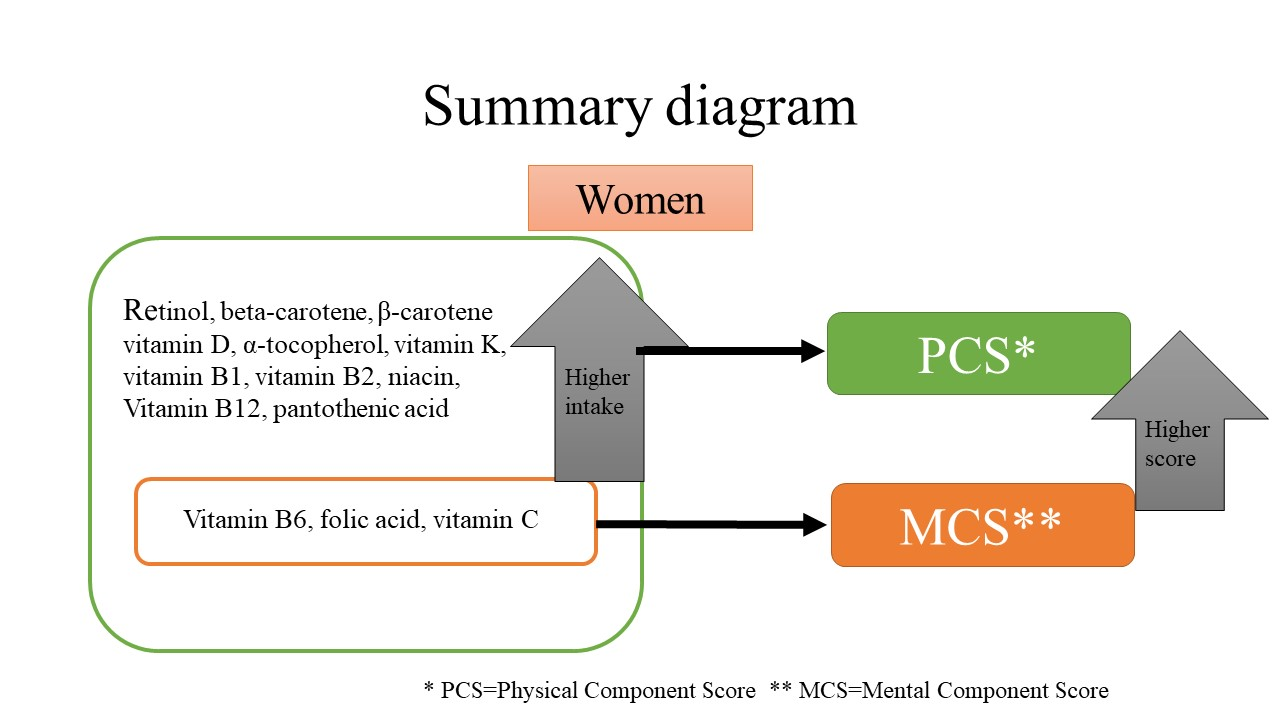
5. Conclusions
Supplementary Materials
Author Contributions
Funding
Institutional Review Board Statement
Informed Consent Statement
Data Availability Statement
Acknowledgments
Conflicts of Interest
References
- United Nations, Department of Economic and Social Affairs. World Population Ageing 2015 (ST/ESA/SER.A/390). 2015. Available online: https://www.un.org/en/development/desa/population/publications/pdf/ageing/WPA2015_Report.pdf (accessed on 1 February 2021).
- WHOQOL. What Quality of Life?/The WHOQOL Group. World Health Forum. 1996. Available online: http://apps.who.int/iris/bitstream/handle/10665/54358/WHF_1996_17%284%29_p354-356 (accessed on 1 February 2021).
- Lee, J.E.; Kim, Y.J.; Park, H.J.; Park, S.; Kim, H.; Kwon, O. Association of recommended food score with depression, anxiety, and quality of life in Korean adults: The 2014–2015 National Fitness Award Project. BMC Public Health 2019, 19, 1–11. [Google Scholar] [CrossRef] [PubMed]
- Sun, W.; Aodeng, S.; Tanimoto, Y.; Watanabe, M.; Han, J.; Wang, B.; Kono, K. Quality of life (QOL) of the community-dwelling elderly and associated factors: A population-based study in urban areas of China. Arch. Gerontol. Geriatr. 2015, 60, 311–316. [Google Scholar] [CrossRef]
- Govindaraju, T.; Sahle, B.W.; McCaffrey, T.A.; McNeil, J.J.; Owen, A.J. Dietary patterns and quality of life in older adults: A systematic review. Nutrients 2018, 10, 971. [Google Scholar] [CrossRef] [PubMed]
- Amarantos, E.; Martinez, A.; Dwyer, J. Nutrition and quality of life in older adults. J. Gerontol. Ser. A Biol. Sci. Med. Sci. 2001. [Google Scholar] [CrossRef]
- Tolmunen, T.; Hintikka, J.; Ruusunen, A.; Voutilainen, S.; Tanskanen, A.; Valkonen, V.P.; Salonen, J.T. Dietary folate and the risk of depression in finnish middle-aged men: A prospective follow-up study. Psychother. Psychosom. 2004, 73, 334–339. [Google Scholar] [CrossRef] [PubMed]
- Li, Z.; Wang, W.; Xin, X.; Song, X.; Zhang, D. Association of total zinc, iron, copper and selenium intakes with depression in the US adults. J. Affect. Disord. 2018, 228, 68–74. [Google Scholar] [CrossRef]
- Tsujiguchi, H.; Nguyen, T.; Goto, D.; Miyagi, S.; Kambayashi, Y.; Hara, A.; Nakamura, H. Relationship between the intake of n-3 polyunsaturated fatty acids and depressive symptoms in elderly japanese people: Differences according to sex and weight status. Nutrients 2019, 11, 755. [Google Scholar] [CrossRef]
- Mitoma, J. Prevalence of Chronic Pain, Especially Headache, and Relationship with Health-Related Quality of Life in Middle-Aged Japanese Residents. Health 2016, 8, 116–124. [Google Scholar] [CrossRef]
- Nguyen, T.T. Relationship between vitamin intake and depressive symptoms in elderly japanese individuals: Differences with gender and body mass index. Nutrients 2017, 9, 1319. [Google Scholar] [CrossRef]
- Fukuhara, S.; Bito, S.; Green, A.; Hsiao, A.; Kurokawa, K. Translation, adaptation, and validation of the SF-36 Health Survey for use in Japan. J. Clin. Epidemiol. 1998, 51, 1037–1044. [Google Scholar] [CrossRef]
- Suzukamo, Y.; Fukuhara, S.; Green, J.; Kosinski, M.; Gandek, B.; Ware, J.E. Validation testing of a three-component model of Short Form-36 scores. J. Clin. Epidemiol. 2011, 64, 301–308. [Google Scholar] [CrossRef]
- Okubo, H.; Sasaki, S.; Rafamantanantsoa, H.H.; Ishikawa-Takata, K.; Okazaki, H.; Tabata, I. Validation of self-reported energy intake by a self-administered diet history questionnaire using the doubly labeled water method in 140 Japanese adults. Eur. J. Clin. Nutr. 2008. [Google Scholar] [CrossRef] [PubMed]
- Kobayashi, S. Comparison of relative validity of food group intakes estimated by comprehensive and brief-type self-administered diet history questionnaires against 16 d dietary records in Japanese adults. Public Health Nutr. 2011, 14, 1200–1211. [Google Scholar] [CrossRef] [PubMed]
- Kobayashi, S. Both comprehensive and brief self-administered diet history questionnaires satisfactorily rank nutrient intakes in Japanese adults. J. Epidemiol. 2012, 22, 151–159. [Google Scholar] [CrossRef]
- Ministry of Health Labour and Welfare of Japan (MHLW). The National Health and Nutrition Survey; MHLW: Tokyo, Japan, 2013.
- Watanabe, T.; Kawai, R. Advances in food composition tables in Japan-Standard Tables of Food Composition in Japan—2015—(Seventh Revised Edition). Food Chem. 2018, 238, 16–21. [Google Scholar] [CrossRef] [PubMed]
- World Health Organization. BMI Classification. Available online: https://www.who.int/news-room/fact-sheets/detail/obesity-and-overweight (accessed on 1 February 2021).
- World Health Organisation. Depression and Other Common Mental Disorders: Global Health Estimates; WHO: Geneva, Switzerland, 2017. [Google Scholar]
- Vos, T. Global, regional, and national incidence, prevalence, and years lived with disability for 310 diseases and injuries, 1990–2015: A systematic analysis for the Global Burden of Disease Study 2015. Lancet 2016, 388, 1545–1602. [Google Scholar] [CrossRef]
- Doraiswamy, P.M.; Khan, Z.M.; Donahue, R.M.J.; Richard, N.E. The spectrum of quality-of-life impair-ments in recurrent geriatric depression. J. Gerontol. A Biol. Sci. Med. Sci. 2002, 57, M134–M137. [Google Scholar] [CrossRef]
- Blazer, D.G. Depression in Late Life: Review and Commentary. J. Gerontol. Ser. A Biol. Sci. Med. Sci. 2003, 58, M249–M265. [Google Scholar] [CrossRef]
- Blazer, D.; Burchett, B.; Service, C.; George, L.K. The Association of Age and Depression among the El-derly: An Epidemiologic Exploration. J. Gerontol. 1991, 46, M210–M215. [Google Scholar] [CrossRef]
- Ra, J.S.; Kim, H.S. Sex-based Association between Depression and Metabolic Syndrome in Korean Middle-aged and Older Adults. Osong Public Health Res. Perspect. 2017, 8, 130–137. [Google Scholar] [CrossRef]
- Guo, J. Depression among Chinese older adults: A perspective from Hukou and health inequities. J. Affect. Disord. 2017, 223, 115–120. [Google Scholar] [CrossRef]
- Sekita, J. Elevated depressive symptoms in metabolic syndrome in a general population of Japanese men: A cross-sectional study. BMC Public Health 2013, 13. [Google Scholar] [CrossRef]
- Mikkelsen, K.; Stojanovska, L.; Apostolopoulos, V. The Effects of Vitamin B in Depression. Curr. Med. Chem. 2016. [Google Scholar] [CrossRef] [PubMed]
- Mikkelsen, K.; Stojanovska, L.; Prakash, M.; Apostolopoulos, V. The effects of vitamin B on the im-mune/cytokine network and their involvement in depression. Maturitas 2017, 96, 58–71. [Google Scholar] [CrossRef]
- Oishi, J.; Doi, H.; Kawakami, N. Nutrition and depressive symptoms in community-dwelling elderly persons in Japan. Acta Med. 2009. [Google Scholar] [CrossRef]
- Nguyen, T.T. Association between lower intake of minerals and depressive symptoms among elderly japanese women but not men: Findings from shika study. Nutrients 2019, 11, 389. [Google Scholar] [CrossRef]
- Gougeon, L.; Payette, H.; Morais, J.A.; Gaudreau, P.; Shatenstein, B.; Gray-Donald, K. Intake of folate, vitamin B6 and B12 and risk of depression in community-dwelling older adults: The Quebec Longitudinal Study on Nutrition and Aging. Eur. J. Clin. Nutr. 2016, 70, 380–385. [Google Scholar] [CrossRef] [PubMed]

| Male (n = 1429) | Female (n = 1733) | p-Value *4 | |
|---|---|---|---|
| Mean (n) ± SD (%) | Mean (n) ± SD (%) | ||
| Age | 63.27 ± 12.24 | 64.54 ± 13.11 | 0.005 |
| Without working/volunteer | 802 (57.33%) | 1057 (62.18%) | 0.006 |
| Living alone | 105 (7.41%) | 178 (10.41%) | 0.003 |
| Education (year) | 11.84 ± 3.00 | 11.42 ± 2.55 | 0.000 |
| Without exercise/hobby | 832 (59.86%) | 1113 (66.73%) | 0.000 |
| Smoking | 460 (32.53%) | 110 (6.46%) | 0.000 |
| Alcohol intake | 1090 (80.5%) | 847 (56.39%) | 0.000 |
| Overweight/obesity | 415 (29.04%) | 349 (20.14%) | 0.000 |
| Diabetes treatment | 146 (10.22%) | 106 (6.12%) | 0.000 |
| Hyperlipidemia treatment | 132 (9.24%) | 242 (13.96%) | 0.000 |
| Hypertension treatment | 428 (29.95%) | 431 (24.87%) | 0.001 |
| PCS *1 | 45.97 ± 12.41 | 42.92 ± 14.78 | 0.000 |
| MCS *2 | 51.3 ± 9.72 | 51.77 ± 9.91 | NS |
| RCS *3 | 49.8 ± 12.27 | 48.27 ± 13.14 | 0.001 |
| Energy (kcal/day) | 2013.84 ± 617.89 | 1641 ± 517.08 | 0.000 |
| Protein (% energy) | 14.60 ± 3.19 | 15.69 ± 3.12 | 0.000 |
| Carbohydrate (% energy) | 53.43 ± 9.31 | 55.68 ± 8.17 | 0.000 |
| Lipid (% energy) | 23.41 ± 5.91 | 26.03 ± 5.87 | 0.000 |
| Retinol (μg/1000 kcal) | 212.1 ± 326.66 | 182.48 ± 124.39 | 0.001 |
| β carotene (μg/1000 kcal) | 1521.44 ± 1070.95 | 2108.19 ± 1427.03 | 0.000 |
| Retinol equivalent (μg/1000 kcal) | 340.7 ± 341.88 | 360.01 ± 182.18 | NS |
| Vitamin D (μg/1000 kcal) | 8.15 ± 5.16 | 8.77 ± 5.17 | 0.001 |
| α tocopherol (mg/1000 kcal) | 3.48 ± 0.99 | 4.04 ± 1.10 | 0.000 |
| Vitamin K (μg/1000 kcal) | 141.28 ± 80.57 | 170.49 ± 100.35 | 0.000 |
| Vitamin B1 (mg/1000 kcal) | 0.37 ± 0.09 | 0.43 ± 0.10 | 0.000 |
| Vitamin B2 (mg/1000 kcal) | 0.63 ± 0.20 | 0.7 ± 0.20 | 0.000 |
| Niacin (mg/1000 kcal) | 9.07 ± 2.74 | 9.55 ± 2.73 | 0.000 |
| Vitamin B6 (mg/1000 kcal) | 0.65 ± 0.18 | 0.71 ± 0.19 | 0.000 |
| Vitamin B12 (μg/1000 kcal) | 5.71 ± 3.16 | 5.86 ± 2.97 | NS |
| Folic acid (μg/1000 kcal) | 156.53 ± 63.21 | 179.96 ± 72.82 | 0.000 |
| Pantothenic acid (mg/1000 kcal) | 3.2 ± 0.72 | 3.55 ± 0.75 | 0.000 |
| Vitamin C (mg/1000 kcal) | 48.23 ± 26.73 | 62.81 ± 31.90 | 0.000 |
| Male | Female | |||||
|---|---|---|---|---|---|---|
| Lower Score Group (n = 679) | Higher Score Group (n = 546) | p-Value * | Lower Score Group (n = 807) | Higher Score Group (n = 524) | p-Value * | |
| Mean ± SD | Mean ± SD | Mean ± SD | Mean ± SD | |||
| Retinol (μg/1000 kcal) | 203.74 ± 205.7 | 225.98 ± 465.23 | NS | 177.52 ± 107.46 | 189.52 ± 137.59 | 0.003 |
| β-carotene (μg/1000 kcal) | 1580.84 ± 1030.95 | 1418.43 ± 1028.89 | NS | 2074.99 ± 1357.10 | 2072.09 ± 1427.63 | NS |
| Retinol equivalent (μg/1000 kcal) | 337.26 ± 224.24 | 345.98 ± 476.6 | NS | 352.28 ± 169.28 | 364.14 ± 189.46 | 0.005 |
| Vitamin D (μg/1000 kcal) | 8.23 ± 5.02 | 7.93 ± 5.13 | NS | 8.70 ± 4.89 | 8.63 ± 5.41 | NS |
| α-tocopherol (mg/1000 kcal) | 3.51 ± 1.01 | 3.42 ± 0.95 | NS | 4.01 ± 1.05 | 4.08 ± 1.09 | NS |
| Vitamin K (μg/1000 kcal) | 145.59 ± 83.69 | 136.25 ± 79.45 | NS | 165.87 ± 97.92 | 175.22 ± 100.72 | 0.018 |
| Vitamin B1 (mg/1000 kcal) | 0.37 ± 0.09 | 0.36 ± 0.09 | NS | 0.42 ± 0.10 | 0.43 ± 0.10 | NS |
| Vitamin B2 (mg/1000 kcal) | 0.64 ± 0.19 | 0.62 ± 0.21 | NS | 0.69 ± 0.20 | 0.72 ± 0.19 | 0.007 |
| Niacin (mg/1000 kcal) | 8.98 ± 2.71 | 9.19 ± 2.67 | NS | 9.36 ± 2.69 | 10.00 ± 2.77 | 0.016 |
| Vitamin B6 (mg/1000 kcal) | 0.66 ± 0.18 | 0.64 ± 0.17 | NS | 0.7 ± 0.19 | 0.72 ± 0.20 | 0.023 |
| Vitamin B12 (μg/1000 kcal) | 5.77 ± 3.13 | 5.63 ± 3.14 | NS | 5.82 ± 2.84 | 5.91 ± 3.12 | 0.036 |
| Folic acid (μg/1000 kcal) | 159.44 ± 59.3 | 152.29 ± 67.31 | NS | 176 ± 70.56 | 182.08 ± 71.93 | 0.006 |
| Pantothenic acid (mg/1000 kcal) | 3.21 ± 0.71 | 3.15 ± 0.74 | NS | 3.53 ± 0.75 | 3.59 ± 0.74 | 0.008 |
| Vitamin C (mg/1000 kcal) | 49.53 ± 25.66 | 45.23 ± 25.89 | NS | 61.22 ± 30.51 | 61.9 ± 32.57 | 0.011 |
| Male | Female | |||||
|---|---|---|---|---|---|---|
| Lower Score Group (n = 679) | Higher Score Group (n = 546) | p-Value * | Lower Score Group (n = 807) | Higher Score Group (n = 524) | p-Value * | |
| Mean ± SD | Mean ± SD | Mean ± SD | Mean ± SD | |||
| Retinol (μg/1000 kcal) | 197.80 ± 207.59 | 226.52 ± 426.76 | NS | 181.54 ± 121.07 | 182.79 ± 119.81 | NS |
| β-carotene (μg/1000 kcal) | 1407.09 ± 921.17 | 1590.77 ± 1109.10 | NS | 1973.83 ± 1379.04 | 2150.87 ± 1385.15 | NS |
| Retinol equivalent (μg/1000 kcal) | 316.86 ± 223.56 | 360.87 ± 438.75 | NS | 347.86 ± 180.59 | 363.95 ± 174.92 | NS |
| Vitamin D (μg/1000 kcal) | 7.89 ± 4.76 | 8.25 ± 5.31 | NS | 8.24 ± 4.59 | 9.01 ± 5.43 | NS |
| α-tocopherol (mg/1000 kcal) | 3.40 ± 0.94 | 3.53 ± 1.02 | NS | 3.98 ± 1.03 | 4.08 ± 1.10 | NS |
| Vitamin K (μg/1000 kcal) | 131.33 ± 74.03 | 149.62 ± 87.01 | NS | 161.77 ± 90.86 | 175.54 ± 104.67 | NS |
| Vitamin B1 (mg/1000 kcal) | 0.36 ± 0.08 | 0.37 ± 0.09 | NS | 0.42 ± 0.10 | 0.43 ± 0.10 | NS |
| Vitamin B2 (mg/1000 kcal) | 0.60 ± 0.18 | 0.65 ± 0.21 | 0.045 | 0.69 ± 0.18 | 0.71 ± 0.21 | NS |
| Niacin (mg/1000 kcal) | 8.99 ± 2.63 | 9.14 ± 2.74 | NS | 9.45 ± 2.55 | 9.74 ± 2.87 | 0.021 |
| Vitamin B6 (mg/1000 kcal) | 0.63 ± 0.17 | 0.66 ± 0.18 | NS | 0.69 ± 0.18 | 0.72 ± 0.20 | 0.026 |
| Vitamin B12 (μg/1000 kcal) | 5.58 ± 3.04 | 5.81 ± 3.21 | NS | 5.67 ± 2.82 | 6.00 ± 3.04 | NS |
| Folic acid (μg/1000 kcal) | 147.81 ± 52.44 | 163.12 ± 69.83 | NS | 171.98 ± 66.31 | 183.33 ± 74.31 | NS |
| Pantothenic acid (mg/1000 kcal) | 3.10 ± 0.66 | 3.25 ± 0.77 | NS | 3.49 ± 0.68 | 3.60 ± 0.79 | NS |
| Vitamin C (mg/1000 kcal) | 44.42 ± 22.85 | 50.21 ± 27.78 | NS | 58.03 ± 28.31 | 64.15 ± 33.24 | NS |
| Male | Female | |||||
|---|---|---|---|---|---|---|
| Lower Score Group (n = 679) | Higher Score Group (n = 546) | p-Value * | Lower Score Group (n = 807) | Higher Score Group (n = 524) | p-Value * | |
| Mean ± SD | Mean ± SD | Mean ± SD | Mean ± SD | |||
| Retinol (μg/1000 kcal) | 227.75 ± 246.40 | 205.83 ± 390.80 | NS | 188.54 ± 140.43 | 177.86 ± 103.88 | NS |
| β-carotene (μg/1000 kcal) | 1573.28 ± 1085.15 | 1472.50 ± 1001.45 | NS | 2151.84 ± 1430.59 | 2019.44 ± 1350.13 | NS |
| Retinol equivalent(μg/1000 kcal) | 360.60 ± 263.04 | 330.36 ± 402.48 | NS | 369.65 ± 196.31 | 348.08 ± 162.68 | NS |
| Vitamin D (μg/1000 kcal) | 8.63 ± 5.30 | 7.80 ± 4.92 | NS | 8.83 ± 5.53 | 8.57 ± 4.78 | NS |
| α-tocopherol (mg/1000 kcal) | 3.52 ± 1.02 | 3.44 ± 0.97 | NS | 4.02 ± 1.11 | 4.04 ± 1.03 | NS |
| Vitamin K (μg/1000 kcal) | 147.86 ± 81.48 | 137.86 ± 82.00 | NS | 171.61 ± 101.90 | 168.12 ± 97.14 | NS |
| Vitamin B1 (mg/1000 kcal) | 0.37 ± 0.09 | 0.36 ± 0.09 | NS | 0.42 ± 0.10 | 0.43 ± 0.10 | NS |
| Vitamin B2 (mg/1000 kcal) | 0.65 ± 0.19 | 0.62 ± 0.20 | NS | 0.70 ± 0.20 | 0.7 ± 0.19 | NS |
| Niacin (mg/1000 kcal) | 9.08 ± 2.64 | 9.07 ± 2.72 | NS | 9.38 ± 2.86 | 9.77 ± 2.64 | NS |
| Vitamin B6 (mg/1000 kcal) | 0.66 ± 0.18 | 0.64 ± 0.17 | NS | 0.71 ± 0.20 | 0.71 ± 0.19 | NS |
| Vitamin B12 (μg/1000 kcal) | 5.98 ± 3.22 | 5.56 ± 3.08 | NS | 5.87 ± 3.14 | 5.84 ± 2.81 | NS |
| Folic acid (μg/1000 kcal) | 160.76 ± 61.00 | 153.76 ± 64.09 | NS | 180.70 ± 73.41 | 176.78 ± 69.51 | NS |
| Pantothenic acid (mg/1000 kcal) | 3.26 ± 0.72 | 3.14 ± 0.73 | NS | 3.55 ± 0.75 | 3.55 ± 0.74 | NS |
| Vitamin C (mg/1000 kcal) | 50.25 ± 28.43 | 46.15 ± 24.18 | NS | 63.49 ± 32.71 | 60.09 ± 30.27 | NS |
| Male | Female | |||||||
|---|---|---|---|---|---|---|---|---|
| Standardized Coefficient | 95% CI | p-Value * | Standardized Coefficient | 95% CI | p-Value * | |||
| β | Lower | Upper | β | Lower | Upper | |||
| Retinol (μg/1000 kcal) | 0.036 | 0.000 | 0.003 | NS | 0.059 | 0.002 | 0.012 | 0.010 |
| β-carotene (μg/1000 kcal) | 0.040 | 0.000 | 0.001 | NS | 0.081 | 0.000 | 0.001 | 0.000 |
| Retinol equivalent (μg/1000 kcal) | 0.044 | 0.000 | 0.003 | NS | 0.093 | 0.004 | 0.011 | 0.000 |
| Vitamin D (μg/1000 kcal) | 0.022 | −0.068 | 0.173 | NS | 0.075 | 0.083 | 0.333 | 0.001 |
| α-tocopherol (mg/1000 kcal) | 0.008 | −0.529 | 0.717 | NS | 0.077 | 0.422 | 1.620 | 0.001 |
| Vitamin K (μg/1000 kcal) | 0.048 | 0.000 | 0.015 | NS | 0.108 | 0.009 | 0.022 | 0.000 |
| Vitamin B1(mg/1000 kcal) | −0.007 | −7.937 | 5.993 | NS | 0.082 | 5.162 | 18.057 | 0.000 |
| Vitamin B2(mg/1000 kcal) | 0.025 | −1.630 | 4.659 | NS | 0.119 | 5.282 | 11.749 | 0.000 |
| Niacin (mg/1000 kcal) | 0.027 | −0.100 | 0.345 | NS | 0.084 | 0.199 | 0.664 | 0.000 |
| Vitamin B6 (mg/1000 kcal) | 0.032 | −1.356 | 5.714 | NS | 0.098 | 3.839 | 10.492 | 0.000 |
| Vitamin B12 (μg/1000 kcal) | 0.010 | −0.156 | 0.231 | NS | 0.078 | 0.161 | 0.588 | 0.001 |
| Folic acid (μg/1000 kcal) | 0.061 | 0.002 | 0.022 | NS | 0.127 | 0.016 | 0.034 | 0.000 |
| Pantothenic acid (mg/1000 kcal) | 0.031 | −0.337 | 1.386 | NS | 0.108 | 1.190 | 2.914 | 0.000 |
| Vitamin C (mg/1000 kcal) | 0.053 | 0.000 | 0.049 | NS | 0.120 | 0.033 | 0.075 | 0.000 |
| Male | Female | |||||||
|---|---|---|---|---|---|---|---|---|
| Standardized Coefficient | 95% CI | p-Value * | Standardized Coefficient | 95% CI | p-Value * | |||
| β | Lower | Upper | β | Lower | Upper | |||
| Retinol (μg/1000 kcal) | 0.012 | −0.001 | 0.002 | NS | 0.026 | −0.002 | 0.006 | NS |
| β-carotene (μg/1000 kcal) | 0.061 | 0.000 | 0.001 | NS | 0.064 | 0.000 | 0.001 | NS |
| Retinol equivalent (μg/1000 kcal) | 0.025 | −0.001 | 0.002 | NS | 0.059 | 0.000 | 0.006 | NS |
| Vitamin D (μg/1000 kcal) | −0.006 | −0.117 | 0.094 | NS | 0.066 | 0.027 | 0.225 | NS |
| α-tocopherol (mg/1000 kcal) | 0.036 | −0.189 | 0.904 | NS | 0.064 | 0.109 | 1.057 | NS |
| Vitamin K (μg/1000 kcal) | 0.076 | 0.002 | 0.016 | NS | 0.075 | 0.002 | 0.012 | NS |
| Vitamin B1 (mg/1000 kcal) | 0.029 | −3.021 | 9.199 | NS | 0.065 | 1.214 | 11.435 | NS |
| Vitamin B2 (mg/1000 kcal) | 0.045 | −0.530 | 4.985 | NS | 0.054 | 0.096 | 5.252 | NS |
| Niacin (mg/1000 kcal) | 0.035 | −0.070 | 0.320 | NS | 0.071 | 0.067 | 0.435 | NS |
| Vitamin B6 (mg/1000 kcal) | 0.033 | −1.258 | 4.946 | NS | 0.085 | 1.607 | 6.882 | 0.002 |
| Vitamin B12 (μg/1000 kcal) | −0.009 | −0.197 | 0.143 | NS | 0.051 | −0.003 | 0.336 | NS |
| Folic acid (μg/1000 kcal) | 0.068 | 0.002 | 0.019 | NS | 0.081 | 0.004 | 0.018 | 0.003 |
| Pantothenic acid (mg/1000 kcal) | 0.050 | −0.089 | 1.422 | NS | 0.068 | 0.201 | 1.572 | NS |
| Vitamin C (mg/1000 kcal) | 0.042 | −0.006 | 0.038 | NS | 0.087 | 0.010 | 0.044 | 0.001 |
Publisher’s Note: MDPI stays neutral with regard to jurisdictional claims in published maps and institutional affiliations. |
© 2021 by the authors. Licensee MDPI, Basel, Switzerland. This article is an open access article distributed under the terms and conditions of the Creative Commons Attribution (CC BY) license (http://creativecommons.org/licenses/by/4.0/).
Share and Cite
Narukawa, N.; Tsujiguchi, H.; Hara, A.; Miyagi, S.; Kannon, T.; Suzuki, K.; Shimizu, Y.; Nguyen, T.T.T.; Pham, K.O.; Suzuki, F.; et al. Relationship between Vitamin Intake and Health-Related Quality of Life in a Japanese Population: A Cross-Sectional Analysis of the Shika Study. Nutrients 2021, 13, 1023. https://doi.org/10.3390/nu13031023
Narukawa N, Tsujiguchi H, Hara A, Miyagi S, Kannon T, Suzuki K, Shimizu Y, Nguyen TTT, Pham KO, Suzuki F, et al. Relationship between Vitamin Intake and Health-Related Quality of Life in a Japanese Population: A Cross-Sectional Analysis of the Shika Study. Nutrients. 2021; 13(3):1023. https://doi.org/10.3390/nu13031023
Chicago/Turabian StyleNarukawa, Nobuhiko, Hiromasa Tsujiguchi, Akinori Hara, Sakae Miyagi, Takayuki Kannon, Keita Suzuki, Yukari Shimizu, Thao Thi Thu Nguyen, Kim Oanh Pham, Fumihiko Suzuki, and et al. 2021. "Relationship between Vitamin Intake and Health-Related Quality of Life in a Japanese Population: A Cross-Sectional Analysis of the Shika Study" Nutrients 13, no. 3: 1023. https://doi.org/10.3390/nu13031023
APA StyleNarukawa, N., Tsujiguchi, H., Hara, A., Miyagi, S., Kannon, T., Suzuki, K., Shimizu, Y., Nguyen, T. T. T., Pham, K. O., Suzuki, F., Asai, A., Amatsu, T., Kasahara, T., Miyagi, M., Nakamura, M., Yamada, Y., Nakamura, H., Hayashi, K., Hamagishi, T., ... Nakamura, H. (2021). Relationship between Vitamin Intake and Health-Related Quality of Life in a Japanese Population: A Cross-Sectional Analysis of the Shika Study. Nutrients, 13(3), 1023. https://doi.org/10.3390/nu13031023