
Assessing Overall Diet Quality: Development and Evaluation of the Performance of a Short Self-Administrated Questionnaire SCASA

 , ,
, , 
Abstract
1. Introduction
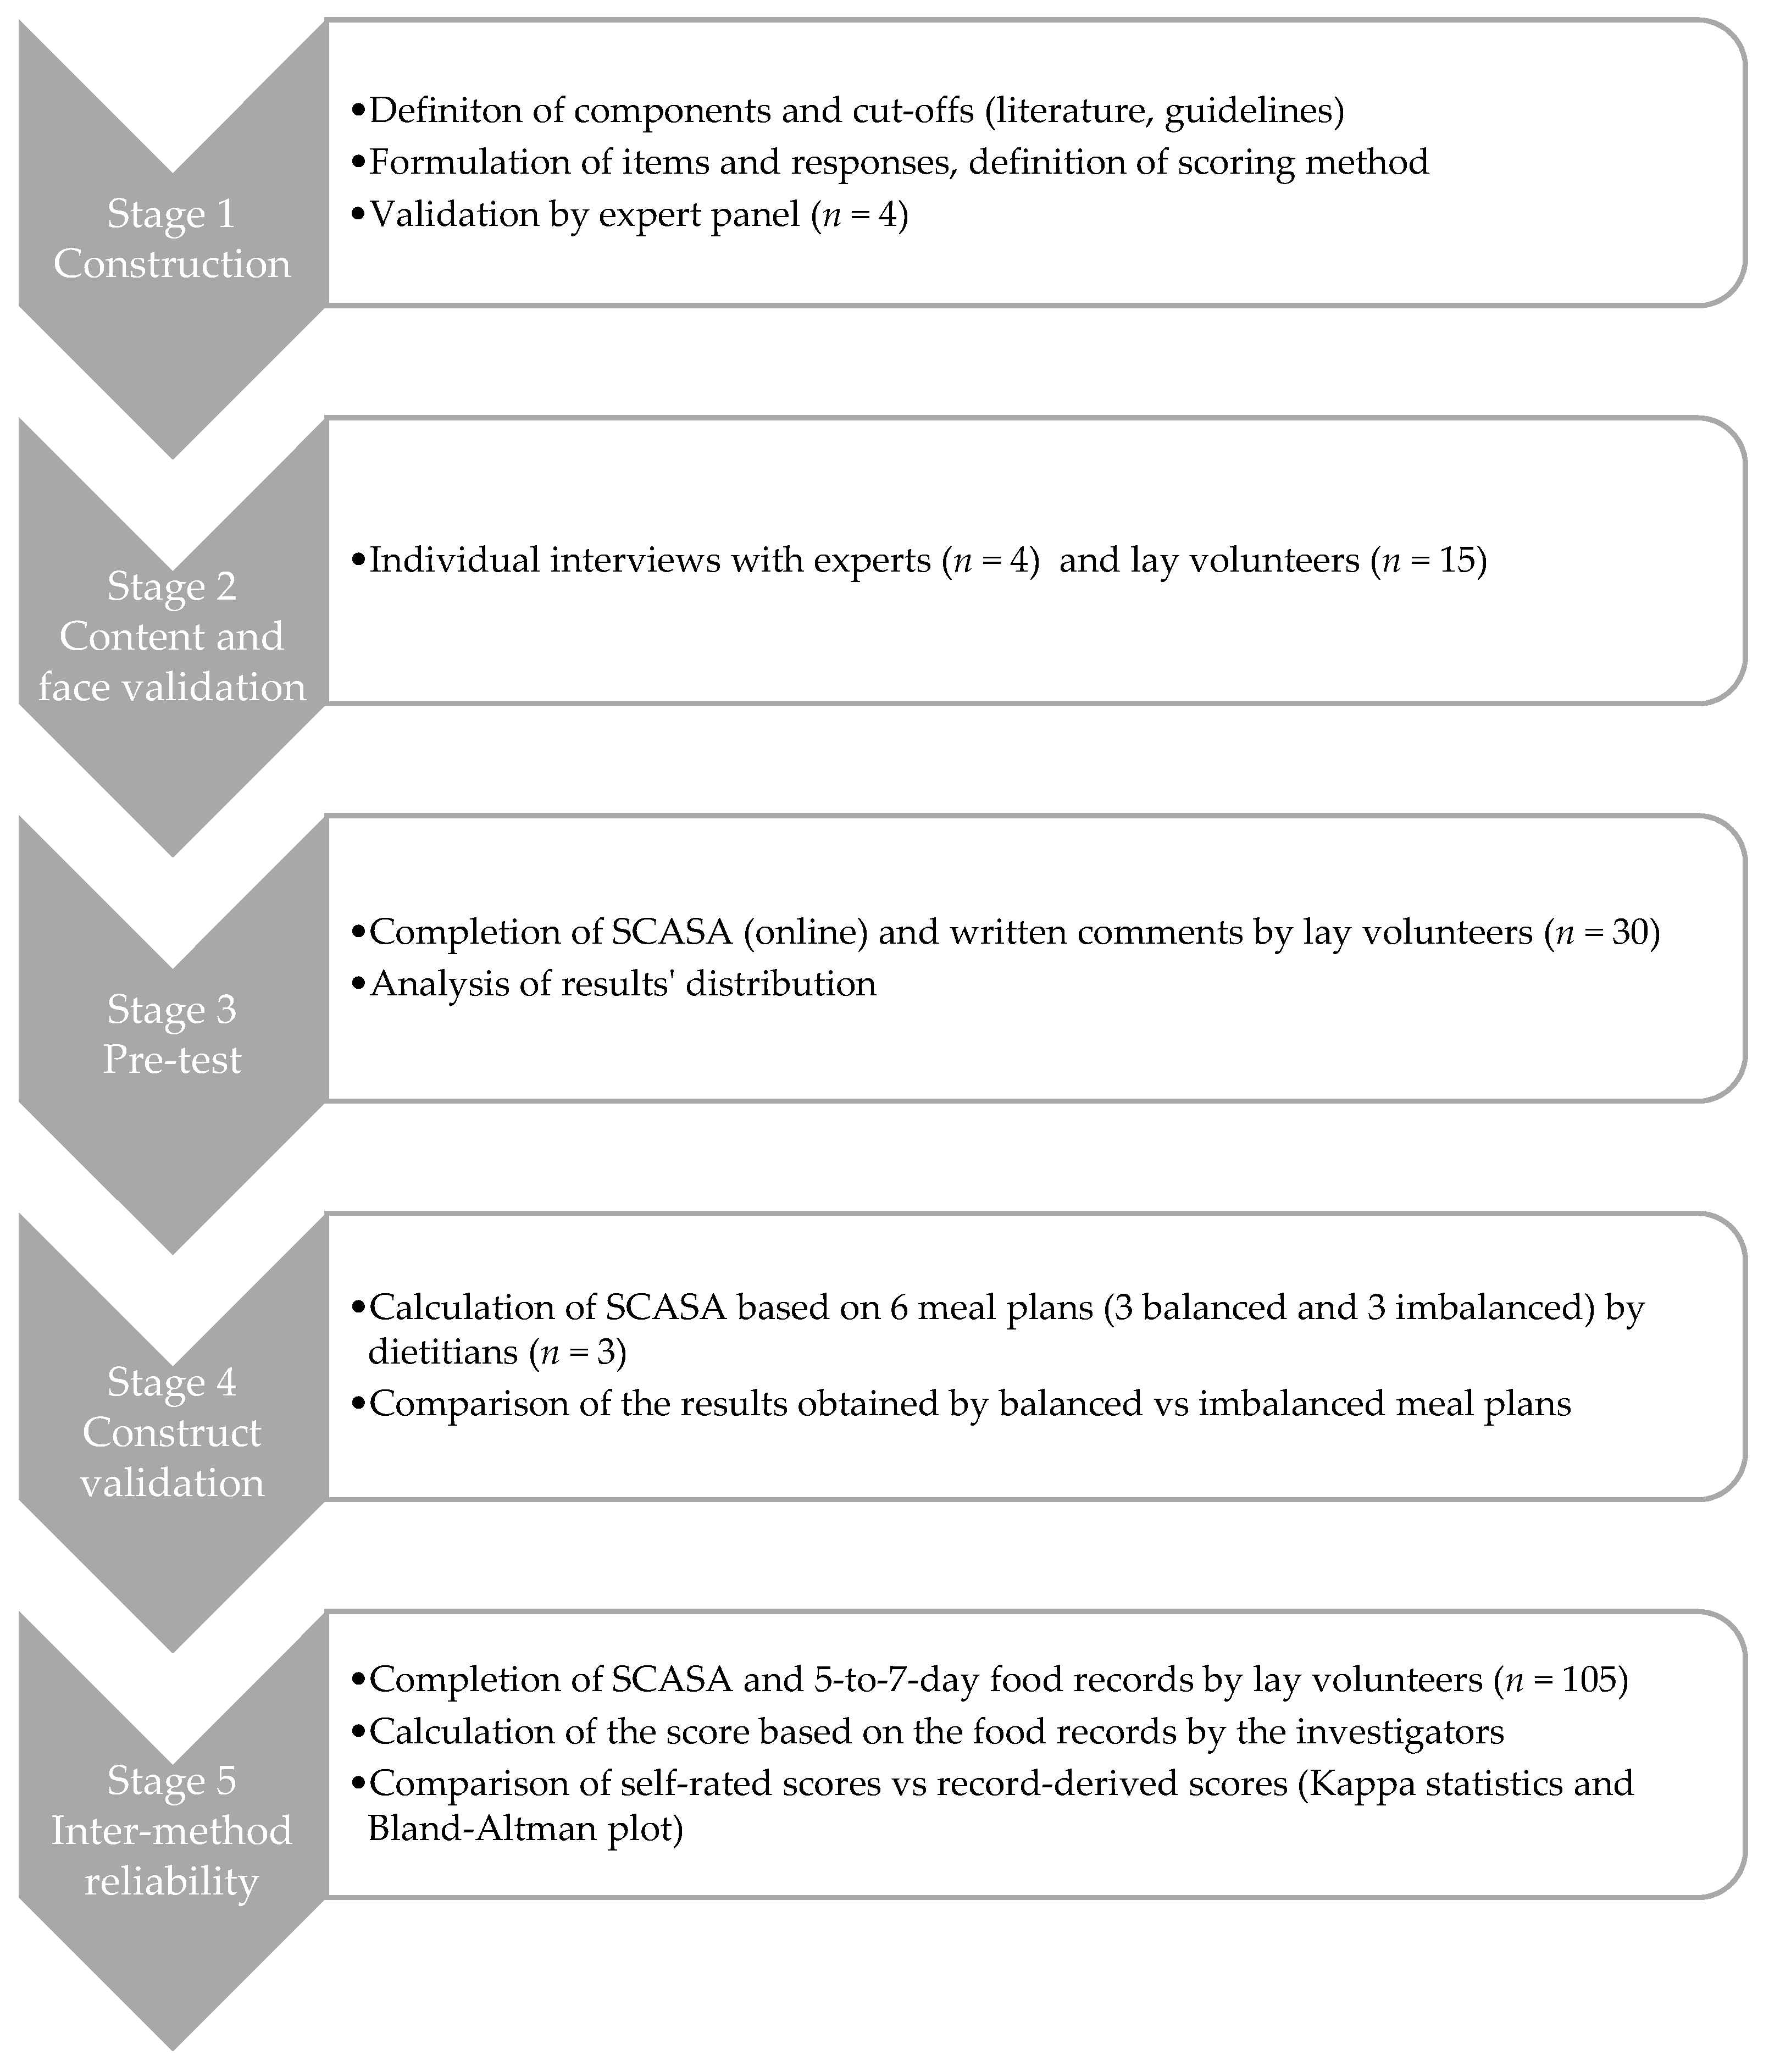
2. Materials and Methods
2.1. Stage 1: Construction of SCASA
2.2. Stage 2: Content and Face Validation
2.3. Stage 3: Pre-Test and Internal Consistency Assessment
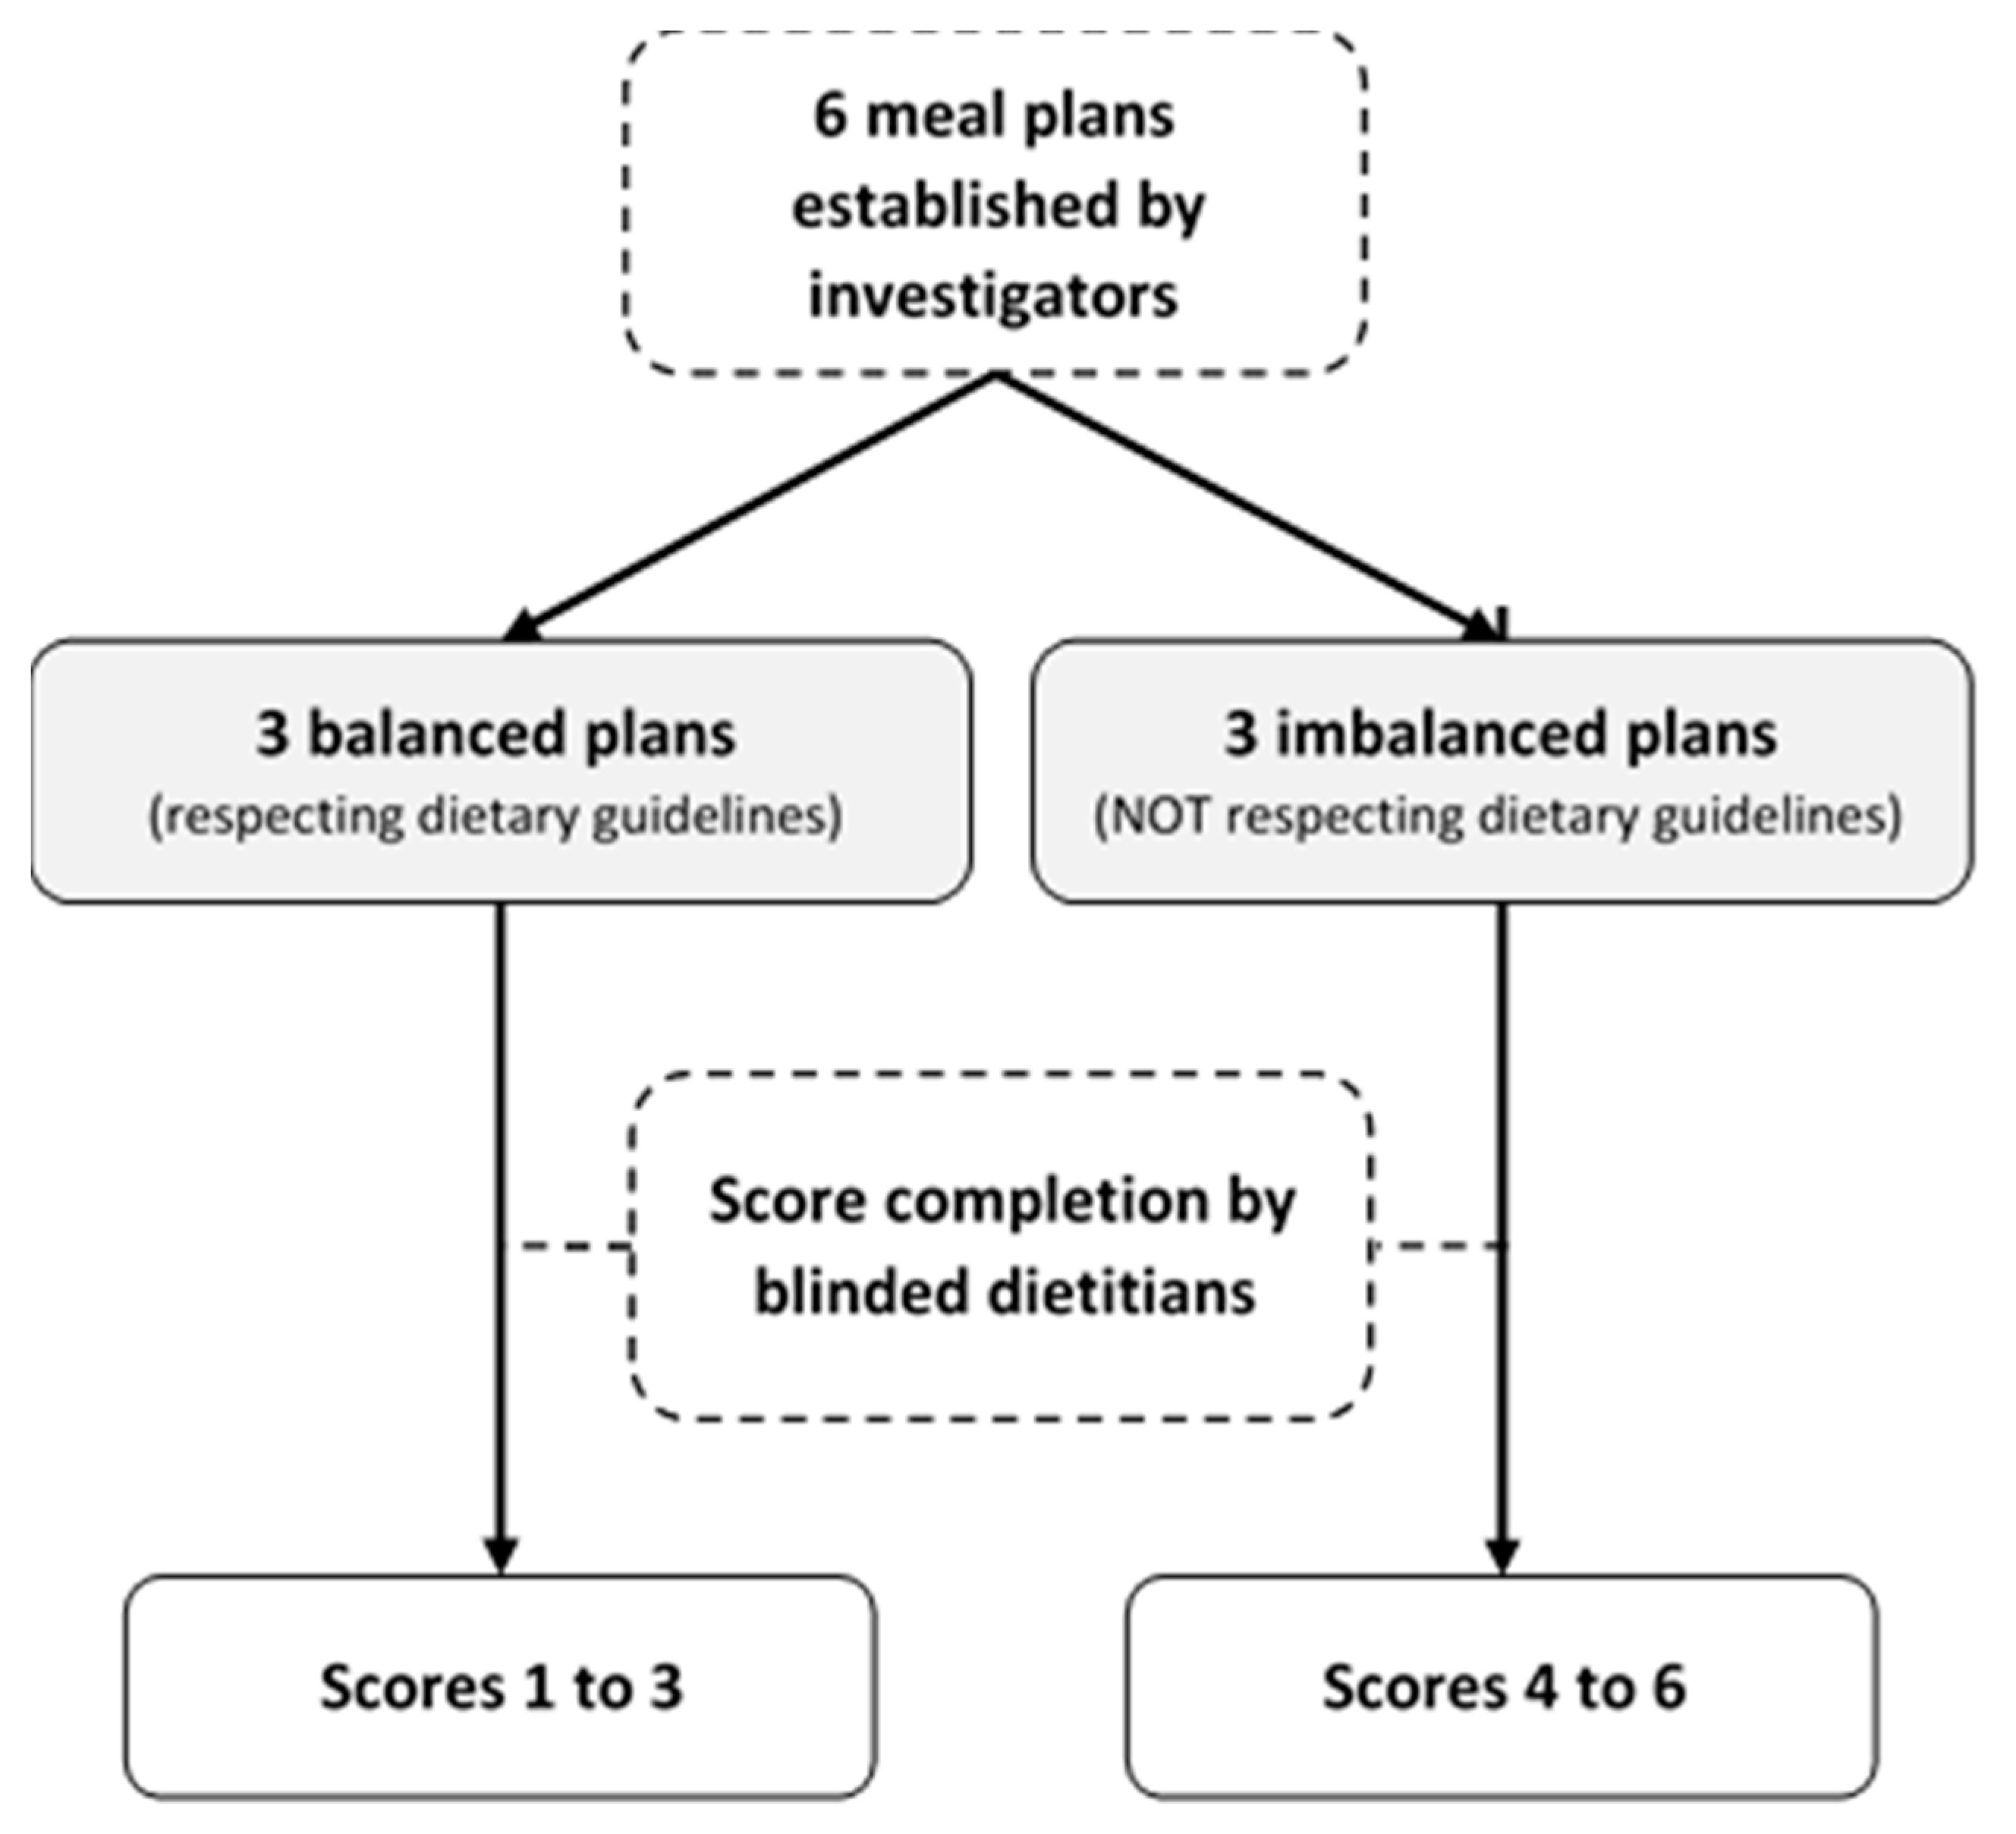
2.4. Stage 4: Construct Validation
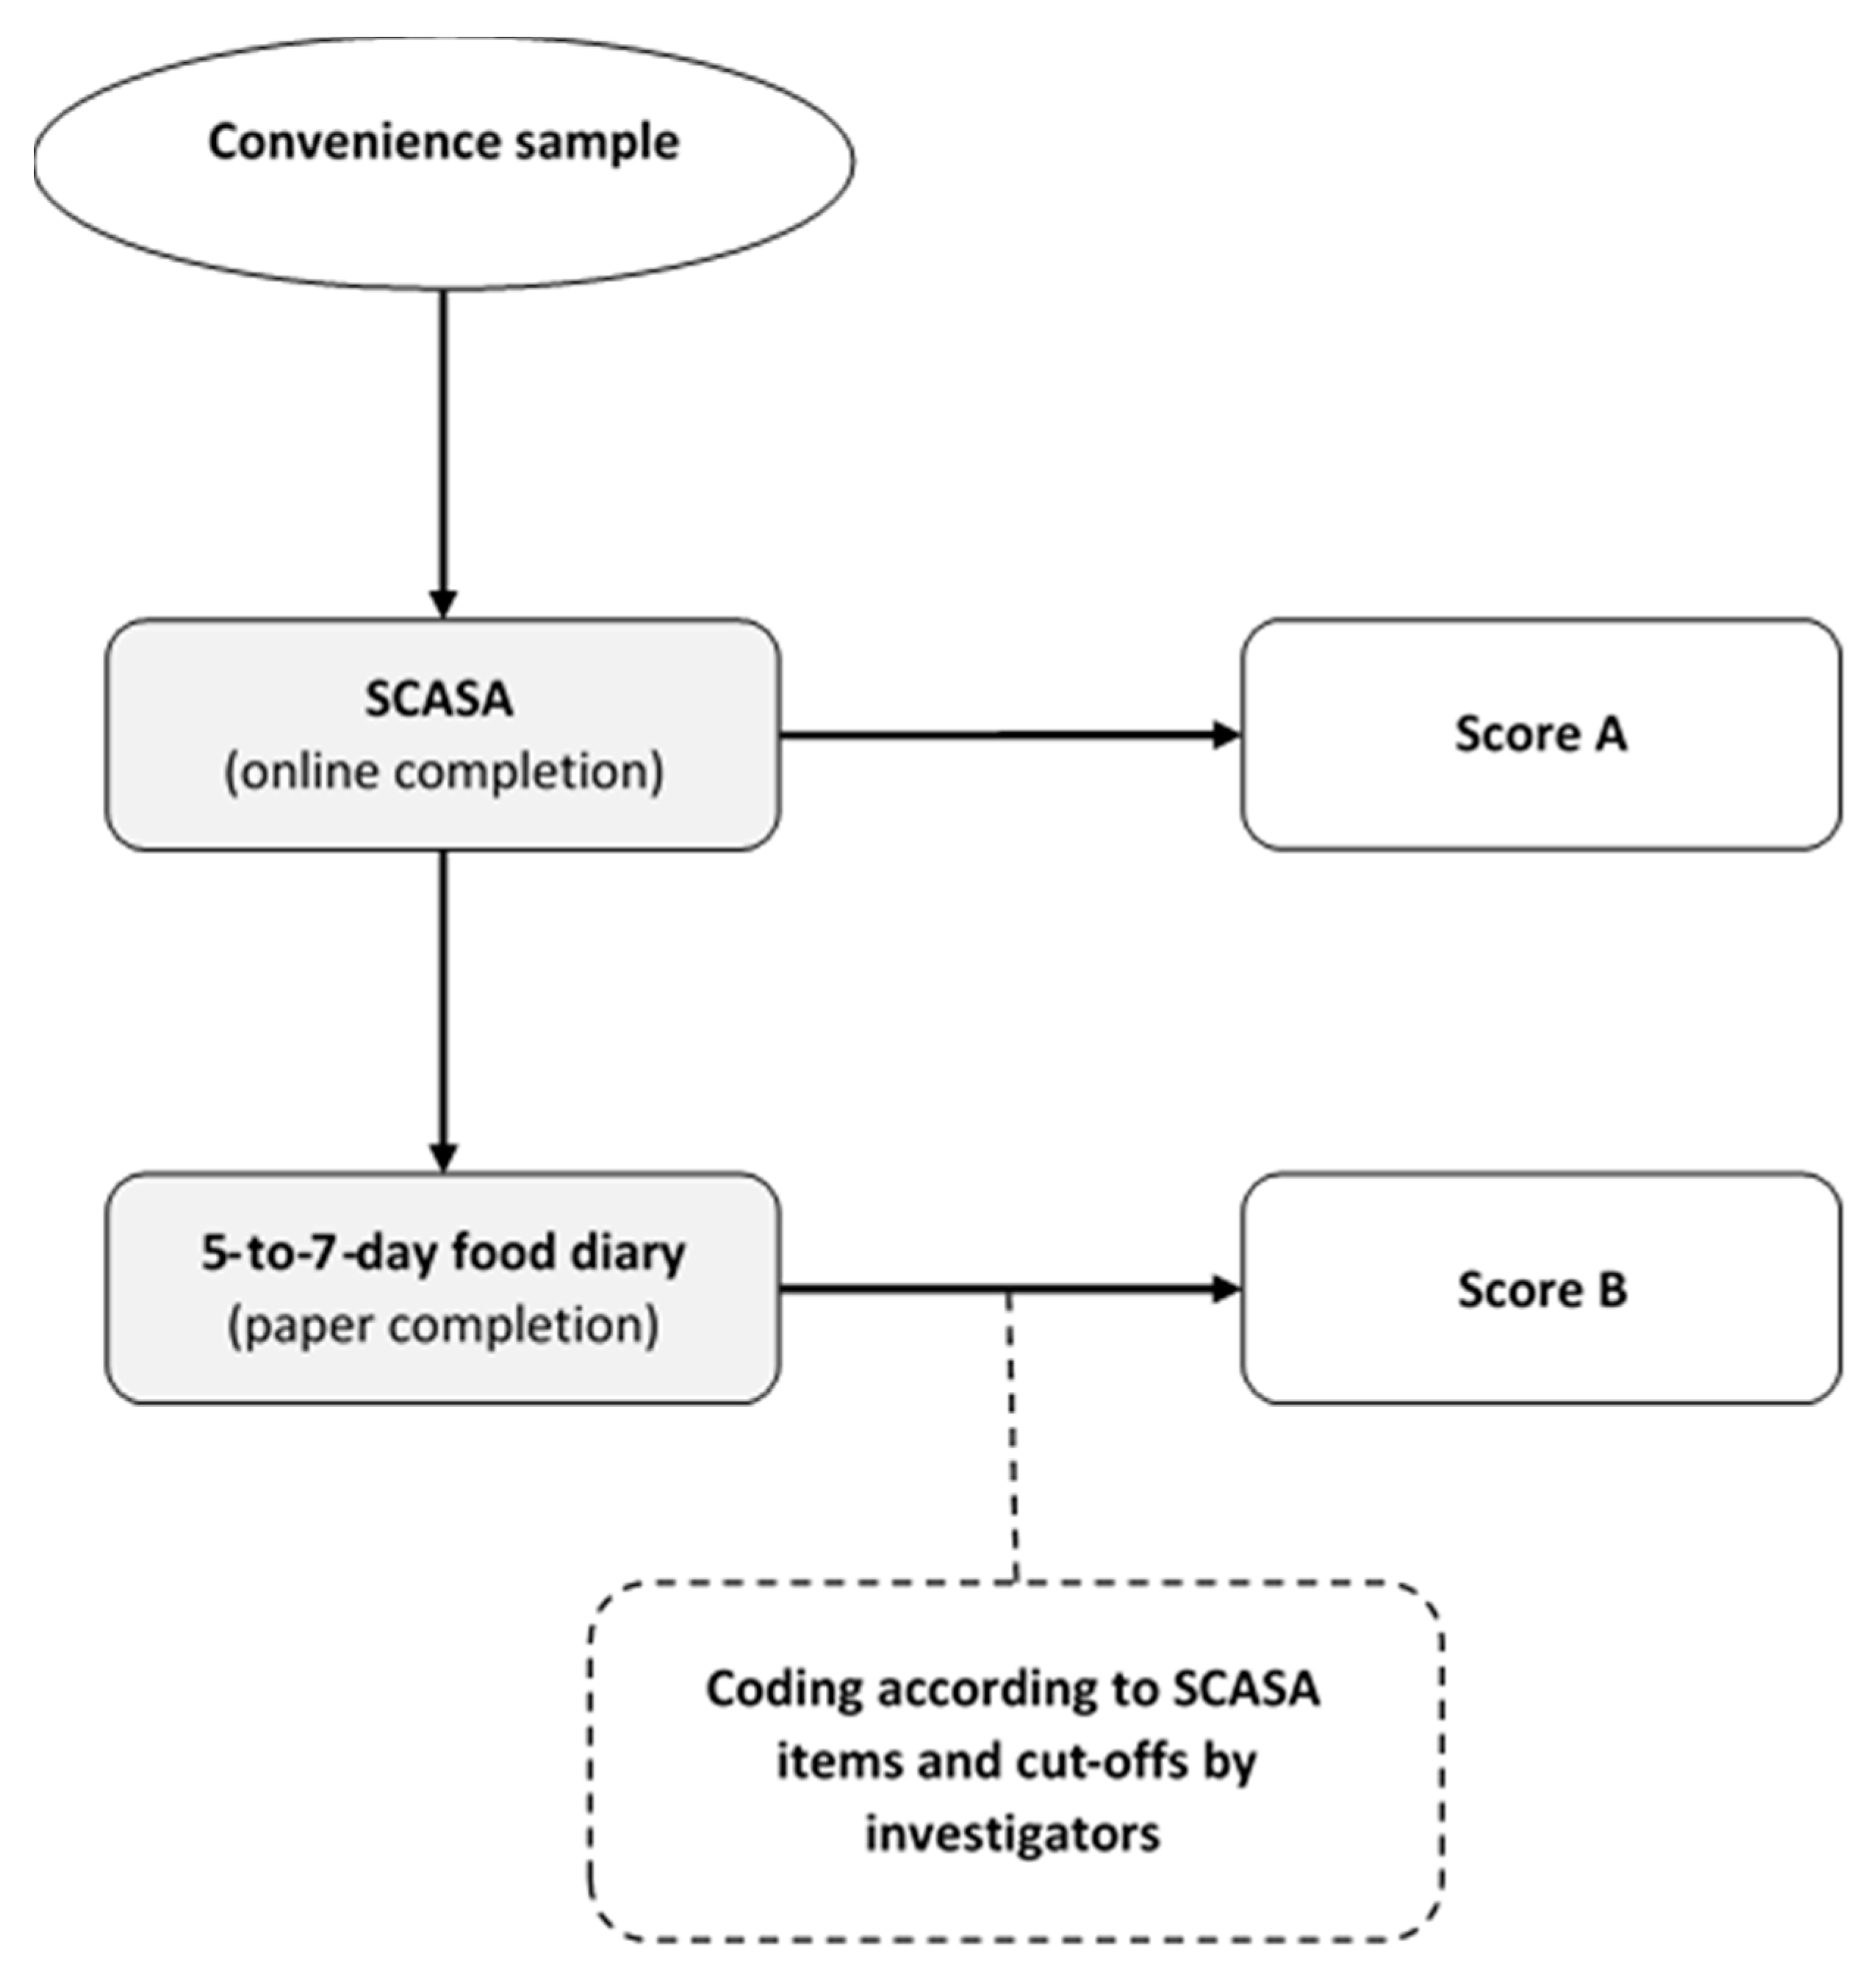
2.5. Stage 5: Inter-Method Reliability Assessment
2.6. Adaptations for Other Regions
3. Results
3.1. Description of SCASA
3.2. Construct Validation
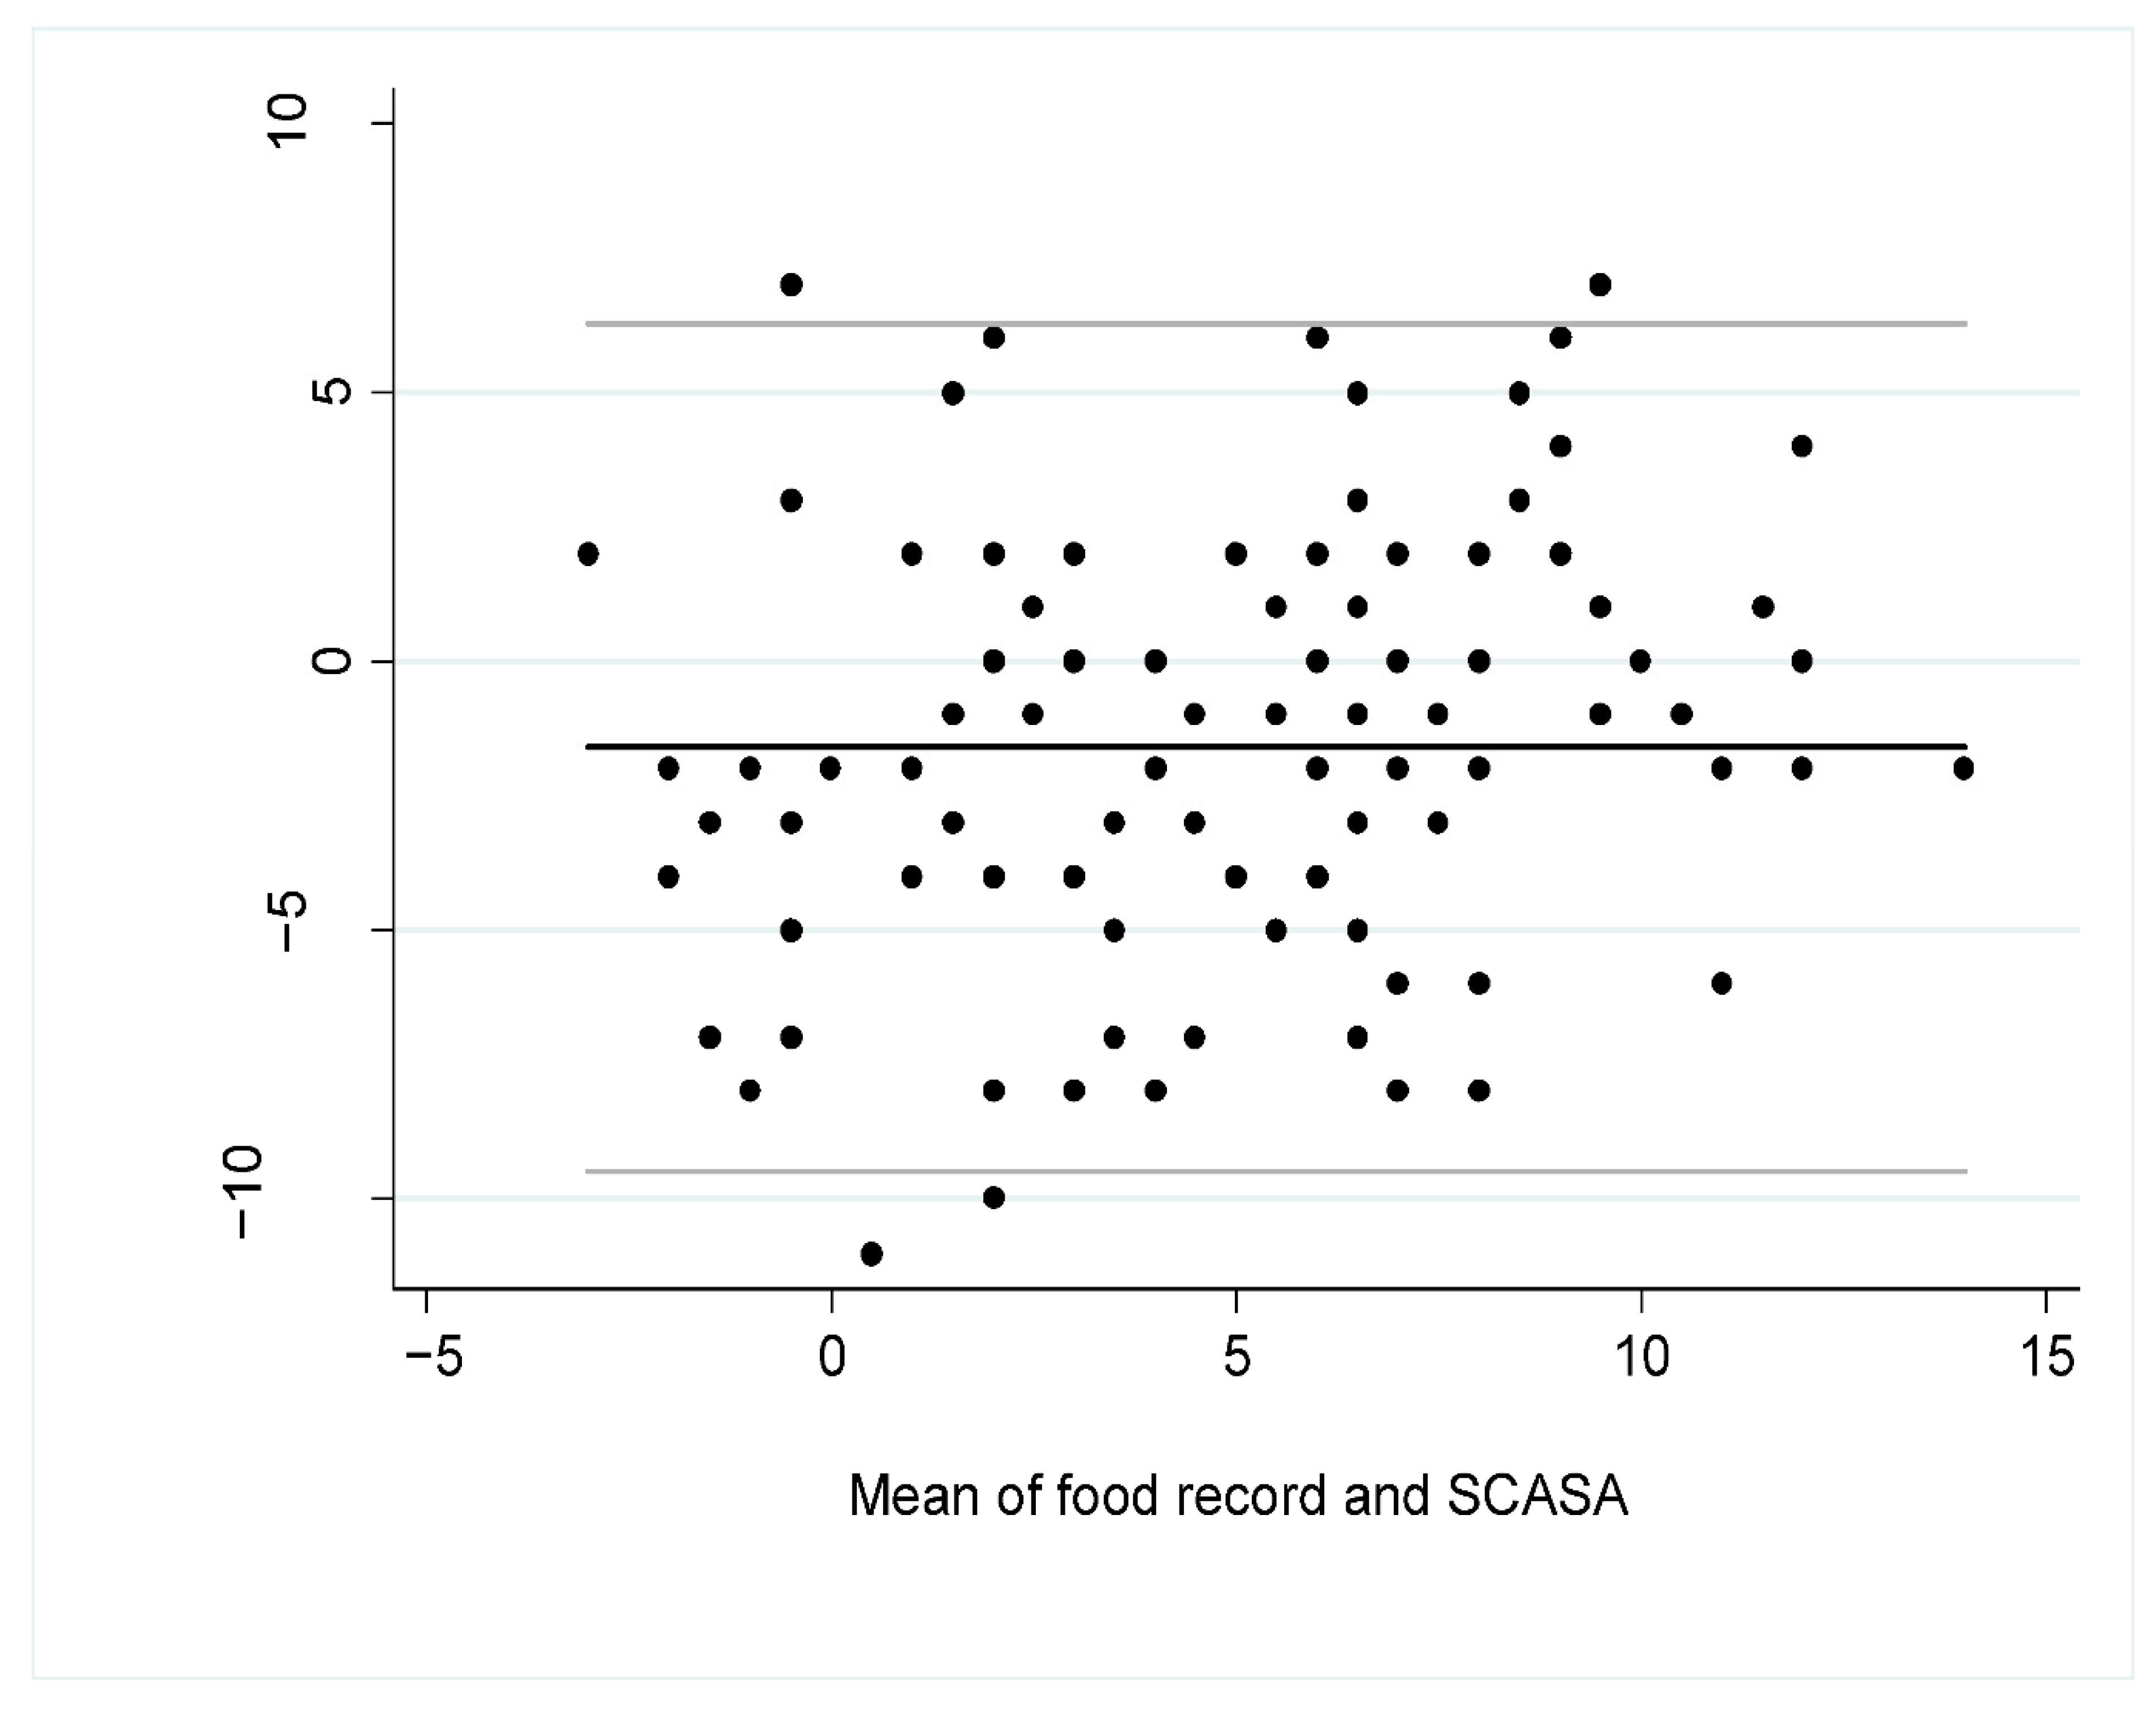
3.3. Inter-Method Reliability
4. Discussion
5. Conclusions
Author Contributions
Funding
Institutional Review Board Statement
Informed Consent Statement
Data Availability Statement
Conflicts of Interest
Appendix A

| Component | Switzerland [62] * | Great Britain [63] | France [64] | Germany [65] | The Netherlands [66] | Belgium [67] |
|---|---|---|---|---|---|---|
| Fruits | 2 servings/day | 5 servings/day | 2 servings/day | 2 servings/day | 200 g/day | 250 g/day |
| Vegetables | 3 servings/day | 3 servings/day | 3 servings/day | 200 g/day | 300 g/day | |
| Starchy foods | 3 servings/day | Every meal | Every meal | Every meal | - | Sufficient quantity every day |
| Whole grains | Promote | Promote | Promote | Promote | At least 90 g/day | At least 125g/day |
| Legumes | Promote | Consume more | 2 servings/week | - | Every week | At least 1 portion/week |
| Cheese and other dairy products | 3 servings/day | Every day | 2 servings/day | 200–250g of milk and dairy products and two slices of cheese (50–60 g) per day | A few servings per day | 250–500 mL of milk and dairy products per day |
| Protein-rich foods | 1 serving/day. Vary between meat, fish, eggs, quorn, seitan, or cheese | Vary the sources of protein | Vary the sources of protein. Choose poultry and limit other meats | 300–600 g of meat, 2 servings of fish and 3 eggs per week | Max. 500 g/week of meat | Vary the sources of protein. 1–3 servings/week poultry, egg or other meat substitutes |
| Total meat | 2–3 servings/week | - | 500 g/week maximum | 300–600 g/week | - | - |
| Red meat | - | - | - | - | 300 g/week maximum | 300 g/week maximum |
| Processed fatty meat | 1 serving/week | 70 g/day maximum | 150 g/week | - | - | 30 g/day maximum |
| Fish and seafood | - | 2 servings/week including 1 of fatty fish | 2 servings/week including 1 of fatty fish | 1–2 servings/week | 1 serving/week, preferably fatty fish | 1–2 servings/week including 1 of fatty fish |
| Fats and oils | 2–3 tablespoons (20–30 g) of vegetable oil per day, at least half of which is rapeseed oil Small amount of butter, margarine, cream can be consumed every day | Unsaturated oils and small amounts | Rapeseed, walnut and olive oil. Added fats (oil, butter and margarine) can be consumed daily in small amounts | 10–15 g of oil (rapeseed, walnut or soybean oil) and 15–30 g of margarine or butter. Prefer vegetable oils and especially rapeseed oil | Rapeseed, soy, and walnut oils | |
| Sweets and salty snacks, high fat dishes and sauces | 1 small portion per day maximum | Reduce, consume occasionally and in small quantities | Limit their consumption | Not recommended | Limit sweet products | |
| Nuts and seeds (unsalted, without sweet coating) | 1 serving (20–30 g)/day | - | - | - | ≥15 g/day | 15–25 g/day |
| Sugar-sweetened beverages | Limit their consumption | - | Limit as much as possible. 1 serving/day maximum | - | - | - |
| Alcoholic beverages | Men: 2 serving/day maximum Women: 1 serving/day maximum | - | 2 servings/day maximum, not every day | - | 1 serving/day maximum | Men: <20 g/day (two servings) Women: <10 g/day (one serving) |
Appendix B

References
- GBD 2016 Risk Factors Collaborators. Global, regional, and national comparative risk assessment of 84 behavioural, environmental and occupational, and metabolic risks or clusters of risks, 1990–2016: A systematic analysis for the Global Burden of Disease Study 2016. Lancet 2017, 390, 1345–1422. [Google Scholar] [CrossRef]
- Mozaffarian, D. Dietary and Policy Priorities for Cardiovascular Disease, Diabetes, and Obesity: A Comprehensive Review. Circulation 2016, 133, 187–225. [Google Scholar] [CrossRef]
- DACH. Valeurs de Référence DACH Pour les Apports Nutritionnels, 2nd ed.; DACH: Berne, Switzerland, 2015. [Google Scholar]
- Eilat-Adar, S.; Sinai, T.; Yosefy, C.; Henkin, Y. Nutritional Recommendations for Cardiovascular Disease Prevention. Nutrients 2013, 5, 3646–3683. [Google Scholar] [CrossRef] [PubMed]
- Lloyd-Jones, D.M.; Hong, Y.; Labarthe, D.; Mozaffarian, D.; Appel, L.J.; Van Horn, L.; Greenlund, K.; Daniels, S.; Nichol, G.; Tomaselli, G.F.; et al. Defining and setting national goals for cardiovascular health promotion and disease reduction: The American Heart Association’s strategic Impact Goal through 2020 and beyond. Circulation 2010, 121, 586–613. [Google Scholar] [CrossRef] [PubMed]
- Katz, D.; Meller, S. Can We Say What Diet Is Best for Health? Annu. Rev. Public Health 2014, 35, 83–103. [Google Scholar] [CrossRef] [PubMed]
- Reedy, J.; Mitrou, P.N.; Krebs-Smith, S.M.; Wirfalt, E.; Flood, A.; Kipnis, V.; Leitzmann, M.; Mouw, T.; Hollenbeck, A.; Schatzkin, A.; et al. Index-based dietary patterns and risk of colorectal cancer: The NIH-AARP Diet and Health Study. Am. J. Epidemiol. 2008, 168, 38–48. [Google Scholar] [CrossRef] [PubMed]
- Chiuve, S.E.; Fung, T.T.; Rimm, E.B.; Hu, F.B.; McCullough, M.L.; Wang, M.; Stampfer, M.J.; Willett, W.C. Alternative Dietary Indices Both Strongly Predict Risk of Chronic Disease. J. Nutr. 2012, 142, 1009–1018. [Google Scholar] [CrossRef] [PubMed]
- Lassale, C.; Gunter, M.J.; Romaguera, D.; Peelen, L.M.; Van Der Schouw, Y.T.; Beulens, J.W.J.; Freisling, H.; Muller, D.C.; Ferrari, P.; Huybrechts, I.; et al. Diet Quality Scores and Prediction of All-Cause, Cardiovascular and Cancer Mortality in a Pan-European Cohort Study. PLoS ONE 2016, 11, e0159025. [Google Scholar] [CrossRef]
- Sotos-Prieto, M.; Bhupathiraju, S.N.; Mattei, J.; Fung, T.T.; Li, Y.; Pan, A.; Willett, W.C.; Rimm, E.B.; Hu, F.B. Association of Changes in Diet Quality with Total and Cause-Specific Mortality. N. Engl. J. Med. 2017, 377, 143–153. [Google Scholar] [CrossRef]
- Glanz, K.; Hersey, J.; Cates, S.; Muth, M.; Creel, D.; Nicholls, J.; Fulgoni, V.; Zaripheh, S. Effect of a Nutrient Rich Foods consumer education program: Results from the nutrition advice study. J. Acad. Nutr. Diet. 2012, 112, 56–63. [Google Scholar] [CrossRef]
- Roe, L.; Strong, C.; Whiteside, C.; Neil, A.; Mant, D. Dietary Intervention in Primary Care: Validity of the DINE Method for Diet Assessment. Fam. Pract. 1994, 11, 375–381. [Google Scholar] [CrossRef]
- Watson, S.; Iv, W.A.W.; Feigenbaum, M.S.; Jupp, R.; Senn, M.; Wracker, C.; Blackhurst, D.; Hendricks, M.; Durstine, J.L. Assessing Dietary Fat Intake in Chronic Disease Rehabilitation Programs. J. Cardiopulm. Rehabil. 2002, 22, 161–167. [Google Scholar] [CrossRef] [PubMed]
- McGuire, S. Scientific Report of the 2015 Dietary Guidelines Advisory Committee. Washington, DC: US Departments of Agriculture and Health and Human Services, 2015. Adv. Nutr. 2016, 7, 202–204. [Google Scholar] [CrossRef] [PubMed]
- Mozaffarian, D.; Appel, L.J.; Van Horn, L. Components of a cardioprotective diet: New insights. Circulation 2011, 123, 2870–2891. [Google Scholar] [CrossRef] [PubMed]
- Mozaffarian, D.; Rosenberg, I.; Uauy, R. History of modern nutrition science—implications for current research, dietary guidelines, and food policy. BMJ 2018, 361, k2392. [Google Scholar] [CrossRef]
- Drewnowski, A. Comment évaluer la qualité de l’ensemble du régime alimentaire? Cah. Nutr. Diététique 1999, 34, 15–20. [Google Scholar]
- Schulze, M.B.; A Martínez-González, M.; Fung, T.T.; Lichtenstein, A.H.; Forouhi, N.G. Food based dietary patterns and chronic disease prevention. BMJ 2018, 361, k2396. [Google Scholar] [CrossRef]
- Kennedy, E.T.; Ohls, J.; Carlson, S.; Fleming, K. The Healthy Eating Index: Design and applications. J. Am. Diet. Assoc. 1995, 95, 1103–1108. [Google Scholar] [CrossRef]
- Guenther, P.M.; Kirkpatrick, S.I.; Reedy, J.; Krebs-Smith, S.M.; Buckman, D.W.; Dodd, K.W.; Casavale, K.O.; Carroll, R.J. The Healthy Eating Index-2010 Is a Valid and Reliable Measure of Diet Quality According to the 2010 Dietary Guidelines for Americans. J. Nutr. 2014, 144, 399–407. [Google Scholar] [CrossRef]
- Trichopoulou, A.; Kouris-Blazos, A.; Wahlqvist, M.L.; Gnardellis, C.; Lagiou, P.; Polychronopoulos, E.; Vassilakou, T.; Lipworth, L.; Trichopoulos, D. Diet and overall survival in elderly people. BMJ 1995, 311, 1457–1460. [Google Scholar] [CrossRef] [PubMed]
- Trichopoulou, A.; Costacou, T.; Bamia, C.; Trichopoulos, D. Adherence to a Mediterranean Diet and Survival in a Greek Population. N. Engl. J. Med. 2003, 348, 2599–2608. [Google Scholar] [CrossRef]
- Estaquio, C.; Kesse-Guyot, E.; Deschamps, V.; Bertrais, S.; Dauchet, L.; Galan, P.; Hercberg, S.; Castetbon, K. Adherence to the French Programme National Nutrition Santé Guideline Score Is Associated with Better Nutrient Intake and Nutritional Status. J. Am. Diet. Assoc. 2009, 109, 1031–1041. [Google Scholar] [CrossRef] [PubMed]
- Möller, E.; Galeone, C.; Adami, H.-O.; Adolfsson, J.; Andersson, T.M.-L.; Bellocco, R.; Grönberg, H.; A Mucci, L.; Bälter, K. The Nordic Nutrition Recommendations and prostate cancer risk in the Cancer of the Prostate in Sweden (CAPS) study. Public Health Nutr. 2012, 15, 1897–1908. [Google Scholar] [CrossRef]
- Kesse-Guyot, E.; Castetbon, K.; Estaquio, C.; Czernichow, S.; Galan, P.; Hercberg, S. Association Between the French Nutritional Guideline-based Score and 6-Year Anthropometric Changes in a French Middle-aged Adult Cohort. Am. J. Epidemiol. 2009, 170, 757–765. [Google Scholar] [CrossRef]
- Tobias, D.K.; Zhang, C.; Chavarro, J.; Olsen, S.; Bao, W.; Bjerregaard, A.A.; Fung, T.T.; Manson, J.E.; Hu, F.B. Healthful dietary patterns and long-term weight change among women with a history of gestational diabetes mellitus. Int. J. Obes. 2016, 40, 1748–1753. [Google Scholar] [CrossRef] [PubMed]
- Kesse-Guyot, E.; Touvier, M.; Henegar, A.; Czernichow, S.; Galan, P.; Hercberg, S.; Castetbon, K. Higher adherence to French dietary guidelines and chronic diseases in the prospective SU.VI.MAX cohort. Eur. J. Clin. Nutr. 2011, 65, 887–894. [Google Scholar] [CrossRef] [PubMed]
- Chiuve, S.E.; Sampson, L.; Willett, W.C. The Association between a Nutritional Quality Index and Risk of Chronic Disease. Am. J. Prev. Med. 2011, 40, 505–513. [Google Scholar] [CrossRef]
- Schwingshackl, L.; Hoffmann, G. Diet Quality as Assessed by the Healthy Eating Index, the Alternate Healthy Eating Index, the Dietary Approaches to Stop Hypertension Score, and Health Outcomes: A Systematic Review and Meta-Analysis of Cohort Studies. J. Acad. Nutr. Diet. 2015, 115, 780–800.e5. [Google Scholar] [CrossRef]
- Schwingshackl, L.; Missbach, B.; König, J.; Hoffmann, G. Adherence to a Mediterranean diet and risk of diabetes: A systematic review and meta-analysis. Public Health Nutr. 2015, 18, 1292–1299. [Google Scholar] [CrossRef] [PubMed]
- Willett, W. Food-Frequency Methods. In Nutritional Epidemiology; Willett, W., Ed.; Oxford University Press: New York, NY, USA, 1998; pp. 74–94. [Google Scholar]
- Weaver, C.M.; Dwyer, J.; Fulgoni, V.L.; King, J.C.; A Leveille, G.; Macdonald, R.S.; Ordovas, J.; Schnakenberg, D. Processed foods: Contributions to nutrition. Am. J. Clin. Nutr. 2014, 99, 1525–1542. [Google Scholar] [CrossRef]
- Liu, A.G.; Ford, N.A.; Hu, F.B.; Zelman, K.M.; Mozaffarian, D.; Kris-Etherton, P.M. A healthy approach to dietary fats: Understanding the science and taking action to reduce consumer confusion. Nutr. J. 2017, 16, 1–15. [Google Scholar] [CrossRef] [PubMed]
- National Cancer Institute. Identification of Top Food Sources of Various Dietary Components. 2019. Available online: https://epi.grants.cancer.gov/diet/foodsources/top-food-sources-report-02212020.pdf (accessed on 19 February 2021).
- Kahan, S.; Manson, J.E. Nutrition Counseling in Clinical Practice: How Clinicians Can Do Better. JAMA 2017, 318, 1101–1102. [Google Scholar] [CrossRef]
- Schröder, H.; Fitó, M.; Estruch, R.; Martínez-González, M.A.; Corella, D.; Salas-Salvadó, J.; Lamuela-Raventós, R.; Ros, E.; Salaverría, I.; Fiol, M.; et al. A Short Screener Is Valid for Assessing Mediterranean Diet Adherence among Older Spanish Men and Women. J. Nutr. 2011, 141, 1140–1145. [Google Scholar] [CrossRef] [PubMed]
- A Martínez-González, M.; Fernández-Jarne, E.; Serrano-Martínez, M.; Wright, M.; Gomez-Gracia, E. Development of a short dietary intake questionnaire for the quantitative estimation of adherence to a cardioprotective Mediterranean diet. Eur. J. Clin. Nutr. 2004, 58, 1550–1552. [Google Scholar] [CrossRef] [PubMed]
- O’Reilly, S.L.; McCann, L.R. Development and validation of the Diet Quality Tool for use in cardiovascular disease prevention settings. Aust. J. Prim. Health 2012, 18, 138–147. [Google Scholar] [CrossRef]
- Svilaas, A.; Ström, E.C.; Svilaas, T.; Borgejordet, A.; Thoresen, M.; Ose, L. Reproducibility and validity of a short food questionnaire for the assessment of dietary habits. Nutr. Metab. Cardiovasc. Dis. 2002, 12, 60–70. [Google Scholar]
- Wiens, L.; Schulzer, M.; Chen, C.; Parinas, K. Reliability and Validity of the SmartDiet Canadian Version Questionnaire. J. Am. Diet. Assoc. 2010, 110, 101–105. [Google Scholar] [CrossRef]
- Waijers, P.M.C.M.; Feskens, E.J.M.; Ocké, M.C. A critical review of predefined diet quality scores. Br. J. Nutr. 2007, 97, 219–231. [Google Scholar] [CrossRef]
- Brook, R. The RAND/UCLA Appropriateness Method. In Clinical Practice Guideline Development: Methodology Perspectives; Cormick, K.M., Moore, S., Siegel, R., Eds.; US Dept Health and Human Services, Public Health Service; Agency for Health Care Policy and Research: Rockville, MD, USA, 1994; pp. 59–67. [Google Scholar]
- Nair, R.; Aggarwal, R.; Khanna, D. Methods of Formal Consensus in Classification/Diagnostic Criteria and Guideline Development. Semin. Arthritis Rheum. 2011, 41, 95–105. [Google Scholar] [CrossRef]
- Kruseman, M.; Farina, E.; Carrard, I.; Guessous, I. Comment évaluer la qualité de l’alimentation? Utilité et caractéristiques d’une sélection de Scores. L’Information Diététique 2017, 3, 11–19. [Google Scholar]
- Walter, P.; Infanger, E.; Mühlemann, P. Food Pyramid of the Swiss Society for Nutrition. Ann. Nutr. Metab. 2007, 51, 15–20. [Google Scholar] [CrossRef]
- Société Suisse de Nutrition. Pyramide Alimentaire Suisse 2011 (Swiss Food Pyramid). 2011. Available online: http://www.sge-ssn.ch/fr/toi-et-moi/boire-et-manger/equilibre-alimentaire/pyramide-alimentaire-suisse (accessed on 19 February 2021).
- Bach-Faig, A.; Berry, E.M.; Lairon, D.; Reguant, J.; Trichopoulou, A.; Dernini, S.; Medina, F.X.; Battino, M.; Belahsen, R.; Miranda, G.; et al. Mediterranean diet pyramid today. Science and cultural updates. Public Health Nutr. 2011, 14, 2274–2284. [Google Scholar] [CrossRef]
- US Department of Agriculture and US Department of Health and Human Services. Dietary Guidelines for Americans 2015–2020; US Government Printing Office: Washington, DC, USA, 2015.
- Chatelan, A.; Beer-Borst, S.; Randriamiharisoa, A.; Pasquier, J.; Blanco, J.M.; Siegenthaler, S.; Paccaud, F.; Slimani, N.; Nicolas, G.; Camenzind-Frey, E.; et al. Major Differences in Diet across Three Linguistic Regions of Switzerland: Results from the First National Nutrition Survey menuCH. Nutrients 2017, 9, 1163. [Google Scholar] [CrossRef] [PubMed]
- Federal Food Safety and Veterinary Office. L’enquête Nationale sur L’alimentation menuCH. 2017. Available online: https://www.blv.admin.ch/blv/fr/home/lebensmittel-und-ernaehrung/ernaehrung/menuch.html (accessed on 19 February 2021).
- Lorentz, F.H. Ein neuer Konstitutionsindex. J. Mol. Med. 1929, 8, 348–351. [Google Scholar] [CrossRef]
- Cordain, L.; Eaton, S.B.; Sebastian, A.; Mann, N.; Lindeberg, S.; A Watkins, B.; O’Keefe, J.H.; Brand-Miller, J. Origins and evolution of the Western diet: Health implications for the 21st century. Am. J. Clin. Nutr. 2005, 81, 341–354. [Google Scholar] [CrossRef] [PubMed]
- Monteiro, C.A.; Cannon, G.; Moubarac, J.-C.; Levy, R.B.; Louzada, M.L.C.; Jaime, P.C. The UN Decade of Nutrition, the NOVA food classification and the trouble with ultra-processing. Public Health Nutr. 2018, 21, 5–17. [Google Scholar] [CrossRef] [PubMed]
- Bingham, S.A.; Gill, C.; Welch, A.; Day, K.; Cassidy, A.; Khaw, K.T.; Sneyd, M.J.; Key, T.J.A.; Roe, L.; Day, N.E. Comparison of dietary assessment methods in nutritional epidemiology: Weighed records v. 24 h recalls, food-frequency questionnaires and estimated-diet records. Br. J. Nutr. 1994, 72, 619–643. [Google Scholar] [CrossRef] [PubMed]
- De Keyzer, W.; Huybrechts, I.; De Vriendt, V.; Vandevijvere, S.; Slimani, N.; Van Oyen, H.; De Henauw, S. Repeated 24-hour recalls versus dietary records for estimating nutrient intakes in a national food consumption survey. Food Nutr. Res. 2011, 55, 55. [Google Scholar] [CrossRef] [PubMed]
- Kowalkowska, J.; Slowinska, M.A.; Slowinski, D.; Dlugosz, A.; Niedzwiedzka, E.; Wadolowska, L. Comparison of a Full Food-Frequency Questionnaire with the Three-Day Unweighted Food Records in Young Polish Adult Women: Implications for Dietary Assessment. Nutrients 2013, 5, 2747–2776. [Google Scholar] [CrossRef] [PubMed]
- Cerwinske, L.A.; Rasmussen, H.E.; Lipson, S.; Volgman, A.S.; Tangney, C.C. Evaluation of a dietary screener: The Mediterranean Eating Pattern for Americans tool. J. Hum. Nutr. Diet. 2017, 30, 596–603. [Google Scholar] [CrossRef]
- Colby, S.; Zhou, W.; Allison, C.; Mathews, A.E.; Olfert, M.D.; Morrell, J.S.; Byrd-Bredbenner, C.; Greene, G.; Brown, O.; Kattelmann, K.; et al. Development and Validation of the Short Healthy Eating Index Survey with a College Population to Assess Dietary Quality and Intake. Nutrients 2020, 12, 2611. [Google Scholar] [CrossRef]
- McHugh, M.L. Interrater reliability: The kappa statistic. Biochem. Med. 2012, 22, 276–282. [Google Scholar] [CrossRef]
- Shim, J.-S.; Oh, K.; Kim, H.C. Dietary assessment methods in epidemiologic studies. Epidemiol. Health 2014, 36, e2014009. [Google Scholar] [CrossRef] [PubMed]
- Laville, M.; Segrestin, B.; Alligier, M.; Ruano-Rodríguez, C.; A M, N.E.; Hiesmayr, M.; Schols, A.; La Vecchia, C.; Boirie, Y.; Rath, A.; et al. Evidence-based practice within nutrition: What are the barriers for improving the evidence and how can they be dealt with? Trials 2017, 18, 1–9. [Google Scholar] [CrossRef] [PubMed]
- Société Suisse de Nutrition. Site de la Société Suisse de Nutrition. 2020. Available online: http://www.sge-ssn.ch/fr/ (accessed on 19 February 2021).
- Public Health England. The Eatwell Guide 2018. Available online: https://www.gov.uk/government/publications/the-eatwell-guide (accessed on 19 February 2021).
- Programme National Nutrition Santé. Manger Bouger. Available online: https://www.mangerbouger.fr/Les-recommandations (accessed on 19 February 2021).
- Deutsche Gesellschaft für Ernährung. Vollwertig essen und trinken nach den 10 Regeln der DGE. 2017. Available online: https://www.dge.de/fileadmin/public/doc/fm/10-Regeln-der-DGE.pdf (accessed on 19 February 2021).
- Voedingscentrum. Available online: https://www.voedingscentrum.nl/nl/gezond-eten-met-de-schijf-van-vijf.aspx (accessed on 19 February 2021).
- Conseil Supérieur de la Santé. Recommandations alimentaires pour la population belge adulte. 2019. 2020. Available online: https://www.health.belgium.be/sites/default/files/uploads/fields/fpshealth_theme_file/20190902_css-9284_fbdg_vweb_0.pdf (accessed on 19 February 2021).


| # | Components | Types of Assessment (Portion of Reference) | Answers (i.e., Cut-Offs) | Scoring |
|---|---|---|---|---|
| 1 | Fruits (excluding juices) | Daily quantity (≅100 g) | <1 | −1 |
| 1 | 0 | |||
| 2 | +1 | |||
| >2 | 0 | |||
| 2 | Vegetables (excluding potatoes) | Daily quantity (≅120 g) | ≤1 | −1 |
| 2 | 0 | |||
| 3 | +1 | |||
| >3 | +2 | |||
| 3 | Starchy foods (e.g., bread, pasta, rice, potatoes) | Daily frequency | <1 | −1 |
| 1 | 0 | |||
| ≥2 | +1 | |||
| 4 | Whole grains (e.g., whole-grain bread, brown rice) | Weekly frequency | <1 | −1 |
| 1 | 0 | |||
| ≥2 | +1 | |||
| 5 | Legumes (e.g., beans, lentils, chickpeas) | Weekly frequency | <1 | −1 |
| 1–2 | 0 | |||
| >2 | +1 | |||
| 6 | Cheese and other dairy products | Daily portion number Examples of portions provided in questionnaire, 200–250 mg calcium/portion and an average of 10 g protein. Two portions of dairy products account for one extra portion of protein-based foods in the score calculation. | ≤1 | −1 |
| 2 | 0 | |||
| 3 | +1 | |||
| ≥4 | −1 | |||
| 7 | Protein-rich foods (plant or animal based) (e.g., meat, fish, seafood, eggs, legumes, tofu) | Daily portion number Examples of portions provided in questionnaire, ≅20 g protein/portion. | <1 | −1 |
| 1–2 | +1 | |||
| >2 | −1 | |||
| 8 | Total meat (including processed meat) | Weekly frequency | 0–3 | +1 |
| 3–4 | 0 | |||
| >4 | −1 | |||
| 9 | Red meat (e.g., beef, veal, pork, lamb, horse) | Weekly frequency | Never or almost never | +1 |
| ≤2 | 0 | |||
| >2 | −1 | |||
| 10 | Processed fatty meat (e.g., sausages, cold cuts) | Weekly frequency | Never | +1 |
| Rarely, up to 1 | 0 | |||
| >1 | −1 | |||
| 11 | Fish and seafood (including canned and smoked fish) | Weekly frequency | Never or almost never | −1 |
| <1 | 0 | |||
| ≥1 | +1 | |||
| 12 | Fats and oils used for cooking (hot) or seasoning (cold) | Types of fats A list of fats and oils is provided | Used for cooking | |
| HOLL * rapeseed, HO ** sunflower, refined olive, peanut oils | +1 | |||
| Refined rapeseed, sunflower, safflower, soya oils | 0 | |||
| Extra-virgin olive, flaxseed, hazelnut, walnut oils, frying fat, coconut fat, margarine, butter | −1 | |||
| Used for seasoning | ||||
| Refined rapeseed, Extra-virgin olive refined olive, flaxseed, hazelnut, walnut oils | +1 | |||
| HOLL * rapeseed, (HO **) sunflower, peanut, safflower, soya oils, butter | 0 | |||
| frying fat, coconut fat, margarine | −1 | |||
| 13 | Sweets and salty snacks, high fat dishes and sauces (e.g., pastries, cream-based desserts, biscuits, chocolate, chips, cheese pies, French fries, fried spring rolls, pesto, cream sauce) | Weekly frequency | 0–14 | +1 |
| 15–21 | 0 | |||
| >21 | −1 | |||
| 14 | Nuts and seeds (e.g., avocado, almonds, olives, sunflower seeds) | Weekly/daily quantity Examples provided: 20 g almonds or nuts, ¼ avocado | <2/week | −1 |
| 2–6/week | 0 | |||
| 1/day | +1 | |||
| >1/day | −1 | |||
| 15 | Sugar-sweetened beverages (e.g., soft drinks, ice tea, fruit juices and lemonades, milk-based sugary drinks, sport and energy drinks, excluding those with artificial sweeteners) | Weekly quantity | 0–1 L | +1 |
| >1 L | −1 | |||
| 16 | Alcoholic beverages | Weekly quantity Examples of portions provided in questionnaire, 1 unit alcohol/portion | Men | |
| <15 | +1 | |||
| ≥15 | −1 | |||
| Women | ||||
| <10 | +1 | |||
| ≥10 | −1 | |||
| 17 | Corpulence | % calculated weight according to Lorentz formula | 80–120% | +1 |
| 120–130% | −1 | |||
| >130% | −2 | |||
| <80% | −1 |
| # | Components | Observed Agreement between Two Ratings | Quadratic Weighted Kappa Value | Comments | Overall Assessment of Agreement |
|---|---|---|---|---|---|
| 1 | Fruits | 76% | 0.37 | - | Fair |
| 2 | Vegetables | 90% | 0.33 | - | Strong |
| 3 | Starchy foods | 94% | −0.02 | Kappa paradox due to symmetrically imbalanced table | Strong |
| 4 | Whole grains | 67% | 0.24 | - | Weak |
| 5 | Legumes | 83% | 0.33 | - | Moderate |
| 6 | Cheese and other dairy products | 69% | 0.20 | - | Weak |
| 7 | Protein-rich foods | 68% | 0.21 | - | Weak |
| 8 | Total meat | 65% | 0.18 | - | Weak |
| 9 | Red meat | 79% | 0.21 | - | Fair |
| 10 | Processed fatty meat | 73% | 0.21 | - | Fair |
| 11 | Fish and seafood | 84% | 0.42 | - | Moderate |
| 12 | Fats and oils used for cooking (hot) or seasoning (cold) | - | - | Not assessed in food record | - |
| 13 | Sweets and salty snacks, high fat dishes and sauces | 81% | 0.16 | - | Moderate |
| 14 | Nuts and seeds | 66% | 0.14 | - | Weak |
| 15 | Sugar-sweetened beverages | 74% | 0.36 | - | Fair |
| 16 | Alcoholic beverages | 98% | 0.49 | Kappa paradox due to symmetrically imbalanced table | Strong |
| 17 | Corpulence | - | - | Not assessed in food record | - |
Publisher’s Note: MDPI stays neutral with regard to jurisdictional claims in published maps and institutional affiliations. |
© 2021 by the authors. Licensee MDPI, Basel, Switzerland. This article is an open access article distributed under the terms and conditions of the Creative Commons Attribution (CC BY) license (http://creativecommons.org/licenses/by/4.0/).
Share and Cite
Kruseman, M.; Chatelan, A.; Farina, E.; Carrard, I.; Cela, J.; Guessous, I.; Marques-Vidal, P. Assessing Overall Diet Quality: Development and Evaluation of the Performance of a Short Self-Administrated Questionnaire SCASA. Nutrients 2021, 13, 677. https://doi.org/10.3390/nu13020677
Kruseman M, Chatelan A, Farina E, Carrard I, Cela J, Guessous I, Marques-Vidal P. Assessing Overall Diet Quality: Development and Evaluation of the Performance of a Short Self-Administrated Questionnaire SCASA. Nutrients. 2021; 13(2):677. https://doi.org/10.3390/nu13020677
Chicago/Turabian StyleKruseman, Maaike, Angeline Chatelan, Eddy Farina, Isabelle Carrard, Jeremy Cela, Idris Guessous, and Pedro Marques-Vidal. 2021. "Assessing Overall Diet Quality: Development and Evaluation of the Performance of a Short Self-Administrated Questionnaire SCASA" Nutrients 13, no. 2: 677. https://doi.org/10.3390/nu13020677
APA StyleKruseman, M., Chatelan, A., Farina, E., Carrard, I., Cela, J., Guessous, I., & Marques-Vidal, P. (2021). Assessing Overall Diet Quality: Development and Evaluation of the Performance of a Short Self-Administrated Questionnaire SCASA. Nutrients, 13(2), 677. https://doi.org/10.3390/nu13020677