
Different Dietary N-3 Polyunsaturated Fatty Acid Formulations Distinctively Modify Tissue Fatty Acid and N-Acylethanolamine Profiles


 , , , , ,
  and
and 
Abstract
1. Introduction
2. Materials and Methods
2.1. Experimental Diets
2.2. Animals and Sample Collection
2.3. Lipid Analysis
2.3.1. Measurement of Fatty Acids
2.3.2. Measurement of N-acylethanolamines (NAE)
2.4. Statistical Analysis
3. Results
3.1. Modification of FA Profiles by n-3 PUFA Diets in Different Tissues
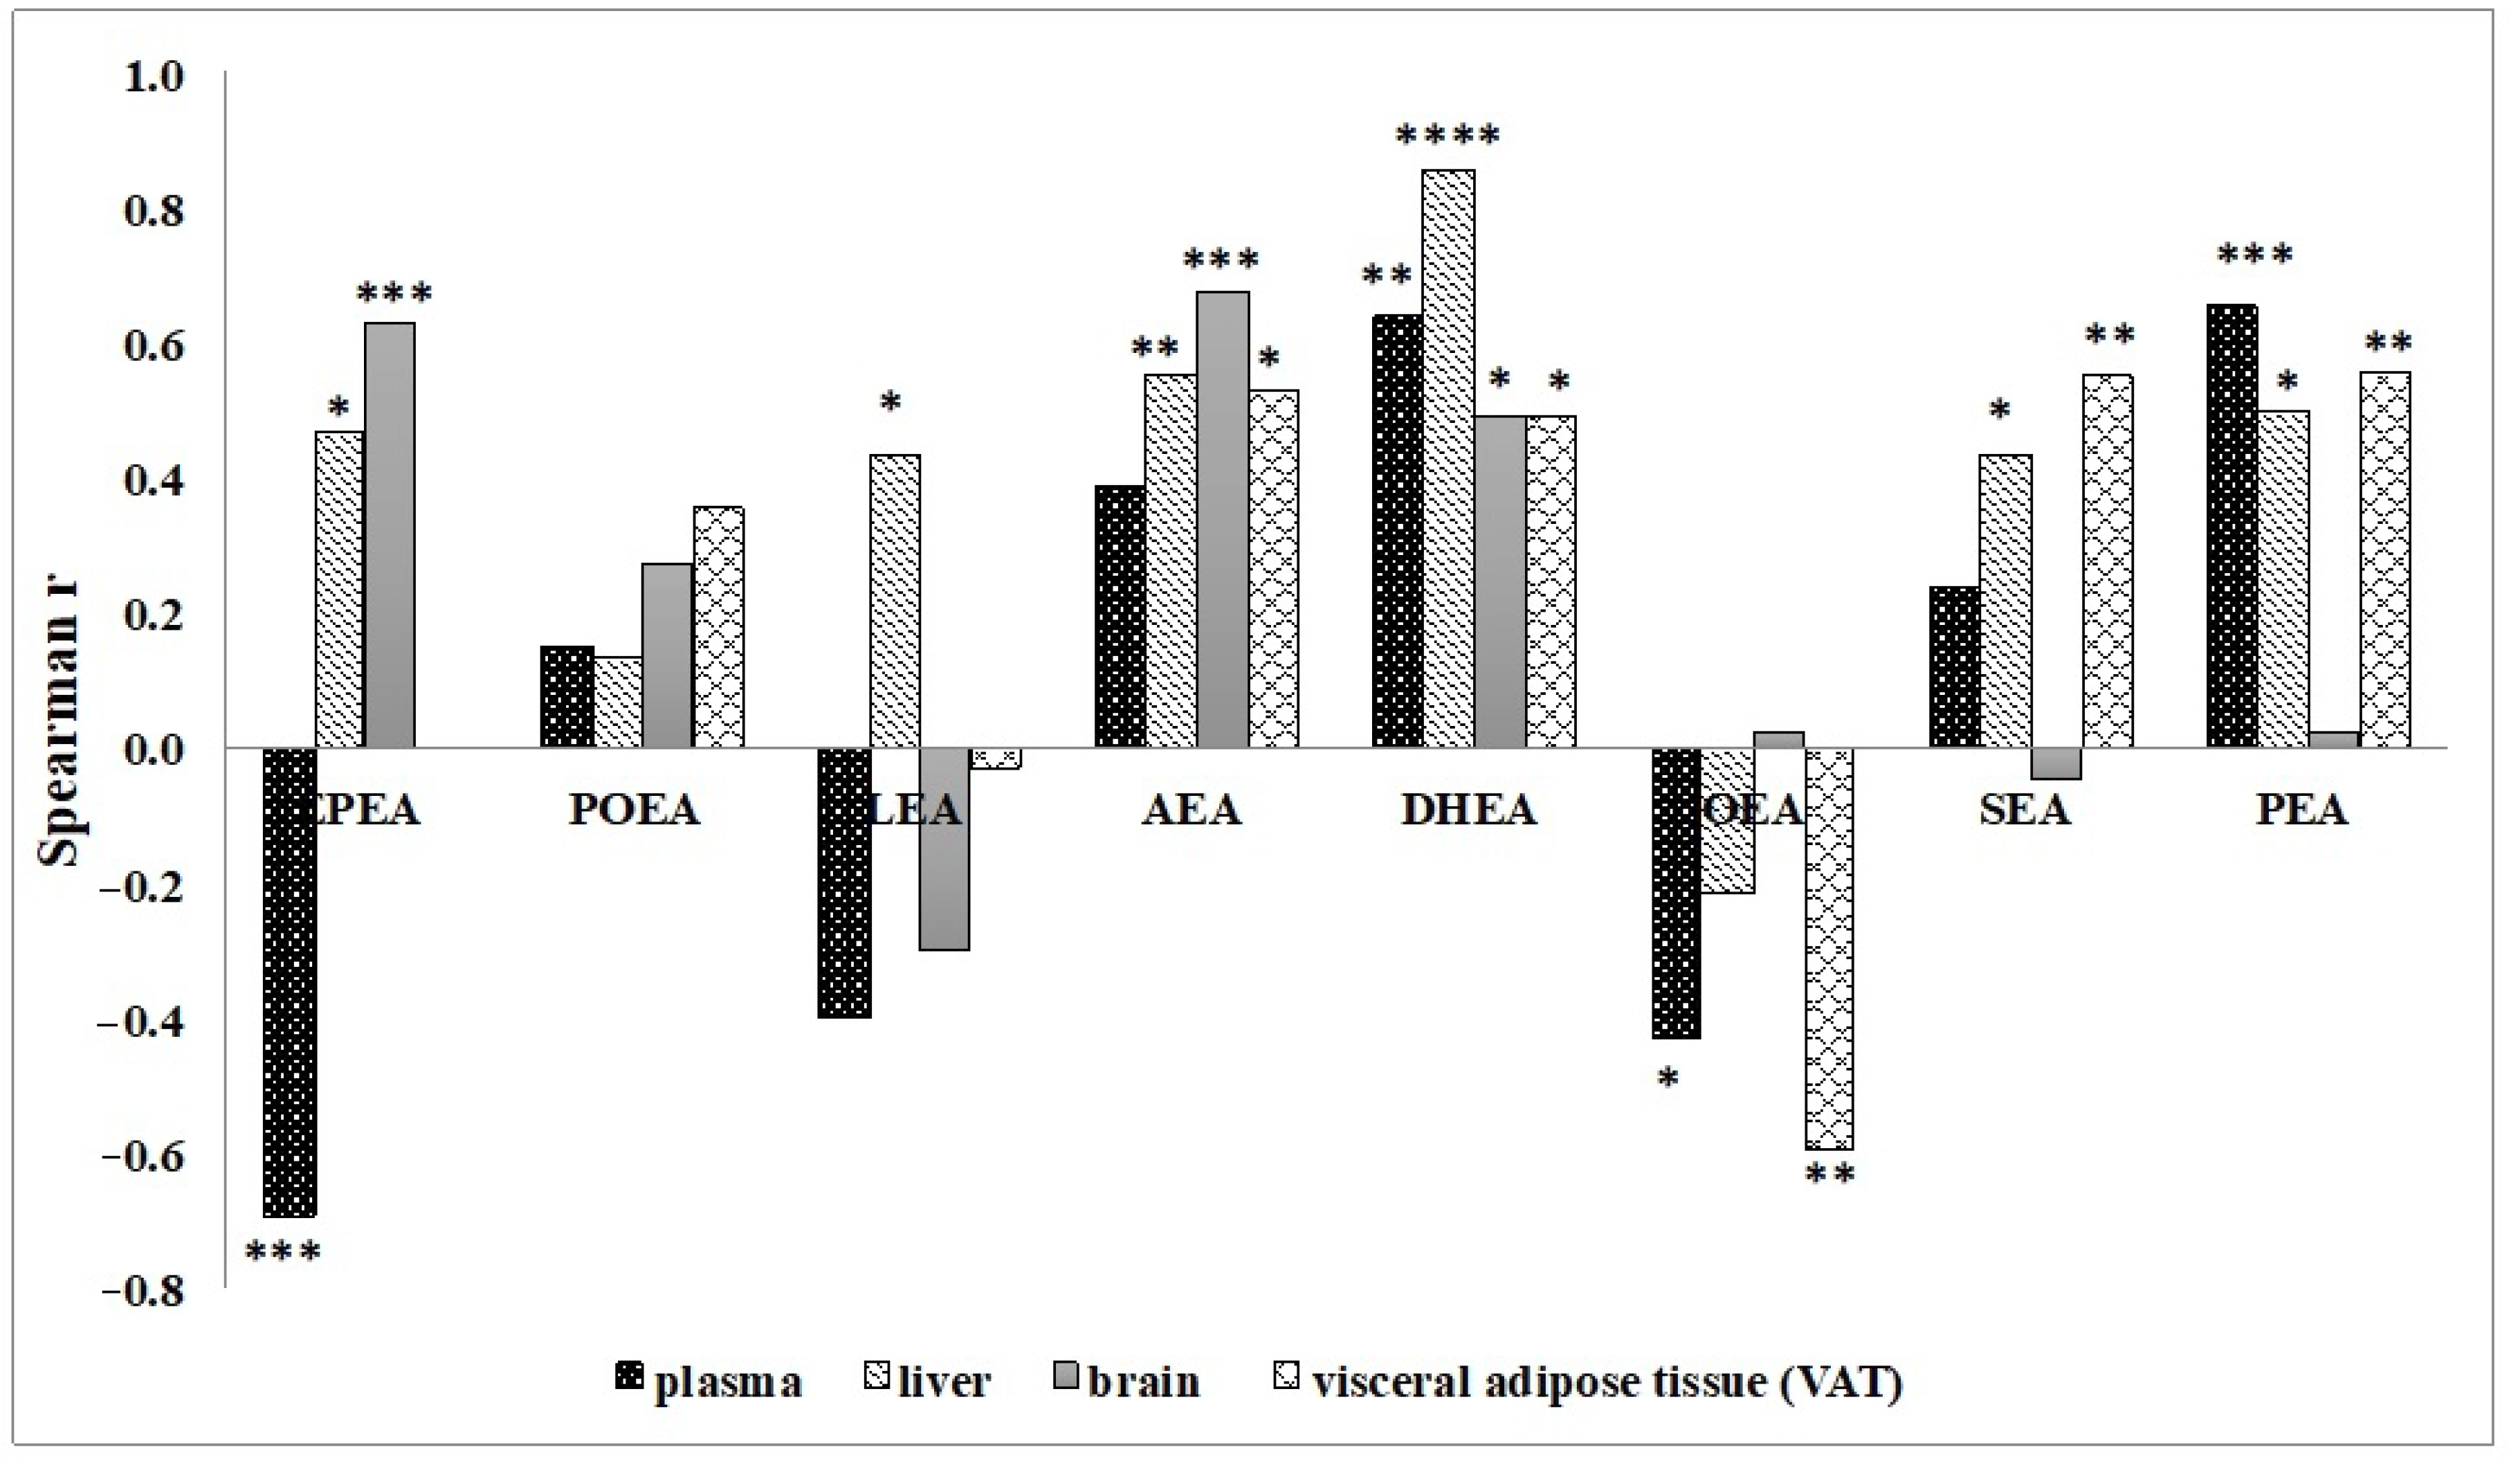
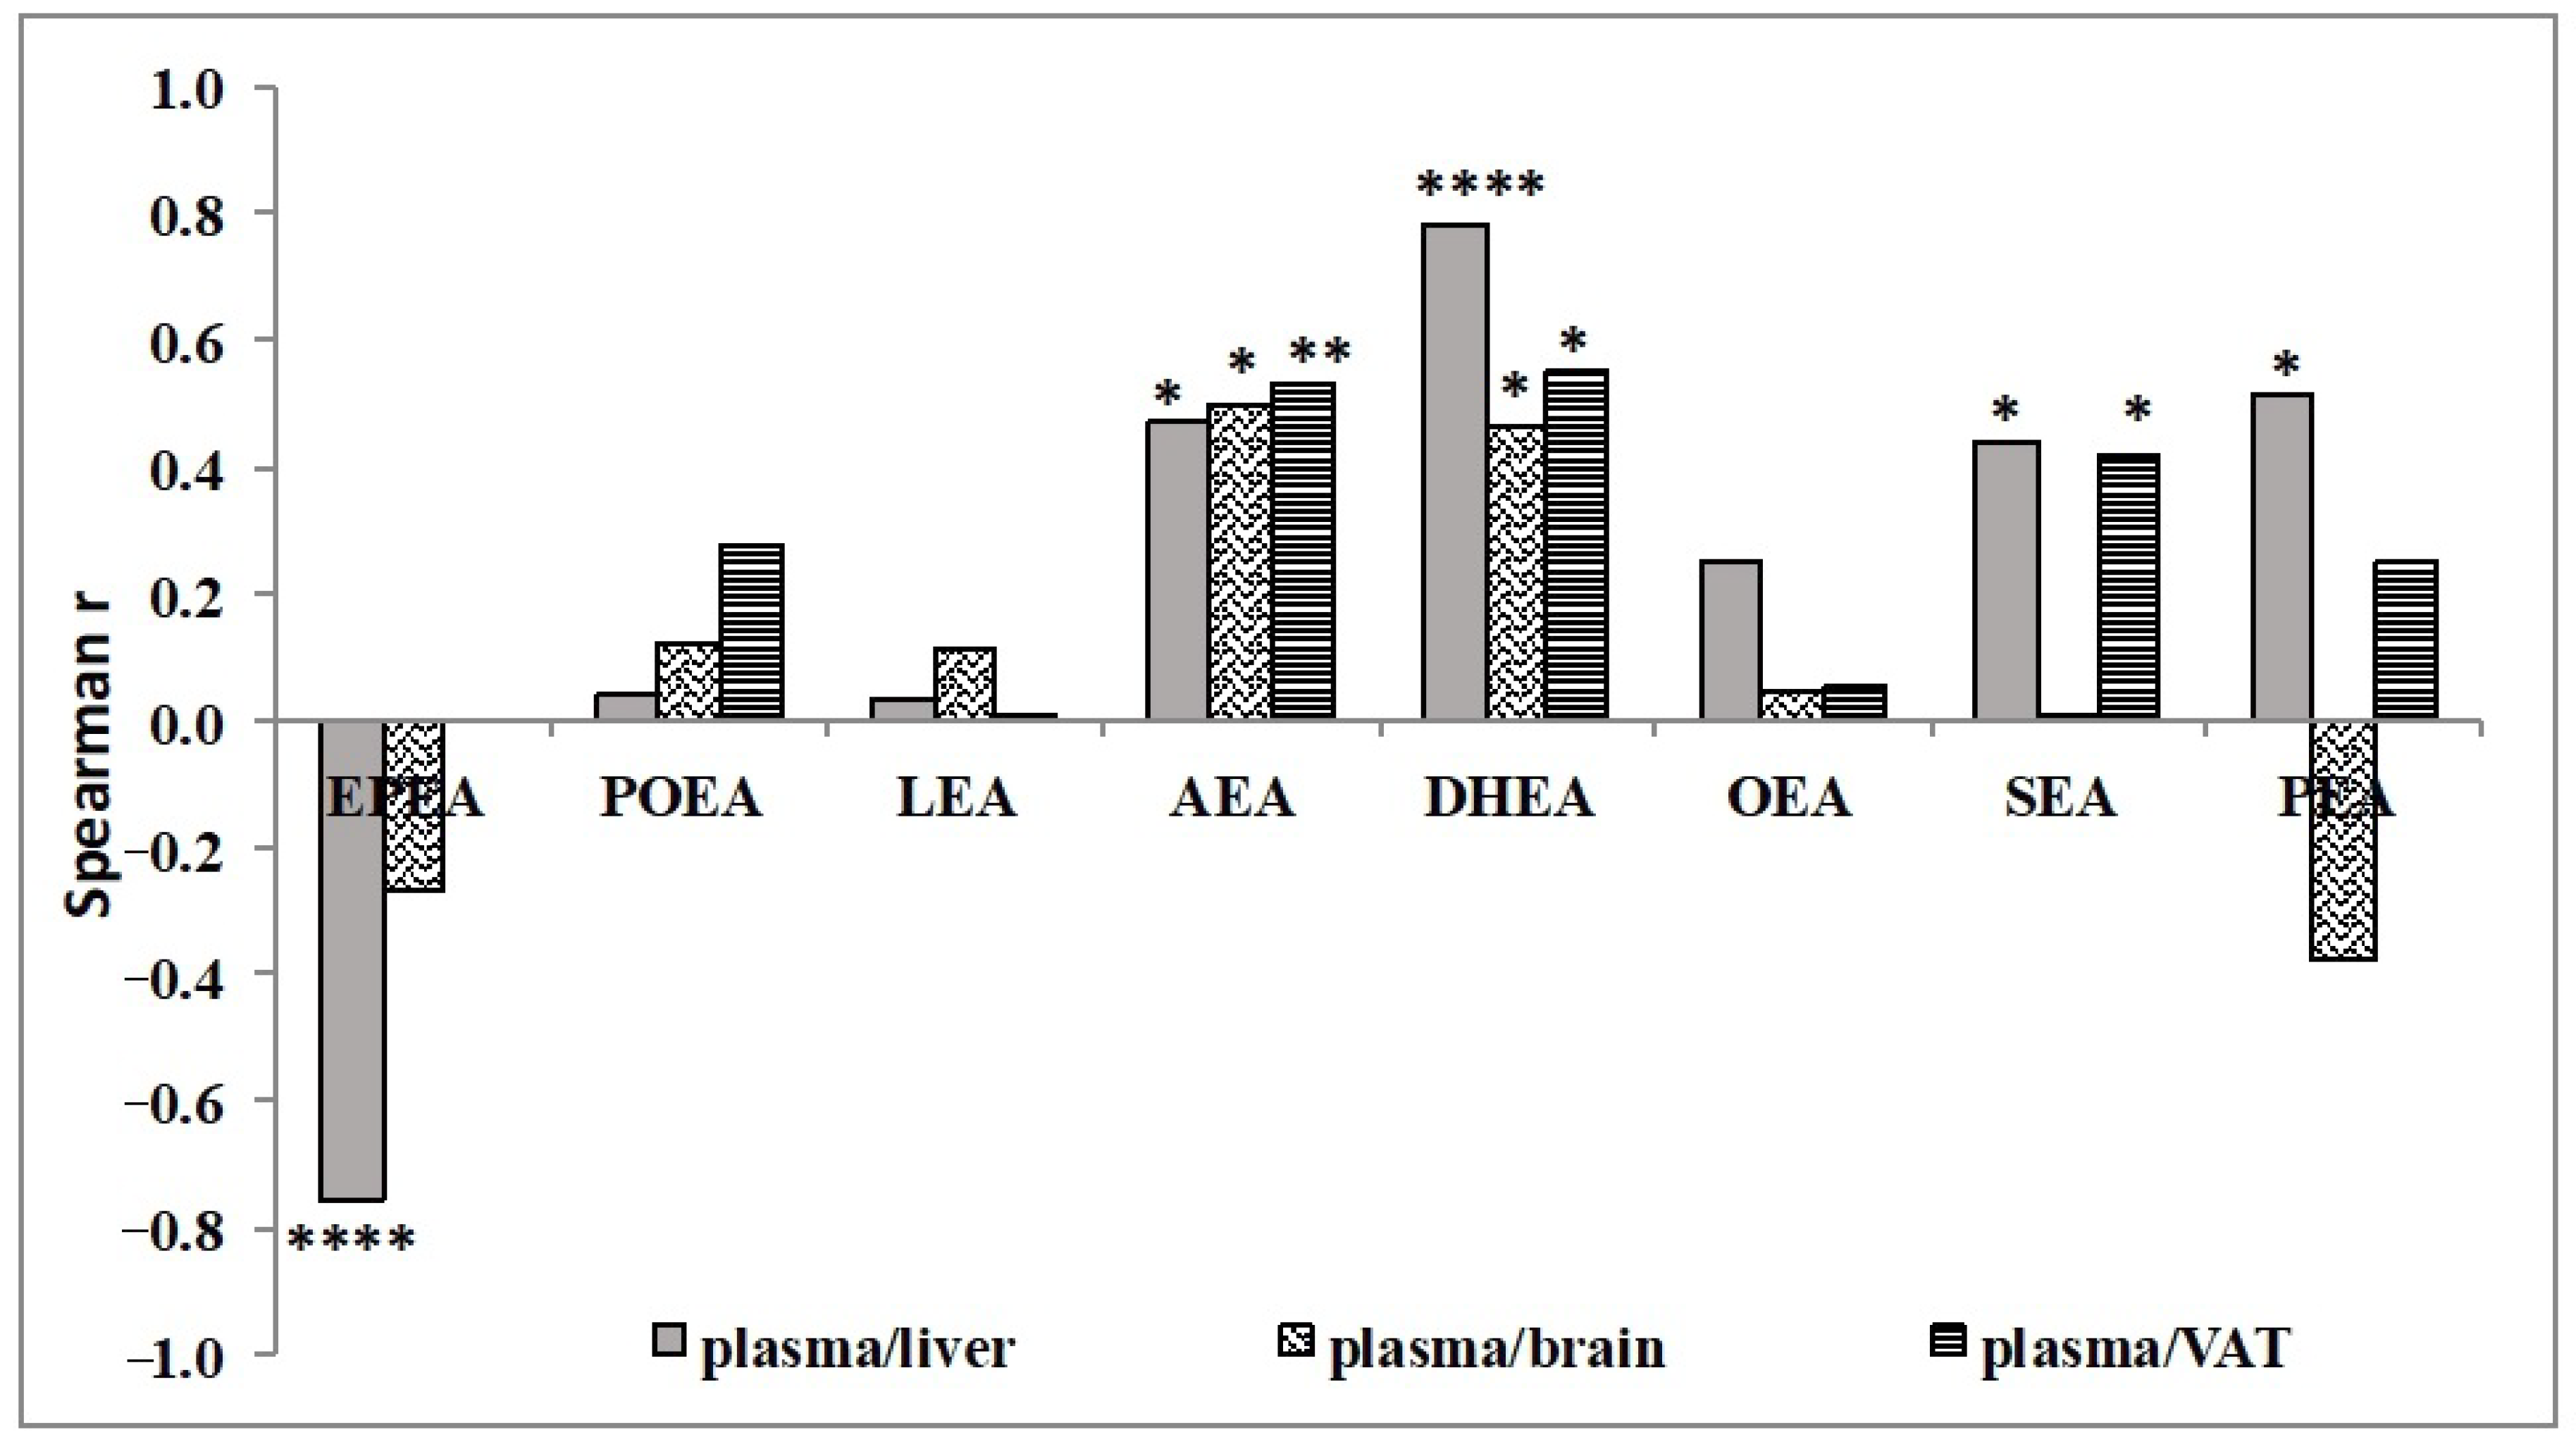
3.2. Effect of n-3 PUFA Diets on the Levels of NAE in Different Tissues
4. Discussion
Author Contributions
Funding
Institutional Review Board Statement
Informed Consent Statement
Data Availability Statement
Conflicts of Interest
Abbreviations
| AA | arachidonic acid |
| AEA | N-arachidonoylethanolamide or anandamide |
| ALA | α-linolenic acid |
| Buglos | Buglossoides arvensis oil |
| CE | collision energy |
| CV | cone voltage |
| DAD | diode array detector |
| DHA | docosahexaenoic acid |
| DHEA | N-docosahexaenoylethanolamide |
| DPA | docosapentanoic acid |
| DTA | docosatetraenoic acid |
| EPA | eicosapentaenoic acid |
| EPEA | N-eicosapentaenoylethanolamide |
| ESI | electrospray ionization |
| ETA | eicosatrienoic acid |
| FA | fatty acids |
| FAMEs | fatty acid methyl esters |
| FID | flame ionization detector |
| FO | fish oil |
| GLA | γ-linolenic acid |
| HUFA | high unsaturated fatty acids |
| LA | linoleic acid |
| LAA | lauric acid |
| LEA | N-linoleoylethanolamide |
| LSO | linseed oil |
| MA | myristic acid |
| MilkFat | milk fat diet |
| MRM | multiple reaction monitoring |
| MS | mass spectrometry |
| NAE | N-acylethanolamides |
| Nanno | Nannochloropsis microalga oil |
| OA | oleic acid |
| OEA | N-oleoylethanolamide |
| PEA | N-palmitoylethanolamine |
| PI | product ion |
| PUFA | polyunsaturated fatty acids |
| SAFA | saturated fatty acids |
| Schy | Schizochytrium microalga oil |
| SDA | stearidonic acid |
| SA | stearic acid |
| SEA | N-stearoylethanolamide |
| VAT | visceral adipose tissue. |
References
- Murru, E.; Banni, S.; Carta, G. Nutritional properties of dietary omega-3-enriched phospholipids. Biomed. Res. Int. 2013, 13, 965417. [Google Scholar] [CrossRef]
- Burdge, G.C.; Calder, P.C. Dietary alpha-linolenic acid and health-related outcomes: A metabolic perspective. Nutr. Res. Rev. 2006, 19, 26–52. [Google Scholar] [CrossRef] [PubMed]
- Witard, O.C.; Combet, E.; Gray, S.R. Long-chain n-3 fatty acids as an essential link between musculoskeletal and cardio-metabolic health in older adults. Proc. Nutr. Soc. 2020, 79, 47–55. [Google Scholar] [CrossRef] [PubMed]
- Voss, A.; Reinhart, M.; Sankarappa, S.; Sprecher, H. The metabolism of 7,10,13,16,19-docosapentaenoic acid to 4,7,10,13,16,19-docosahexaenoic acid in rat liver is independent of a 4-desaturase. J. Biol. Chem. 1991, 266, 19995–20000. [Google Scholar] [CrossRef]
- Mantzioris, E.; James, M.J.; Gibson, R.A.; Cleland, L.G. Dietary substitution with an alpha-linolenic acid-rich vegetable oil increases eicosapentaenoic acid concentrations in tissues. Am. J. Clin. Nutr. 1994, 59, 1304–1309. [Google Scholar] [CrossRef] [PubMed]
- Yamazaki, K.; Fujikawa, M.; Hamazaki, T.; Yano, S.; Shono, T. Comparison of the conversion rates of α-linolenic acid (18:3 (n−3)) and stearidonic acid (18:4 (n−3)) to longer polyunsaturated fatty acids in rats. Biochim. Biophys. Acta 1992, 1123, 18. [Google Scholar] [CrossRef]
- Huang, Y.S.; Smith, R.S.; Redden, P.R.; Cantrill, R.C.; Horrobin, D.F. Modification of liver fatty acid metabolism in mice by n-3 and n-6 delta 6-desaturase substrates and products. Biochim. Biophys. Acta 1991, 1082, 319–327. [Google Scholar] [CrossRef]
- Schuchardt, J.P.; Schneider, I.; Meyer, H.; Neubronner, J.; von Schacky, C.; Hahn, A. Incorporation of EPA and DHA into plasma phospholipids in response to different omega-3 fatty acid formulations—A comparative bioavailability study of fish oil vs. krill oil. Lipids Health Dis. 2011, 10, 145. [Google Scholar] [CrossRef]
- Walker, C.G.; Jebb, S.A.; Calder, P.C. Stearidonic acid as a supplemental source of ω-3 polyunsaturated fatty acids to enhance status for improved human health. Nutrition 2013, 29, 363–369. [Google Scholar] [CrossRef]
- James, M.J.; Ursin, V.M.; Cleland, L.G. Metabolism of stearidonic acid in human subjects: Comparison with the metabolism of other n-3 fatty acids. Am. J. Clin. Nutr. 2003, 77, 1140–1145. [Google Scholar] [CrossRef]
- Krul, E.S.; Lemke, S.L.; Mukherjea, R.; Taylor, M.L.; Goldstein, D.A.; Su, H.; Liu, P.; Lawless, A.; Harris, W.S.; Maki, K.C. Effects of duration of treatment and dosage of eicosapentaenoic acid and stearidonic acid on red blood cell eicosapentaenoic acid content. Prostaglandins Leukot. Essent. Fatty Acids 2012, 86, 51–59. [Google Scholar] [CrossRef] [PubMed]
- Harris, W.S.; Lemke, S.L.; Hansen, S.N.; Goldstein, D.A.; DiRienzo, M.A.; Su, H.; Nemeth, M.A.; Taylor, M.L.; Ahmed, G.; George, J. Stearidonic acid-enriched soybean oil increased the omega-3 index, an emerging cardiovascular risk marker. Lipids 2008, 43, 805–811. [Google Scholar] [CrossRef] [PubMed]
- Prasad, P.; Anjali, P.; Sreedhar, R.V. Plant-based stearidonic acid as sustainable source of omega-3 fatty acid with functional outcomes on human health. Crit. Rev. Food Sci. Nutr. 2020, 20, 1–13. [Google Scholar] [CrossRef]
- Cardoso, C.; Martinho, J.P.; Lopes, P.A.; Martins, S.; Correia, J.; Afonso, C.; Alarcónd, F.J.; González-Fernández, M.J.; Pinto, R.M.; Prates, J.A.; et al. Stearidonic acid combined with alpha-linolenic acid improves lipemic and T neurological markers in a rat model subject to a hypercaloric diet. Prostaglandins Leukot. Essent. Fatty Acids 2018, 135, 137–146. [Google Scholar] [CrossRef]
- Murru, E.; Carta, G.; Cordeddu, L.; Melis, M.P.; Desogus, E.; Ansar, H.; Chilliard, Y.; Ferlay, A.; Stanton, C.; Coakley, M.; et al. Dietary Conjugated Linoleic Acid-Enriched Cheeses Influence the Levels of Circulating n-3 Highly Unsaturated Fatty Acids in Humans. Int. J. Mol. Sci. 2018, 19, 1730. [Google Scholar] [CrossRef]
- Martins, D.A.; Custodio, L.; Barreira, L.; Pereira, H.; Ben-Hamadou, R.; Varela, J.; Abu-Salah, K.M. Alternative Sources of n-3 Long-Chain Polyunsaturated Fatty Acids in Marine Microalgae. Mar. Drugs 2013, 11, 2259–2281. [Google Scholar] [CrossRef]
- Khozin-Goldberg, I.; Iskandarov, U.; Cohen, Z. LC-PUFA from photosynthetic microalgae: Occurrence, biosynthesis, and prospects in biotechnology. Appl. Microbiol. Biotechnol. 2011, 91, 905–915. [Google Scholar] [CrossRef]
- Apt, K.E.; Behrens, P.W. Commercial developments in microalgal biotechnology. J. Phycol. 1999, 35, 215–226. [Google Scholar] [CrossRef]
- Lopes, P.A.; Bandarra, N.M.; Martins, S.V.; Martinho, J.; Alfaia, C.M.; Madeira, M.S.; Cardoso, C.; Afonso, C.; Paulo, M.C.; Pinto, R.M.A.; et al. Markers of neuroprotection of combined EPA and DHA provided by fish oil are higher than those of EPA (Nannochloropsis) and DHA (Schizochytrium) from microalgae oils in Wistar rats. Nutr. Metab. 2017, 14, 62. [Google Scholar] [CrossRef]
- Carpentier, Y.A.; Portois, L.; Malaisse, W.J. n-3 fatty acids and the metabolic syndrome. Am. J. Clin. Nutr. 2006, 83, 1499s–1504s. [Google Scholar] [CrossRef] [PubMed]
- Wang, D.D.; Wu, F.; Zhang, L.Y.; Zhao, Y.C.; Wang, C.C.; Xue, C.H.; Yanagita, T.; Zhang, T.T.; Wang, Y.M. Effects of dietary n-3 PUFA levels in early life on susceptibility to high-fat-diet-induced metabolic syndrome in adult mice. J. Nutr. Biochem. 2020, 89, 108578. [Google Scholar] [CrossRef]
- Watson, J.E.; Kim, J.S.; Das, A. Emerging class of omega-3 fatty acid endocannabinoids & their derivatives. Prostaglandins Other Lipid Mediat. 2019, 143, 106337. [Google Scholar] [CrossRef]
- Kim, H.Y.; Spector, A.A. Synaptamide, endocannabinoid-like derivative of docosahexaenoic acid with cannabinoid-independent function. Prostaglandins Leukot. Essent. Fatty Acids 2013, 88, 121–125. [Google Scholar] [CrossRef]
- Hansen, H.S.; Artmann, A. Endocannabinoids and nutrition. J. Neuroendocr. 2008, 20, 94–99. [Google Scholar] [CrossRef] [PubMed]
- Piscitelli, F.; Carta, G.; Bisogno, T.; Murru, E.; Cordeddu, L.; Berge, K.; Tandy, S.; Cohn, J.S.; Griinari, M.; Banni, S.; et al. Effect of dietary krill oil supplementation on the endocannabinoidome of metabolically relevant tissues from high-fat-fed mice. Nutr. Metab. 2011, 8, 51. [Google Scholar] [CrossRef] [PubMed]
- Batetta, B.; Griinari, M.; Carta, G.; Murru, E.; Ligresti, A.; Cordeddu, L.; Giordano, E.; Sanna, F.; Bisogno, T.; Uda, S.; et al. Endocannabinoids May Mediate the Ability of (n-3) Fatty Acids to Reduce Ectopic Fat and Inflammatory Mediators in Obese Zucker Rats. J. Nutr. 2009, 139, 1495–1501. [Google Scholar] [CrossRef] [PubMed]
- Banni, S.; Carta, G.; Murru, E.; Cordeddu, L.; Giordano, E.; Sirigu, A.R.; Berge, K.; Vik, H.; Maki, K.C.; Di Marzo, V.; et al. Krill oil significantly decreases 2-arachidonoylglycerol plasma levels in obese subjects. Nutr. Metab. 2011, 8, 1–6. [Google Scholar] [CrossRef]
- Berge, K.; Piscitelli, F.; Hoem, N.; Silvestri, C.; Meyer, I.; Banni, S.; Di Marzo, V. Chronic treatment with krill powder reduces plasma triglyceride and anandamide levels in mildly obese men. Lipids Health Dis. 2013, 12, 78. [Google Scholar] [CrossRef]
- Matias, I.; Carta, G.; Murru, E.; Petrosino, S.; Banni, S.; Di Marzo, V. Effect of polyunsaturated fatty acids on endocannabinoid and N-acyl-ethanolamine levels in mouse adipocytes. Bba-Mol. Cell Biol. L 2008, 1781, 52–60. [Google Scholar] [CrossRef]
- Naughton, S.S.; Mathai, M.L.; Hryciw, D.H.; McAinch, A.J. Fatty Acid Modulation of the Endocannabinoid System and the Effect on Food Intake and Metabolism. Int. J. Endocrinol. 2013. [Google Scholar] [CrossRef]
- Kim, J.; Carlson, M.E.; Watkins, B.A. Docosahexaenoyl ethanolamide improves glucose uptake and alters endocannabinoid system gene expression in proliferating and differentiating C2C12 myoblasts. Front. Physiol. 2014, 5, 100. [Google Scholar] [CrossRef] [PubMed]
- Bosier, B.; Muccioli, G.G.; Hermans, E.; Lambert, D.M. Functionally selective cannabinoid receptor signalling: Therapeutic implications and opportunities. Biochem. Pharm. 2010, 80, 1–12. [Google Scholar] [CrossRef] [PubMed]
- Folch, J.; Lees, M.; Sloane Stanley, G.H. A simple method for the isolation and purification of total lipides from animal tissues. J. Biol. Chem. 1957, 226, 497–509. [Google Scholar] [CrossRef]
- Chiang, S.; Gessert, C.; Lowry, O. Colorimetric determination of extracted lipids. An adaptation for microgram amounts of lipids obtained from cerumen. Curr. List Med. Lit. Res. Rep. 1957, 33, 56–113. [Google Scholar]
- Banni, S.; Carta, G.; Angioni, E.; Murru, E.; Scanu, P.; Melis, M.P.; Bauman, D.E.; Fischer, S.M.; Ip, C. Distribution of conjugated linoleic acid and metabolites in different lipid fractions in the rat liver. J. Lipid Res. 2001, 42, 1056–1061. [Google Scholar] [CrossRef]
- Melis, M.P.; Angioni, E.; Carta, G.; Murru, E.; Scanu, P.; Spada, S.; Banni, S. Characterization of conjugated linoleic acid and its metabolites by RP-HPLC with diode array detector. Eur. J. Lipid Sci. Technol. 2001, 103, 617–621. [Google Scholar] [CrossRef]
- Demar, J.J.C.; Ma, K.; Chang, L.; Bell, J.M.; Rapoport, S.I. Alpha-Linolenic acid does not contribute appreciably to docosahexaenoic acid within brain phospholipids of adult rats fed a diet enriched in docosahexaenoic acid. J. Neurochem. 2005, 94, 1063–1076. [Google Scholar] [CrossRef] [PubMed]
- Rapoport, S.I.; Rao, J.S.; Igarashi, M. Brain metabolism of nutritionally essential polyunsaturated fatty acids depends on both the diet and the liver. Prostaglandins Leukotr. Essent. Fatty Acids 2007, 77, 251–261. [Google Scholar] [CrossRef]
- Igarashi, M.; Ma, K.; Chang, L.; Bell, J.M.; Rapoport, S.I. Rat heart cannot synthesize docosahexaenoic acid from circulating a-linolenic acid be- cause it lacks elongase-2. J. Lipid Res. 2008, 49, 1735–1745. [Google Scholar] [CrossRef] [PubMed]
- Igarashi, M.; Ma, K.; Chang, L.; Bell, J.M.; Rapoport, S.I.; DeMar, J.C., Jr. Low liver conversion rate of alpha-linolenic to docosahexaenoic acid in awake rats on a high-docosahexaenoate-containing diet. J. Lipid Res. 2006, 47, 1812–1822. [Google Scholar] [CrossRef]
- Wang, Y.; Botolin, D.; Christian, B.; Busik, J.; Xu, J.; Jump, D.B. Tissue-specific, nutritional, and developmental regulation of rat fatty acid elongases. J. Lipid Res. 2005, 46, 706–715. [Google Scholar] [CrossRef]
- Igarashi, M.; DeMar, J.C., Jr.; Ma, K.; Chang, L.; Bell, J.M.; Rapoport, S.I. Upregulated liver conversion of alpha-linolenic acid to docosahexaenoic acid in rats on a 15 week n-3 PUFA-deficient diet. J. Lipid Res. 2007, 48, 152–164. [Google Scholar] [CrossRef]
- Bandarra, N.M.; Lopes, P.A.; Martins, S.V.; Ferreira, J.; Alfaia, C.M.; Rolo, E.A.; Correia, J.J.; Pinto, R.M.A.; Ramos-Bueno, R.P.; Batista, I.; et al. Docosahexaenoic acid at the sn-2 position of structured triacylglycerols improved n-3 polyunsaturated fatty acid assimilation in tissues of hamsters. Nutr. Res. 2016, 36, 452–463. [Google Scholar] [CrossRef]
- Rodrigues, P.O.; Martins, S.V.; Lopes, P.A.; Ramos, C.; Migueis, S.; Alfaia, C.M.; Pinto, R.M.A.; Rolo, E.A.; Bispo, P.; Batista, I.; et al. Influence of feeding graded levels of canned sardines on the inflammatory markers and tissue fatty acid composition of Wistar rats. Br. J. Nutr. 2014, 112, 309–319. [Google Scholar] [CrossRef][Green Version]
- Stark, K.D. The Percentage of n-3 Highly Unsaturated Fatty Acids in TotalHUFA as a Biomarker for Omega-3 Fatty Acid Status in Tissues. Lipids 2008, 43, 45–53. [Google Scholar] [CrossRef] [PubMed]
- Molina-Holgado, E.; Molina-Holgado, F. Mending the broken brain: Neuroimmune interactions in neurogenesis. J. Neurochem. 2010, 114, 1277–1290. [Google Scholar] [CrossRef] [PubMed]
- Cassano, T.; Calcagnini, S.; Pace, L.; De Marco, F.; Romano, A.; Gaetani, S. Cannabinoid Receptor 2 Signaling in Neurodegenerative Disorders: From Pathogenesis to a Promising Therapeutic Target. Front. Neurosci. 2017, 11, 30. [Google Scholar] [CrossRef] [PubMed]
- Bonnet, A.E.; Marchalant, Y. Potential Therapeutical Contributions of the Endocannabinoid System towards Aging and Alzheimer’s Disease. Aging Dis. 2015, 6, 400–405. [Google Scholar] [CrossRef] [PubMed]
- Banni, S.; Di Marzo, V. Effect of dietary fat on endocannabinoids and related mediators: Consequences on energy homeostasis, inflammation and mood. Mol. Nutr. Food Res. 2010, 54, 82–92. [Google Scholar] [CrossRef]
- Maccarrone, M.; Dainese, E.; Oddi, S. Intracellular trafficking of anandamide: New concepts for signaling. Trends Biochem. Sci. 2010, 35, 601–608. [Google Scholar] [CrossRef]
- Brown, I.; Cascio, M.G.; Rotondo, D.; Pertwee, R.G.; Heys, S.D.; Wahle, K.W.J. Cannabinoids and omega-3/6 endocannabinoids as cell death and anticancer modulators. Prog. Lipid Res. 2013, 52, 80–109. [Google Scholar] [CrossRef]
- Brown, I.; Cascio, M.G.; Wahle, K.W.J.; Smoum, R.; Mechoulam, R.; Ross, R.A.; Pertwee, R.G.; Heys, S.D. Cannabinoid receptor-dependent and -independent anti-proliferative effects of omega-3 ethanolamides in androgen receptor-positive and -negative prostate cancer cell lines. Carcinogenesis 2010, 31, 1584–1591. [Google Scholar] [CrossRef] [PubMed]
- Pacher, P.; Batkai, S.; Kunos, G. The Endocannabinoid System as an Emerging Target of Pharmacotherapy. Pharmacol. Rev. 2006, 58, 389–462. [Google Scholar] [CrossRef] [PubMed]
- Jin, X.H.; Okamoto, Y.; Morishita, J.; Tsuboi, K.; Tonai, T.; Ueda, N. Discovery and characterization of Ca2+-independent phosphatidylethanolarnine N-acyltransferase generating the anandarnide precursor and its congeners. J. Biol. Chem. 2007, 282, 3614–3623. [Google Scholar] [CrossRef]
- Fisk, H.L.; Childs, C.E.; Miles, E.A.; Ayres, R.; Noakes, P.S.; Paras-Chavez, C.; Kuda, O.; Kopecky, J.; Antoun, E.; Lillycrop, K.A.; et al. Dysregulation of endocannabinoid concentrations in human subcutaneous adipose tissue in obesity and modulation by omega-3 polyunsaturated fatty acids. Clin. Sci. 2021, 135, 185–200. [Google Scholar] [CrossRef]


| FA | MilkFat | LSO | Buglos | FO | Nanno | Schy |
|---|---|---|---|---|---|---|
| 8:0 | 2.7 | 1.87 | 3.24 | 1.94 | 2.56 | 3.16 |
| 10:0 | 5.99 | 6.37 | 8.06 | 4.42 | 4.44 | 5.02 |
| 12:0 | 2.34 | 3.5 | 3.69 | 2.17 | 2.79 | 1.23 |
| 14:0 | 8.6 | 7.24 | 8.75 | 9.05 | 8.07 | 8.84 |
| 15:0 | 18:57 | 0.74 | 0.75 | ND | ND | 2.16 |
| 16:0 | 27.43 | 25.29 | 25.00 | 27.82 | 25.94 | 29.12 |
| 16:1n-7 | 0.99 | 0.92 | 0.93 | 2.41 | 4.69 | 1.13 |
| 17:0 | ND | 0.38 | ND | 0.37 | 0.34 | 0.66 |
| 18:0 | 4.43 | 4.31 | 3.55 | 5.58 | 7.34 | 5.19 |
| 18:1n-9 | 20.39 | 20.87 | 17.7 | 21.82 | 19.35 | 19.43 |
| 18:1n-7 | 0.55 | 0.88 | 0.41 | 0.98 | 0.44 | 0.68 |
| 18:2n-6 | 21.33 | 15.91 | 14.01 | 13.79 | 16.48 | 16.06 |
| 18:3n-6 | ND | ND | 1.54 | ND | ND | ND |
| 18:3n-3 | 2.61 | 10.78 | 7.82 | 1.72 | 1.88 | 1.94 |
| 18:4n-3 | 0.26 | 0.14 | 2.53 | 0.33 | 0.25 | ND |
| 20:4n-6 | ND | ND | ND | ND | 0.75 | ND |
| 20:5n-3 | ND | ND | ND | 1.4 | 4.45 | ND |
| 22:1n-11 | ND | ND | ND | 0.98 | ND | ND |
| 22:6n-3 | ND | ND | ND | 1.49 | ND | 4.08 |
| Others | 1.59 | 0.86 | 2.02 | 1.88 | 0.2 | 1.34 |
| Oil % | 17.92 | 17.67 | 17.02 | 17.47 | 16.26 | 16.76 |
| SUM | 98.41 | 99.2 | 97.98 | 98.12 | 99.85 | 98.70 |
| FA | MilkFat | LSO | Buglos | FO | Nanno | Schy |
|---|---|---|---|---|---|---|
| ALA, 18:3n-3 | 1.5 ± 0.3 a,b | 4.8 ± 0.1 a | 3.0 ± 0.4 a | 0.9 ± 0.0 a,b | 0.9 ± 0.1 a,b | 0.7 ± 0.1 b |
| SDA, 18:4n-3 | 0.1 ± 0.0 a | 0.1 ± 0.0 a | 0.3 ± 0.0 a | 0.1 ± 0.0 a | ND | ND |
| EPA, 20:5n-3 | 0.4 ± 0.1 b | 1.8 ± 0.1 a,b | 1.5 ± 0.1 a,b | 3.7 ± 0.1 a | 3.9 ± 0.2 a | 0.9 ± 0.1 a,b |
| DPA, 22:5n-3 | ND | 1.5 ± 0.2 a | 1.0 ± 0.2 a | 1.6 ± 0.3 a | 1.5 ± 0.2 a | ND |
| DHA, 22:6n-3 | 1.0 ± 0.1 a,b | 1.2 ± 0.1 a,b | 0.9 ± 0.1 a,b | 3.6 ± 0.1 a | 0.6 ± 0.0 b | 3.4 ± 0.2 a |
| LA, 18:2n-6 | 23.2 ± 0.8 a | 21.7 ± 0.4 a,b | 20.1 ± 0.5 a,b | 20.6 ± 0.4 a,b | 21.5 ± 0.3 a,b | 15.2 ± 0.6 b |
| GLA, 18:3n-6 | 0.3 ± 0.0 a,b | 0.2 ± 0.0 a,b | 0.7 ± 0.1 a | 0.1 ± 0.0 b | 0.2 ± 0.0 a,b | 0.1 ± 0.0 b |
| ETA, 20:3n-6 | 1.1 ± 0.2 a,b | 0.8 ± 0.1 b | 1.9 ± 0.2 a,b | 0.9 ± 0.0 a,b | 0.8 ± 0.1 a,b | 2.5 ± 0.1 a |
| AA, 20:4n-6 | 11.3 ± 0.7 a | 8.4 ± 0.4 a,b | 8.4 ± 0.2 a,b | 6.2 ± 0.3 b | 12.1 ± 0.9 a | 10.6 ± 0.1 a,b |
| 14:1 n-7 | 0.2 ± 0.0 a | 0.2 ± 0.0 a | 0.3 ± 0.0 a | 0.4 ± 0.1 a | 0.2 ± 0.0 a | 0.3 ± 0.0 a |
| POA, 16:1n-7 | 1.4 ± 0.2 a | 1.6 ± 0.1 a | 1.3 ± 0.1 a | 2.1 ± 0.2 a | 1.8 ± 0.3 a | 1.4 ± 0.3 a |
| OA, 18:1n-9 | 13.8 ± 1.0 a,b | 15.8 ± 0.4 a | 14.7 ± 0.3 a,b | 15.9 ± 0.2 a | 13.0 ± 0.7 a,b | 10.9 ±0.6 b |
| MA, 14:0 | 2.1 ± 0.3 a,b | 0.9 ± 0.3 b | 1.4 ± 0.3 a,b | 1.8 ± 0.4 a,b | 1.8 ± 0.1 a,b | 2.8 ± 0.3 a |
| PA, 16:0 | 26.8 ± 0.2 a,b | 25.3 ± 0.4 b | 27.1 ± 0.4 a,b | 28.5 ± 0.7 a,b | 27.8 ± 0.3 a,b | 31.2 ± 0.8 a |
| SA, 18:0 | 13.4 ± 0.5 a,b | 13.2 ± 0.4 a,b | 13.6 ± 0.9 a,b | 11.1 ± 0.3 b | 11.5 ± 0.3 a,b | 14.7 ± 1.0 a |
| SAFA | 42.3 ± 0.5 a,b | 39.4 ± 0.4 b | 42.1 ± 0.8 a,b | 41.5 ± 0.7 a,b | 41.1 ± 0.5 a,b | 48.7 ± 0.7 a |
| MUFA | 15.4 ± 1.1 a,b | 17.7 ± 0.5 a,b | 16.3 ± 0.3 a,b | 18.4 ± 0.2 a | 15.1 ± 0.9 a,b | 12.7 ± 0.7 b |
| PUFA | 39.0 ± 1.8 a,b | 40.3 ± 1.1 a,b | 37.7 ± 1.7 a,b | 37.5 ± 0.6 a,b | 41.7 ± 0.7 a | 33.8 ± 1.2 b |
| PUFAn-3 | 2.9 ± 0.4 b | 9.0 ± 0.6 a | 6.4 ± 0.8 a,b | 9.5 ± 0.4 a | 6.9 ± 0.4 a,b | 5.3 ± 0.4 a,b |
| PUFAn-6 | 35.9 ± 0.7 a | 31.0 ± 0.6 a,b,c | 31.1 ± 0.8 a,b | 27.7 ± 0.5 b | 34.6 ± 1.0 a,c | 28.4 ± 0.8 b,c |
| n-6/n-3 PUFA | 12.8 ± 1.4 a | 3.5 ± 0.2 b | 5.1 ± 0.7 a,b | 2.9 ± 0.2 b | 5.0 ± 0.4 a,b | 5.4 ± 0.3 a,b |
| n-3 HUFA score | 0.1 ± 0.0 a | 0.3 ± 0.0 a,b | 0.2 ± 0.0 a,b | 0.5 ± 0.0 b | 0.3 ± 0.0 a,b | 0.3 ± 0.0 a,b |
| FA | MilkFat | LSO | Buglos | FO | Nanno | Schy |
|---|---|---|---|---|---|---|
| ALA, 18:3n3 | 1.7 ±0.1 a,b | 8.6 ± 0.2 a | 5.5 ± 0.2 a | 1.7 ± 0.0 a,b | 2.0 ± 0.2 a,b | 1.0 ± 0.1 b |
| SDA, 18:4n-3 | 0.2 ± 0.0 a,b,c | 0.3 ± 0.0 a,b | 1.2 ± 0.1 a | 0.2 ± 0.0 a,b,c | 0.1 ± 0.0 b,c | 0.05 ± 0.01 c |
| EPA, 20:5n-3 | 0.5 ± 0.0 b | 1.7 ± 0.2 a,b | 2.0 ± 0.0 a,b | 3.7 ± 0.1 a | 3.7 ± 0.2 a | 1.2 ± 0.2 a,b |
| DPA, 22:5n-3 | 1.2 ± 0.3 b,c | 2.3 ± 0.1 a,b | 1.9 ± 0.1 a,b | 2.5 ± 0.1 a,c | 3.1 ± 0.1 a | 0.8 ± 0.0 b |
| DHA, 22:6n-3 | 1.6 ± 0.1 b,c | 2.4 ± 0.1 a,b,c | 2.2 ± 0.1 a,b,c | 7.4 ± 0.1 a,b | 1.2 ± 0.0 c | 9.0 ± 0.1 a |
| LA, 18:2n-6 | 29.9 ± 1.2 a | 23.7 ± 0.3 a,b | 24.7 ± 0.7 a,b | 19.3 ± 0.5 b | 22.3 ± 0.7 a,b | 20.7 ± 0.6 b |
| GLA, 18:3n-6 | 1.0 ± 0.2 a,b | ND | 2.1 ± 0.3 a | ND | ND | 0.3 ± 0.0 b |
| ETA, 20:3n-6 | 1.3 ± 0.1 a,b | 1.0 ± 0.1 a,b | 1.9 ± 0.2a | 0.7 ± 0.0 b | 1.0 ± 0.1 a,b | 3.1 ± 0.1 a |
| AA, 20:4n-6 | 6.5 ± 0.1 a,b | 5.0 ± 0.6 a,b | 5.1 ± 0.1 a,b | 4.6 ± 0.1 b | 8.0 ± 0.7 a | 9.5 ± 0.5 a |
| DTA, 22:4n-6 | 0.2 ± 0.0 a | 0.1 ± 0.0 a,b | 0.1 ± 0.0 a,b | 0.2 ± 0.1 a,b | 0.1 ± 0.0 a,b | 0.1 ± 0.0 b |
| POA, 16:1n7 | 3.5 ± 0.5 a | 2.6 ± 0.1 a | 3.0 ± 0.2 a | 4.0 ± 0.3 a | 4.7 ± 0.9 a | 2.7 ± 0.1 a |
| OA, 18:1n-9 | 14.8 ± 0.6 a,b | 16.2 ± 0.5 a | 14.4 ± 0.6 a,b | 17.0 ± 0.6 a | 14.6 ± 1.2 a,b | 10.9 ± 0.2 b |
| LAA, 12:0 | 0.1 ± 0.0 a,b | 0.1 ± 0.0 a,b | 0.1 ± 0.0 a | 0.1 ± 0.0 a,b | 0.1 ± 0.0 a,b | 0.05 ± 0.0 b |
| MA, 14:0 | 1.7 ± 0.1 a | 1.8 ± 0.0 a | 1.9 ± 0.2 a | 2.0 ± 0.1 a | 1.7 ± 0.2 a | 1.0 ± 0.1 a |
| PA, 16:0 | 24.3 ± 0.2 a,b | 23.2 ± 0.2 b | 24.0 ± 0.5 a,b | 26.8 ± 0.6 a | 24.9 ± 0.4 a,b | 26.4 ± 0.5 a |
| SA, 18:0 | 8.5 ± 0.9 a,b | 8.0 ± 0.4 b | 10.2 ± 0.8 a,b | 8.6 ± 0.1 a,b | 10.1 ± 1.1 a,b | 11.7 ± 0.4 a |
| SAFA | 34.6 ± 0.9 a,b | 33.5 ± 0.5 b | 36.2 ± 1.1 a,b | 37.5 ± 0.8 a,b | 36.9 ± 1.3 a,b | 39.1 ± 0.4 a |
| MUFA | 18.3 ± 0.9 a,b | 18.8 ± 0.5 a,b | 17.4 ± 0.7 a,b | 21.0 ± 0.7 a | 19.3 ± 2.1 a,b | 13.7 ± 0.3 b |
| PUFA | 44.3 ± 1.0 a,b | 45.5 ± 0.9 a,b | 47.2 ± 0.8 a | 40.7 ± 0.6 b | 42.0 ± 1.1 a,b | 45.9 ± 0.4 a,b |
| PUFAn-3 | 5.1 ± 0.3 b | 15.4 ± 0.2 a | 12.9 ± 0.2 a,b | 15.5 ± 0.2 a | 10.2 ± 0.4 a,b | 12.1 ± 0.2 a,b |
| PUFAn-6 | 38.9 ± 1.3 a | 29.9 ± 0.7 a,b | 34.0 ± 0.7 a,b | 24.9 ± 0.6 b | 31.4 ± 1.3 a,b | 33.6 ± 0.3 a,b |
| n-6/n-3 PUFA | 7.7 ± 1.3 a | 1.9 ± 0.0 b | 2.6 ± 0.1 a,b | 1.6 ± 0.1 b | 3.1 ± 0.5 a,b | 2.8 ± 0.1 a,b |
| n-3 HUFA score | 0.3 ± 0.0 b | 0.5 ± 0.0 a,b | 0.5 ± 0.0 a,b | 0.7 ± 0.0 a | 0.5 ± 0.0 a,b | 0.5 ± 0.0 a,b |
| FA | MilkFat | LSO | Buglos | FO | Nanno | Schy |
|---|---|---|---|---|---|---|
| ALA, 18:3n3 | 0.04 ± 0.01 a | 0.05 ± 0.01 a | 0.06 ± 0.01 a | 0.04 ± 0.01 a | 0.04 ± 0.00 a | 0.04 ± 0.01 a |
| EPA, 20:5n-3 | 0.01 ± 0.00 b | 0.04 ± 0.00 a,b | 0.05 ± 0.00 a,b | 0.10 ± 0.01 a | 0.05 ± 0.00 a,b | 0.04 ± 0.00 b |
| DPA, 22:5n-3 | 0.37 ± 0.07 a,b | 0.50 ± 0.02 a,b | 0.53 ± 0.11 a,b | 0.62 ± 0.07 a,b | 0.65 ± 0.05 a | 0.27 ± 0.04 b |
| DHA, 22:6n-3 | 9.16 ± 0.26 a,b | 8.52 ± 0.14 b | 9.02 ± 0.05 a,b | 9.23 ± 0.40 a,b | 9.16 ± 0.25 a,b | 9.93 ± 0.33 a |
| LA, 18:2n-6 | 1.53 ± 0.13 a,b | 1.66 ± 0.05 a,b | 1.77 ± 0.06 a,b | 1.71 ± 0.05 a,b | 1.88 ± 0.09 a | 1.23 ± 0.04 b |
| ETA, 20:3n-6 | 0.36 ± 0.09 a,b | 0.39 ± 0.02 a,b | 0.62 ± 0.08 a | 0.49 ± 0.01 a,b | 0.31 ± 0.01 b | 0.34 ± 0.03 a,b |
| AA, 20:4n-6 | 9.55 ± 0.24 a | 8.06 ± 0.07 b | 8.99 ± 0.17 a,b | 7.88 ± 0.17 b | 8.88 ± 0.06 a,b | 8.43 ± 0.12 a,b |
| DTA, 22:4n-6 | 2.07 ± 0.04 a,b | 1.79 ± 0.02 a,b,c | 2.01 ± 0.03 a,b | 1.53 ± 0.02 c | 1.88 ± 0.01 a,b,c | 1.64 ± 0.07 b,c |
| DPA, 22:5n-6 | 0.52 ± 0.09 a | 0.21 ± 0.03 a,b | 0.24 ± 0.06 a,b | 0.14 ± 0.00 b | 0.27 ± 0.02 a,b | 0.61 ± 0.04 a |
| POA, 16:1n7 | 0.78 ± 0.06 a | 0.62 ± 0.05 a | 0.69 ± 0.04 a | 0.83 ± 0.05 a | 0.77 ± 0.03 a | 0.70 ± 0.02 a |
| OA, 18:1n-9 | 19.34 ± 0.84 a | 19.88 ± 0.39 a | 20.01 ± 0.36 a | 19.85 ± 0.81 a | 18.88 ± 0.47 a | 20.15 ± 0.73 a |
| LAA, 12:0 | 0.34 ± 0.03 a,b | 0.22 ± 0.02 b | 0.29 ± 0.02 a,b | 0.27 ± 0.03 a,b | 0.33 ± 0.02 a,b | 0.42 ± 0.04 a |
| MA, 14:0 | 2.21 ± 0.12 b | 3.06 ± 0.16 a | 2.29 ± 0.14 a,b | 2.71 ± 0.16 a,b | 2.53 ± 0.08 a,b | 2.31 ± 0.13 a,b |
| PA, 16:0 | 31.35 ± 0.43 a | 31.87 ± 0.14 a | 30.91 ± 0.38 a | 31.94 ± 0.69 a | 31.73 ± 0.13 a | 31.23 ± 0.27 a |
| SA, 18:0 | 19.57 ± 0.15 a | 20.18 ± 0.31 a | 19.89 ± 0.06 a | 20.14 ± 0.40 a | 19.79 ± 0.12 a | 19.64 ± 0.1 a |
| SAFA | 53.46 ± 0.52 a | 55.33 ± 0.31 a | 53.38 ± 0.46 a | 55.06 ± 1.12 a | 54.38 ± 0.19 a | 53.60 ± 0.29 a |
| MUFA | 20.12 ± 0.81 a | 20.50 ± 0.37 a | 20.70 ± 0.35 a | 20.68 ± 0.84 a | 19.65 ± 0.48 a | 20.85 ± 0.75 a |
| PUFA | 24.00 ± 0.48 a | 21.62 ± 0.17 b | 23.91 ± 0.16 a,b | 22.24 ± 0.68 a,b | 23.44 ± 0.48 a,b | 22.88 ± 0.36 a,b |
| PUFAn-3 | 9.59 ± 0.26 a | 9.12 ± 0.14 a | 9.65 ± 0.14 a | 9.99 ± 0.47 a | 9.90 ± 0.30 a | 10.28 ± 0.32 a |
| PUFAn-6 | 14.39 ± 0.28 a | 12.49 ± 0.08 a,b | 14.25 ± 0.14 a | 12.24 ± 0.22 b | 13.53 ± 0.19 a,b | 12.59 ± 0.12 a,b |
| n-6/n-3 PUFA | 1.50 ± 0.06 a | 1.37 ± 0.04 a,b | 1.48 ± 0.06a | 1.23 ± 0.08 b | 1.37 ± 0.05 a,b | 1.23 ± 0.08 b |
| n-3 HUFA score | 0.43 ± 0.01 b | 0.46 ± 0.01 a,b | 0.45 ± 0.01 a,b | 0.50 ± 0.02 a | 0.46 ± 0.01 a,b | 0.48 ± 0.02 a |
| FA | MilkFat | LSO | Buglos | FO | Nanno | Schy |
|---|---|---|---|---|---|---|
| ALA, 18:3n3 | 2.12 ± 0.06 a,b | 5.88 ± 0.76 a | 5.23 ± 0.80 a | 1.23 ± 0.12 b | 1.82 ± 0.07 a,b | 1.64 ± 0.06 a,b |
| SDA, 18:4n-3 | 0.01 ± 0.00 a,b | 0.01 ± 0.00 a,b | 0.55 ± 0.14 a | 0.09 ± 0.01 a,b | 0.01 ± 0.00 b | 0.01 ± 0.00 a,b |
| EPA, 20:5n-3 | 0.02 ± 0.00 b | 0.06 ± 0.01 a,b | 0.07 ± 0.01 a,b | 0.19 ± 0.02 a,b | 0.39 ± 0.01 a | 0.07 ± 0.01 a,b |
| DPA, 22:5n-3 | 0.06 ± 0.01 b | 0.12 ± 0.02 a,b | 0.06 ± 0.02 b | 0.21 ± 0.02 a,b | 0.34 ± 0.04 a | 0.11 ± 0.02 a,b |
| DHA, 22:6n-3 | 0.03 ± 0.00 b | 0.05 ± 0.00 b | 0.12 ± 0.01 a,b | 0.40 ± 0.01 a | 0.07 ± 0.01 a,b | 1.32 ± 0.08 a |
| LA, 18:2n-6 | 23.90 ± 0.17 a | 14.81 ± 1.62 b | 21.38 ± 1.49 a,b | 14.76 ± 0.79 b | 20.45 ± 0.83 a,b | 19.63 ± 0.78 a,b |
| GLA, 18:3n-6 | 0.07 ± 0.01 a,b | 0.08 ± 0.01 a,b | 0.72 ± 0.18 a | 0.05 ± 0.01 b | 0.07 ± 0.00 a,b | 0.07 ± 0.01 a,b |
| ETA, 20:3n-6 | 0.12 ± 0.01 a,b | 0.09 ± 0.02 b | 0.22 ± 0.02 a | 0.12 ± 0.01 a,b | 0.15 ± 0.01 a,b | ND |
| AA, 20:4n-6 | 0.20 ± 0.02 a,b | 0.14 ± 0.02 b | 0.18 ± 0.01 a,b | 0.15 ± 0.01 a,b | 0.29 ± 0.01 a | 0.30 ± 0.02 a |
| 14:1n-5 | 0.25 ± 0.02 a | 0.23 ± 0.04 a | 0.30 ± 0.03 a | 0.26 ± 0.02 a | 0.36 ± 0.02 a | 0.29 ± 0.02 a |
| POA, 16:1n7 | 1.96 ± 0.14 b | 1.69 ± 0.27 b | 2.52 ± 0.12 a,b | 2.91 ± 0.25 a,b | 3.82 ± 0.20 a | 2.53 ± 0.41 a,b |
| OA, 18:1n-9 | 27.83 ± 0.28 a | 23.69 ± 3.36 a | 32.64 ± 0.79 a | 25.47 ± 1.46 a | 26.03 ± 0.32 a | 24.71 ± 1.60 a |
| LAA, 12:0 | 1.70 ± 0.10 a | 1.97 ± 0.22 a | 1.51 ± 0.05 a | 2.06 ± 0.14 a | 1.71 ± 0.10 a | 1.86 ± 0.15 a |
| MA, 14:0 | 5.35 ± 0.15 a,b | 6.76 ± 0.75 a,b | 4.83 ± 0.23 b | 7.87 ± 0.46 a | 6.03 ± 0.36 a,b | 6.37 ± 0.46 a,b |
| PA, 16:0 | 28.16 ± 0.46 a,b | 34.73 ± 4.28 a,b | 23.92 ± 1.66 b | 35.65 ± 1.74 a | 28.82 ± 1.65 a,b | 31.58 ± 1.80 a,b |
| SA, 18:0 | 4.66 ± 0.13 a | 5.47 ± 0.47 a | 4.00 ± 0.30 a | 5.40 ± 0.32 a | 4.73 ± 0.49 a | 4.97 ± 0.36 a |
| SAFA | 30.42 ± 10.14 a,b | 49.46 ± 5.68 a,b | 34.83 ± 2.17 b | 51.39 ± 2.64 a | 41.68 ± 2.49 a,b | 45.52 ± 2.75 a,b |
| MUFA | 30.04 ± 0.18 a,b | 25.60 ± 3.65 a,b | 35.46 ± 0.65 a | 28.65 ± 1.71 a,b | 30.22 ± 0.44 a,b | 27.53 ± 1.81 b |
| PUFA | 26.95 ± 0.30 a,b | 21.63 ± 2.46 a,b | 29.06 ± 0.80 a | 13.20 ± 4.47 b | 24.11 ± 0.88 a,b | 24.37 ± 0.94 a,b |
| PUFAn-3 | 2.24 ± 0.07 b,c | 6.11 ± 0.77 a | 6.03 ± 0.95 a,b | 2.12 ± 0.15 c | 2.61 ± 0.03 a,b,c | 3.15 ± 0.15 a,b,c |
| PUFAn-6 | 24.33 ± 0.20 a | 15.14 ± 1.67 b | 22.53 ± 1.33 a,b | 15.11 ± 0.81 b | 21.01 ± 0.84 a,b | 20.84 ± 0.94 a,b |
| n-6/n-3 PUFA | 10.87 ± 0.54 a | 2.51 ± 0.23 b | 4.26 ± 2.30 a,b | 7.16 ± 0.58 a,b | 8.03 ± 0.55 a | 6.67 ± 0.98 a,b |
| n-3 HUFA score | 0.24 ± 0.02 b | 0.48 ± 0.08 a,b | 0.37 ± 0.04 b | 0.73 ± 0.02 a | 0.61 ± 0.04 a,b | 0.58 ± 0.11 a,b |
| NAE | MilkFat | LSO | Buglos | FO | Nanno | Schy |
|---|---|---|---|---|---|---|
| Plasma | ||||||
| EPEA | 117.6 ± 11.2 a | 19.7 ± 3.5 b | 72.7 ± 12.3 a,b | 35.5 ± 12.4 a,b | 43.5 ± 10.3 a,b | 108.0 ± 7.4 a |
| POEA | 11.9 ± 0.7 a | 10.7 ± 1.2 a | 13.7 ± 2.5 a | 14.2 ± 4.8 a | 14.6 ± 1.7 a | 19.2 ± 0.8 a |
| LEA | 60.7 ± 2.9 a | 52.3 ± 4.0 a | 70.2 ± 12.2 a | 44.2 ± 15.0 a | 65.2 ± 1.9 a | 67.8 ± 5.2 a |
| AEA | 25.1 ± 1.9 a | 17.5 ± 1.5 a | 22.8 ± 3.0 a | 13.1 ± 4.6 a | 22.5 ± 1.3 a | 25.9 ± 1.3 a |
| DHEA | 42.3 ± 3.0 a,b | 37.3 ± 0.7 a,b | 43.3 ± 5.1 a,b | 60.0 ± 2.1 a,b | 37.6 ± 2.9 b | 138.8 ± 7.5 a |
| OEA | 142.0 ± 9.1 a | 118.9 ± 14.7 a | 140.0 ± 14.0 a | 118.7 ± 41.8 a | 147.3 ± 4.3 a | 165.6 ± 10.5 a |
| SEA | 237.2 ± 26.2 a,b | 179.9 ± 14.6 a,b | 163.9 ± 16.9 b | 193.3 ± 48.8 a,b | 224.5 ± 10.1 a,b | 319.6 ± 28.6 a |
| PEA | 181.7 ± 13.1 a,b | 167.8 ± 27.6 b | 220.1 ± 26.7 a,b | 213.3 ± 22.0 a,b | 193.5 ± 16.7 a,b | 275.2 ± 6.8 a |
| Liver | ||||||
| EPEA | 52.4 ± 8.5 a,b | 163.6 ± 12.9 a | 27.1 ± 6.6 b | 161.3 ± 15.3 a | 112.2 ± 15.9 a,b | 52.4 ± 12.8 a,b |
| POEA | 5.8 ± 1.2 a | 7.9 ± 1.6 a | 4.4 ± 1.3 a | 10.3 ± 1.4 a | 4.9 ± 0.7 a | 4.6 ± 0.8 a |
| LEA | 188.8 ± 16.7 a | 111.4 ± 7.6 a,b | 105.6 ± 6.8 a,b | 104.0 ± 5.1 a,b | 81.3 ± 8.3 b | 117.4 ± 5.2 a,b |
| AEA | 51.1 ± 9.0 a,b | 34.2 ± 2.5 a,b | 34.1 ± 3.9 a,b | 24.3 ± 4.3 b | 31.5 ± 7.1 a,b | 53.8 ± 3.3 a |
| DHEA | 13.2 ± 1.2 a,b,c | 13.1 ± 1.3 a,b,c | 10.1 ± 0.5 b,c | 42.0 ± 5.3 a,b | 6.3 ± 1.1 c | 83.9 ± 6.3 a |
| OEA | 58.2 ± 13.3 a | 56.2 ± 6.1 a | 48.7 ± 1.3 a | 47.0 ± 4.8 a | 32.6 ± 4.9 a | 51.2 ± 6.7 a |
| SEA | 32.3 ± 1.1 a,b | 49.5 ± 1.7 a,b | 54.8 ±5.0 a | 50.8 ± 3.3 a,b | 22.0 ± 1.8 b | 60.1 ± 7.2 a |
| PEA | 33.3 ± 3.9 a,b | 26.1 ± 2.2 a,b | 26.7 ± 1.2 a,b | 31.1 ± 3.1 a,b | 21.6 ± 4.0 b | 49.9 ± 3.0 a |
| Brain | ||||||
| EPEA | 19.1 ± 2.9 b | 30.3 ± 5.7 a,b | 34.3 ± 5.6 a,b | 62.0 ± 6.8 a | 51.7 ± 14.8 a,b | 37.2 ± 6.9 a,b |
| POEA | 110.8 ± 8.5 a | 79.2 ± 4.9 a | 95.8 ± 5.3 a | 110.8 ± 11.3 a | 67.7 ± 11.0 a | 88.4 ± 7.0 a |
| LEA | 313.1 ± 36.3 a | 159.6 ± 3.4 b | 222.0 ± 23.0 a,b | 191.2 ± 19.2 a,b | 148.9 ± 31.5 b | 236.6 ± 26.7 a,b |
| AEA | 2181.1 ± 173.0 a | 1212.9 ± 24.8 b | 1702.2 ± 69.0 a,b | 1232.6 ± 62.5 b | 1232.1 ± 179.1 a,b | 1563.1 ± 88.3 a,b |
| DHEA | 453.1 ± 53.2 a | 403.6 ± 3.3 a | 363.2 ± 41.0 a | 437.9 ± 14.0 a | 323.3 ± 39.6 a | 468.9 ± 34.7 a |
| OEA | 973.9 ± 74.0 a | 804.9 ± 21.2 a | 809.3 ± 63.9 a | 820.4 ± 50.2 a | 619.7 ± 111.4 a | 918.7 ± 68.8 a |
| SEA | 321.7 ± 52.2 a | 141.0 ± 17.9 a | 204.7 ± 81.0 a | 251.9 ± 79.6 a | 188.3 ± 31.2 a | 157.0 ± 11.9 a |
| PEA | 684.3 ± 86.3 a | 715.6 ± 85.5 a | 649.0 ± 67.2 a | 684.5 ± 36.1 a | 571.0 ± 145.4 a | 691.7 ± 65.7 a |
| Visceral adipose tissue (VAT) | ||||||
| POEA | 0.08 ± 0.00 a | 0.09 ± 0.01 a | 0.08 ± 0.01 a | 0.11 ± 0.01 a | 0.11 ± 0.01 a | 0.10 ± 0.01 a |
| LEA | 1.16 ± 0.10 a | 1.02 ± 0.16 a | 0.81 ± 0.06 a | 0.86 ± 0.09 a | 0.85 ± 0.05 a | 1.01 ± 0.04 a |
| AEA | 0.21 ± 0.02 a,b | 0.18 ± 0.02 a,b | 0.15 ± 0.01 b | 0.15 ± 0.02 b | 0.20 ± 0.01 a,b | 0.30 ± 0.02 a |
| DHEA | 0.36 ± 0.05 a,b | 0.33 ± 0.04 a,b | 0.23 ± 0.04 b | 0.60 ± 0.02 a,b | 0.22 ± 0.04 b | 1.01 ± 0.06 a |
| OEA | 1.48 ± 0.09 a | 1.64 ± 0.25 a | 1.18 ± 0.04 a | 1.40 ± 0.14 a | 1.16 ± 0.09 a | 1.43 ± 0.08 a |
| SEA | 2.63 ± 0.04 a | 3.11 ± 0.57 a | 1.65 ± 0.17 a | 2.35 ± 0.22 a | 2.33 ± 0.04 a | 2.72 ± 0.23 a |
| PEA | 1.68 ± 0.05 a | 1.79 ± 0.28 a | 1.38 ± 0.04 a | 1.52 ± 0.07 a | 1.41 ± 0.11 a | 1.85 ± 0.11 a |
Publisher’s Note: MDPI stays neutral with regard to jurisdictional claims in published maps and institutional affiliations. |
© 2021 by the authors. Licensee MDPI, Basel, Switzerland. This article is an open access article distributed under the terms and conditions of the Creative Commons Attribution (CC BY) license (http://creativecommons.org/licenses/by/4.0/).
Share and Cite
Murru, E.; Lopes, P.A.; Carta, G.; Manca, C.; Abolghasemi, A.; Guil-Guerrero, J.L.; Prates, J.A.M.; Banni, S. Different Dietary N-3 Polyunsaturated Fatty Acid Formulations Distinctively Modify Tissue Fatty Acid and N-Acylethanolamine Profiles. Nutrients 2021, 13, 625. https://doi.org/10.3390/nu13020625
Murru E, Lopes PA, Carta G, Manca C, Abolghasemi A, Guil-Guerrero JL, Prates JAM, Banni S. Different Dietary N-3 Polyunsaturated Fatty Acid Formulations Distinctively Modify Tissue Fatty Acid and N-Acylethanolamine Profiles. Nutrients. 2021; 13(2):625. https://doi.org/10.3390/nu13020625
Chicago/Turabian StyleMurru, Elisabetta, Paula A. Lopes, Gianfranca Carta, Claudia Manca, Armita Abolghasemi, José L. Guil-Guerrero, José A. M. Prates, and Sebastiano Banni. 2021. "Different Dietary N-3 Polyunsaturated Fatty Acid Formulations Distinctively Modify Tissue Fatty Acid and N-Acylethanolamine Profiles" Nutrients 13, no. 2: 625. https://doi.org/10.3390/nu13020625
APA StyleMurru, E., Lopes, P. A., Carta, G., Manca, C., Abolghasemi, A., Guil-Guerrero, J. L., Prates, J. A. M., & Banni, S. (2021). Different Dietary N-3 Polyunsaturated Fatty Acid Formulations Distinctively Modify Tissue Fatty Acid and N-Acylethanolamine Profiles. Nutrients, 13(2), 625. https://doi.org/10.3390/nu13020625