Abstract
Dietary inadequacy is a major challenge among young children in Ghana. Nutritional policies are required for optimum child nutrition and development. This study explored food consumption and dietary diversity by socioeconomic status and geographical location among children aged 6–23 months in Ghana. We used the latest national representative, cross-sectional data from the Ghana Demographic and Health Survey (GDHS-2014). A total of 887 children aged 6–23 months were used in the final analysis. The survey collected data on children’s food consumption through their mothers in the 24 h recall method. Multiple logistic regression models were used to assess the relationship between socioeconomic status and geographical location with food consumption and adequate dietary diversity after adjusting for control variables. The study revealed an association between specific food item consumption, food groups, and dietary diversity by socioeconomic and geographic characteristics. However, dairy consumption increased faster than other nutritional foods when socioeconomic status increased. Furthermore, the study revealed that children’s chances of consuming particular food items and food groups differed across Ghana’s 10 regions. The average probabilities of consuming adequate dietary diversity between the Greater Accra region and Ashanti region were 43% vs. 8% (p < 0.001). Consumption of grains, root, and tubers were relatively higher but low for Vitamin A-rich fruits and vegetables and legumes and nuts for children aged 6–23 months in Ghana. Overall, the mean dietary diversity score was low (3.39; 95% CI: 3.30–3.49) out of eight food groups, and the prevalence of adequate dietary diversity was 22% only. There is a need for policy interventions to ensure appropriate dietary practices to promote healthy growth of children.
1. Introduction
The health state is greatly influenced by the food intake and utilization of food nutrients [1,2]. During the early years, poor diet contributes to severe malfunctions, including poor academic performance, poor social skills, delay in motor and cognitive growth, and behavioral disorders [3]. Therefore, it is undeniable that infants and young children require optimum nutrition and acceptable feeding practices for optimal growth, healthy life, and cognitive development [4,5]. Globally, sustainable development goals (SDGs) statistics show that in the year 2017, about 821 million were undernourished, and about 45% of deaths recorded each year among children less than five years were caused by poor diet [6,7,8]. Worldwide, it was estimated in 2018 that 149 million or 22% of children under five years were still chronically undernourished, and 36% of the world’s chronically malnourished lived in sub-Saharan Africa [7].
Ghana’s undernutrition has improved steadily over the decades; however, child malnutrition is a major public health problem [9,10]. The anemia rate among children countrywide remains high (66%) due to micronutrient deficiencies [11]. It is estimated that in 2008 the prevalence of stunting, underweight, and wasting among children under five years were 28%, 14%, and 9%, respectively [12]. Poor diet remains high in the rural communities, and many of the problems are deeply rooted in limited knowledge of infant and young child feeding practices, poverty, and poor food distribution networks [13]. In a broad category, about 5% of Ghana’s population is estimated to be food insecure, and about two million people are susceptible to becoming food insecure. The government of Ghana and stakeholders have set up the National Nutrition Policy (NNP) to ensure optimal nutrition. The policy managers are tasked with enhancing the consumption of diverse diets and promoting nutrition intake by women of child-bearing age and newborns. The economic losses poor nutrition brings to an economy are enormous, and it is vital to encourage investment in the social sector, particularly nutrition policies for young children, to improve social and economic development.
One of the underlying causes of child malnutrition is inadequate nutritional intake [14,15]. It has been documented that at least one in three children under five years old in the world is not growing well because of malnutrition in a more noticeable form, such as stunting, wasting, and overweight [16]. Malnutrition is closely linked to household food insecurity, young children and infant feeding practices, and socioeconomic status (SES) [17,18]. Socioeconomic factors such as household wealth status, parents’ educational level, and geographical location significantly influence a child’s nutritional status [19,20].
Most researches on child malnutrition apply anthropometric failures such as stunting, wasting, and underweight rather than dietary diversity in their analysis [8,15,17,18]. While dietary diversity and anthropometric failures are interconnected, it is essential to emphasize dietary diversity as many nutritional intervention programs aim to improve food quantity and quality [21,22]. Previous research has established that dietary diversity positively impacts micronutrient adequacy and improves young children’s nutritional status [23,24,25]. In other words, low dietary diversity is associated with stunting, underweight and wasting among young children and affects overall child development [26,27]. Dietary diversity is an easy and reliable approach to conceptualize young children’s feeding practices and adequate nutritional consumption [28,29]. Many proponents have stated that socioeconomic and demographic characteristics strongly correlate with dietary diversity [24,30,31]. Maternal education, household wealth status, geographical area, and other societal norms affect children’s feeding practices and dietary diversity. It has been established that children from wealthy households have access to diverse foods and a higher level of maternal education turns out to have a positive relationship with dietary diversity [32,33].
Previous studies have established the relationship between child dietary diversity and socioeconomic and demographic characteristics [34,35,36,37,38,39,40]. A few studies have been conducted on a child’s nutritional adequacy using nationally representative data in Ghana [36,37,38]. Perhaps, due to data limitation, most existing research in Ghana focuses on particular geographical locations and leaves out places where children suffer from malnutrition [34,36,37,38]. Another concern is about the paucity of research on child dietary diversity and socioeconomic characteristics among children aged 6–23 months in Ghana. Most of the research investigating the relationship between dietary diversity and socioeconomic factors was based on children aged 6–59 months old [35,40]. In the early years of life, good nutrition is essential because body growth and brain development are faster than at any other time [41,42]. The failure to optimize good nutrition has a long-term consequence on job potential, education, and adult mental health [43]. The minimum dietary diversity among children aged 6–23 months in Ghana is still below the World Health Organization (WHO) recommendation [44]. The importance of early years of good nutrition combined with inadequate minimum dietary intake in Ghana make it crucial to conduct thorough studies among children aged 6–23 months. Besides, the studies have made an effort to include specific food items in the analysis that most of the previous work conducted in Ghana failed to include [44,45,46,47]. This study included an age group that has not been extensively studied and relied on nationally representative data. The study aimed to promote nutritional policies to enhance dietary diversity among children aged 6–23 months in Ghana through food quality and quantity.
This present study used the most recent nationally representative data in Ghana to explore the socioeconomic status and geographical location pattern of specific food item intake, food groups’ consumption, and dietary diversity adequacy among 6–23-month-old children.
Conceptual Framework
Several models explain the determinants of a child’s nutritional status. This paper’s conceptual framework was adapted from the United Nations Children’s Fund (UNICEF) framework for the causes of malnutrition. The framework demonstrates that both biological and socioeconomic factors cause children’s malnutrition. The framework categorizes the determinant factors into three main groups: immediate, underlying, and basic. The immediate determinants happen at the individual level and describe dietary intake and health status. The underlying determinants take place at the household level. The underlying causes include food security, mother and children care practices and proper health environment. The basic causes manifest at the societal level. The basic level determinants concern the potential resources available to a country, technological accessibility, and human resource quality. The framework suggests that politics, cultural, economic, and social systems, including women’s status in society, affect potential resource utilization. The determinant factors are interconnected, and one level influences the other level.
Proponents of this framework posit that once a child lives in a community, changes in the community can consciously or unconsciously affect their nutritional status through environmental, socio-demographic, and individual factors. Children from a high socioeconomic background are likely to have healthier food habits and good dietary profile consistency with dietary guidelines, hence good nutritional status [48,49,50]. The framework explains how socioeconomic factors function to impact the nutritional quality through intermediate and proximal variables. High dietary diversity enhances absorption of energy and nutrients, dietary adequacy, and child development and nutrition [38]. According to the framework, the basic determinants act through underlying factors, immediate factors, and proximal factors to affect child nutrition. For instance, socio-demographic characteristics such as mothers’ education, household wealth, and geographical location may directly or indirectly affect child care and feeding practices and dietary intake. Many relevant studies use wasting, stunting, and underweight to measure child nutrition [8,15]. This study used adequate dietary diversity as a proxy to measure child nutrition adequacy, given the fact that many children’s nutritional interventions seek to improve child growth through food quantity and quality [21]. Based on the interrelationship of the previous relevant literature and the framework, variables were derived from measuring the child’s nutrition [38,45,51,52] (Figure 1). The specific variables included in the logistic model to achieve the research objective included the child’s age, gender, birth order, mother’s education, household wealth, geographical location, ethnicity, religion.
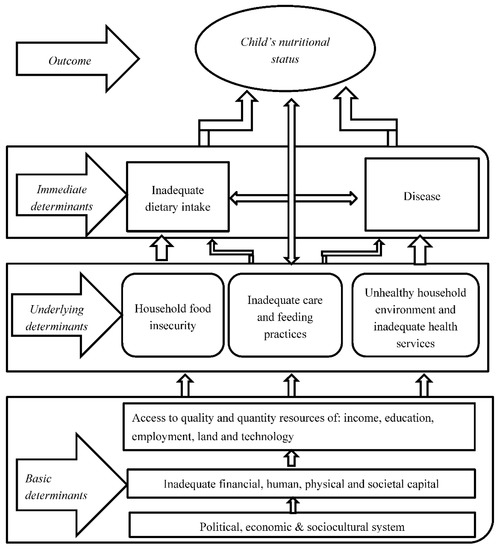
Figure 1.
Conceptual framework: the determinants of child nutritional status. Source: Adapted from UNICEF 1998, 2015 [14,53].
2. Materials and Methods
2.1. Study Design and Data
This study used the latest and nationally representative cross-sectional data set from the Ghana Demographic and Health Survey (GDHS) in 2014 [54]. The data set was obtained from the website of Measure DHS. The data set was exempted from specific permission because it was based on an anonymous public use data set with no identifiable information of the study population. Permission to the data set was given after the application to use the data was accepted [55]. GDHS-2014 was selected for this study because it is the most recently released data set and provides detailed information on dietary diversity and nutritional variables. The GDHS-2014 was administered by the Ghana Statistical Service (GSS) and Ghana Health Service (GHS) with technical and financial assistance from International Classification of Functioning, Disability and Health (ICF) International and the United States Agency for International Development (USAID), respectively. The GDHS-2014 used a two-stage sample design, and it was structured to include key national-level indicators, urban and rural, and each of Ghana’s 10 administrative regions. The first stage adopted sample points (clusters) from enumeration areas (EAs) designed for the 2010 Population and Housing Census (PHC). The first stage included 427 clusters, of which 211 were in rural areas and 216 were in urban areas. In the second stage, the households were selected through a systematic sampling technique from these clusters. In all, about 30 households were selected from each cluster. In total, 12,831 households were selected for the survey, of which 12,010 were occupied. A total of 11,835 households were successfully interviewed out of the 12,010 occupied households, yielding a response rate of 99% [56]. All men and women aged 15–59 and 15–49, respectively, were qualified to join the survey.
The GDHS-2014 used three sets of questionnaires: The Household Questionnaire, the Woman’s Questionnaire, and Man’s Questionnaire. In the standard women’s questionnaire, a total of 9656 women were qualified to participate, of which 9396 were successfully interviewed, yielding a response rate of 97% [56]. The women’s questionnaire included a child health section. The child health component included only women with at least one child under five years before the survey, and consisted of 2782 respondents. This study limited the study population to young infants and children aged 6–23 months. The sample size included in the final analysis was 887 children. A detail of participant flow in this analysis is depicted in Figure 2.
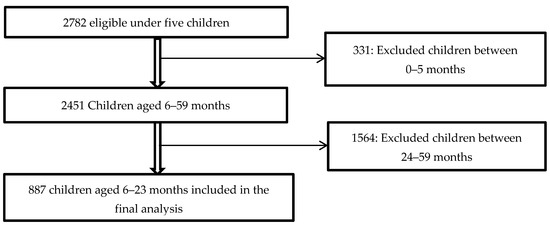
Figure 2.
Participant flow chart.
2.2. Ethical Statement
The 2014 Ghana Demographic and Health Survey (GDHS-2014) was conducted by the Ghana Statistical Service (GSS) in collaboration with the Ghana Health Service (GHS) and National Public Health Reference Laboratory (NPHRL). The GSS, GHS, and NPHRL received technical assistance from the International Classification of Functioning, Disability and Health (ICF) through DHS programs [54]. The ICF Macro Institutional Review Board (IRB) and the Ghana Health Service Ethics Review Committee received ethical clearance from the National Public Health Reference Laboratory of the GHS and Noguchi Memorial Institute for Medical Research all in Ghana before GDHS-14 was carried out [57]. The ethical committees received written informed consent from the study participants before the interview. Also, this paper’s authors requested and received permission from the DHS to use the data. The authors of this paper needed no more ethical approval to use the completely anonymous public data set.
2.3. Description of Variables
2.3.1. Outcome Variable
The main outcome variable for this study was adequate dietary diversity consumption (ADDC). The ADDC was used as a dependent variable. The study’s three key independent variables were household wealth, mothers’ education and geographical location, and other controlled confounders. However, specific food items and food groups were also used as dependent variables to show the pattern of consumption of particular food items or food group changes when socio-demographic characteristics change. The ADDC was created based on the mother’s recall of the child’s consumption of food groups over 24 h immediately preceding the mother’s interview. Data were gathered on the number of specific foods consumed from the previous day: juice; tinned powdered/fresh milk; fortified baby food; other liquids; bread, noodles, other grains; potatoes, cassava, tubers; eggs; pumpkin, carrot, squash; dark green leafy vegetables; fruits; meat (chicken, beef); liver, heart, other organ meat; fish, shellfish; beans, peas, lentils, and other solid/semi-liquid food. The food items were categorized into eight food groups recommended by WHO and the WHO-UNICEF Technical Expert Advisory Group on Nutrition Monitoring (TEAM) [28,58,59]. In 2017, the WHO changed the food groupings from seven to eight food groups to eliminate the differences in breastfeeding indicators compared with non-breastfeeding children [60,61]. Details of food item groupings are shown in Table 1 below. A dietary diversity score was generated by gathering information on food groups. The food group was given a range of 0–8. A score of 1 was assigned to children who consumed at least one of the food groups and 0 for children who did not consume food items from the food groups. A binary variable was generated from the total dietary diversity score to get adequate dietary diversity consumption (ADDC). Children were considered to have ADDC if they had consumed five or more food groups, whereas children who consumed four or fewer of the food groups were considered inadequate [60].

Table 1.
The eight food groups used for dietary diversity score calculation.
2.3.2. Main Independent Variables
The various socio-demographic factors that were used included maternal and child demographic factors, household factors, and community characteristics. Three child demographic characteristics were used in the analysis. They were the child’s age, and child’s gender, and birth order. The maternal demographic factors included were education, ethnicity, and religion. Education level was divided into four categories: no education, primary (1–5 years of education), secondary education (6–8 years of education), and higher education (9 years and above of education). Religion fell into four different categories: Christianity, Islamic, African Traditional Religion, and other/No religion. Ethnicity was categorized into nine different groups: Akan, Ga/Dangme, Ewe, Guan, Mole–Dagban, Grusi, Gurma, Mande, and Other.
The household-level factor included in the analysis was the wealth index. The household wealth index is a composite measure of the socioeconomic position [61,62]. The household wealth index is computed based on households’ ownership of assets and consumer items such as refrigerators, washing machines, bicycles, and access to water and sanitation facilities through principal component analysis [63,64,65]. Each index had a mean value of 0 and a standard deviation of 1, and it was divided into five quintiles: poorest, poorer, middle, richer, and richest [51].
Community-level characteristics included were geographical location. Ghana is divided into 10 administrative regions as of 2014, and each region faces different challenges in food accessibility. The region categorization includes Western, Central, Greater Accra, Volta, Eastern, Ashanti, Bono-Ahafo, Northern, Upper East, and Upper West.
2.4. Statistical Analysis
All statistical analysis was done using Stata 16 (M.P.—Parallel Edition). Sample weights were calculated based on the sample’s non-proportional distribution to the different survey clusters and residents (rural and urban). The sample weight was done purposely to ensure that our analysis was nationally representative and adequately distributed to all different survey clusters.
A set of logistic regression models was applied to estimate the odds ratios (ORs) of mothers’ education and household wealth on adequate dietary diversity consumption (ADDC), food groups, and specific food items. Model A displayed the relationship between mother’s education, household wealth, and each result after adjusting only the child characteristics (i.e., age and gender), while Model B further controlled for residence, religion, ethnicity, child’s birth order. Afterward, a set of multiple logistic regression models was used to estimate the Average Predictive Margins (APMs) of geographical location on the consumption of specific food items, food groups, and ADDC with adjusted variables such as child’s age in months, child’s gender, child’s birth order, mother’s education, ethnicity, and religion.
Many researchers use coefficients, p-values, standard errors, confidence intervals, or significance stars to communicate their statistical model results. However, there are some limits and interpretational difficulties, especially when it comes to categorical variables and nonlinear models such as logistic regression [66,67]. The use of APMs makes the results from the analysis much more meaningful, intuitive, and easy to interpret [66,67,68,69]. Hence, the study used APMs to predict children’s average probability of having ADDC based on the geographical location.
The study conducted two sensitivity analyses to check the models’ robustness and how changes in other variables affected the outcome. Given that, nutritional problems also exist among older children. The first sensitivity analysis was conducted among older children aged 24–59 months with dietary data. Furthermore, the study evaluated whether, after adjusting for the state’s fixed effects, they would significantly change our analysis. All the underlying multivariable regressions were tested to know the possibility of multicollinearity in work. A correlation matrix of covariates was used to assess the likelihood of multicollinearity. However, all pairwise correlation coefficients were less than 0.5, indicating an absence of multicollinearity [70].
3. Results
3.1. Specific Food Items, Food Groups, Dietary Diversity, and Socio-Demographic Information of the Study Population
Table 2 shows the frequency and percentages of young children aged 6–23 months by selected socio-demographic factors. The results revealed that about half of the sampled children were male. Forty-nine percent of the mothers received secondary education, while 28% received no formal education. A majority of the mothers (48%) belonged to the Akan ethnic group. Seventeen percent of the mothers lived in the Ashanti region, and more than half (76%) of the mothers were Christians. Almost a quarter (23%) of the sample households belonged to the poorest quintile.
Table 2.
Frequency and percentage of children by selected socio-demographic characteristics from the Ghana Demographic and Health Survey 2014 (n = 887).
Table 3 shows the frequency and percentages of young children aged 6–23 months who consumed specific food items and food groups. Regarding the children who consumed any of the 18 food items, 81% had bread, noodles, and other grains. Around 45% consumed fish, shellfish (45%), dark green leafy vegetables (36%), other solid/semi-liquid food (36%); potatoes, cassava, tubers (30%); eggs (20%); fortified baby food (16%); tinned powdered/fresh milk (15%); meat (chicken, beef) (13%); beans, peas, lentils (13%); juice (13%); other liquids (9%); pumpkin, carrot, squash (7%); fruits (25%) and liver, heart, other organ meat (3%) in the last 24 h. The findings revealed that, among the eight food groups, most of the children consumed grains, roots, and tubers (89%), followed by breast milk (84%), flesh foods (52%), other fruits and vegetables (47%), dairy products (22%), eggs (20%), legumes and nuts (13%) and Vitamin A-rich fruits and vegetables (12%) in the previous 24 h (Table 3). Overall mean dietary diversity score was low (3.39; 95% CI: 3.30–3.49) out of eight food groups. Adequate dietary diversity consumption (ADDC) was 22%, while inadequate consumption was 78%.
Table 3.
Frequency and percentage of children’s consumed specific food items, food groups, dietary diversity from the Ghana Demographic and Health Survey 2014.
3.2. Average Consumption of Specific Food Items, Food Groups, and Dietary Diversity Consumption by Socio-Demographic Characteristics
Table 4 and Table 5 present the consumption of particular food items, food groups, and adequate dietary diversity intake measured by the mother’s education, household wealth, and geographical location among children aged 6–23 months old. The findings revealed a significant difference (p < 0.001) in consumption of food items such as juice, tinned powdered/fresh milk, fortified baby food, eggs, and fruits by the mother’s education (Table 4). For instance, the intake of juice (9% vs. 37%), tinned powdered/fresh milk (6% vs. 50%), fortified baby food (4% vs. 66%), eggs (13% vs. 59%) was four times or more higher for mothers with the higher educational background than mothers with no formal education. Threefold differentials were observed in the consumption of fruits (20% vs. 60%) between mothers with higher education and those with no education. Among the food groups, the highest differentials were found in the intake of breast milk (89% vs. 69%), followed by dairy (11% vs. 63%) and eggs (13% vs. 59%) by the mother’s education. Children whose mothers had higher educational backgrounds consumed less breast milk than mothers with no academic background. Mothers with higher educational backgrounds had a mean dietary diversity score of 4.8, compared to mothers with no education at 3.3. Children of mothers with higher educational backgrounds had an adequate dietary diversity consumption of 65%, compared to 19% for those of mothers with no education.
Table 4.
24 h recall of consumption of food items, food groups and dietary diversity by mother’s education and household wealth of children aged 6–23 months, mean values (%) with confidence intervals (CIs), GDHS-2014.
Table 5.
24 h recall of consumption of food items, food groups, and dietary diversity by geographical area of children aged 6–23 months, mean values (%) with confidence intervals (CIs), GDHS-2014.
The study also found a considerable difference (p < 0.001) in the consumption of numerous food items by household wealth among children aged 6–23 months old (Table 4). For instance, children from the wealthiest households had four times or more differentials than the children from the poorest households in the consumption of food items such as juice (6% vs. 25%), fortified baby food (8% vs. 41%), eggs (6% vs. 33%), and tinned powdered/fresh milk (6% vs. 34%). Again, a threefold differential was found in the consumption of fruits (12% vs. 37%) between children from the richest households and poorest households. Regarding the food groups, a substantial differential by household wealth was found in the consumption of dairy products (6% vs. 52%) and eggs (6% vs. 33%). Here, children from the wealthiest households had higher percentages in the consumption of dairy products and eggs than children from the poorest households. The mean dietary diversity score ranged from 3.0–4.0 among children from the poorest to the richest households. Children from the richest households had an adequate dietary diversity of 38%, compared to 13% for those from the poorest households.
The study also revealed a substantial difference in the consumption of several food items by the 10 regions in Ghana. For example, children who lived in Greater Accra were found to consume four times or more food items, such as juice (27% vs. 3%), tinned powdered/fresh milk (28% vs. 2%), fortified baby food (22% vs. 3%), meat—chicken, beef (30% vs. 8%), than their counterparts who lived in the Upper West (Table 5). The percentage of children from the Western region who consumed juice (19% vs. 3%), fortified baby food (23% vs. 2%), and eggs (38% vs. 8%) (Table 5) exceeded by four times the percentage of children from the Northern region. Regarding the food groups, the largest differential by region was found for the consumption of dairy products (55% vs. 4%), with children from the Greater Accra region consuming more than children from the Upper West. The mean dietary diversity across the 10 administrative regions ranged from 2.7 to 4.5, with the highest recorded in Greater Accra and the least recorded in the Eastern region. However, the highest adequate dietary diversity consumption was recorded in Greater Accra, while the least was recorded in the Ashanti region.
3.3. Logistic Regression Model (ORs with 95% CI) for an Association between Specific Food Items, Food Groups, ADDC, and Socioeconomic Characteristics
Table 6 displays two-part model odds ratios (ORs) and 95% confidence intervals (CIs) of household wealth on the consumption of specific food items and food groups of children aged 6–23 months. Multivariate logistic regression results are presented in Table 6 with ADDC, specific food items, and food groups as dependent variables, household wealth as the main independent variable, and adjusted other covariates. Model A adjusted for only child characteristics (age and gender), while Model B adjusted for full factors such as child, maternal, household, and community-based characteristics. The study finding from Model A showed those children from the richest households had four times or more odds ratios than children from the poorer households in consuming food items such as juice, tinned powdered/fresh milk, and fortified baby food. Again, children from the richest households consumed two or more times the quantities of food items such as eggs and pumpkin, carrot, squash. The odds ratio was further confirmed after adjusting all characteristics (Model B). The study revealed that children from the wealthiest households were more likely to consume more of the food items such as juice, tinned powdered/fresh milk, fortified baby food, bread, noodles, other grains, fruits, eggs, other solid/semi-liquid food, liver, heart, other organ meat and pumpkin, carrot, squash than children from the poorer households. Regarding the food groups, dairy product consumption was four times or higher among children from the richest households than children from the poorer households in each separate model. On the whole, the study found that children from the poorest households had a lower odds ratio of adequate dietary diversity intake, compared to children from the wealthiest households, with ORs of 1.25 (95% CI: 0.75, 2.07) and 1.13 (95% CI: 0.64, 2.00) in Model A and B, respectively (Table 6).
Table 6.
The association between household wealth and consumption of food items, food groups, and adequate dietary diversity of children aged 6–23 months, adjusted odds ratios (ORs) with confidence intervals (Cis), GDHS-2014.
Table 7 presents ORs of children aged 6–23 months with CIs of mothers’ education on consuming specific food items and food groups in the two-part model. Multivariate logistic regression results are presented in Table 7 with specific food items, food groups, and ADDC as dependable variables and mother’s education as the main independent variable and controlled for other covariates. Mothers with higher educational backgrounds had higher odds than mothers with no formal education. For example, food items such as juice, tinned powdered/fresh milk, fortified baby food, eggs and liver, heart, other organ meat consumption were higher for high education-level mothers than for no education mothers (Model A). The same relationship trend was found after fully adjusting the model (Model B). The study revealed a higher odds ratio among children whose mothers had a higher education on consuming specific food items such as tinned powdered/fresh milk, fortified baby food, juice, liver, heart, other organ meat, and eggs than children whose mothers had no education.
Table 7.
The association between mother’s education and consumption of food items, food groups, and adequate dietary diversity of children aged 6–23 months, adjusted odds ratios (ORs) with confidence intervals (CIs), GDHS-2014.
Regarding the food, the largest significant odds ratio was observed among children who had mothers with a higher educational background in the consumption of dairy products, followed by eggs (Model A). The same relationship trend was observed after adjusting all other characteristics in Model B. Overall, children who had mothers with higher educational backgrounds had higher odds ratios of adequate dietary diversity intake than children whose mothers had no education, with an OR of 3.52 (95% CI: 1.58–7.85) in Model A and 2.18 (95% CI: 0.80–5.92) in Model B.
3.4. Average Predictive Margins (APMs) for an Association between Specific Food Consumption, Food Groups, ADDC, and Geographical Locations
Table 8 presents the Average Predictive Margins (APMs) with standard error (SE) for a geographical area on consuming specific food items and food groups among children aged 6–23 months. Multivariate logistic regression results are presented in Table 8 with specific food items, food groups, and ADDC as dependable variables and geographical location as a main independent variable, and adjusted other confounders. APMs were set up to predict the probability of consuming particular food items and food groups by the child’s location in any of Ghana’s 10 administrative regions. The analysis showed that the likelihood of children consuming specific food items and food groups differed among Ghana’s 10 regions. For example, on average, the probability of children located in Greater Accra to consume food items such as juice was 0.20 or 20%, tinned powdered/fresh milk, compared to a child from Upper West at 0.04 or 4%. The same trend was observed among food items such as tinned powdered/fresh milk (16%), fortified baby food (18%) for children from the Greater Accra region, compared to tinned powdered/fresh milk (4%), fortified baby food (4%). Again the Western region and Northern regions give different average probabilities of food consumption. For instance, children from the Western region had average predicted probabilities in the consumption of food items such as juice, fortified baby food, eggs of 21%, 22%, 37%, respectively, compared to children from the Northern region of juice (3%), fortified baby food (4%), and eggs (9%) (Table 8).
Table 8.
Average Predictive Margins (APMs) with standard error (SE) for a geographical area on consuming specific food items and food groups among children aged 6–23 months, GDHS-2014.
Regarding the food groups, children located in Greater Accra had a predictive margin of 34% in dairy product consumption compared to that of children from the Upper West of 8% in dairy product consumption. A higher variation of predictive margins was observed in egg consumption between the Western region (37%) and Upper East (9%).
Overall, a higher magnitude of average predictive margin was observed between geographical areas after adjusting child, maternal, household, and community characteristics. The findings revealed that the probability of a child having an ADDC was 0.43 or 43% in Greater Accra, compared to children from Volta (10%) and Ashanti (8%) (Table 8). The highest average predictive margin was recorded in the Greater Accra region, followed by Central, Bono-Ahafo, Western, Northern and Upper East, Upper West, Eastern, Volta, and Ashanti, in that order (Figure 3).
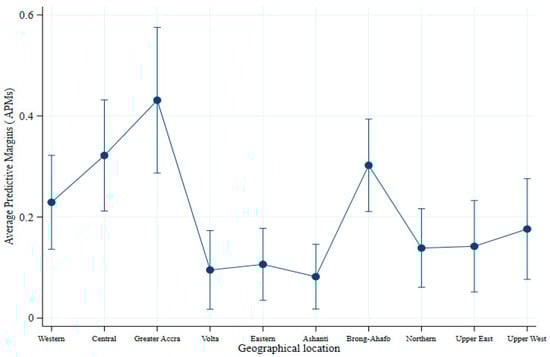
Figure 3.
Average predictive margin of geographical location with 95% CIs.
3.5. Sensitivity Analysis
The sensitivity analysis conducted among children aged 24–59 months old revealed a lower mean dietary diversity intake of 2.63 (Appendix A Table A1) than children aged 6–23 months (3.39). The analysis revealed the same trend in consuming specific food items, food groups, and adequate dietary diversity consumption among these age groups. The study found no interaction between predictor variables maternal education, household wealth, and geographical area, and ADDC among children aged 6–23 months (p = 0.305). Moreover, clarifying with states’ fixed effects further confirmed a similar relationship between mother’s education, household wealth, and ADDC. For example, the OR of household wealth between poorer and wealthiest households were 0.96; 95% CI: 0.52–1.78 and 1.90; 95% CI: 0.75–4.85, respectively. Also, the ORs of mothers’ education between high educational background mothers and no education mothers were 2.22; 95% CI: 0.82–6.07 and 0.82; 95% CI: 0.46–1.49 (Appendix A Table A2). The sensitivity analysis confirmed that children from wealthy backgrounds had higher ADDC odds than children from poor households, while children whose mothers had higher education levels also had higher odds than children whose mothers had no education.
4. Discussion
This study was set up to explore the pattern of specific food consumption, food groups, and ADDC among 6–23-month-old children in Ghana. Our analysis showed that ADDC was significantly associated with socio-demographic characteristics. The relationship between ADDC and socio-demographic characteristics, including maternal education, household wealth, and geographical locations, remained significant after adjusting other covariates. This study’s findings were consistent with previous work indicating an association between adequate dietary diversity score and socioeconomic status [31,71,72]. This work’s results were consistent with a study conducted in Ghana that found a positive relationship of maternal education and household wealth with a child’s dietary diversity score [38,40,45]. The study further revealed large disparities in the consumption of specific food items, food groups, and dietary diversity across Ghana’s 10 administrative regions among children aged 6–23 months. The findings further confirmed that food accessibility challenges transition into Ghana’s dietary diversity problem [73,74]. Children from certain regions, particularly Greater Accra, Western, Bono-Ahafo, and Central region, were more likely to have higher chances of consuming an adequate dietary diversity than their counterparts from the Volta, Eastern, and Ashanti regions. These findings were consistent with several studies conducted in Ghana and other developing countries that found differences in national nutrition adequacy among children in different locations [44,47,75,76]. Agriculture is mainly rain-fed in Ghana, and farmers face challenges from climate change, the poor road network, inadequate marketing, and lack of access to finance [77]. Climate conditions have a huge impact on food production in all parts of the country, together with other problems such as the poor road network, lack of finance, and inadequate market results in food security problems in different regions of the country.
Mainly, food items and food groups such as juice, tinned powdered/fresh milk, fortified baby food, eggs, and fruits were strongly associated with maternal education and household wealth. The findings revealed that maternal education and household wealth are relevant factors that determine food varieties’ consumption. This finding was consistent with similar research conducted in Rwanda and research to determine factors that influence children’s eating behaviors [78,79]. The multivariate analysis of those studies showed that consumption of a variety of food depends on maternal education and household wealth. Overall dietary diversity intake was found to increase with household wealth and mother’s education. However, most of the higher differentials were observed among the consumption of dairy products. For example, higher differential was found in the consumption of tinned powdered/fresh milk (6% vs. 50%) by mother’s education and (4% vs. 25%) by household wealth. Meanwhile, a small differential was observed in high protein source foods such as fish and shellfish, with a higher differential for poorer vs. richest (38% vs. 47%) and higher education vs. no education (41% vs. 56%).
Furthermore, the study revealed that food items and food groups’ consumption was strongly correlated with the children’s geographical location. The finding was consistent with other previous studies [80,81,82]. The previous work’s findings revealed that globally, geographical location affects dietary consumption due to food availability and affordability constraints. Great discrepancies in ADDC among children aged 6–23 months were observed in Ghana’s 10 administrative regions, with a magnitude of 0.43 or 43% and 0.08 or 8% between the highest and lowest.
Generally, the consumption of carbohydrate foods (grains, root, and tubers) across the 10 regions was relatively higher than Vitamin A-rich fruits and vegetables. For example, the average intake of grain, root, and tubers in Greater Accra was 94% compared to Vitamin A-rich fruits and vegetables at 66% (Table 6). Further studies to establish the trend of carbohydrate and vitamin intake across Ghana’s regions will help.
The study has both strengths and limitations. The important strength is using nationally representative data from GDHS to analyze the dietary diversity among children aged 6–23 months in Ghana. Again, the use of the eight food groups recommended by WHO-IYCF in 2017 adds more advantages [59]. Moreover, the 24 h recall method in dietary data collection used by the DHS is almost the shortest recall time and is considered more accurate than the longer period because it reduces recall bias chances [77]. However, the use of a cross-sectional design of the survey limits the assessment of causality link. Although 24 h recall is considered the shortest recall time and reduces participants’ memory burden, recall bias may be present as participants can be selective with the foods they choose to recall [83]. Furthermore, the lack of detailed information on important variables such as the cooking method used, seasonality data, and portion size can be a limitation. Specific food consumption varies across seasons. Regardless of all the limitations, the study provides a comprehensive and consistent relationship in all three stated variables.
5. Conclusions
Dietary inadequacy is a major challenge among young children in Ghana. The high level of food insecurity makes it difficult to ensure dietary diversity among children aged 6–23 months. This study aimed to explore the relationship of socioeconomic status and geographical location with ADDC, specific food items, and food groups among children aged 6–23 months in Ghana. The research showed an association of the consumption of specific food items, food groups, and dietary diversity with maternal education, household wealth, and geographical location. However, dairy product consumption increased faster than other food groups, such as legumes and nuts, Vitamin A-rich fruits and vegetables, when maternal education and household wealth improved. Dairy product consumption rose faster than other food groups when socioeconomic statuses, such as mothers’ education and household wealth, increased. The study also showed that the consumption of specific food items, food groups, and dietary diversity differ across Ghana’s 10 administrative regions. It was observed that consumption of grains, root, and tubers (88%) was relatively higher compared to Vitamin A-rich fruits and vegetables (12%) and legumes and nuts (13%) (Table 2). Based on this work’s findings, there is a need for nutritional policy interventions to improve child dietary diversity through proper infant and young child feeding practices to foster child development.
Author Contributions
Conceptualization, I.A. and F.N.; methodology, I.A.; software I.A.; validation, I.A., F.N., and J.H.; formal analysis, I.A. and J.H.; investigation, I.A., F.N., and J.H.; resources, F.N.; data curation, I.A.; writing—original draft preparation, I.A.; writing—review and editing, I.A., F.N., and J.H.; visualization, I.A.; supervision, F.N., J.H.; project administration, F.N.; funding acquisition, I.A. and F.N. All authors have read and agreed to the published version of the manuscript.
Funding
This research was funded by the National Natural Science Foundation of China (NSFC) (Project number: 71661147001; Project number: 71861147003), the National Social Science Fund of China (Project number: 16ZDA021), and the Chinese Academy of Agricultural Sciences (Project number: CAAS-ASTIP-2016-AII).
Institutional Review Board Statement
Ethical review and approval were waived for this study, due to the use of completely anonymous public data set.
Informed Consent Statement
The dataset was exempted from specific permission because it was based on an anonymous public use dataset with no identifiable information of the study population.
Data Availability Statement
Restrictions apply to the availability of these data. Data was obtained from demographic and health survey (DHS) and are available at https://dhsprogram.com/data/available-datasets.cfm (accessed on 11 February 2021) with the permission of DHS.
Acknowledgments
The authors wish to thank the Ghana Statistical Service (GSS) and Demographic and Health Surveys (DHS) ICF International. Special gratitude goes to Sutapa Agrawal, Toba Stephen Olasahinde, Vincent Ninkuu, Kwadwo Agyapong Agyenim Boateng, and Uchechuku Edna Obianwuna for their assistance.
Conflicts of Interest
The authors declare no conflict of interest.
Appendix A
Table A1.
Dietary diversity intake in the last 24 h by Ghanaian children aged 24–59 months, GDHS-14 (N = 534).
Table A1.
Dietary diversity intake in the last 24 h by Ghanaian children aged 24–59 months, GDHS-14 (N = 534).
| Characteristics | Frequency | Percentage |
|---|---|---|
| Dietary diversity intake | ||
| Adequate | 68 | 12.8 |
| Inadequate | 466 | 87.2 |
| Dietary diversity score—mean (CI 95%) | 2.63 (2.29–2.77) |
Table A2.
The association between mother’s education, household and adequate dietary diversity of children aged 24–59 months, adjusted odds ratios (ORs) with confidence intervals (CIs), GDHS-2014.
Table A2.
The association between mother’s education, household and adequate dietary diversity of children aged 24–59 months, adjusted odds ratios (ORs) with confidence intervals (CIs), GDHS-2014.
| Characteristics | Frequency | Percentage |
|---|---|---|
| Dietary diversity intake | ||
| Adequate | 68 | 12.8 |
| Inadequate | 466 | 87.2 |
| Dietary diversity score—mean (CI 95%) | 2.63 (2.29–2.77) |
References
- Uusiku, N.P.; Oelofse, A.; Duodu, K.G.; Bester, M.J.; Faber, M. Nutritional value of leafy vegetables of sub-Saharan Africa and their potential contribution to human health: A review. J. Food Compos. Anal. 2010, 23, 499–509. [Google Scholar] [CrossRef]
- Worsley, A. Nutrition knowledge and food consumption: Can nutrition knowledge change food behaviour? Asia Pac. J. Clin. Nutr. 2002, 11, S579–S585. [Google Scholar] [CrossRef]
- Michaelsen, K.F. Feeding and Nutrition of infants and Young Children: Guidelines for the WHO European Region, with Emphasis on the Former Soviet Countries; WHO Regional Publications: Copenhagen, Denmark, 2000. [Google Scholar]
- Kirkpatrick, S.I.; McIntyre, L.; Potestio, M.L. Child Hunger and Long-term Adverse Consequences for Health. Arch. Pediatr. Adolesc. Med. 2010, 164, 754–762. [Google Scholar] [CrossRef] [PubMed]
- World Health Organization. Global Strategy for Infant and Young Child Feeding: The Optimal Duration of Exclusive Breastfeeding; WHO: Geneva, Switzerland, 2001. [Google Scholar]
- Guterres, A. Report of the Secretary-General on SDG Progress 2019: Special Edition. United Nations. Available online: https://sustainabledevelopment.un.org/content/documents/24978Report_of_the_SG_on_SDG_Progress_2019.pdf (accessed on 4 September 2020).
- United Nations. The Sustainable Development Goals Report, 2019; United Nations: New York, NY, USA, 2019. [Google Scholar]
- Black, R.E.; Victora, C.G.; Walker, S.P.; A Bhutta, Z.; Christian, P.; De Onis, M.; Ezzati, M.; Grantham-McGregor, S.; Katz, J.; Martorell, R.; et al. Maternal and child undernutrition and overweight in low-income and middle-income countries. Lancet 2013, 382, 427–451. [Google Scholar] [CrossRef]
- Ghana Statistical Service. Ghana Multiple Indicator Cluster Survey with an Enhanced Malaria Module and Biomarker, Final Report; Ghana Statistical Service: Accra, Ghana, 2011.
- University of Ghana; GroundWork; University of Wisconsin-Madison; KEMRI-Wellcome Trust; UNICEF. Ghana Micronutrient Survey 2017; University of Ghana: Accra, Ghana, 2017. [Google Scholar]
- Feed the Future. Proceedings of The U.S government’s Global Hunger and Food Security Initiative: The Global Food Security Strategy (GFSS) Ghana Country Plan Report. 2018. Available online: https://www.feedthefuture.gov/resource/global-food-security-strategy-gfss-ghana-country-plan/ (accessed on 4 September 2020).
- ICF Macro. Nutrition of Children and Women in Ghana: A New Look at Data from the 2008 Ghana Demographic and Health Survey; ICF Macro: Calverton, MD, USA, 2010. [Google Scholar]
- UNICEF Ghana. National Nutrition Policy Report. 2016. Available online: https://www.unicef.org/ghana/reports/national-nutrition-policy (accessed on 10 November 2020).
- Bellamy, C. The State of the World’s Children 1998: Focus on Nutrition; UNICEF: New York, NY, USA, 1998. [Google Scholar]
- Li, Y.; Wedick, N.M.; Lai, J.; He, Y.; Hu, X.; Liu, A.; Du, S.; Zhang, J.; Yang, X.; Chen, C.; et al. Lack of dietary diversity and dyslipidaemia among stunted overweight children: The 2002 China National Nutrition and Health Survey. Public Health Nutr. 2011, 14, 896–903. [Google Scholar] [CrossRef]
- UNICEF. The State of the World’s Children 2019. Growing Well in a Changing World. Children, Food and Nutrition; UNICEF: Geneva, Switzerland, 2019. [Google Scholar]
- Ahmed, A.M.S.; Ahmed, T.; Roy, S.K.; Alam, N.; Hossain, I. Determinants of undernutrition in children under 2 years of age from rural Bangladesh. Indian Pediatr. 2012, 49, 821–824. [Google Scholar] [CrossRef] [PubMed]
- Nandy, S.; Irving, M.; Gordon, D.; Subramanian, S.V.; Smith, G.D. Poverty, child undernutrition and morbidity: New evidence from India. Bull. World Health Organ. 2005, 83, 210–216. [Google Scholar]
- Urke, H.B.; Bull, T.; Mittelmark, M.B. Socioeconomic status and chronic child malnutrition: Wealth and maternal education matter more in the Peruvian Andes than nationally. Nutr. Res. 2011, 31, 741–747. [Google Scholar] [CrossRef] [PubMed]
- Haddad, L.J.; Alderman, H.; Appleton, S.; Song, L.; Yohannes, Y. Reducing Child Undernutrtion: How Far does Income Growth Take Us? Food Consumption and Nutrition Division (FCND) International Food Policy Research Institute: Washington, DC, USA, 2002. [Google Scholar]
- Echouffo-Tcheugui, J.B.; Ahima, R.S. Does diet quality or nutrient quantity contribute more to health? J. Clin. Investig. 2019, 129, 3969–3970. [Google Scholar] [CrossRef] [PubMed]
- Schulze, M.B.; Martínez-González, M.A.; Fung, T.T.; Lichtenstein, A.H.; Forouhi, N.G. Food based dietary patterns and chronic disease prevention. BMJ 2018, 13, k2396. [Google Scholar] [CrossRef] [PubMed]
- Sealey-Potts, C.; Potts, A.C. An assessment of dietary diversity and nutritional status of preschool children. Nutr. Food Sci. 2014, 2, 1040. [Google Scholar]
- Moursi, M.; Arimond, M.; Dewey, K.G.; Trèche, S.; Ruel, M.T.; Delpeuch, F. Dietary Diversity Is a Good Predictor of the Micronutrient Density of the Diet of 6- to 23-Month-Old Children in Madagascar. J. Nutr. 2008, 138, 2448–2453. [Google Scholar] [CrossRef]
- Mallard, S.R.; Houghton, L.A.; Filteau, S.; Chisenga, M.; Siame, J.; Kasonka, L.; Mullen, A.; Gibson, R.S. Micronutrient adequacy and dietary diversity exert positive and distinct effects on linear growth in urban Zambian infants. J. Nutr. 2016, 146, 2093–2101. [Google Scholar] [CrossRef]
- Rah, J.H.; Akhter, N.; Semba, R.D.; De Pee, S.; Bloem, M.W.; A Campbell, A.; Moench-Pfanner, R.; Sun, K.; Badham, J.; Kraemer, K. Low dietary diversity is a predictor of child stunting in rural Bangladesh. Eur. J. Clin. Nutr. 2010, 64, 1393–1398. [Google Scholar] [CrossRef] [PubMed]
- Mahmudiono, T.; Sumarmi, S.; Rosenkranz, R.R. Household dietary diversity and child stunting in East Java, Indonesia. Asia Pac. J. Clin. Nutr. 2017, 26, 317. [Google Scholar]
- World Health Organization. Indicators for Assessing Infant and Young Child Feeding Practices 2010: Part 2: Measurement; World Health Organization: Geneva, Switzerland, 2010. [Google Scholar]
- Working Group on Infant and Young Child Feeding Indicators Developing and Validating Simple Indicators of Dietary Quality and Energy Intake of Infants and Young Children in Developing Countries 2006: Summary of Findings from Analysis of 10 Data Sets. Available online: https://www.fantaproject.org/sites/default/files/resources/IYCF_Datasets_Summary_2006.pdf (accessed on 28 November 2020).
- Arimond, M.; Ruel, M.T. Dietary Diversity Is Associated with Child Nutritional Status: Evidence from 11 Demographic and Health Surveys. J. Nutr. 2004, 134, 2579–2585. [Google Scholar] [CrossRef]
- Kandala, N.-B.; Madungu, T.P.; Emina, J.B.; Nzita, K.P.; Cappuccio, F.P. Malnutrition among children under the age of five in the Democratic Republic of Congo (DRC): Does geographic location matter? BMC Public Health 2011, 11, 261. [Google Scholar] [CrossRef]
- Agrawal, S.; Kim, R.; Gausman, J.; Sharma, S.; Sankar, R.; Joe, W.; Subramanian, S.V. Socio-economic patterning of food consumption and dietary diversity among Indian children: Evidence from NFHS-4. Eur. J. Clin. Nutr. 2019, 73, 1361–1372. [Google Scholar] [CrossRef] [PubMed]
- Mallard, S.R.; Houghton, L.A.; Filteau, S.; Mullen, A.; Nieuwelink, J.; Chisenga, M.; Siame, J.; Gibson, R.S. Dietary diversity at 6 months of age is associated with subsequent growth and mediates the effect of maternal education on infant growth in urban Zambia. J. Nutr. 2014, 144, 1818–1825. [Google Scholar] [CrossRef]
- Marquis, G.S.; Colecraft, E.K.; Kanlisi, R.; Aidam, B.A.; Atuobi-Yeboah, A.; Pinto, C.; Aryeetey, R. An agriculture–nutrition intervention improved children’s diet and growth in a randomized trial in G hana. Matern Child Nutr. 2018, 14, e12677. [Google Scholar] [CrossRef]
- Saaka, M.; Galaa, S.Z. How is dietary diversity related to haematological status of preschool children in Ghana? Food Nutr. Res. 2017, 61, 1333389. [Google Scholar] [CrossRef] [PubMed]
- Wemakor, A.; Laari, J. Association between household dietary diversity and nutritional status of children (6–36 months) in Wenchi Municipality, Brong Ahafo Region, Ghana. Nutrire 2018, 43, 22. [Google Scholar] [CrossRef]
- Abizari, A.-R.; Azupogo, F.; Nagasu, M.; Creemers, N.; Brouwer, I.D. Seasonality affects dietary diversity of school-age children in northern Ghana. PLoS ONE 2017, 12, e0183206. [Google Scholar] [CrossRef] [PubMed]
- Nti, C.A. Dietary Diversity is Associated with Nutrient Intakes and Nutritional Status of Children in Ghana. Asian J. Med. Sci. 2011, 17, 105–109. [Google Scholar] [CrossRef]
- Frempong, R.B.; Annim, S.K. Dietary diversity and child malnutrition in Ghana. Heliyon 2017, 3, e00298. [Google Scholar] [CrossRef] [PubMed]
- Amugsi, D.A.; Mittelmark, M.B.; Lartey, A. Dietary Diversity is a Predictor of Acute Malnutrition in Rural but Not in Urban Settings: Evidence from Ghana. Br. J. Med. Med. Res. 2014, 4, 4310–4324. [Google Scholar] [CrossRef]
- Georgieff, M.K.; Ramel, S.E.; Cusick, S.E. Nutritional influences on brain development. Acta Paediatr. 2018, 107, 1310–1321. [Google Scholar] [CrossRef] [PubMed]
- Schwarzenberg, S.J.; Georgieff, M.K. Committee on Nutrition Advocacy for Improving Nutrition in the First 1000 Days to Support Childhood Development and Adult Health. Pediatrics 2018, 141, e20173716. [Google Scholar] [CrossRef] [PubMed]
- Cusick, S.E.; Georgieff, M.K. The Role of Nutrition in Brain Development: The Golden Opportunity of the “First 1000 Days”. J. Pediatr. 2016, 175, 16–21. [Google Scholar] [CrossRef] [PubMed]
- Issaka, A.I.; E Agho, K.; Burns, P.; Page, A.; Dibley, M.J. Determinants of inadequate complementary feeding practices among children aged 6–23 months in Ghana. Public Health Nutr. 2015, 18, 669–678. [Google Scholar] [CrossRef] [PubMed]
- Amugsi, D.A.; Mittelmark, M.B.; Oduro, A. Association between Maternal and Child Dietary Diversity: An Analysis of the Ghana Demographic and Health Survey. PLoS ONE 2015, 10, e0136748. [Google Scholar] [CrossRef]
- Atsu, B.K.; Guure, C.; Laar, A.K. Determinants of overweight with concurrent stunting among Ghanaian children. BMC Pediatr. 2017, 17, 177. [Google Scholar] [CrossRef]
- Darteh, E.K.M.; Acquah, E.; Kumi-Kyereme, A. Correlates of stunting among children in Ghana. BMC Public Health 2014, 14, 504. [Google Scholar] [CrossRef]
- Alkerwi, A.; Vernier, C.; Sauvageot, N.; Crichton, G.E.; Elias, M.F. Demographic and socioeconomic disparity in nutrition: Application of a novel Correlated Component Regression approach. BMJ Open 2015, 5, e006814. [Google Scholar] [CrossRef] [PubMed]
- James, W.P.T.; Nelson, M.; Ralph, A.; Leather, S. Socioeconomic determinants of health: The contribution of nutrition to inequalities in health. BMJ 1997, 314, 1545. [Google Scholar] [CrossRef]
- Turrell, G.; Hewitt, B.; Patterson, C.; Oldenburg, B. Measuring socioeconomic position in dietary research: Is choice of socioeconomic indicator important. Public Health Nutr. 2003, 6, 191–200. [Google Scholar] [CrossRef]
- Ruel, M.T. Is Dietary Diversity an Indicator of Food Security or Dietary Quality? A Review of Measurement Issues and Research Needs. Food Nutr. Bull. 2003, 24, 231–232. [Google Scholar] [CrossRef]
- Hatløy, A.; E Torheim, L.; Oshaug, A. Food variety—a good indicator of nutritional adequacy of the diet? A case study from an urban area in Mali, West Africa. Eur. J. Clin. Nutr. 1998, 52, 891–898. [Google Scholar] [CrossRef]
- United Nations Children’s Fund. UNICEF’s Approach to Scaling up Nutrition for Mothers and Their Children. Discussion Paper. Programme Division; UNICEF: New York, NY, USA, 2015. [Google Scholar]
- Ghana Statistical Service–GSS, Ghana Health Service–GHS, and ICF International. Ghana Demographic and Health Survey 2014; GSS, GHS, and ICF International: Rockville, MD, USA, 2015. [Google Scholar]
- Measure DHS. The DHS Program: Demographic and Health Surveys; ICF Macro: Rockville, MD, USA. Available online: https://dhsprogram.com/data/available-datasets.cfm (accessed on 28 May 2020).
- Ghana Statistical Service (GSS) Government of Ghana; Ghana Health Service (GHS) Government of Ghana; National Public Health Reference Laboratory (NPHRL) Government of Ghana. Available online: https://wbwaterdata.org/dataset/ghana-demographic-and-health-survey-2014 (accessed on 3 November 2020).
- Seidu, A.-A.; Ameyaw, E.K.; Ahinkorah, B.O.; Bonsu, F. Determinants of early initiation of breastfeeding in Ghana: A population-based cross-sectional study using the 2014 Demographic and Health Survey data. BMC Pregnancy Childbirth 2020, 20, 632. [Google Scholar] [CrossRef]
- World Health Organization. Indicators for Assessing Infant and Young Child Feeding Practices: Part 1: Definitions: Conclusions of a Consensus Meeting held 6–8 November 2007 in Washington, DC, USA; World Health Organization: Geneva, Switzerland, 2008. [Google Scholar]
- World Health Organization. Global Nutrition Monitoring Framework: Operational Guidance for Tracking Progress in Meeting Targets for 2025; World Health Organization: Geneva, Switzerland, 2017. [Google Scholar]
- Croft, T.N.; Aileen, M.J.M.; Courtney, K.A. Guide to DHS Statistics: DHS-7; ICF: Rockville, MD, USA, 2018. [Google Scholar]
- Howe, L.D.; Hargreaves, J.R.; Gabrysch, S.; Huttly, S.R. Is the wealth index a proxy for consumption expenditure? A systematic review. J. Epidemiol. Community Health 2009, 63, 871–877. [Google Scholar] [CrossRef]
- Rutstein, S.O.; Johnson, K. The DHS Wealth Index. DHS Comparative Reports no. 6; ORC Macro: Calverton, NY, USA, 2004. [Google Scholar]
- Rutstein, S.O. Steps to Constructing the New DHS Wealth Index; ICF International: Rockville, MD, USA, 2015. [Google Scholar]
- Córdova, A. Methodological note: Measuring relative wealth using household asset indicators. AmericasBarometer Insights 2009, 6, 1–9. [Google Scholar]
- Rutstein, S.O.; Staveteig, S. Making the Demographic and Health Surveys Wealth Index Comparable; ICF International Measure DHS: Calverton, MD, USA, 2014. [Google Scholar]
- Jann, B. Predictive Margins and Marginal Effects in Stata 11th German Stata Users Group Meeting; University of Potsdam: Potsdam, Germany, 2013. [Google Scholar]
- Williams, R. Using the Margins Command to Estimate and Interpret Adjusted Predictions and Marginal Effects. Stata J. Promot. Commun. Stat. Stata 2012, 12, 308–331. [Google Scholar] [CrossRef]
- Bartus, T. Estimation of Marginal Effects using Margeff. Stata J. Promot. Commun. Stat. Stata 2005, 5, 309–329. [Google Scholar] [CrossRef]
- Long, J.S.; Freese, J. Regression Models for Categorical Dependent Variables Using Stata; Stata Press: College Station, TX, USA, 2006. [Google Scholar]
- Senaviratna, N.A.M.R.; Cooray, T.M.J.A. Diagnosing Multicollinearity of Logistic Regression Model. Asian J. Probab. Stat. 2019, 1–9. [Google Scholar] [CrossRef]
- Nguyen, P.H.; Avula, R.; Ruel, M.T.; Saha, K.K.; Ali, D.; Tran, L.M.; Frongillo, E.A.; Menon, P.; Rawat, R. Maternal and Child Dietary Diversity Are Associated in Bangladesh, Vietnam, and Ethiopia. J. Nutr. 2013, 143, 1176–1183. [Google Scholar] [CrossRef]
- Meng, T.; Florkowski, W.J.; Sarpong, D.B.; Chinnan, M.S.; Resurreccion, A.V. Alimental Food Consumption Among Urban Households: An Empirical Study of Ghana. J. Agric. Appl. Econ. 2018, 50, 188–211. [Google Scholar] [CrossRef]
- Quaye, W. Food security situation in northern Ghana, coping strategies and related constraints. Afr. J. Agric. Res. 2008, 3, 334–342. [Google Scholar]
- Dhami, M.V.; Ogbo, F.A.; Osuagwu, U.L.; Agho, K.E. Prevalence and factors associated with complementary feeding practices among children aged 6–23 months in India: A regional analysis. BMC Public Health 2019, 19, 1034. [Google Scholar] [CrossRef]
- Issaka, A.; Agho, K.; Page, A.N.; Burns, P.L.; Stevens, G.J.; Dibley, M.J. Determinants of suboptimal complementary feeding practices among children aged 6–23 months in four anglophone West African countries. Matern. Child Nutr. 2015, 11, 14–30. [Google Scholar] [CrossRef]
- Darfour, B.; Rosentrater, K.A. Agriculture and food security in Ghana. In Proceedings of the 2016 ASABE Annual International Meeting, Orlando, FL, USA, 17–20 July 2016; p. 1. [Google Scholar]
- Biró, G.; Hulshof, K.F.A.M.; Ovesen, L.; Cruz, J.A.A.; for the EFCOSUM Group. Selection of methodology to assess food intake. Eur. J. Clin. Nutr. 2002, 56, S25–S32. [Google Scholar] [CrossRef]
- Van Der, S. The Association Between Complementary Feeding Indicators and Linear Child Growth and the Determinants of Inappropriate Feeding Practices Among Children 6–23 Months in Rwanda 2015. Master’s Thesis, Wageningen University Division of Epidemiology and Public Health, Wageninger, The Netherlands, June 2015. [Google Scholar]
- Scaglioni, S.; De Cosmi, V.; Ciappolino, V.; Parazzini, F.; Brambilla, P.; Agostoni, C. Factors Influencing Children’s Eating Behaviours. Nutrients 2018, 10, 706. [Google Scholar] [CrossRef]
- Kearney, J. Food consumption trends and drivers. Philos. Trans. R. Soc. B: Biol. Sci. 2010, 365, 2793–2807. [Google Scholar] [CrossRef] [PubMed]
- Herforth, A.; Ahmed, S. The food environment, its effects on dietary consumption, and potential for measurement within agriculture-nutrition interventions. Food Secur. 2015, 7, 505–520. [Google Scholar] [CrossRef]
- UNICEF. The State of the World’s Children 2019. Children, Food and Nutrition: Growing Well in a Changing World; UNICEF: New York, NY, USA, 2019. [Google Scholar]
- Dietary Assessment: A Resource Guide to Method Selection and Application in Low Resource Settings; FAO: Rome, Italy, 2018.


Publisher’s Note: MDPI stays neutral with regard to jurisdictional claims in published maps and institutional affiliations. |
© 2021 by the authors. Licensee MDPI, Basel, Switzerland. This article is an open access article distributed under the terms and conditions of the Creative Commons Attribution (CC BY) license (http://creativecommons.org/licenses/by/4.0/).