Article

Stratification of Volunteers According to Flavanone Metabolite Excretion and Phase II Metabolism Profile after Single Doses of ‘Pera’ Orange and ‘Moro’ Blood Orange Juices

by
Alessandra Nishioka
1,†,
Eric de Castro Tobaruela
1,†,
Layanne Nascimento Fraga
1,†,
Francisco A. Tomás-Barberán
2,
Franco Maria Lajolo
1 and
Neuza Mariko Aymoto Hassimotto
1,*
1
Food Research Center (FoRC) and School of Pharmaceutical Sciences, University of São Paulo, São Paulo 05508-000, Brazil
2
Research Group on Quality, Safety and Bioactivity of Plant Foods, Department of Food Science and Technology, CEBAS-CSIC, P.O. Box 164, Campus de Espinardo, 30100 Murcia, Spain
*
Author to whom correspondence should be addressed.
These authors have contributed equally to this work.
Nutrients 2021, 13(2), 473; https://doi.org/10.3390/nu13020473
Submission received: 23 December 2020 / Revised: 16 January 2021 / Accepted: 28 January 2021 / Published: 30 January 2021
(This article belongs to the Special Issue Impact of Dietary Components on Gut Microbiota)

Abstract

:
Large interindividual variations in the biological response to citrus flavanones have been observed, and this could be associated with high variations in their bioavailability. The aim of this study was to identify the main determinants underlying interindividual differences in citrus flavanone metabolism and excretion. In a randomized cross-over study, non-obese and obese volunteers, aged 19–40 years, ingested single doses of Pera and Moro orange juices, and urine was collected for 24 h. A large difference in the recovery of the urinary flavanone phase II metabolites was observed, with hesperetin-sulfate and hesperetin-sulfo-O-glucuronide being the major metabolites. Subjects were stratified according to their total excretion of flavanone metabolites as high, medium, and low excretors, but the expected correlation with the microbiome was not observed at the genus level. A second stratification was proposed according to phase II flavanone metabolism, whereby participants were divided into two excretion groups: Profiles A and B. Profile B individuals showed greater biotransformation of hesperetin-sulfate to hesperetin-sulfo-O-glucuronide, as well as transformation of flavanone-monoglucuronide to the respective diglucuronides, suggestive of an influence of polymorphisms on UDP-glucuronosyltransferase. In conclusion, this study proposes a new stratification of volunteers based on their metabolic profiles. Gut microbiota composition and polymorphisms of phase II enzymes may be related to the interindividual variability of metabolism.

1. Introduction

Orange fruit (Citrus sinensis L. Osbeck) and 100% orange juice, which are rich sources of flavanones, have been associated with health benefits leading to decreases in the occurrence of chronic non-communicable diseases such as obesity, diabetes, and hypertension [1,2,3,4]. The main flavanones present in these products are hesperidin (hesperetin-7-O-rutinoside) and narirutin (naringenin-7-O-rutinoside), which are biologically active in suppressing inflammation and oxidative stress as well as modulating several cell-signaling pathways [2,5,6,7,8]. Regarding the biological response, intake of 100% orange juice has been shown to have lipid- [9,10,11], glucose- [12], and blood-pressure-lowering activities as well as being associated with an improvement in insulin sensitivity [4,9,13,14].
Recent systematic reviews of animal studies and human clinical studies had different conclusions about citrus flavonoids and orange juice protection against cardiometabolic diseases. One of them had no definitive conclusion about the effects of orange juice intake or hesperidin on cardiovascular protection [3]. Another concluded that citrus flavonoids are promising candidates to protect against diabetes [15]. These contradictory findings are probably associated with the high heterogeneity in biological responses to phytochemicals and the food matrix, presenting high standard deviations, which reflect the interindividual variability.
With the aim of understanding the determinants of interindividual variation, the European Cooperation in Science and Technology (COST) Action POSITIVE proposed strategies to stratify the population into sub-sets, considering the main determinants in the bioavailability variation of plant food bioactive compounds, including genetic variability, the gut microbiome, and other factors, clustering individuals with similar metabolic phenotypes. Thus, the identification of individuals and biomarkers according to their metabotypes could be a way to identify those that are responsive to certain bioactive compounds [16,17,18].
The biological activity of flavanones depends on their absorption and circulating levels, and factors that affect their bioavailability could influence their biological activity. The absorption of the citrus flavanones naringenin- and hesperetin-rutinosides occurs in the large intestine, where the sugar moieties attached to the flavanone backbone are hydrolyzed by microbial α-rhamnosidases and β-glucosidases. The released flavanone aglycones are then absorbed and further conjugated with glucuronic acid and/or sulfate groups by the action of the phase II enzymes, UDP-glucuronosyltransferase (UGT), and sulfotransferase (SULT), respectively, reaching the circulation through the portal vein and undergoing further metabolization in the liver [19,20,21]. In this way, the gut microbiota is an important factor in citrus flavanone bioavailability [21,22,23,24,25,26,27,28].
Previous studies described the considerable variation in flavanone metabolite excretion after a single dose of orange juice, reflecting differences in bioavailability [29,30]. The significant heterogeneity observed may be related to several factors, such as gender, age, health condition, gene polymorphisms, anthropometric parameters, and the gut microbiota composition [18,21,28,29,31,32,33,34,35]. According to the urinary recovery of citrus flavanone metabolites, the clustering of subjects into groups with high, medium, and low urinary excretion capabilities [29,30] reinforces the influence of the gut microbiota in citrus flavanone metabolism. Furthermore, weak negative correlations with hesperetin excretion and age could also influence flavanone absorption after a single ingestion of orange juice [31]. However, no correlations with the subjects’ body mass index (BMI) and gender were observed [35].
Otherwise, subjects with higher BMI values excreted more 3-(3′-hydroxy-4′-methoxyphenyl) propanoic acid, a microbial catabolite of hesperetin, compared to those with lower BMI values [35], showing the importance of the microbial strains in flavanone metabolism. The effect of polymorphisms in phase II enzymes, including sulfotransferase (SULT) and UDP-glucuronosyltransferase (UGT), on flavonoid metabolism is less known but may be a driving factor in the variation in citrus flavanone metabolism. Genetic polymorphisms in the SULT1A1 gene are associated with three alleles, showing differences in Vmax, with the SULT1A1*1 variant presenting the highest activity toward the flavonoids chrysin, genistein, and quercetin, followed by variants *3 and *2 [36]. Additionally, polymorphisms in the UGT gene, such as the UGT1A1*28 variant, present lower activity in the glucuronidation of endogenous substrates and xenobiotics [37]. In this way, there is still much to understand about the factors that influence flavanone bioavailability and affect its interindividual variation.
Considering that the identification and understanding of the main determinants underlying interindividual differences in the metabolism and excretion of citrus flavanones are essential to understand their bioactivity, this study evaluates the stratification of subjects by the excretion of flavanone phase II metabolites and the identification of flavanone excretion characteristics and, therefore, the exposure of sub-groups. For this purpose, obese and non-obese subjects ingested single doses of two orange juices obtained from the Pera (POJ) and Moro (MOJ) orange varieties. The Moro variety is known as the blood orange due to the presence of anthocyanin in its composition.

2. Material and Methods

2.1. Sampling of Orange Juices

Pasteurized orange juices obtained from C. sinensis L. cv Pera (POJ) and Moro (MOJ) were supplied by Fundecitrus (Araraquara, Brazil), located in the southeastern São Paulo state at 23°23′19″ S and 48°43′22″ W. All juices were filled into 1 L flasks and immediately stored at −20 °C.

2.2. Quantification of Soluble Sugar, Organic Acids, and Dietary Fiber

The soluble sugars were analyzed by high performance liquid chromatography (HPLC) coupled to a pulse amperometric detector according to Shiga et al. [38]. The organic acid contents were analyzed by HPLC in a HP1100 system (Hewlett-Packard Company, Palo Alto, CA, USA) coupled with a diode-array detector, equipped with a μBondpack C18 (300 mm × 3.6 mm i.d., Waters, Milford, MA, USA) and elution (flow rate of 0.5 mL.min−1) was carried out in isocratic conditions with 0.1% H3PO4, monitored at 210 nm. The content of total dietary fiber (TDF) and fractions were measured according to the method described by Association of Official Analytical Chemists (AOAC) (AOAC 991.43) [39].

2.3. Quantification of Flavanones in Orange Juice

The orange juices (10 mL) were centrifuged at 10,000× g for 15 min at 4 °C. The supernatant was eluted in a column of 1 g of polyamide (CC 6, Macherey–Nagel), previously preconditioned by passing methanol followed by deionized water. The phenolic compounds were eluted with methanol acidified with 2.5% acetic acid. The eluates were completely dried by rotary evaporation (Rotavapor, RE 120, Büchi, Flawil, Switzerland) under a vacuum at 40 °C, resuspended with methanol acidified with 5% acetic acid, and filtered through a 0.45 µm PVDF Millex filter (Millipore Ltd.a., Bedford, MA, USA) before HPLC analysis. The pellet was added to 20 mL of dimethyl sulfoxide, homogenized overnight at room temperature, centrifuged, and filtered through a 0.45 µm PVDF filter.
Samples were analyzed by HPLC on Agilent 2100 equipment coupled to a diode array detector (DAD) using a Prodigy 5 µm ODS3 column (250 × 4.60 mm) (Phenomenex Ltd., Cheshire, UK) with a flow rate of 1 mL.min−1 at 25 °C. Elution was carried out with a solvent gradient constituted of 0.5% formic acid in water (A) and 0.5% formic acid in acetonitrile (B). The solvent concentration gradient applied was 8% B at the beginning, 10% for 5 min, 17% for 10 min, 25% for 15 min, 50% for 25 min, 90% for 30 min, 50% for 32, and 8% for 35 min. The eluates were monitored at 280 and 525 nm [40]. Quantification was performed using a calibration curve of cyanidin-3-O-glucoside (at 525 nm) and hesperidin, narirutin, and didymin (Extrasynthese, Genay, France) at 280 nm.
Peak identification was carried out by Prominence liquid chromatography (Shimadzu, Japan) coupled to an ion trap mass spectrometer (Esquire HCT model, Bruker Daltonics, Billerica, MA, USA). The separation conditions were the same as those used for HPLC/DAD, and the flow rate was changed to 0.2 mL.min−1 to allow the eluate to pass through the mass spectrometer. The ESI was maintained in positive and negative modes for anthocyanins and other flavonoid classes, respectively. The mass operating conditions were programed to perform a full scan (m/z 100–1000), with a collision energy of 3000–3500 V, and a capillary temperature of 275 °C. Peak identification was carried out by the combined information provided by mass spectra, retention time, and literature data [41]. The identity was confirmed by co-elution with authentic standards.

2.4. Study Population

Twenty-seven women aged between 19 and 40 years were enrolled in this study. Seventeen subjects were non-obese (BMI = 19.00–24.99 kg.m−2) and 10 were obese (BMI ≥ 30.00 kg.m−2). Exclusion criteria applied were a history of gastrointestinal, liver, or kidney disease; habitual drinking or smoking; being diabetic or vegetarian; presenting with any type of infection; use of vitamin and mineral supplements, antibiotics, antacids, or medicines for diarrhea or constipation within four weeks before the start of the study; participation in intense physical activity; being pregnant; breastfeeding mothers; and individuals taking hormone therapy for menopause.
All procedures were approved by the Ethical Committee of the School of Pharmaceutical Science-University of São Paulo, São Paulo (CAAE 61707116.5.0000.0067) and were registered on the Brazilian Registry of Clinical Trials in www.ensaiosclinicos.gov.br (UTN: U1111-1216-2468). All participants were required to sign a written informed consent.

2.5. Study Design

The intervention study had a randomized cross-over design. Fifty-five volunteers were recruited, and only 27 met the inclusion criteria and completed both trials. Three days before and during the intervention, volunteers were instructed to avoid the consumption of citrus fruit, tomato, and fruits rich in anthocyanins, such as strawberries and grapes, and their derivatives, as well as tea and coffee. Each test phase comprised a single dose of each orange juice, POJ and MOJ, separated by a washout period of one week.
After 8 h of fasting, subjects ingested a single 600 mL dose of each juice, and urine was collected before intake and at time intervals of 0–4, 4–8, 8–12, and 12–24 h. The urine from volunteers who ingested MOJ was acidified with 50% formic acid. The total volume in each period was measured. Food restriction was requested during this period. Urine samples were stored in an ultra-freezer at −80 °C until analysis.

2.6. Intestinal Permeability Analysis

Three days before the test, subjects were advised to avoid fruits rich in mannitol, such as apple, guava, pear, grape, plum, cherry, apricot, raspberry, and blackberry. On the day of the trial, anthropometric variables (weight, height, waist circumference, % of body fat) were measured. Body fat (%) was measured using the Omron HBF-514C Digital Body Control Scale with Bioimpedance, and fat percentages of 9% to 22% and greater than or equal to 32% were used to classify subjects as non-obese or obese, respectively [42]. After 10 h of fasting, blood was collected in ethylenediaminetetraacetic acid (EDTA), fluoride, and non-anticoagulant tubes for biochemical analysis. Each subject collected their fecal samples at home using a sterile stool collector, and these were kept in a freezer at −20 °C and transported in appropriate containers with ice to the laboratory. Fecal samples were aliquoted immediately, without thawing, and stored at −80 °C.
Volunteers were asked to eliminate all urine and consume 200 mL of a solution containing 3 g of mannitol and 9.47 g of lactulose. Urine was collected within 5 h into a flask containing 1 mL of thimerosal (0.015 g). The total urine volume was recorded, and an aliquot was stored at −20 °C. All samples were filtered through a 0.45 µm PTFE Millex filter (Millipore Ltd.a., Bedford, MA, USA) before HPLC analysis.
HPLC analysis was performed using a Dionex ICS-5000+ DC detector (Thermo Fisher Scientific, Waltham, MA, USA) in a CarboPac PA1 column (4 × 250 mm) and an isocratic solvent of 500 mM NaOH at a flow rate of 1 mL.min−1. Quantification was performed using a calibration curve using mannitol and lactulose. The results are expressed as the lactulose/mannitol ratio (L/M).

2.7. Biochemical Parameters

Biochemical tests on the following compounds were performed by the clinical analysis laboratory of the University Hospital-University of São Paulo (HU-USP): glucose (enzymatic method—hexokinase); total cholesterol (colorimetric enzymatic method—cholesterol oxidase); low-density lipoprotein (LDL) cholesterol (obtained by the Friedewald equation); high-density lipoprotein (HDL) cholesterol (homogeneous colorimetric enzymatic method without precipitation); triglycerides (colorimetric enzymatic method—glycerol phosphate peroxidase according to Trinder); creatinine (colorimetric method—Jaffé); insulin (electrochemiluminescence—ECLIA); alanine aminotransferase (ALT) (enzymatic method—IFCC without pyridoxal phosphate); and aspartate aminotransferase (AST) (enzymatic method—modified IFCC). Homeostatic model assessment-insulin resistance (HOMA-IR) was calculated according to the formula (fasting insulin (µU.L−1) × fasting glucose (nmol.L−1))/22.5.

2.8. Plasma LPS and Zonulin

The plasma lipopolysaccharide (LPS) concentration was quantified using the QCL-1000TM kit (Limulis Amebocyte Lysate, Lonza, Walkersville, MD, USA) in accordance with the manufacturer’s instructions. Zonulin was quantified using the IDK® Zonulin ELISA K 5601 kit (Eagle Bioscience, NH, USA) in accordance with the manufacturer’s instructions.

2.9. Identification and Quantification of Urine Metabolites

Urine samples were centrifuged at 14,000× g for 5 min at 4 °C and filtered using a 0.22 µm PVDF filter (Millipore Ltd.a., Bedford, MA, USA). Samples were also analyzed by liquid chromatography UPLC-Nexera LC-30AD (Shimadzu, Kyoto, Japan) coupled to an EVOQTM triple quadrupole mass spectrometer (Bruker Daltonics). Separation of each metabolite was performed on a Poroshell 120 C18 column (2.7 µm, 100 × 3.0 mm) (Agilent, Palo Alto, CA, USA), equipped with a 20 × 4.0 mm guard column. The mobile phases used were as follows: (A) water/formic acid (99:1, v/v) and (B) acetonitrile. The solvent concentration gradient for B was 5% at the beginning, 18% at 7 min, 28% at 17 min, 50% at 17 min and 10 sec, 90% at 20 min, 90% at 20 min and 20 s, and 5% at 26 min a flow rate of 0.5 mL.min−1 at 25 °C. The eluates were monitored at 280 and 525 nm. The samples were analyzed in negative and positive modes at a source voltage of 3500 V, a cone temperature of 350 °C, a cone gas flow of 20 L.min−1, a heated probe temperature of 350 °C, a probe gas flow of 40 units, and a nebulizer gas flow of 50 units. Phase II metabolites were identified by the similarity of the mass spectra profile compared with the external standard of the metabolites naringenin-7-O-glucuronide, hesperetin-7-O-glucuronide, and hesperetin-3′-O-glucuronide, kindly donated by Dr. Kroon and Dr. Needs (Quadram Institute, Norwich, UK) and literature data. The area under the curve (AUC) of each peak was normalized by the value of creatinine to express the relative amount of flavanone metabolite excretion.

2.10. Gut Microbiota Profiling

Frozen fecal samples were sent for gut microbiota profile analysis by Neoprospecta Microbiome Technologies (Florianópolis, Brazil), DNA extraction was performed with the Illumina MiSeq platform (Illumina Inc., San Diego, CA, USA). The preparation followed the Bacterial NGS Sequence protocol [43]. The V3/V4 region of the 16S rRNA gene was amplified using primers 341F (CCTACGGGRSGCA-GCAG) and 806R (GGACTACHVGGGTWTCTAAT) [44,45]. DNA amplification was performed by a two-step PCR protocol, both in triplicate, using Platinum Taq Polymerase (Invitrogen, Carlsbad, USA) with the following conditions for PCR 1: 95 °C for 5 min, 25 cycles of 95 °C for 45 s, 55 °C for 30 s and 72 °C for 45 s, and a final extension of 72 °C for 2 min. For PCR 2, the protocol was as follows: 95 °C for 5 min, 10 cycles of 95 °C for 45 s, 66 °C for 30 s and 72 °C for 45 s, and a final extension of 72 °C for 2 min. The amplification result was purified with AMPureXP beads (Beckman Coulter, Brea, CA, USA). Library preparation (fixation of the TruSeq adapters and quantification of qPCR) was carried out using the Illumina 16S Library Preparation Protocol (Illumina Technical Note 15044223 Rev. B). Coverage of 100,000 reads was defined for each sample sequenced [46]. For taxonomic classification, operational taxonomic units (OTU) were matched against the SILVA Database [47].

2.11. Statistical Analysis

SPSS version 25.0 (SPSS, Inc., Chicago, IL, USA) was used to perform the statistical analysis. Data normality was checked using the Shapiro–Wilk’s test, and Levene’s test was used to assess the equality of variances. Nonparametric tests (Mann−Whitney and Kruskal–Wallis tests) were applied to assess differences in anthropometric and biochemical parameters, flavanone metabolites, and microbiota data between volunteer groups, and Spearman’s correlation coefficient was used to assess the associations between phase II flavanone metabolites and microbiota OTUs. Data are expressed as the mean ± standard error (SE), and differences were considered significant at p < 0.05. Multivariate analyses were performed using MetaboAnalyst 4.0 [48] after normalization by the median, log transformation, and Pareto scaling. Hierarchical cluster analysis was used to group volunteers according to their excretion profiles.

3. Results

3.1. Chemical Composition and Flavonoid Content of the Orange Juices and Biochemical and Anthropometric Profiles of the Volunteers

The chemical compositions of the orange juices are presented in Table S1. The TSS of POJ and MOJ was 7.2 and 6.5 °Brix, respectively. The TDF content was 0.18 and 0.31 g/100 mL for POJ and MOJ, respectively. The major flavanones in both orange juices, POJ and MOJ, were hesperidin and narirutin, followed by didymin (Table S2). The main anthocyanin identified in MOJ was cyanidin-3-O-glucoside, followed by cyanidin-O-malonyl-glucoside (Table S3), contributing to 35% of the total flavonoids. The flavanone concentration (hesperidin and narirutin) was similar in the POJ and MOJ orange juices (43.42 and 40.64 mg.100 mL−1, respectively). However, the soluble fraction of hesperidin was higher in MOJ than in POJ (16% and 9%, respectively) (Table S4).
Anthropometric variables, biochemical parameters, and intestinal permeability markers of both groups (obese and non-obese) are presented in Table 1. Total cholesterol and insulin concentrations and HOMA-IR values were found to be higher in the obese group as compared to the non-obese group (p < 0.05), and the volunteers from the obese group were diagnosed with insulin resistance according to the HOMA-IR assessment (3.02 ± 0.46).

3.2. Identification of Metabolites in the Urine after the Consumption of Orange Juice

Ten phase II metabolites of hesperetin (m/z 301) and naringenin (m/z 271) were identified in urine samples at different times after the consumption of both orange juices, including five hesperetin and five naringenin phase II metabolites identified as glucuronide and sulfate conjugates (Table 2). Hesperetin metabolites contributed to around 94–98% of the total metabolite recovery in the urine (Figure S1), mainly as sulfo-O-glucuronide conjugates (53–87%) (m/z 557), while naringenin was found as mono- and di-glucuronide conjugates (up to 99%) (m/z 447 and 623, respectively). The native flavanone-rutinosides and respective aglycone forms were not detected. Cyanidin metabolites were found in trace amounts in some urine samples of the volunteers who ingested MOJ.

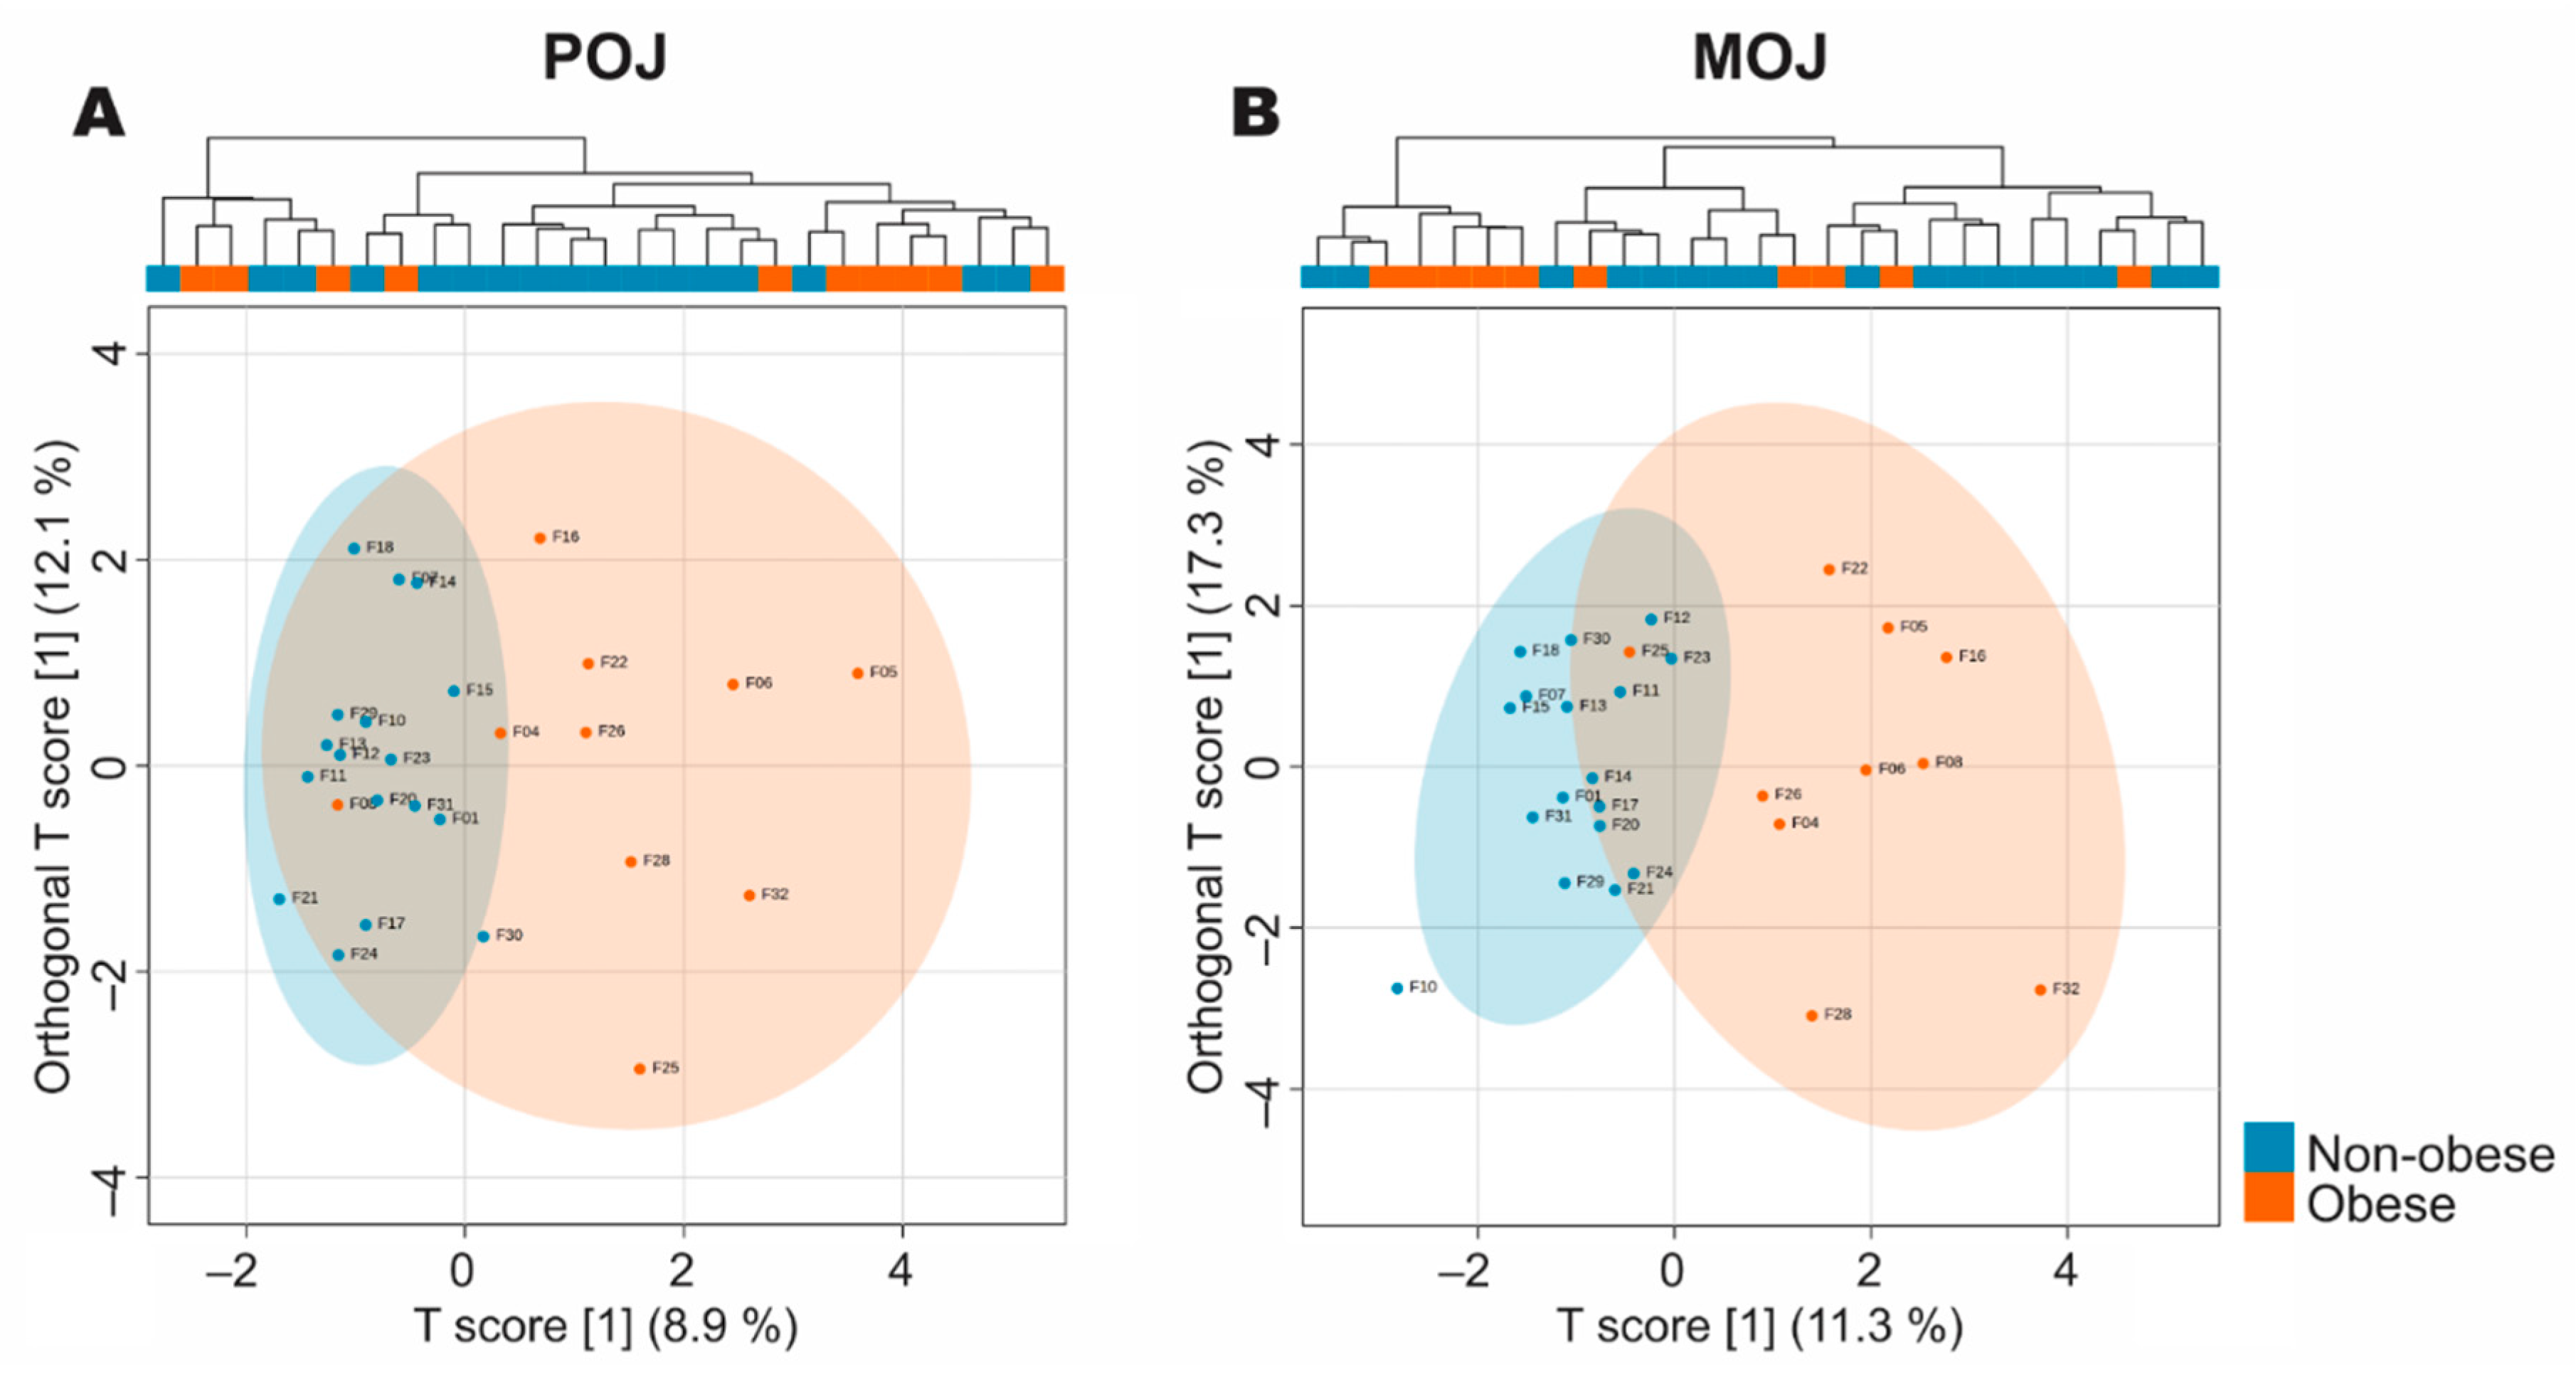
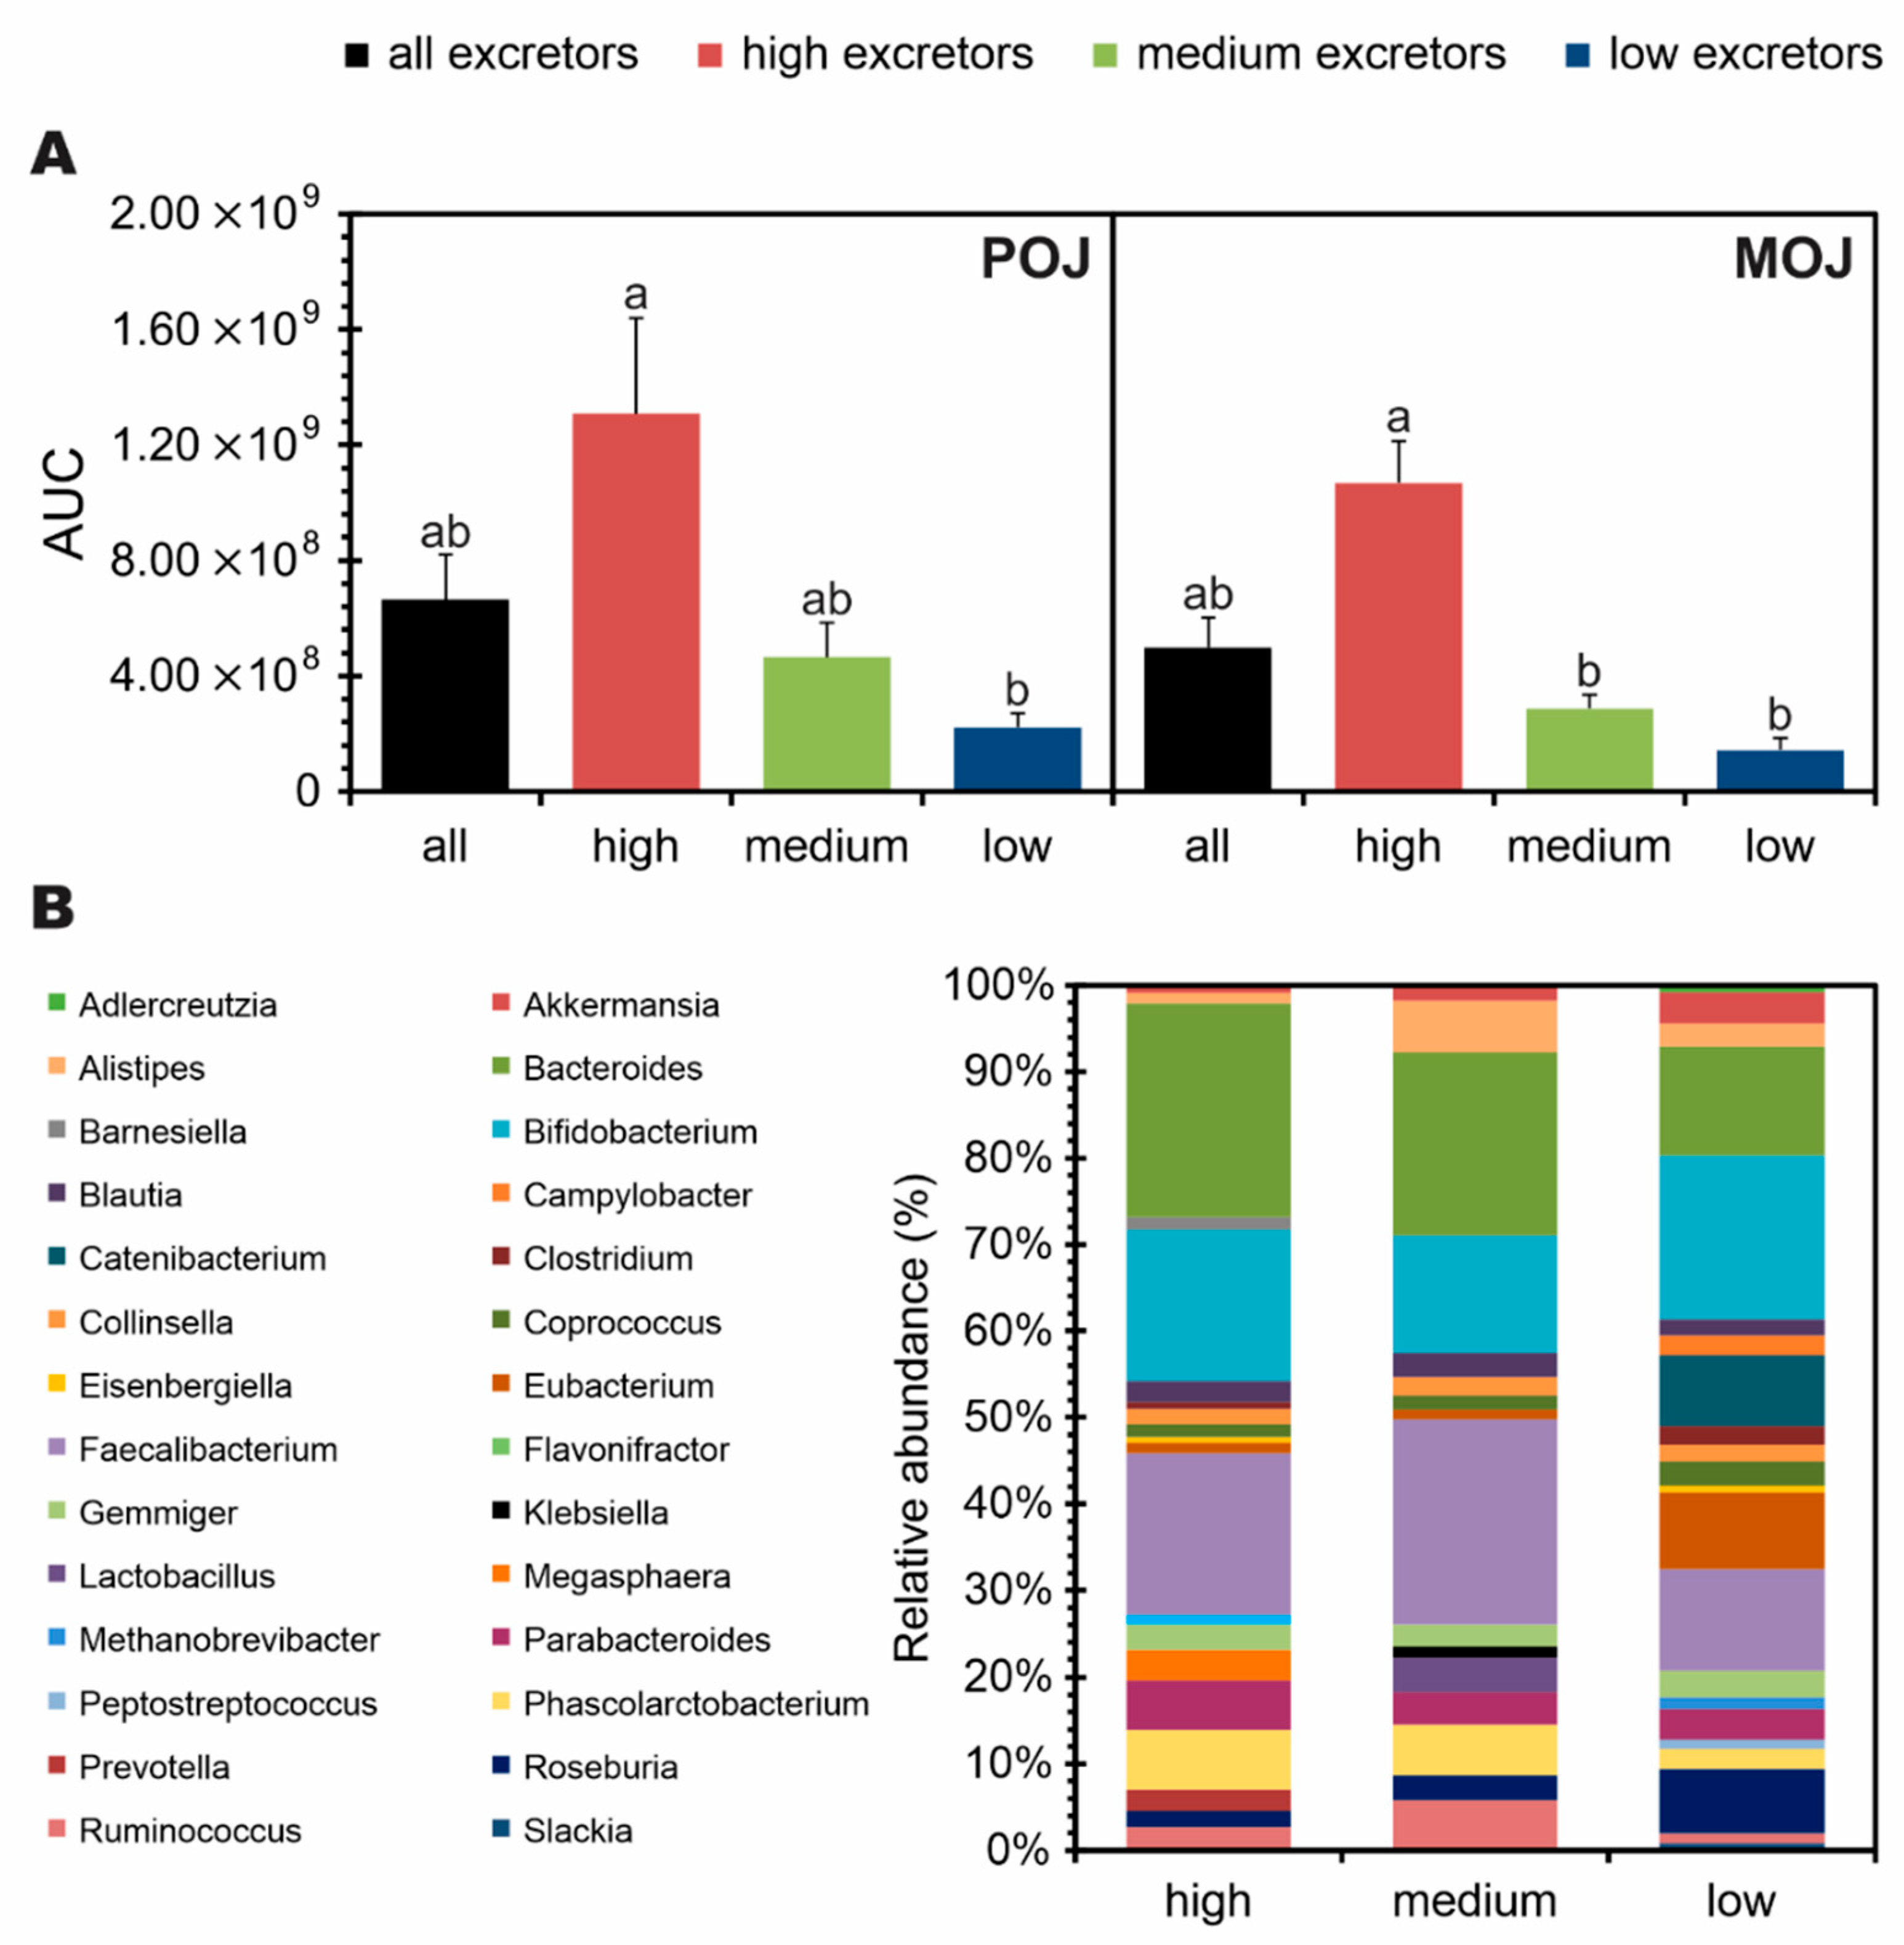
3.3. Volunteer Stratification According to Total Excretion of Flavanone Metabolites

Significant inter-individual variation in the excretion of phase II metabolites was observed among volunteers (Figure S2). Figure 1 shows the orthogonal projections to latent structures discriminant analysis (oPLS-DA) model of the two groups (obese and non-obese subjects) characterized in Table 1 as a function of the phase II urinary metabolites identified in the four collected intervals, totaling the first 24 h after both juices were consumed. The analysis showed that the members of the non-obese group had more similar metabolic profiles, while the obese group presented greater dispersion for both orange juices, POJ (Figure 1A) and MOJ (Figure 1B). The oPLSDA showed an BMI-based separation, however, the large variation among the profiles observed in the dendrogram of the cluster analysis, both intragroup and intergroup, suggests that in addition to BMI, other factors seem to determine the variation in metabolite excretion. High interindividual variation was also observed in the microbiome profile at the genus level, and the oPLS-DA model did not discriminate among groups according to BMI (Figure S3)
In order to better understand and clarify the parameters that influenced the large variation observed, the volunteers were stratified into high, medium, and low excretors, according to the total excretion of flavanone metabolites (Figure 2A). Seven volunteers were characterized at each excretion level (n = 21). The volunteers classified as low excretors showed a significant difference in excretion compared with the high excretors, but medium excretors not differ from the other groups following consumption of POJ. In addition, a significant difference in excretion was observed between high and low excretors, but no difference was observed between medium and low excretors following consumption of MOJ. No differences in gut microbiota profiles were observed at the genus level among individuals with different excretion profiles (Figure 2B).

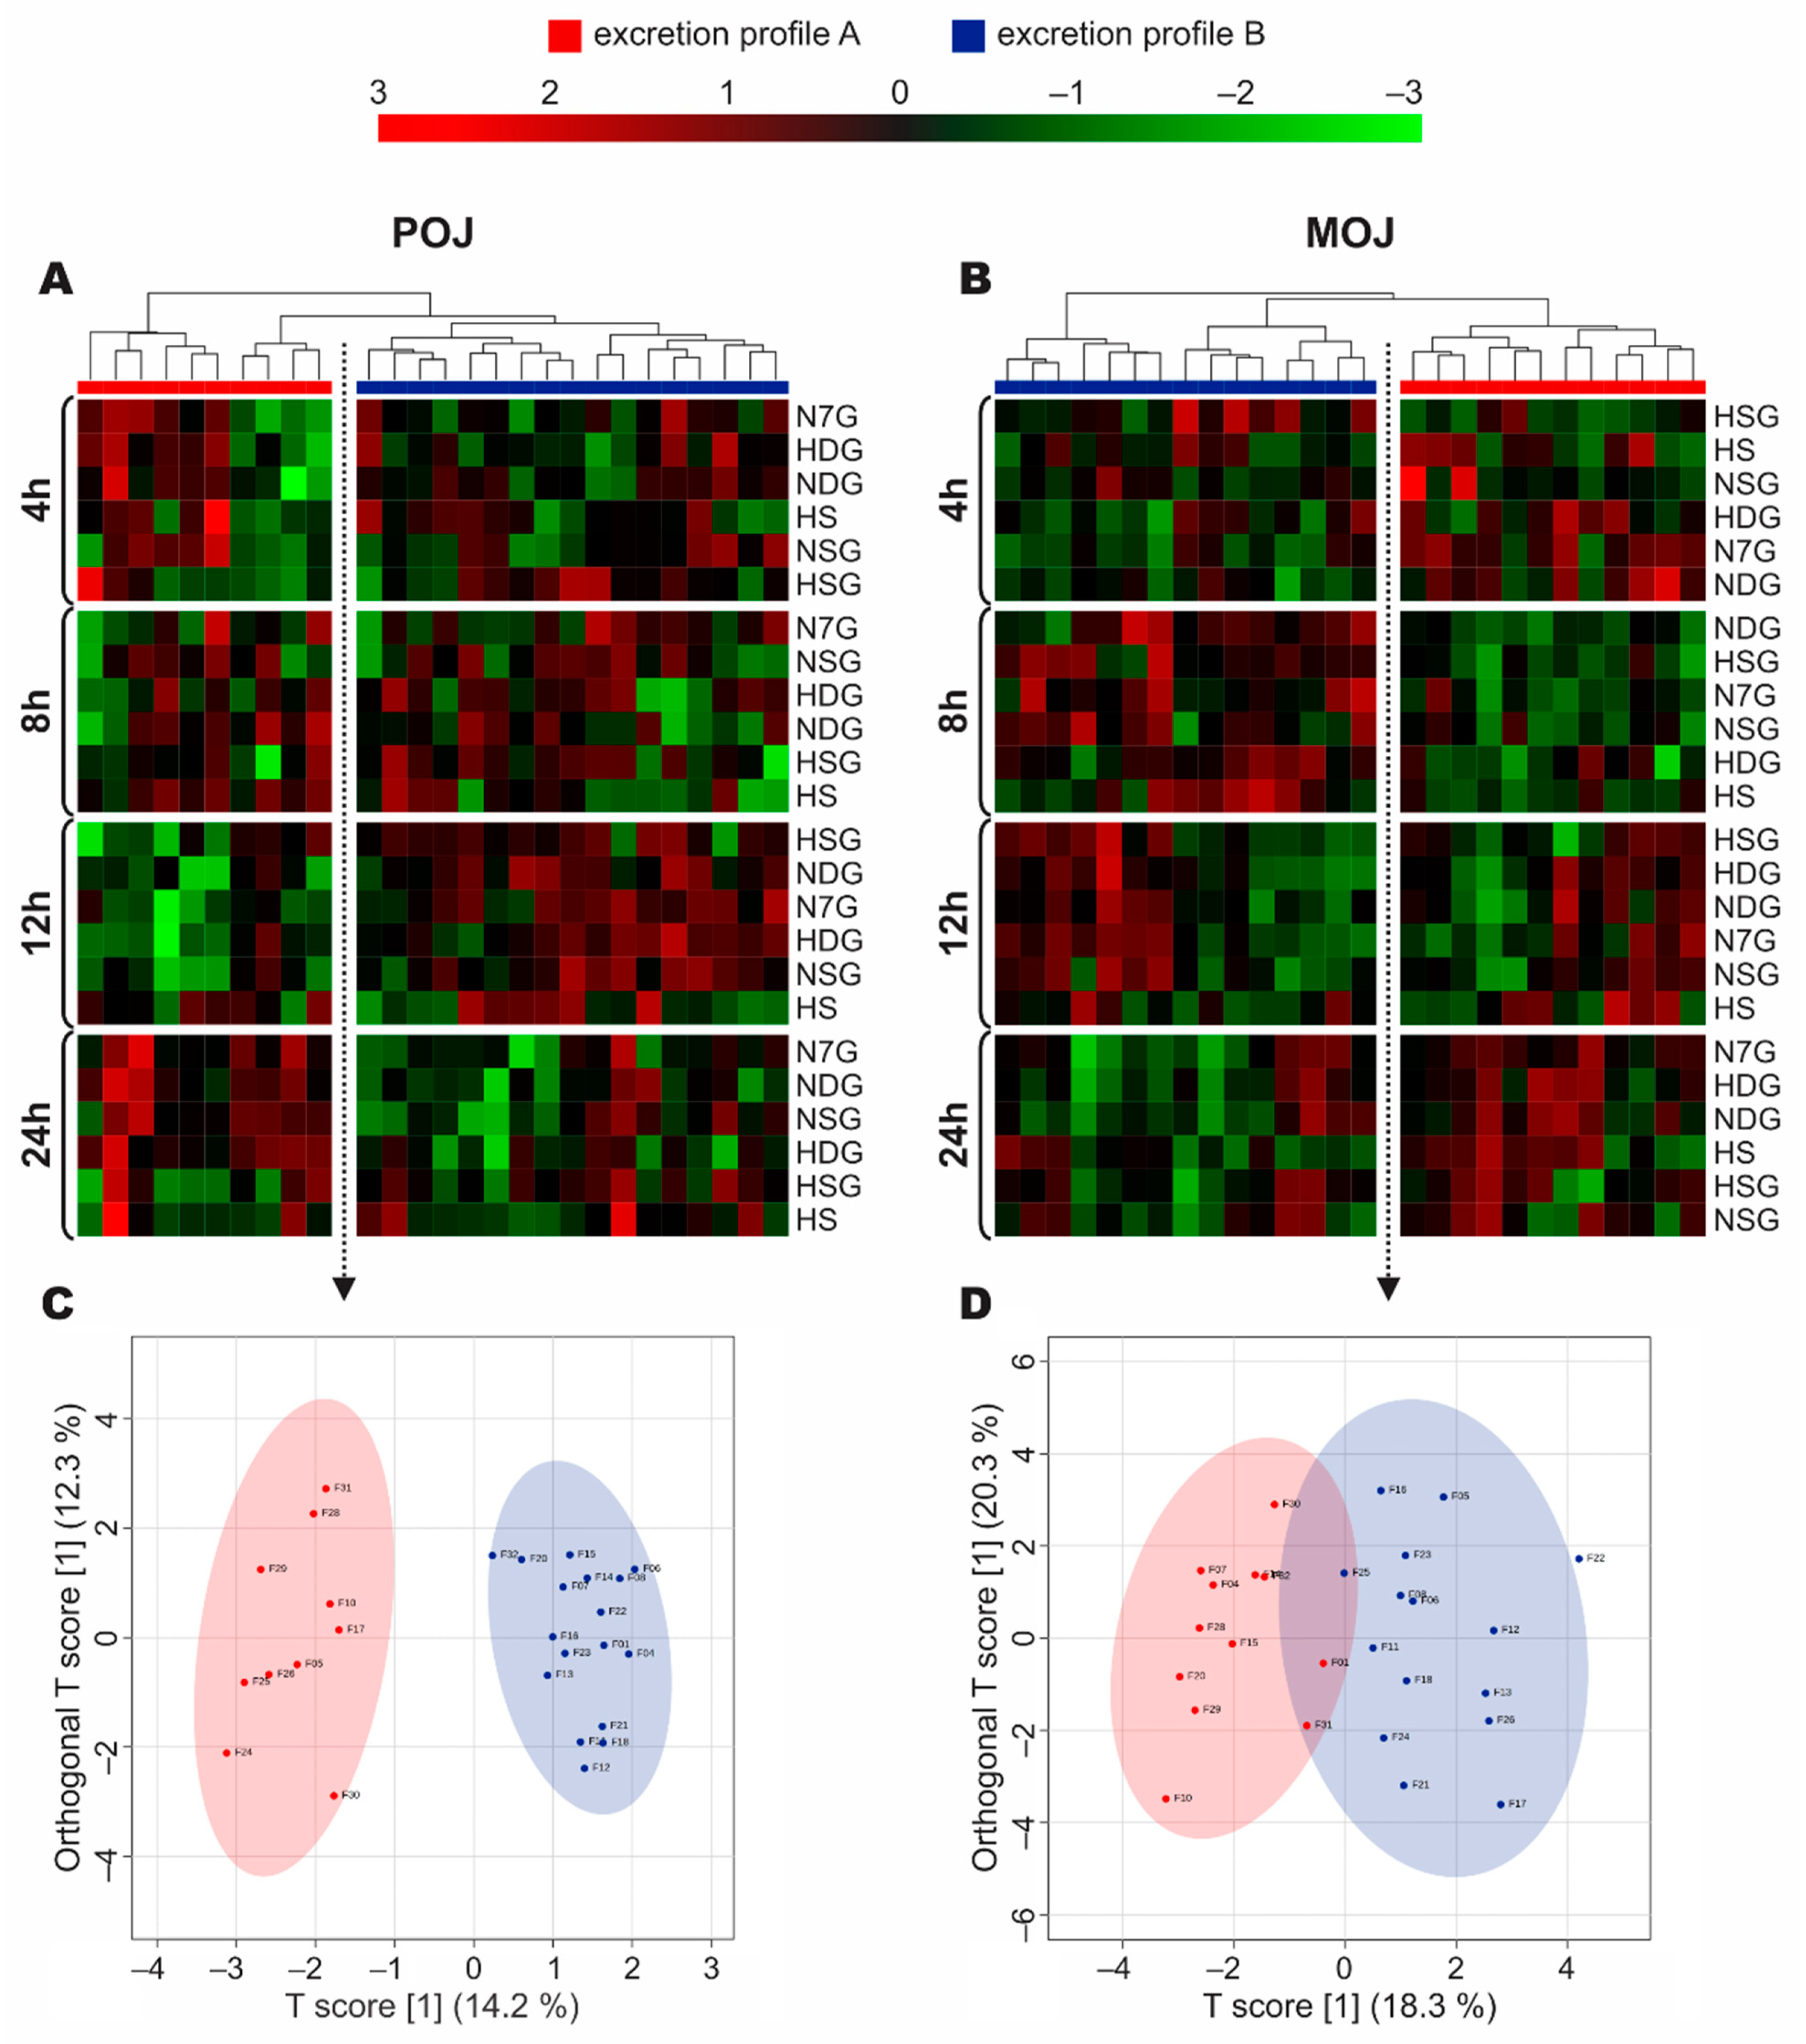
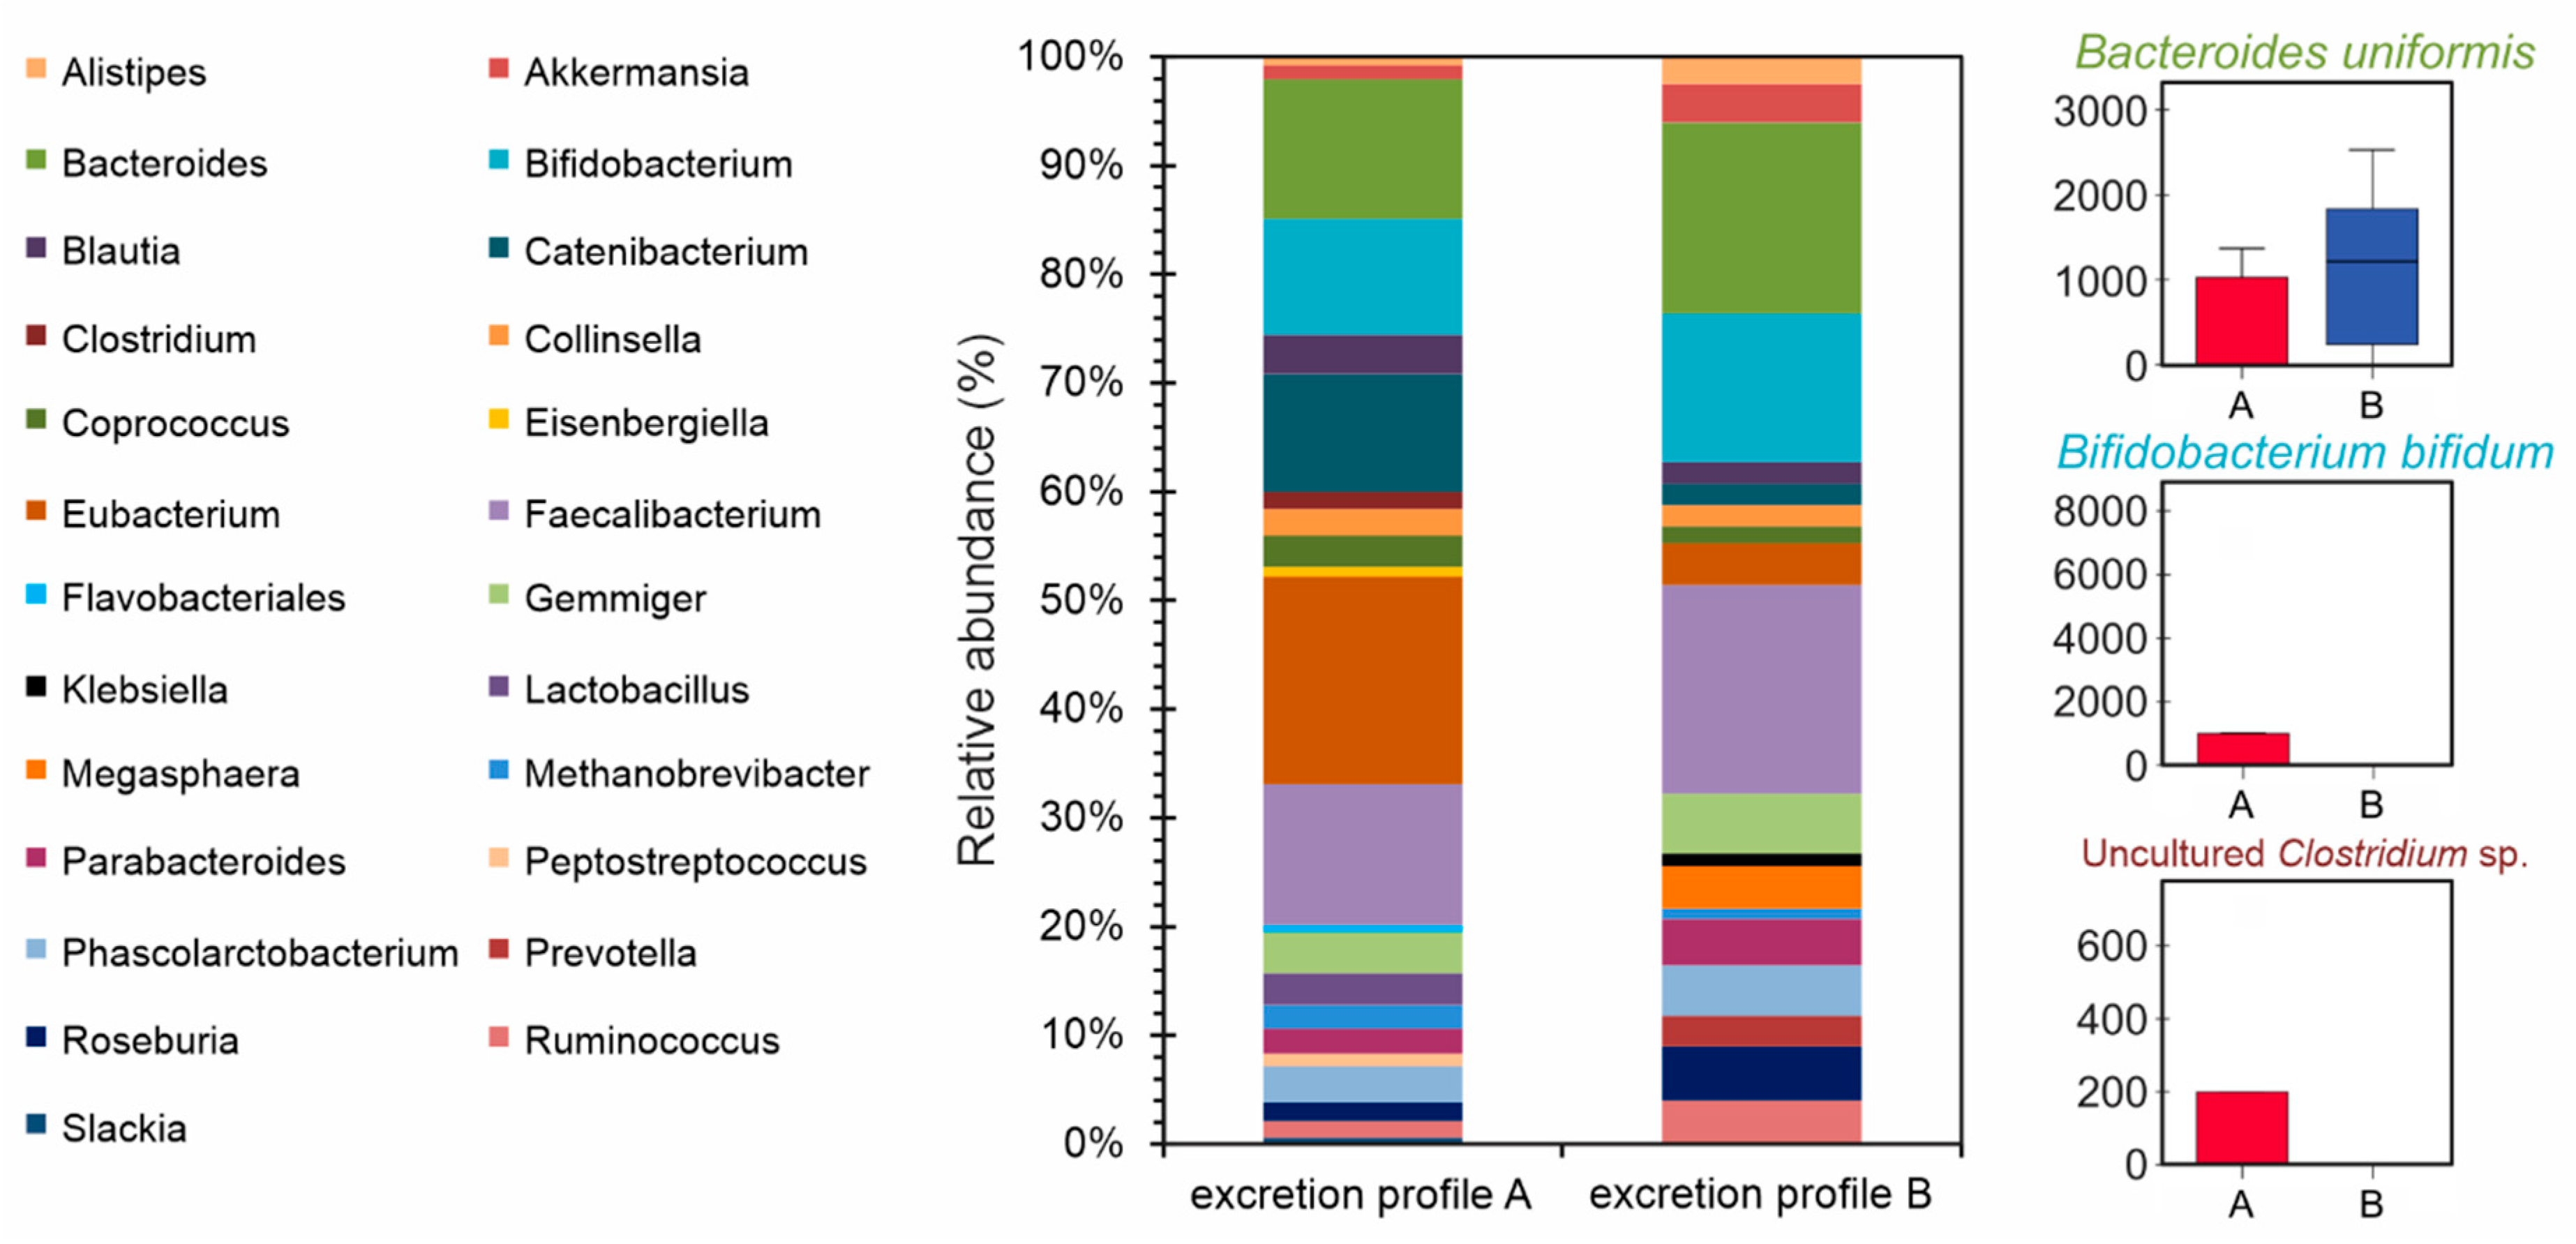
3.4. Stratification of Volunteers According to Phase II Metabolism

The 27 volunteers were distributed into two clusters, which were different from the previous ones, named ‘Excretion Profile A’ and ‘Excretion Profile B’. These were selected according to metabolic profiles after the intake of POJ (Figure 3A) and MOJ (Figure 3B). Through the Heatmap graph, we observed the separation of the two clusters, and their profiles had different responses over time, according to the excretion interval. Table S5 shows the anthropometric variables, biochemical parameters, and intestinal permeability markers of the volunteers in the new Excretion Profile groups. There were no significant differences between Profiles A and B, indicating that the new stratification was based on phase II metabolite excretion.
The new sub-set of excretors was evidenced by oPLS-DA (Figure 3C,D), with Excretion Profiles A and B presenting a more evident difference after the consumption of POJ (Figure 3C) than MOJ (Figure 3D), which showed that three volunteers had intermediate profiles.
For POJ (Figure 3A), volunteers from Profile A (n = 10) presented less metabolite excretion after an intermediate period of time (8–12 h), and this increased at the end of the 24 h period as compared with participants classified as belonging to Profile B (n = 17), who showed a high level of excretion at 8–12 h and reduced excretion from 12 to 24 h. For MOJ (Figure 3B), the same pattern was observed, but it was anticipated to occur 4–8 h after juice intake, with low and high metabolite excretion levels in Profile A (n = 12) and Profile B (n = 15), respectively. This ratio was maintained over an intermediate time period (8–12 h) and changed in the interval from 12 to 24 h. The new proposed stratification based on flavanone metabolism was not able to discriminate among volunteers with different levels of flavanone urinary excretion (Figure S4), as large interindividual variation was observed among volunteers.

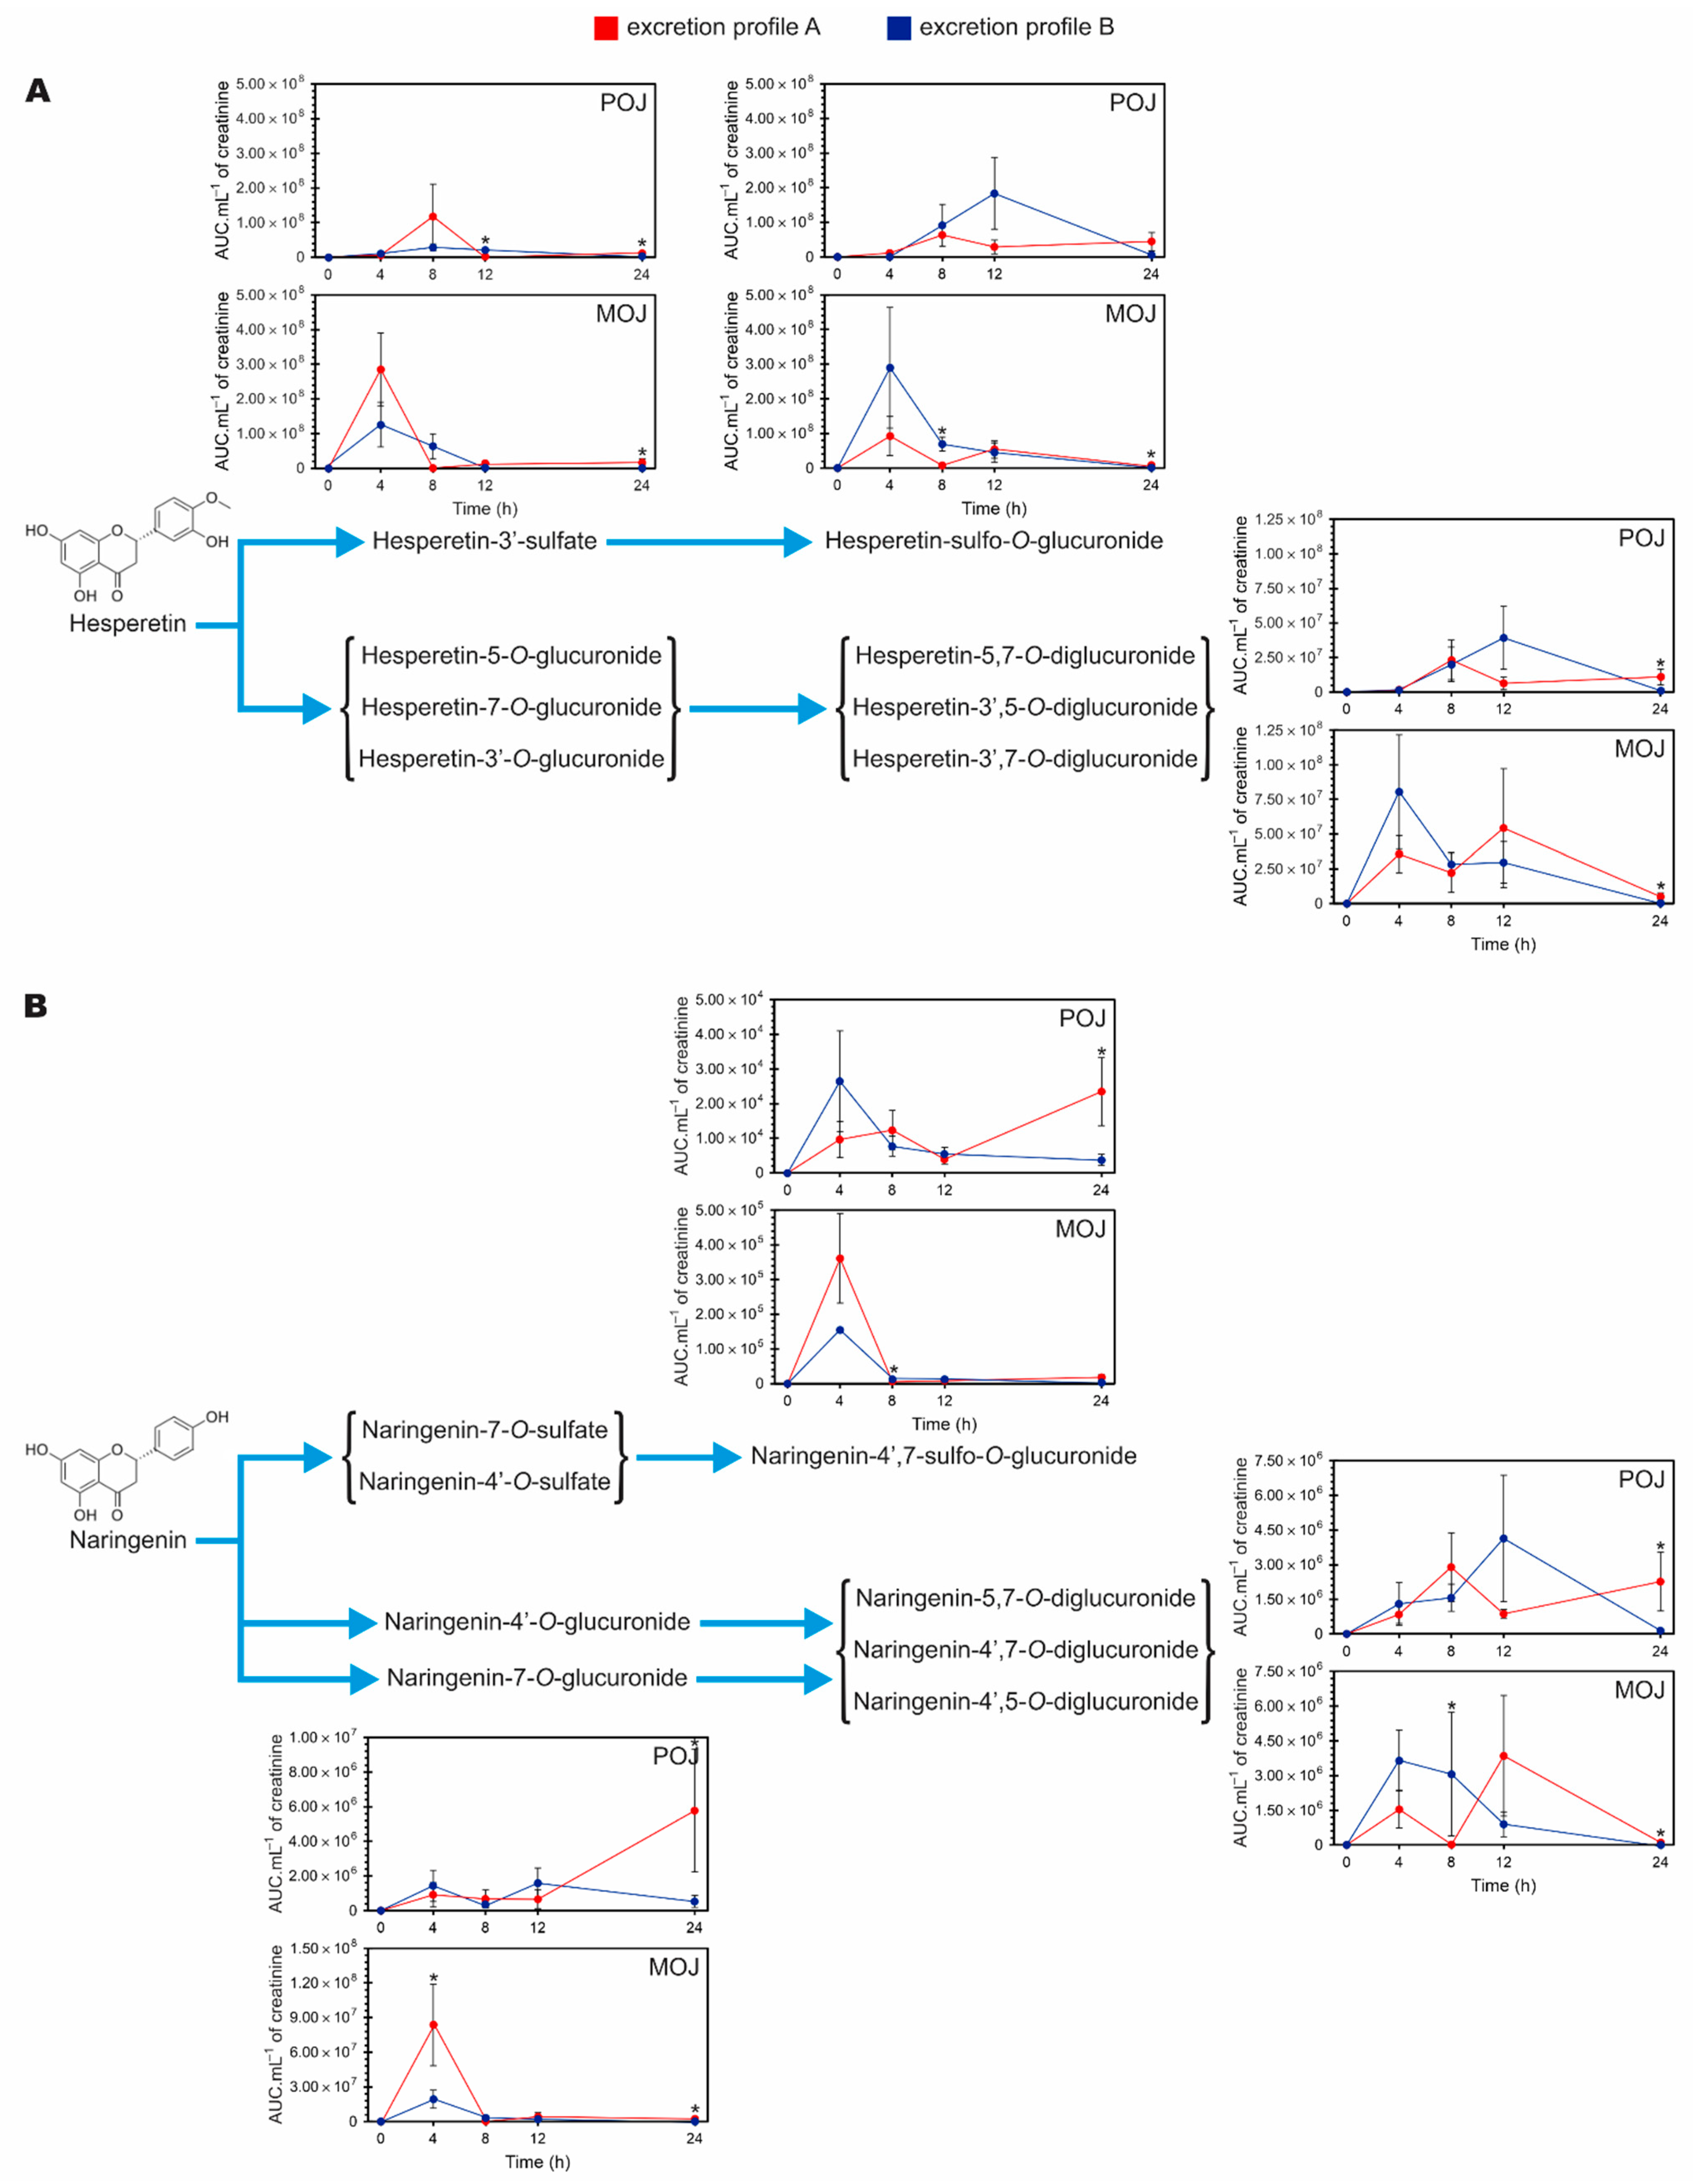
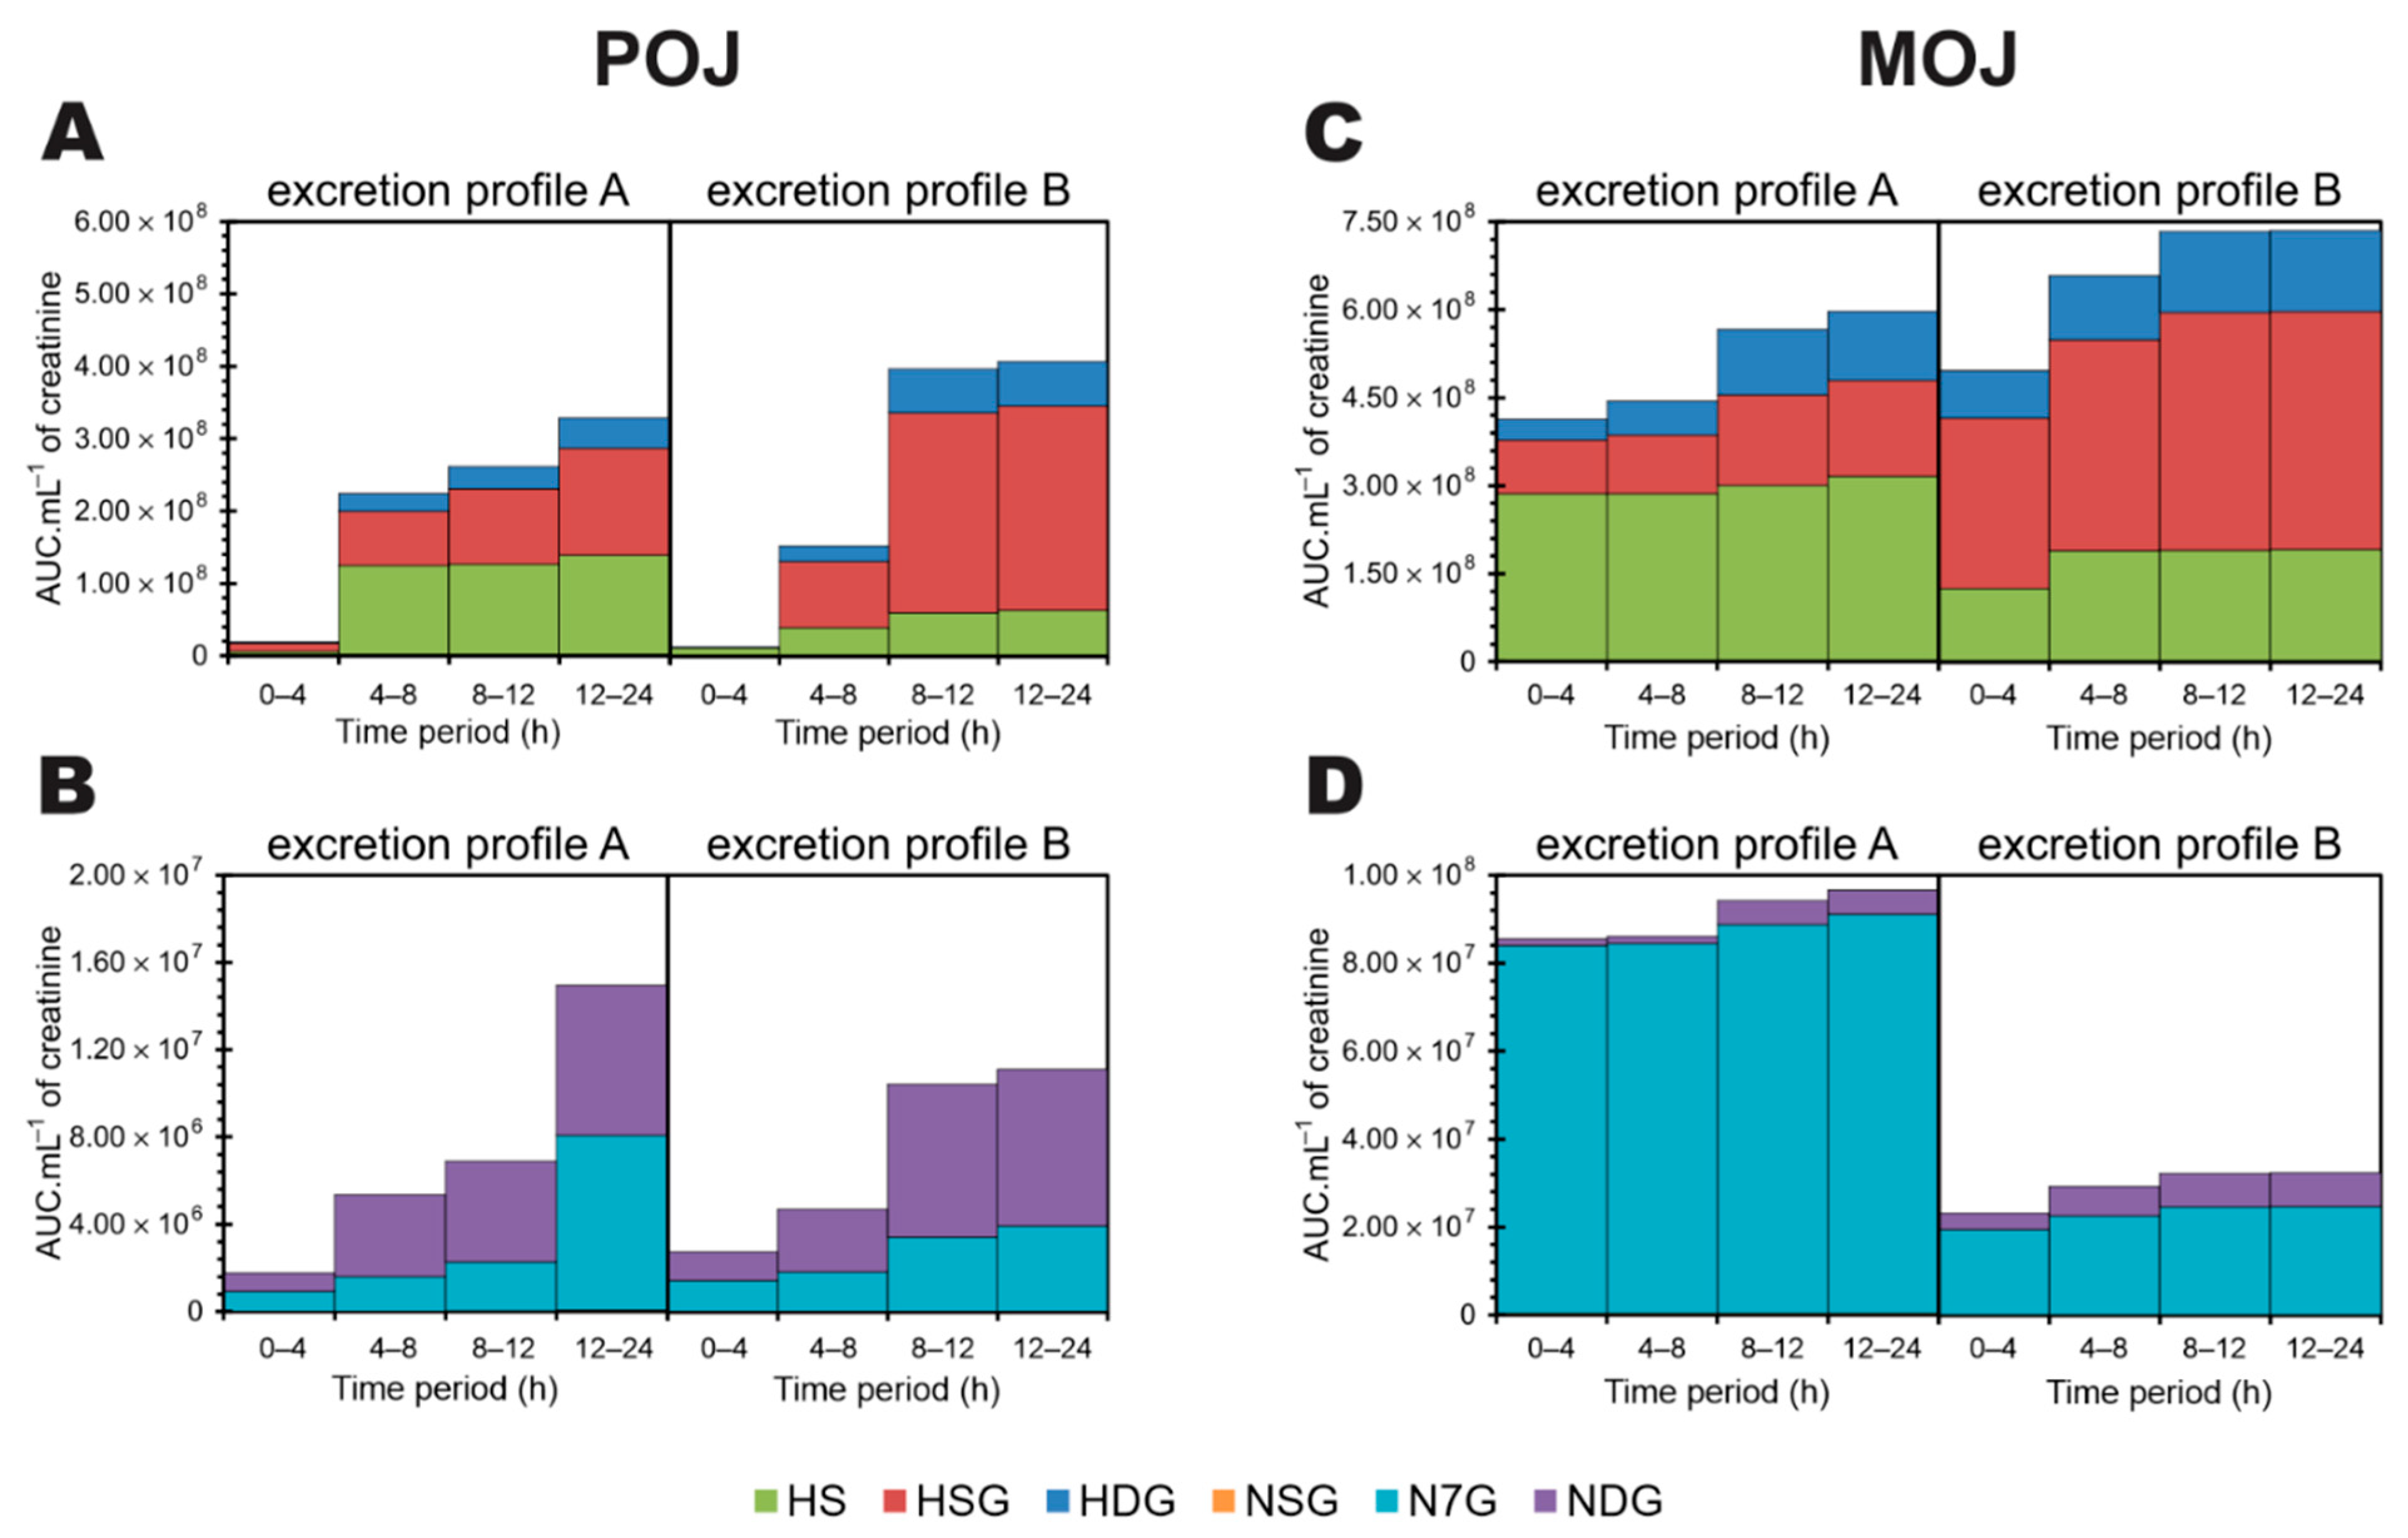
3.5. Time-Dependent Excretion Curve According to Excretion Profile

Figure 4 shows the excretion curve over time for hesperetin (Figure 4A) and naringenin metabolites (Figure 4B), based on the previously classified profiles shown in Figure 3.
Excretion Profile A presents excretion peaks for hesperetin-sulfate, hesperetin-sulfo-O-glucuronide, and hesperetin-diglucuronide in the 4–8 h period after POJ intake. There was a decrease, followed by a slight but significant increase in excretion between 12 and 24 h after POJ intake (p = 0.05 and 0.003, respectively) (Table S6) as compared with Profile B. On the other hand, individuals with Profile B excreted more hesperetin-sulfo-O-glucuronide and -diglucuronide, with a shift in the peak of excretion (8–12 h) and lower excretion of hesperetin-sulfate (Figure 4A). The three hesperetin metabolites showed similar Excretion Profiles after the consumption of POJ and MOJ, but an earlier peak of excretion (0–4 h) was observed when MOJ was ingested for both Excretion Profiles, demonstrating that hesperetin from MOJ is metabolized faster by the gut microbiota than POJ. Also, a slight increase in excretion in the interval 12–24 h (excretion for Profile A individuals after MOJ intake) was observed (p = 0.039, 0.035, and 0.029, respectively. Table S6).
For individuals with Excretion Profile A, after the consumption of POJ, the naringenin metabolites (naringenin-sulfo-O-glucuronide, naringenin-7-O-glucuronide and -diglucuronide) were excreted continuously without a characteristic excretion peak. A significant increase in excretion occurred 12–24 h after juice consumption as compared with individuals with Profile B (p = 0.01, 0.035, and 0.007, respectively) (Figure 4B, Table S6). On the contrary, volunteers classified as having Profile B showed an excretion peak for naringenin-diglucuronide 8–12 h after POJ intake and then less excretion until 24 h. After MOJ intake, volunteers with both Profiles (A and B), showed naringenin-7-O-glucuronide and -sulfo-O-glucuronide excretion peaks at 0–4 h, but these were higher for individuals with Profile A than for those with Profile B. Naringenin-diglucuronide presented excretion peaks at 0–8 h and 8–12 h after MOJ consumption.

3.6. Accumulation of Excreted Metabolites Over a 24 h Period

Figure 5 shows the recovery of urinary flavanone metabolites over a 24 h period after POJ and MOJ consumption. Flavanones from MOJ are more bioavailable than those from POJ, so a larger amount of hesperetin metabolites were recovered earlier (0–4 h) after MOJ intake (Figure 5A,C).
More hesperetin-sulfo-O-glucuronide was recovered from individuals with Excretion Profile B than from those with Excretion Profile A after the intake of POJ (around 60–70% and 33–45%, respectively) and MOJ (55–58% and 22–27%, respectively) throughout the 24 h period of collection (Figure 5A,C). In addition, the recovery of hesperetin metabolites occurred gradually over 24 h, starting from 0–4 h for individuals with Excretion Profile A, while the highest rate of recovery was observed later (8–12 h) for individuals with Profile B, reaching a plateau at 8–12 h (Profile A) or 12–24 h (Profile B) after POJ intake. Similar trends (8–24 h) were observed after MOJ intake (Figure 5C).
As for hesperetin, individuals with Excretion Profile A showed a gradual recovery of naringenin metabolites (Figure 5B,D) over the 24 h period. Unexpectedly, the urinary recovery of naringenin metabolites observed after MOJ intake was greater for individuals with Profile A than for those with profile B (Figure 5D). Furthermore, naringenin-7-O-glucuronide was the major naringenin metabolite recovered after MOJ intake (~97% and 75–80% for Profiles A and B, respectively). On the contrary, naringenin-diglucuronide was the major metabolite recovered after POJ intake (~50–70% and 47–67% for Profiles A and B, respectively).
Among the 27 volunteers, 15 volunteers shared similar excretion profiles after consuming POJ and MOJ. Based on their consistent excretion profiles, these volunteers were selected for microbiota analysis. Figure 6 shows the volunteers’ intestinal microbiota profiles according to their excretion profiles, providing evidence that individuals classified as having Profiles A and B have very distinct compositions in relation to the relative abundance of genera. The Mann−Whitney test was used to highlight significant differences at the genus and species levels (Table S7). A total of 25 genera and 46 species were identified using the SILVA database. Several bacterial genera that have already been associated with flavanone deglycosylation were detected, but no significant differences were observed between individuals with Excretion Profiles A and B. The species Bacteroides uniformis (p = 0.03) and B. vulgatus (p = 0.046) were detected in greater abundance in volunteers with Profile B than in those with Profile A. Bifidobacterium bifidum and an uncultured Clostridium species were only detected in volunteers with Excretion Profile A, and Bifidobacterium longum was found to be more abundant in volunteers with Profile A (p = 0.007) than in those with Profile B.
Table S7 shows the correlations among the metabolites excreted in the urine and the identified bacterial species. A positive correlation was found between hesperetin-sulfate and naringenin-sulfo-O-glucuronide excreted after POJ intake with the genus Clostridium and its uncultured species (0.537, p < 0.05). For MOJ, positive correlations were observed between naringenin-7-O-glucuronide and Bacteroides uniformis (0.564, p < 0.05) and between hesperetin-sulfo-O-glucuronide and B. ovatus (0.604, p < 0.05).

4. Discussion

Several studies have related orange juice consumption to various health benefits linked to the presence of the citrus flavanones narirutin, and hesperidin. However, the considerable interindividual variation in the biological response precluded the adequate interpretation of their efficacy [49]. The bioavailability of citrus flavanones is a key step in ensuring their bio-efficacy, and involves several phases, including food matrix release, absorption, metabolism, reaching the site of action, and excretion. Their absorption depends on extrinsic factors related to the food matrix and intrinsic factors such as age, gender, BMI, health status, and gut microbiota. These factors could be responsible for the significant heterogeneity in flavanone absorption and excretion [21,28,31,34,50,51].
For the first time, differences in the gut microbiota metabolism, which primarily influences the absorption of flavanones after hydrolysis, and further metabolic processes that degrade phenolics with the loss of the flavanone structure, as well as Phase II metabolism have been studied in a single intervention trial. In the present study, we stratified volunteers according to (1) the total excretion of flavanone metabolites to reflect the metabolism of the microbiota, and (2) the phase II metabolism profile in an attempt to explain the large considerable interindividual variation observed after the consumption of single doses of two orange juices.
Several metabolites, mainly mono and diglucuronides and sulfo and sulfo-glucuronides of naringenin and hesperetin were recovered in the urine after the intake of POJ and MOJ, showing that the aglycones were metabolized by phase II enzymes [34,37,51,52]. Hesperetin metabolites were found in the greatest abundance, mainly as sulfo and sulfo-glucuronide metabolites, while naringenin was found in minor amounts as mono and diglucuronide metabolites, showing the preference of sulfotransferase (SULTs) for hesperetin. Anthocyanin metabolites were detected in trace amounts in some but not all urine samples, although they are present in MOJ. This was expected due to the low bioavailability of anthocyanins, as previously reported [53,54,55].
Large interindividual differences in urinary phase II flavanone metabolites were observed after single doses of POJ and MOJ. Large variation in citrus flavanone absorption and excretion was also observed after the consumption of the orange juices, and this was used to stratify the volunteers into three levels of excretion, low, medium, and high flavanone excretors [29,30], suggesting the dependence of the specific microbiota to deglycosylate flavanone-rutinosides. In our study, the primary hypothesis was that subjects classified according to BMI (obese and non-obese) would have different and characteristic gut microbiome compositions. This could be a determining factor in the variation in flavanone excretion. However, no association was found between the BMI and gut microbiota profile data, and BMI and urinary flavanone excretion, which corroborates with the results found by Brett et al. [31]. In addition, the variability in the excretion of flavonoids was not correlated with anthropometric and clinical parameters or even with intestinal permeability.
The flavanone rutinosides hesperidin and narirutin are metabolized and absorbed after reaching the colon, where bacteria with α-rhamnosidase and β-glucosidase activities remove the rhamnose and glucose moieties and the aglycones can be absorbed [20,21]. Previous studies suggested that interindividual variation in flavanone bioavailability could reflect the diversity of several microbial strains with different degrees of deglycosylation efficiency [29,31,32,33,34,35,56]. In this way, gut microbiota modulation can improve the bioavailability of citrus flavanones, as demonstrated after chronic intake of a specific probiotic, Bifidobacterium longum R0175 [57]. Eight genera with α-rhamnosidase and β-glycosidase activity are involved in the metabolism of flavanones, including Bifidobacterium, Adlercreutzia, Clostridium, Eubacterium, Bacteroides, Lactobacillus, Flavonifractor, and Parabacteroides [58,59]. Some studies have identified species involved in the of flavanone metabolization, including Bifidobacterium adolescentis, B. longum, B. catenulatum, B. dentium, B. breve, Enterococcus faecalis, Bacteroides ovatus, B. uniformis, Parabacteroides distasonis, Lactobacillus acidophilus, L. plantarum, Eubacterium ramulus, and Flavonifractor plautii [58,59].
Thus, considering that the first stage of flavanone metabolism is mediated by the gut microbiota metabolism, we stratified the volunteers into groups of high, medium, and low excretors according to the total amount of flavanones excreted in the urine. However, no significant correlation with the gut microbiota composition was found at the genus and/or species level. In this way, the background diet could interfere with the microbial profile, making its annotation and the prediction of microbial metabolism difficult [16]. The relatively small size of the population included in our study and the temporal variability of the microbiome could have contributed to the low level of correlation.
Taking a different approach, which did not disregard the influence of BMI or gut microbiome metabolism, we proposed a new stratification based on flavanone phase II metabolite excretion profiles, named excretion ‘Profile A’ and ‘Profile B’. This was shown to be more effective than using the BMI itself.
The pathway proposed for hesperetin conjugation involves an initial sulfation process in the intestine and a second glucuronidation process in the liver [21]. This is in agreement with the present results, as hesperetin-sulfate showed an excretion peak before hesperetin-sulfo-O-glucuronide. Considering the new stratification, Profile B showed a greater excretion rate than Profile A, with similar trends for hesperetin-diglucuronide and naringenin-diglucuronide, suggesting a faster second glucuronidation for individuals with Profile B than for those with Profile A.
Polyphenol glucuronidation is mediated by UGTs. The UGT1 and UGT2 families are the most important drug-conjugation enzymes, with the UGT1A1 subfamily, which is primarily expressed in the liver, being the polymorphic isoform with the greatest role in phenolic glucuronidation [60]. Among the major enzymes responsible for hesperetin glucuronidation, UGT1A3 only produces 7-O-glucuronide while UGT1A7 mainly 3′-O-glucuronide. Other enzymes, including UGT1A1, UGT1A8, and UGT1A9, also catalyze hesperetin glucuronidation [61]. Polymorphic variation in UGT1A1 contributes to the variability in PK parameters and the altered activity [62]. For example, UGT1A1 is responsible for the metabolism of bilirubin, and a polymorphic variant UGT1A1*28 results in reduced UGT activity and, consequently, unconjugated hyperbilirubinemia, a condition known as Gilbert’s syndrome [37,63].
In addition, a higher urinary mutagenicity index value was observed after the exposure of well-cooked red meat to subjects with UGT*28/*28 genotypes than after exposure to subjects with *1/*28 genotypes, with mutagens excreted in the free and non-deactivated forms [64]. The type and frequency of the UGT1A1*28 minor allele depends on the genetic and geographic backgrounds [63]. It is detected in 3% of Asians, ~15% of Europeans, and up to 35% of Africans, who are carriers of Gilbert´s syndrome. In addition, 53% of premenopausal women carry the UGT1A1*28 minor alleles, including 11 homozygotes [65]. The effect of UGT polymorphisms on flavonoid clearance is still limited. A positive correlation was observed between the UGT1A1*28 variant and urinary isoflavone glycitein–sulfate recovery, but no association was observed with its reduced appearance in isoflavone glucuronides as compared with non-polymorphic carriers [65], suggesting that there is competition between the two phase II metabolism pathways. Thus, the observed effect of polymorphism on other xenobiotics may suggest that flavonoids have similar effects. Thus, the occurrence of the UGT1A1 variant associated with lower enzyme activity in some subjects could explain the low rate of biotransformation of hesperetin-sulfate to hesperetin-sulfo-O-glucuronide in volunteers with Excretion Profile A, as well as the low rates of transformation of hesperetin and naringenin monoglucuronides to their respective diglucuronides. In addition, the higher relative percentage recovery of hesperetin-sulfo-O-glucuronide in volunteers with Excretion Profile B corroborates a possible involvement of the UGT gene polymorphism in flavanone phase II metabolism. A similar pattern was also observed for naringenin metabolites. The polymorphism on UGT1A1 may be beneficial in the context of reduced conjugation of flavanones and a slow excretion rate. Therefore, polymorphic variants of phase II enzymes, such as UDP-glucuronosyltransferase, may contribute to the variability in flavanone metabolism observed in our study. This may affect their excretion and, therefore, the duration of tissue and cell exposure and, consequently, their bioactivity. However, further genotyping for polymorphisms in UGT and SULT must be conducted to confirm our results.
In general, a similar pattern of excretion was observed after MOJ intake, and the classification into Excretion Profiles A and B also fitted well. However, earlier metabolite peaks were observed for most of the hesperetin and naringenin metabolites following the consumption of MOJ compared with after POJ, suggesting a food matrix influence. Despite both orange juices presenting similar concentrations of hesperidin and naringenin, a higher amount of hesperidin was found to be soluble in MOJ than in POJ (16% and 9%, respectively), suggesting that is more bio-accessible. Vallejo et al. [29] showed that the absorption of hesperidin decreases when the flavanones precipitate and pass to the insoluble fraction and that flavanone solubility correlates positively with citrus flavanone bioavailability in several orange beverages. However, to the best of our knowledge, no studies have evaluated the metabolism and bioavailability of flavanones from blood oranges.
It seems that Profiles A and B are related to phase II metabolism differences, and therefore, they do not correlate with the high, medium, and low excretion groups. This was corroborated by the fact that the volunteers were not sorted into the same two groups in the two stratifications. The profiles did not correlate with the gut microbiota composition either, as the gut microbiota do not affect phase II metabolism. However, Bacteroides uniformis and Bifidobacterium bifidum species are responsible for the O-deglycosylation of flavanones [58,59], and they were detected in greater abundance in volunteers with Excretion Profile B as compared to those with Profile A. Furthermore, an uncultured Clostridium sp. has been related to the fission of C-ring [58,59], and this was only detected in volunteers with Excretion Profile A.
The correlation data from the present study show a positive correlation between the genus Clostridium and the hesperetin-sulfate and naringenin-sulfo-O-glucuronide metabolites, as well as between naringenin-7-O-glucuronide and Bacteroides uniforms and between hesperetin-sulfo-O-glucuronide and B. ovatus. These genera and species are associated with O-deglycosylation and the C-ring fission of flavonoids [58,59]. It is known that Bacteroides, Lactobacillus, and Bifidobacterium have rhamnosidase activity and, therefore, the excretion levels (quantity) of hesperetin conjugates and naringenin conjugates could be associated with some of these strains. However, the correlation of specific Phase II metabolites with some of these genera is unclear.

5. Conclusions

In conclusion, this study provides the essential insight needed to understand the factors involved in the interindividual variability in citrus flavanone bioavailability. We proposed a stratification of volunteers according to Excretion Profiles and flavanone metabolism. Gut microbiota composition and BMI were not clearly defined as major determinants in the separation of subjects. In addition, the observed results suggest, for the first time, that polymorphisms of UDP-glucuronosyltransferase could be involved in flavanone metabolite profiles. Once other factors, including uptake from intestinal mucosa, and transport into the circulation as well as transport into the liver, could also be involved in the flavanone metabolization process, further studies need to be done to evaluate the influence of polymorphisms of phase II enzymes on flavanone metabolism and to relate the proposed subject stratification to improvements in cardiometabolic health biomarkers.

Supplementary Materials

The following are available online at https://www.mdpi.com/2072-6643/13/2/473/s1, Table S1: Chemical composition of pasteurized Pera and Moro orange juices. Table S2: Identity and mass spectrometric properties of flavonoids of pasteurized Pera and Moro orange juices. Table S3: Identity and mass spectrometric properties of the anthocyanins of pasteurized Moro orange juice. Table S4: Flavonoid content in pasteurized Pera and Moro orange juices. Table S5. Anthropometric variables, biochemical parameters, and intestinal permeability markers of the volunteers classified as having Excretion Profiles A and B before the orange juice consumption. Table S6: Phase II metabolites of flavanones detected in urine by LC-ESI-MS/MS after single dose of pasteurized Pera and Moro orange juices. Table S7: Relative abundance of significant gut microbiota OTUs (genus and species) in volunteers classified as having Excretion Profiles A and B before the orange juice consumption. Figure S1. Phase II metabolites of flavanones recovered over a 24 h period after single doses of Pera (POJ) and Moro (MOJ) orange juices. Figure S2: Total phase II metabolites of flavanones recovered over a 24 h period after single doses of Pera (POJ) and Moro (MOJ) orange juices by each volunteer according to BMI. Figure S3: Gut microbiota of volunteers, according to BMI (non-obese or obese groups), before the consumption of the orange juices. Figure S4: Total flavanone metabolites urinary recovered in urine over a 24 h period for individuals classified as having Excretion Profiles A and B after consumption of Pera (POJ) and Moro (MOJ) orange juices.

Author Contributions

Conceptualization, A.N. and N.M.A.H.; investigation, A.N.; data curation, A.N. and E.d.C.T.; formal analysis, A.N. and E.d.C.T.; methodology, A.N. and F.A.T.-B.; resources, F.M.L. and N.M.A.H.; supervision, N.M.A.H.; writing—original draft, L.N.F. and E.d.C.T.; writing—review and editing, L.N.F., E.d.C.T., F.A.T.-B. and N.M.A.H. All authors have read and agreed to the published version of the manuscript.

Funding

This work was supported by São Paulo Research Foundation (FAPESP) (Grant 2013/07914-8). The authors are grateful for the scholarships provided by FAPESP (Grant 2020/06467-1) and the National Council for Scientific and Technological Development (CNPq, Grants 134456/2016-5 and 141878/2019-3).

Institutional Review Board Statement

The study was conducted according to the guidelines of the Declaration of Helsinki, approved by the Ethical Committee of the School of Pharmaceutical Science-University of São Paulo, São Paulo (CAAE 61707116.5.0000.0067) approved in April 3, 2017, and registered on the Brazilian Registry of Clinical Trials in www.ensaiosclinicos.gov.br (UTN: U1111-1216-2468).

Informed Consent Statement

Informed consent was obtained from all subjects involved in the study.

Acknowledgments

We would like to thank all volunteers that contributed to the project development, Mirian Sanz Roldán for performing Mass spectra analysis and José Thiago do Carmo Santos for HPLC protocol development advisory.

Conflicts of Interest

The authors declare no conflict of interest.

References

  1. Martí, N.; Mena, P.; Cánovas, J.A.; Micol, V.; Saura, D. Vitamin C and the Role of Citrus Juices as Functional Food. Nat. Prod. Commun. 2009, 4, 677–700. [Google Scholar] [CrossRef] [Green Version]
  2. Milenkovic, D.; Deval, C.; DuBray, C.; Mazur, A.; Morand, C. Hesperidin Displays Relevant Role in the Nutrigenomic Effect of Orange Juice on Blood Leukocytes in Human Volunteers: A Randomized Controlled Cross-Over Study. PLoS ONE 2011, 6, e26669. [Google Scholar] [CrossRef] [Green Version]
  3. Pla-Pagà, L.; Companys, J.; Calderón-Pérez, L.; Llauradó, E.; Solà, R.; Valls, R.M.; Pedret, A. Effects of hesperidin consumption on cardiovascular risk biomarkers: A systematic review of animal studies and human randomized clinical trials. Nutr. Rev. 2019, 77, 845–864. [Google Scholar] [CrossRef]
  4. Valls, R.M.; Pedret, A.; Calderón-Pérez, L.; Lluradó, E.; Pla-Pagà, L.; Companys, J.; Moragas, A.; Martín-Luján, F.; Ortega, Y.; Giralt, M.; et al. Effects of hesperidin in orange juice on blood and pulse pressures in mildly hypertensive individuals: A randomized controlled trial (Citrus study). Eur. J. Nutr. 2020, 1–12. [Google Scholar] [CrossRef] [PubMed]
  5. Tripoli, E.; Guardia, M.L.; Giammanco, S.; Majo, D.D.; Giammanco, M. Citrus flavonoids: Molecular structure, biological activity and nutritional properties: A review. Food Chem. 2007, 104, 466–479. [Google Scholar] [CrossRef]
  6. Peterson, J.J.; Dwyer, J.T.; Beecher, G.R.; Bhagwat, S.A.; Gebhardt, S.E.; Haytowitz, D.B.; Holden, J.M. Flavanones in oranges, tangerines (mandarins), tangors, and tangelos: A compilation and review of the data from the analytical literature. J. Food Compos. Anal. 2006, 19, S66–S73. [Google Scholar] [CrossRef]
  7. Anacleto, S.L.; Milenkovic, D.; Kroon, P.A.; Needs, P.W.; Lajolo, F.M.; Hassimotto, N.M.A. Citrus flavanone metabolites protect pancreatic-β cells under oxidative stress induced by cholesterol. Food Funct. 2020, 11, 8612–8624. [Google Scholar] [CrossRef] [PubMed]
  8. Ghanim, H.; Sia, C.L.; Upadhyay, M.; Korzeniewski, K.; Viswanathan, P.; Abuaysheh, S.; Mohanty, P.; Dandona, P. Orange juice neutralizes the proinflammatory effect of a high-fat, high-carbohydrate meal and prevents endotoxin increase and Toll-like receptor expression. Am. J. Clin. Nutr. 2010, 91, 940–949. [Google Scholar] [CrossRef] [Green Version]
  9. Rangel-Huerta, O.D.; Aguilera, C.M.; Martin, M.V.; Soto, M.J.; Rico, M.C.; Vallejo, F.; Tomas-Barberan, F.; Perez-De-La-Cruz, A.J.; Gil, A.; Mesa, M.D. Normal or High Polyphenol Concentration in Orange Juice Affects Antioxidant Activity, Blood Pressure, and Body Weight in Obese or Overweight Adults. J. Nutr. 2015, 145, 1808–1816. [Google Scholar] [CrossRef] [Green Version]
  10. Aptekmann, N.P.; Cesar, T.B. Long-term orange juice consumption is associated with low LDL-cholesterol and apolipoprotein B in normal and moderately hypercholesterolemic subjects. Lipids Health Dis. 2013, 12, 119. [Google Scholar] [CrossRef] [Green Version]
  11. Mahmoud, A.M.; Bautista, R.J.H.; Sandhu, M.A.; Hussein, O.E. Beneficial Effects of Citrus Flavonoids on Cardiovascular and Metabolic Health. Oxidative Med. Cell. Longev. 2019, 2019, 5484138. [Google Scholar] [CrossRef] [PubMed] [Green Version]
  12. Kerimi, A.; Gauer, J.S.; Crabbe, S.; Cheah, J.W.; Lau, J.; Walsh, R.; Cancalon, P.F.; Williamson, G. Effect of the flavonoid hesperidin on glucose and fructose transport, sucrase activity and glycaemic response to orange juice in a crossover trial on healthy volunteers. Br. J. Nutr. 2019, 121, 782–792. [Google Scholar] [CrossRef] [PubMed]
  13. Murphy, M.M.; Barrett, E.C.; Bresnahan, K.A.; Barraj, L.M. 100 % Fruit juice and measures of glucose control and insulin sensitivity: A systematic review and meta-analysis of randomized controlled trials. J. Nutr. Sci. 2017, 6, e59. [Google Scholar] [CrossRef] [PubMed] [Green Version]
  14. Morand, C.; DuBray, C.; Milenkovic, D.; Lioger, D.; Martin, J.F.; Scalbert, A.; Mazur, A. Hesperidin contributes to the vascular protective effects of orange juice: A randomized crossover study in healthy volunteers. Am. J. Clin. Nutr. 2011, 93, 73–80. [Google Scholar] [CrossRef]
  15. Gandhi, G.R.; Vasconcelos, A.B.S.; Wu, D.T.; Li, H.B.; Antony, P.J.; Li, H.; Geng, F.; Gurgel, R.Q.; Narain, N.; Gan, R.Y. Citrus flavonoids as promising phytochemicals targeting diabetes and related complications: A systematic review of in vitro and in vivo studies. Nutrients 2020, 12, 2097. [Google Scholar] [CrossRef]
  16. Landberg, R.; Manach, C.; Kerckhof, F.M.; Minihane, A.M.; Saleh, R.N.M.; De Roos, B.; Tomás-Barberán, F.A.; Morand, C.; Van De Wiele, T. Future prospects for dissecting inter-individual variability in the absorption, distribution and elimination of plant bioactives of relevance for cardiometabolic endpoints. Eur. J. Nutr. 2019, 58, S21–S36. [Google Scholar] [CrossRef] [Green Version]
  17. Gibney, E.; Milenkovic, D.; Combet, E.; Ruskovska, T.; Greyling, A.; González-Sarrías, A.; De Roos, B.; Tomás-Barberán, F.A.; Morand, C.; Rodríguez-Mateos, A. Factors influencing the cardiometabolic response to (poly)phenols and phytosterols: A review of the COST Action POSITIVe activities. Eur. J. Nutr. 2019, 58, 37–47. [Google Scholar] [CrossRef] [Green Version]
  18. Morand, C.; Tomás Barberán, F.A. Contribution of plant food bioactives in promoting health effects of plant foods: Why look at interindividual variability? Eur. J. Nutr. 2019, 58, 13–19. [Google Scholar] [CrossRef] [Green Version]
  19. Crozier, A.; Jaganath, I.B.; Clifford, M.N. Dietary phenolics: Chemistry, bioavailability and effects on health. Nat. Prod. Rep. 2009, 26, 1001–1043. [Google Scholar] [CrossRef]
  20. Del Rio, D.; Rodriguez-Mateos, A.; Spencer, J.P.; Tognolini, M.; Borges, G.; Crozier, A. Dietary (Poly)phenolics in Human Health: Structures, Bioavailability, and Evidence of Protective Effects Against Chronic Diseases. Antiox. Redox Signal. 2013, 18, 1818–1892. [Google Scholar] [CrossRef] [Green Version]
  21. Williamson, G.; Kay, C.D.; Crozier, A. The Bioavailability, Transport, and Bioactivity of Dietary Flavonoids: A Review from a Historical Perspective. Compr. Rev. Food Sci. Food Saf. 2018, 17, 1054–1112. [Google Scholar] [CrossRef] [PubMed] [Green Version]
  22. Day, A.J.; Dupont, M.S.; Ridley, S.; Rhodes, M.; Rhodes, M.J.; Morgan, M.R.; Williamson, G. Deglycosylation of flavonoid and isoflavonoid glycosides by human small intestine and liver β-glucosidase activity. FEBS Lett. 1998, 436, 71–75. [Google Scholar] [CrossRef] [Green Version]
  23. Hollands, W.; Brett, G.M.; Dainty, J.R.; Teucher, B.; Kroon, P.A. Urinary excretion of strawberry anthocyanins is dose dependent for physiological oral doses of fresh fruit. Mol. Nutr. Food Res. 2008, 52, 1097–1105. [Google Scholar] [CrossRef] [PubMed]
  24. Brand, W.; Van Der Wel, P.A.; Rein, M.J.; Barron, D.; Williamson, G.; Bladeren, P.J.; Rietjens, I.M. Metabolism and Transport of the Citrus Flavonoid Hesperetin in Caco-2 Cell Monolayers. Drug Metab. Dispos. 2008, 36, 1794–1802. [Google Scholar] [CrossRef] [PubMed] [Green Version]
  25. Spencer, J.P.; Chowrimootoo, G.; Choudhury, R.; Debnam, E.S.; Srai, S.K.; Rice-Evans, C. The small intestine can both absorb and glucuronidate luminal flavonoids. FEBS Lett. 1999, 458, 224–230. [Google Scholar] [CrossRef] [Green Version]
  26. Scalbert, A.; Williamson, G. Dietary Intake and Bioavailability of Polyphenols. J. Nutr. 2000, 130, 2073S–2085S. [Google Scholar] [CrossRef]
  27. Cassidy, A.; Minihane, A.M. The role of metabolism (and the microbiome) in defining the clinical efficacy of dietary flavonoids. Am. J. Clin. Nutr. 2017, 105, 10–22. [Google Scholar] [CrossRef] [Green Version]
  28. Najmanova, I.; Vopršalová, M.; Saso, L.; Mladěnka, P. The pharmacokinetics of flavanones. Crit. Rev. Food Sci. Nutr. 2020, 60, 3155–3171. [Google Scholar] [CrossRef]
  29. Vallejo, F.; Larrosa, M.; Escudero, E.; Zafrilla, M.P.; Cerdá, B.; Boza, J.; García-Conesa, M.T.; Espín, J.C.; Tomás-Barberán, F.A. Concentration and Solubility of Flavanones in Orange Beverages Affect Their Bioavailability in Humans. J. Agric. Food Chem. 2010, 58, 6516–6524. [Google Scholar] [CrossRef]
  30. Tomás-Navarro, M.; Vallejo, F.; Sentandreu, E.; Navarro, J.L.; Tomás-Barberán, F.A. Volunteer Stratification Is More Relevant than Technological Treatment in Orange Juice Flavanone Bioavailability. J. Agric. Food Chem. 2014, 62, 24–37. [Google Scholar] [CrossRef]
  31. Brett, G.M.; Hollands, W.; Needs, P.W.; Teucher, B.; Dainty, J.R.; Davis, B.D.; Brodbelt, J.S.; Kroon, P.A. Absorption, metabolism and excretion of flavanones from single portions of orange fruit and juice and effects of anthropometric variables and contraceptive pill use on flavanone excretion. Br. J. Nutr. 2009, 101, 664–675. [Google Scholar] [CrossRef] [PubMed] [Green Version]
  32. Roowi, S.; Mullen, W.; Edwards, C.A.; Crozier, A. Yoghurt impacts on the excretion of phenolic acids derived from colonic breakdown of orange juice flavanones in humans. Mol. Nutr. Food Res. 2009, 53, S68–S75. [Google Scholar] [CrossRef] [PubMed]
  33. Silveira, J.Q.; Cesar, T.B.; Manthey, J.A.; Baldwin, E.A.; Bai, J.; Raithore, S. Pharmacokinetics of Flavanone Glycosides after Ingestion of Single Doses of Fresh-Squeezed Orange Juice versus Commercially Processed Orange Juice in Healthy Humans. J. Agric. Food Chem. 2014, 62, 12576–12584. [Google Scholar] [CrossRef] [PubMed]
  34. Pereira-Caro, G.; Borges, G.; Van Der Hooft, J.; Clifford, M.N.; Del Rio, D.; Lean, M.E.; Roberts, S.A.; Kellerhals, M.B.; Crozier, A. Orange juice (poly)phenols are highly bioavailable in humans. Am. J. Clin. Nutr. 2014, 100, 1378–1384. [Google Scholar] [CrossRef]
  35. Aschoff, J.K.; Riedl, K.M.; Cooperstone, J.L.; Högel, J.; Bosy-Westphal, A.; Schwartz, S.J.; Carle, R.; Schweiggert, R.M. Urinary excretion of Citrus flavanones and their major catabolites after consumption of fresh oranges and pasteurized orange juice: A randomized cross-over study. Mol. Nutr. Food Res. 2016, 60, 2602–2610. [Google Scholar] [CrossRef]
  36. Nagar, S.; Walther, S.; Blanchard, R.L. Sulfotransferase (SULT) 1A1 Polymorphic Variants *1, *2, and *3 Are Associated with Altered Enzymatic Activity, Cellular Phenotype, and Protein Degradation. Mol. Pharmacol. 2006, 69, 2084–2092. [Google Scholar] [CrossRef] [Green Version]
  37. Stingl, J.C.; Bartels, H.; Viviani, R.; Lehmann, M.L.; Brockmöller, J. Relevance of UDP-glucuronosyltransferase polymorphisms for drug dosing: A quantitative systematic review. Pharmacol. Ther. 2014, 141, 92–116. [Google Scholar] [CrossRef]
  38. Shiga, T.; Soares, C.A.; Nascimento, J.R.O.; Purgatto, E.; Lajolo, F.M.; Cordenunsi, B.R. Ripening-associated changes in the amounts of starch and non-starch polysaccharides and their contributions to fruit softening in three banana cultivars. J. Sci. Food Agric. 2011, 91, 1511–1516. [Google Scholar] [CrossRef]
  39. Association of Official Analytical Chemists (AOAC). Official Methods of Analysis, 16th ed.; AOAC International: Arlington, VA, USA, 1995. [Google Scholar]
  40. Brasili, E.; Chaves, D.F.; Xavier, A.A.; Mercadante, A.Z.; Hassimotto, N.M.; Lajolo, F.M. Effect of Pasteurization on Flavonoids and Carotenoids in Citrus sinensis (L.) Osbeck cv. ‘Cara Cara’ and ‘Bahia’ Juices. J. Agric. Food Chem. 2017, 65, 1371–1377. [Google Scholar] [CrossRef]
  41. Hillebrand, S.; Schwarz, M.; Winterhalter, P. Characterization of Anthocyanins and Pyranoanthocyanins from Blood Orange [Citrus sinensis (L.) Osbeck] Juice. J. Agric. Food Chem. 2004, 52, 7331–7338. [Google Scholar] [CrossRef]
  42. Lohman, T.G. Advances in Body Composition Assessment; Human Kinetics Publishers: Champaing, IL, USA, 1991. [Google Scholar]
  43. Christoff, A.P.; Sereia, A.F.R.; Boberg, D.R.; Moraes, R.L.V.; Oliveira, L.F.V. Bacterial identification through accurate library preparation and high-throughput sequencing. Neoprospecta Microbiome Technol. 2017, 1–5. [Google Scholar]
  44. Wang, Y.; Qian, P.Y. Conservative Fragments in Bacterial 16S rRNA Genes and Primer Design for 16S Ribosomal DNA Amplicons in Metagenomic Studies. PLoS ONE 2009, 4, e7401. [Google Scholar] [CrossRef] [PubMed] [Green Version]
  45. Caporaso, J.G.; Lauber, C.L.; Walters, W.A.; Berg-Lyons, D.; Huntley, J.; Fierer, N.; Owens, S.M.; Betley, J.; Fraser, L.; Bauer, M.; et al. Ultra-high-throughput microbial community analysis on the Illumina HiSeq and MiSeq platforms. ISME J. 2012, 6, 1621–1624. [Google Scholar] [CrossRef] [PubMed] [Green Version]
  46. Christoff, A.P.; Cruz, G.N.F.; Sereia, F.R.; Yamanaka, L.E.; Silveira, P.P.; Oliveira, L.F.V. End-to-end assessment of fecal bacteriome analysis: From sample processing to DNA sequencing and bioinformatics results. BioRxiv 2019, 1–22. [Google Scholar] [CrossRef]
  47. Quast, C.; Pruesse, E.; Yilmaz, P.; Gerken, J.; Schweer, T.; Yarza, P.; Peplies, J.; Glöckner, F.O. The SILVA Ribosomal RNA Gene Database Project: Improved Data Processing and Web-Based Tools. Nucleic Acids Res. 2013, 41, D590–D596. [Google Scholar] [CrossRef]
  48. Chong, J.; Wishart, D.S.; Xia, J. Using Metabo Analyst 4.0 for Comprehensive and Integrative Metabolomics Data Analysis. Curr. Protoc. Bioinform. 2019, 68, e86. [Google Scholar] [CrossRef]
  49. Manach, C.; Milenkovic, D.; Van De Wiele, T.; Rodriguez-Mateos, A.; De Roos, B.; Garcia-Conesa, M.T.; Landberg, R.; Gibney, E.R.; Heinonen, M.; Tomás-Barberán, F.; et al. Addressing the inter-individual variation in response to consumption of plant food bioactives: Towards a better understanding of their role in healthy aging and cardiometabolic risk reduction. Mol. Nutr. Food Res. 2017, 61, 16. [Google Scholar] [CrossRef] [Green Version]
  50. Mas-Capdevila, A.; Teichenné, J.; Domenech-Coca, C.; Caimari, A.; Del Bas, J.M.; Escoté, X.; Crescenti, A. Effect of Hesperidin on Cardiovascular Disease Risk Factors: The Role of Intestinal Microbiota on Hesperidin Bioavailability. Nutrients 2020, 12, 1488. [Google Scholar] [CrossRef]
  51. Bredsdorff, L.; Nielsen, I.L.; Rasmussen, S.E.; Cornett, C.; Barron, D.; Bouisset, F.; Offord, E.; Williamson, G. Absorption, conjugation and excretion of the flavanones, naringenin and hesperetin from α-rhamnosidase-treated orange juice in human subjects. Br. J. Nutr. 2010, 11, 1602–1609. [Google Scholar] [CrossRef] [Green Version]
  52. Pereira-Caro, G.; Ludwig, I.A.; Polyviou, T.; Malkova, D.; García, A.; Moreno-Rojas, J.M.; Crozier, A. Identification of Plasma and Urinary Metabolites and Catabolites Derived from Orange Juice (Poly)phenols: Analysis by High-Performance Liquid Chromatography–High-Resolution Mass Spectrometry. J. Agric. Food Chem. 2016, 64, 5724–5735. [Google Scholar] [CrossRef] [Green Version]
  53. Kay, C.D.; Mazza, G.J.; Holub, B.J. Anthocyanins Exist in the Circulation Primarily as Metabolites in Adult Men. J. Nutr. 2005, 135, 2582–2588. [Google Scholar] [CrossRef] [PubMed] [Green Version]
  54. Stalmach, A.; Edwards, C.A.; Wightman, J.D.; Crozier, A. Gastrointestinal stability and bioavailability of (poly)phenolic compounds following ingestion of Concord grape juice by humans. Mol. Nutr. Food Res. 2012, 56, 497–509. [Google Scholar] [CrossRef] [PubMed]
  55. Kay, C.D.; Pereira-Caro, G.; Ludwig, I.A.; Clifford, M.N.; Crozier, A. Anthocyanins and Flavanones Are More Bioavailable than Previously Perceived: A Review of Recent Evidence. Annu. Rev. Food Sci. Technol. 2017, 8, 155–180. [Google Scholar] [CrossRef] [PubMed]
  56. Zeng, X.; Su, W.; Bai, Y.; Chen, T.; Yan, Z.; Wang, J.; Su, M.; Zheng, Y.; Peng, W.; Yao, H. Urinary metabolite profiling of flavonoids in Chinese volunteers after consumption of orange juice by UFLC-Q-TOF-MS/MS. J. Chromatogr. B Anal. Technol. Biomed. Life Sci. 2017, 1061, 79–88. [Google Scholar] [CrossRef] [PubMed]
  57. Pereira-Caro, G.; Oliver, C.M.; Weerakkody, R.; Singh, T.; Conlon, M.; Borges, G.; Sanguansri, L.; Lockett, T.; Roberts, S.A.; Crozier, A.; et al. Chronic administration of a microencapsulated probiotic enhances the bioavailability of orange juice flavanones in humans. Free Radic. Biol. Med. 2015, 84, 206–214. [Google Scholar] [CrossRef]
  58. Braune, A.; Blaut, M. Bacterial species involved in the conversion of dietary flavonoids in the human gut. Gut Microbes 2016, 7, 216–234. [Google Scholar] [CrossRef] [Green Version]
  59. Cortés-Martín, A.; Selma, M.V.; Tomás-Barberán, F.A.; González-Sarrías, A.; Espín, J.C. Where to Look into the Puzzle of Polyphenols and Health? The Postbiotics and Gut Microbiota Associated with Human Metabotypes. Mol. Nutr. Food Res. 2020, 64, e1900952. [Google Scholar] [CrossRef]
  60. Wu, B.; Kulkarni, K.; Basu, S.; Zhang, S.; Hu, M. First-Pass Metabolism via UDP-Glucuronosyltransferase: A Barrier to Oral Bioavailability of Phenolics. J. Pharm. Sci. 2011, 100, 3655–3681. [Google Scholar] [CrossRef] [Green Version]
  61. Brand, W.; Boersma, M.G.; Bik, H.; Hoek-van Den Hil, E.F.; Vervoort, J.; Barron, D.; Meinl, W.; Glatt, H.; Williamson, G.; Van Bladeren, P.J.; et al. Phase II Metabolism of Hesperetin by Individual UDP-Glucuronosyltransferases and Sulfotransferases and Rat and Human Tissue Samples. Drug Metab. Dispos. 2010, 38, 617–625. [Google Scholar] [CrossRef]
  62. Mehboob, H.; Tahir, I.M.; Iqbal, T.; Akhter, N.; Munir, N.; Riaz, M. Genetic Polymorphism of UDP-Glucuronosyltransferase. In Genetic Polymorphisms; IntechOpen, Narasimha Reddy Parine, King Saud University: Riyadh, Saudi Arabia, 2017; pp. 159–183. [Google Scholar]
  63. Kasteel, E.E.J.; Darney, K.; Kramer, N.I.; Dorne, J.L.C.M.; Lautz, L.S. Human variability in isoform-specific UDP-glucuronosyltransferases: Markers of acute and chronic exposure, polymorphisms and uncertainty factors. Arch. Toxicol. 2020, 94, 2637–2661. [Google Scholar] [CrossRef]
  64. Peters, U.; Sinha, R.; Bell, D.A.; Rothman, N.; Grant, D.J.; Watson, M.A.; Kulldorff, M.; Brooks, L.R.; Warren, S.H.; DeMarini, D.M. Urinary mutagenesis and fried red meat intake: Influence of cooking temperature, phenotype, and genotype of metabolizing enzymes in a controlled feeding study. Environ. Mol. Mutagen. 2004, 43, 53–74. [Google Scholar] [CrossRef] [PubMed]
  65. Wakeling, L.A.; Ford, D. Polymorphisms in genes involved in the metabolism and transport of soy isoflavones affect the urinary metabolite profile in premenopausal women following consumption of a commercial soy supplement as a single bolus dose. Mol. Nutr. Food Res. 2012, 56, 1794–1802. [Google Scholar] [CrossRef] [PubMed]
Figure 1. Orthogonal projections to latent structures discriminant analysis (oPLS-DA) of phase II flavanone metabolites excreted in urine 24 h (four collected intervals) after the consumption of (A) Pera orange juice (POJ) and (B) Moro orange juice (MOJ) in individuals with non-obese and obese BMI values (n = 17 non-obese and 10 obese volunteers).
Nutrients 13 00473 g001
Figure 2. Stratification into high, medium, and low excretors, according to (A) total flavanone phase II metabolites excreted in urine 24 h after single doses of Pera (POJ) and Moro (MOJ) orange juices and to (B) the relative abundance of gut microbiota genus in the volunteers. Superscript letters indicate statistical significance among all, high, medium, and low excretors according to Kruskal-Wallis test (p < 0.05). AUC: Area Under the Curve.
Nutrients 13 00473 g002
Figure 3. Heatmap of phase II flavanone metabolites excreted in urine over a 24 h period (four collected intervals) after the intake of Pera (POJ) and Moro (MOJ) orange juices ((A,B), respectively), separated into Excretion Profiles A and B. The oPLS-DA data show the Excretion Profiles according to phase II metabolite excretion in urine over the 24 h period ((C,D), respectively) (n of POJ = 10 volunteers with Profile A and 17 with Profile B; n of MOJ = 12 volunteers with Profile A and 15 with Profile B).
Nutrients 13 00473 g003
Figure 4. Time course curve of excretion of phase II flavanone metabolites in urine over a 24 h period for individuals classified as having Excretion Profiles A and B after consumption of Pera (POJ) and Moro (MOJ) orange juices: (A) Hesperetin metabolites and (B) naringenin metabolites. Number of participants: Profile A (n = 10) and Profile B (n = 17) for POJ; Profile A (n = 12) and Profile B (n = 15) for MOJ. Asterisks indicate statistical significance between excretion profiles A and B according to Mann–Whitney test (p < 0.05). AUC: Area Under the Curve.
Nutrients 13 00473 g004
Figure 5. Recovery of urinary flavanone phase II metabolites over a 24-h period after single doses of Pera (POJ) (A,B) and Moro (MOJ) orange juices (C,D) for individuals classified as having Excretion Profiles A and B. Hesperetin metabolites (A,C) and naringenin metabolites (B,D) are shown (n of POJ = 10 volunteers with Profile A and 17 with Profile B; n of MOJ = 12 volunteers with Profile A and 15 with Profile B). HS: hesperetin-sulfate; HDG: hesperetin-diglucuronide; HSG: hesperetin-sulfo-O-glucuronide; NDG: naringenin-diglucuronide; NSG: naringenin-sulfo-O-glucuronide; N7G: naringenin-7-O-glucuronide. AUC: Area Under the Curve.
Nutrients 13 00473 g005
Figure 6. Relative abundance of gut microbiota genera in volunteers with Excretion Profiles A (n = 5) and B (n = 10).
Nutrients 13 00473 g006
Table 1. Anthropometric variables, biochemical parameters, and intestinal permeability markers of the non-obese and obese volunteers.
VariableNon-Obese
(n = 17)
Obese
(n = 10)
p-Value
Age (years)26.76 ± 1.5330.80 ± 3.020.197
Body weight (kg)56.45 ± 1.85 b83.29 ± 3.22 a0.001
BMI (kg.m−2)21.19 ± 0.49 b31.56 ± 0.88 a0.001
Body fat (%)28.23 ± 1.36 b47.03 ± 1.74 a0.001
Creatinine (mg.dL−1)0.71 ± 0.030.74 ± 0.020.376
AST (U.L−1)18.59 ± 3.4521.80 ± 3.440.545
ALT (U.L−1)18.59 ± 6.7530.00 ± 11.340.364
Cholesterol (mg.dL−1)
 LDL89.71 ± 4.29123.60 ± 17.170.084
 HDL69.12 ± 2.5767.50 ± 9.770.876
 Total176.94 ± 5.73 b217.00 ± 17.85 a0.016
Triglycerides (mg.dL−1)93.88 ± 9.39175.40 ± 44.570.104
Glucose (mg/dL)85.76 ± 1.82102.00 ± 14.250.287
Insulin (mU.L−1)7.65 ± 1.00 b12.30 ± 1.74 a0.019
HOMA-IR1.64 ± 0.23 b3.02 ± 0.46 a0.018
Zonulin (ng.mL−1)32.63 ± 1.9229.28 ± 2.250.280
LPS (EU.mL−1)0.09 ± 0.040.05 ± 0.010.448
Intestinal permeability0.02 ± 0.000.01 ± 0.010.699
BMI: Body mass index. AST: aspartate transaminase. ALT: alanine transaminase. LDL: low-density lipoprotein. HDL: high-density lipoprotein. HOMA-IR: homeostatic model assessment-Insulin resistance. LPS: lipopolysaccharides. p-values calculated using the Mann–Whitney test. Values in bold letters and different superscript letters indicate statistical significance (p < 0.05) between volunteer groups for a given anthropometric or clinical parameter (mean ± standard error).
Table 2. Mass spectra data of phase II metabolites of flavanones detected in urine by LC-qTOF-MS/MS after single doses of pasteurized Pera and Moro orange juice.
CompoundPeakRT
(min)
[M-H]
(m/z)
MS/MS
(m/z)
Naringenin-diglucuronide—isomer 116.5623.1285447.0976/271.0690
Hesperetin-diglucuronide—isomer 128.3653.1352477.1054/301.0735
Naringenin-diglucuronide—isomer 238.8623.1274447.1274/271.0624
Naringenin-sulfo-O-glucuronide48.8527.0433271.0585
Hesperetin-diglucuronide—isomer 2510.6653.1362477.1041/301/0721
Hesperetin-sulfo-O-glucuronide610.6557.0699477.1118/301.0759
Naringenin-7-O-glucuronide *713.5447.0929271.0621
Naringenin-sulfate814.5351.0180271.0622
Hesperetin-glucuronide915.0477.1045301.0728
Hesperetin-sulfate1015.9381.0343301.0790
RT: retention time. * Compound identity confirmed by co-elution with standard.
Publisher’s Note: MDPI stays neutral with regard to jurisdictional claims in published maps and institutional affiliations.

