The Glycaemic and Insulinaemic Response of Pasta in Chinese and Indians Compared to Asian Carbohydrate Staples: Taking Spaghetti Back to Asia

 ,
,
Abstract
:1. Introduction
2. Materials and Methods
2.1. Subjects
2.2. Study Design
2.3. Treatment Meals
2.4. Metabolic Plasma Parameters
2.5. Statistics
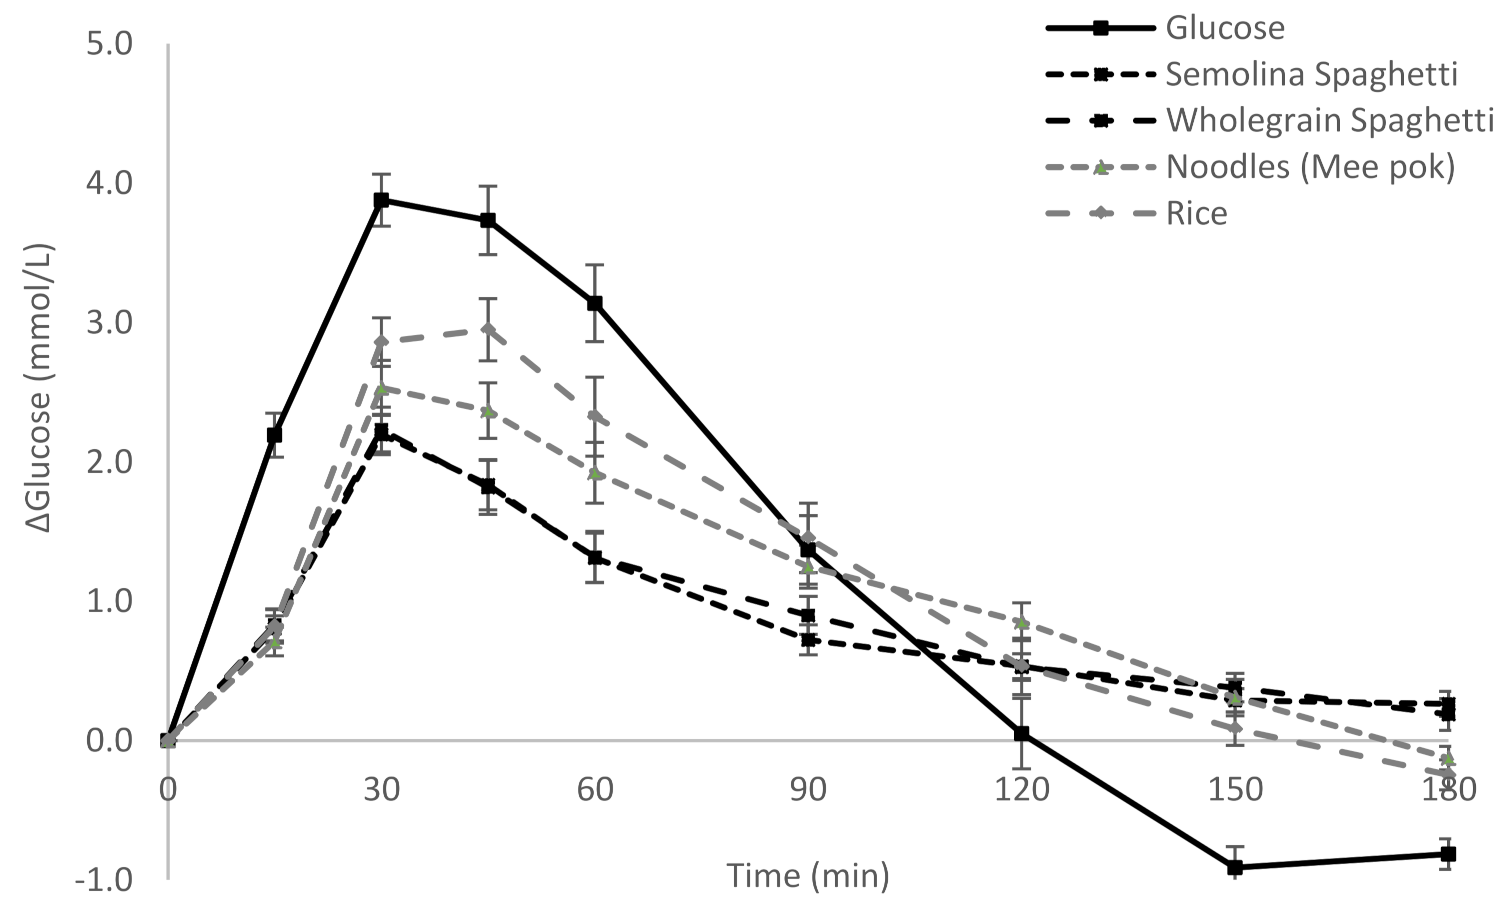
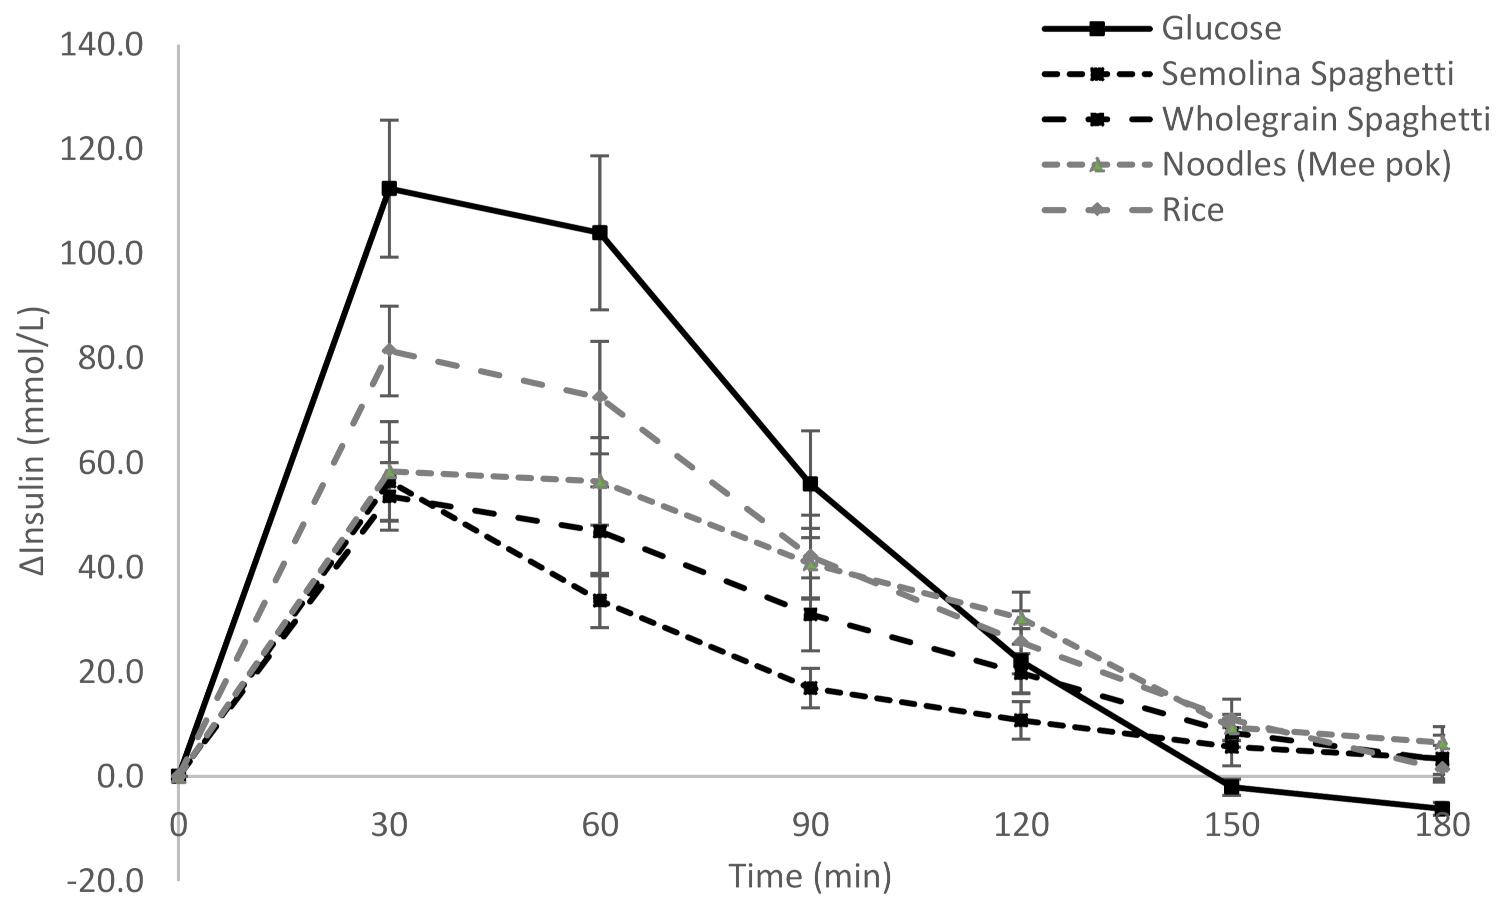
3. Results
4. Discussion
5. Conclusions
Author Contributions
Funding
Institutional Review Board Statement
Informed Consent Statement
Data Availability Statement
Acknowledgments
Conflicts of Interest
References
- Dickinson, S.; Colagiuri, S.; Faramus, E.; Petocz, P.; Brand-Miller, J. Postprandial hyperglycemia and insulin sensitivity differ among lean young adults of different ethnicities. J. Nutr. 2002, 132, 2574–2579. [Google Scholar] [CrossRef] [PubMed] [Green Version]
- Hu, F.B. Globalization of diabetes the role of diet, lifestyle, and genes. Diabetes Care 2011, 34, 1249–1257. [Google Scholar] [CrossRef] [PubMed] [Green Version]
- Venn, B.J.; Williams, S.M.; Mann, J.I. Comparison of postprandial glycaemia in asians and caucasians. Diabet. Med. 2010, 27, 1205–1208. [Google Scholar] [CrossRef] [PubMed]
- Foo, L.L.; Vijaya, K.; Sloan, R.A.; Ling, A. Obesity prevention and management: Singapore’s experience. Obes. Rev. 2013, 14 (Suppl. S2), 106–113. [Google Scholar]
- Walker, K.Z.; O’Dea, K.; Gomez, M.; Girgis, S.; Colagiuri, R. Diet and exercise in the prevention of diabetes. J. Hum. Nutr. Diet. 2010, 23, 344–352. [Google Scholar] [CrossRef]
- Mirabelli, M.; Chiefari, E.; Arcidiacono, B.; Corigliano, D.M.; Brunetti, F.S.; Maggisano, V.; Russo, D.; Foti, D.P.; Brunetti, A. Mediterranean Diet Nutrients to Turn the Tide against Insulin Resistance and Related Diseases. Nutrients 2020, 12, 1066. [Google Scholar] [CrossRef] [Green Version]
- Ludwig, D.S. The glycemic index: Physiological mechanisms relating to obesity, diabetes, and cardiovascular disease. JAMA 2002, 287, 2414–2423. [Google Scholar] [CrossRef]
- Brand-Miller, J.C.; Holt, S.H.A.; Pawlak, D.B.; McMillan, J. Glycemic index and obesity. Am. J. Clin. Nutr. 2002, 76, 281S–285S. [Google Scholar]
- Monnier, L.; Mas, E.; Ginet, C.; Michel, F.; Villon, L.; Cristol, J.P.; Colette, C. Activation of oxidative stress by acute glucose fluctuations compared with sustained chronic hyperglycemia in patients with type 2 diabetes. JAMA 2006, 295, 1681–1687. [Google Scholar] [CrossRef] [Green Version]
- Camps, S.G.; Kaur, B.; Quek, R.Y.C.; Henry, C.J. Does the ingestion of a 24 h low glycaemic index asian mixed meal diet improve glycaemic response and promote fat oxidation? A controlled, randomized cross-over study. Nutr. J. 2017, 16, 43. [Google Scholar] [CrossRef]
- Livesey, G.; Taylor, R.; Hulshof, T.; Howlett, J. Glycemic response and health—A systematic review and meta-analysis: Relations between dietary glycemic properties and health outcomes. Am. J. Clin. Nutr. 2008, 87, 258S–268S. [Google Scholar] [CrossRef] [PubMed] [Green Version]
- Sun, Q.; Spiegelman, D.; van Dam, R.M.; Holmes, M.D.; Malik, V.S.; Willett, W.C.; Hu, F.B. White rice, brown rice, and risk of type 2 diabetes in us men and women. Arch. Intern. Med. 2010, 170, 961–969. [Google Scholar] [CrossRef] [PubMed]
- Hu, E.A.; Pan, A.; Malik, V.; Sun, Q. White rice consumption and risk of type 2 diabetes: Meta-analysis and systematic review. BMJ 2012, 344, e1454. [Google Scholar] [CrossRef] [PubMed] [Green Version]
- Faostat. Available online: http://faostat.fao.org/site/291/default.aspx (accessed on 2 September 2020).
- Smartt, J.; Simmonds, N.W. Evolution of Crop Plants; Wiley-Blackwell: Hoboken, NJ, USA, 1995. [Google Scholar]
- Shewry, P.R.; Hey, S.J. The contribution of wheat to human diet and health. Food Energy Secur. 2015, 4, 178–202. [Google Scholar] [CrossRef]
- Jenkins, D.J.; Wolever, T.M.; Jenkins, A.L. Starchy foods and glycemic index. Diabetes Care 1988, 11, 149–159. [Google Scholar]
- Simonato, B.; Curioni, A.; Pasini, G. Digestibility of pasta made with three wheat types: A preliminary study. Food Chem. 2015, 174, 219–225. [Google Scholar] [CrossRef]
- Monge, L.; Cortassa, G.; Fiocchi, F.; Mussino, G.; Carta, Q. Glycoinsulinaemic response, digestion and intestinal absorption of the starch contained in two types of spaghetti. Diabetes Nutr. Metab. 1990, 3, 239–246. [Google Scholar]
- Björck, I.; Liljeberg, H.; Östman, E. Low glycaemic-index foods. Br. J. Nutr. 2007, 83, S149–S155. [Google Scholar] [CrossRef]
- Maclean, J.; Hardy, B.; Hettel, G. Rice Almanac Fourth Edition; International Rice Research Institute (IRRI): Los Baños, Philippines, 2013. [Google Scholar]
- Wrigley, C.W.; Corke, H.; Seetharaman, K.; Faubion, J. Encyclopedia of Food Grains; Academic Press: Cambridge, MA, USA, 2015. [Google Scholar]
- Shobana, S.; Malleshi, N.G.; Sudha, V.; Spiegelman, D.; Hong, B.; Hu, F.B.; Willett, W.C.; Krishnaswamy, K.; Mohan, V. Nutritional and sensory profile of two indian rice varieties with different degrees of polishing. Int. J. Food Sci. Nutr. 2011, 62, 800–810. [Google Scholar] [CrossRef]
- Urbaniak, G.C.; Plous, S. Research randomizer (version 4.0) [computer software]. Available online: http://www.randomizer.org (accessed on 1 June 2018).
- Kaur, B.; Quek, R.Y.C.; Camps, S.; Henry, C.J. The impact of a low glycaemic index (gi) diet on simultaneous measurements of blood glucose and fat oxidation: A whole body calorimetric study. J. Clin. Transl. Endocrinol. 2016, 4, 45–52. [Google Scholar] [CrossRef] [Green Version]
- Allison, D.B.; Paultre, F.; Maggio, C.; Mezzitis, N.; Pi-Sunyer, F.X. The use of areas under curves in diabetes research. Diabetes Care 1995, 18, 245–250. [Google Scholar] [CrossRef] [PubMed]
- Brouns, F.; Bjorck, I.; Frayn, K.N.; Gibbs, A.L.; Lang, V.; Slama, G.; Wolever, T.M.S. Glycaemic index methodology. Nutr. Res. Rev. 2005, 18, 145. [Google Scholar] [CrossRef] [PubMed] [Green Version]
- FAO. Carbohydrates in Human Nutrition: Report of a Joint FAO/WHO Expert Consultation; FAO: Rome, Italy, 1998. [Google Scholar]
- International Organization for Standardization. ISO 26642: 2010. Food Products—Determination of the Glycaemic Index (GI) and Recommendation for Food Classification; ISO: Geneva, Switzerland, 2010. [Google Scholar]
- De Zorzi, M.; Curioni, A.; Simonato, B.; Giannattasio, M.; Pasini, G. Effect of pasta drying temperature on gastrointestinal digestibility and allergenicity of durum wheat proteins. Food Chem. 2007, 104, 353–363. [Google Scholar] [CrossRef]
- Petitot, M.; Brossard, C.; Barron, C.; Larré, C.; Morel, M.-H.; Micard, V. Modification of pasta structure induced by high drying temperatures. Effects on the in vitro digestibility of protein and starch fractions and the potential allergenicity of protein hydrolysates. Food Chem. 2009, 116, 401–412. [Google Scholar] [CrossRef]
- Del Nobile, M.A.; Baiano, A.; Conte, A.; Mocci, G. Influence of protein content on spaghetti cooking quality. J. Cereal Sci. 2005, 41, 347–356. [Google Scholar] [CrossRef]
- Fardet, A.; Abecassis, J.; Hoebler, C.; Baldwin, P.M.; Buléon, A.; Bérot, S.; Barry, J.L. Influence of technological modifications of the protein network from pasta on in vitro starch degradation. J. Cereal Sci. 1999, 30, 133–145. [Google Scholar] [CrossRef]
- Karhunen, L.J.; Juvonen, K.R.; Huotari, A.; Purhonen, A.K.; Herzig, K.H. Effect of protein, fat, carbohydrate and fibre on gastrointestinal peptide release in humans. Regul. Pept. 2008, 149, 70–78. [Google Scholar] [CrossRef]
- Iverson, J.F.; Gannon, M.C.; Nuttall, F.Q. Ingestion of leucine + phenylalanine with glucose produces an additive effect on serum insulin but less than additive effect on plasma glucose. J. Amino Acids 2013. [Google Scholar] [CrossRef] [Green Version]
- Kalogeropoulou, D.; LaFave, L.; Schweim, K.; Gannon, M.C.; Nuttall, F.Q. Leucine, when ingested with glucose, synergistically stimulates insulin secretion and lowers blood glucose. Metabolism 2008, 57, 1747–1752. [Google Scholar] [CrossRef]
- Camps, S.G.; Lim, J.; Ishikado, A.; Inaba, Y.; Suwa, M.; Matsumoto, M.; Henry, C.J. Co-ingestion of rice bran soymilk or plain soymilk with white bread: Effects on the glycemic and insulinemic response. Nutrients 2018, 10, 449. [Google Scholar] [CrossRef] [Green Version]
- Quek, R.; Bi, X.; Henry, C.J. Impact of protein-rich meals on glycaemic response of rice. Br. J. Nutr. 2016, 115, 1194–1201. [Google Scholar] [CrossRef] [PubMed] [Green Version]
- Schulze, M.B.; Liu, S.; Rimm, E.B.; Manson, J.E.; Willett, W.C.; Hu, F.B. Glycemic index, glycemic load, and dietary fiber intake and incidence of type 2 diabetes in younger and middle-aged women. Am. J. Clin. Nutr. 2004, 80, 348–356. [Google Scholar] [CrossRef] [PubMed]
- Karl, J.P.; Meydani, M.; Barnett, J.B.; Vanegas, S.M.; Goldin, B.; Kane, A.; Rasmussen, H.; Saltzman, E.; Vangay, P.; Knights, D.; et al. Substituting whole grains for refined grains in a 6-wk randomized trial favorably affects energy-balance metrics in healthy men and postmenopausal women. Am. J. Clin. Nutr. 2017, 105, 589–599. [Google Scholar] [CrossRef] [PubMed] [Green Version]
- Wu, H.; Flint, A.J.; Qi, Q.; Van Dam, R.M.; Sampson, L.A.; Rimm, E.B.; Holmes, M.D.; Willett, W.C.; Hu, F.B.; Sun, Q. Association between dietary whole grain intake and risk of mortality: Two large prospective studies in us men and women. JAMA Intern. Med. 2015, 175, 373–384. [Google Scholar] [CrossRef] [PubMed]
- Jacobs, D.R., Jr.; Andersen, L.F.; Blomhoff, R. Whole-grain consumption is associated with a reduced risk of noncardiovascular, noncancer death attributed to inflammatory diseases in the iowa women’s health study. Am. J. Clin. Nutr. 2007, 85, 1606–1614. [Google Scholar] [CrossRef] [PubMed] [Green Version]
- Scazzina, F.; Siebenhandl-Ehn, S.; Pellegrini, N. The effect of dietary fibre on reducing the glycaemic index of bread. Br. J. Nutr. 2013, 109, 1163–1174. [Google Scholar] [CrossRef]
- Bjorck, I.; Elmstahl, H.L. The glycaemic index: Importance of dietary fibre and other food properties. Proc. Nutr. Soc. 2003, 62, 201–206. [Google Scholar]
- Jenkins, D.J.; Jenkins, A.L. Dietary fiber and the glycemic response. Proc. Soc. Exp. Biol. Med. 1985, 180, 422–431. [Google Scholar] [CrossRef]
- Ludwig, D.S.; Hu, F.B.; Tappy, L.; Brand-Miller, J. Dietary carbohydrates: Role of quality and quantity in chronic disease. BMJ 2018, 361, k2340. [Google Scholar] [CrossRef] [Green Version]
- Andersson, A.; Tengblad, S.; Karlström, B.; Kamal-Eldin, A.; Landberg, R.; Basu, S.; Aman, P.; Vessby, B. Whole-grain foods do not affect insulin sensitivity or markers of lipid peroxidation and inflammation in healthy, moderately overweight subjects. J. Nutr. 2007, 137, 1401–1407. [Google Scholar] [CrossRef]
- Petitot, M.; Abecassis, J.; Micard, V. Structuring of pasta components during processing: Impact on starch and protein digestibility and allergenicity. Trends Food Sci. Technol. 2009, 20, 521–532. [Google Scholar] [CrossRef]
- Statista. Available online: https://www.statista.com/outlook/40060100/101/pasta/asia (accessed on 4 January 2021).

| Carbohydrate | Fibre | Fat | Protein | |
|---|---|---|---|---|
| Semolina Spaghetti | 71.2 | 3.0 | 2.0 | 12.5 |
| Wholegrain Spaghetti | 65.7 | 6.5 | 2.5 | 13.0 |
| Mee Pok | 54.1 | 1.4 | 1.1 | 10.1 |
| White rice | 79.7 | 0.5 | 0.7 | 6.7 |
| Semolina Spaghetti | 71 g of spaghetti 1 L of water 7 g of salt | Boil 1 L of water with 7 g of salt. When boiling add 1 portion of spaghetti and boil for 8 min. Drain and consumed immediately. |
| Wholegrain Spaghetti | 76 g of spaghetti 1 L of water 7 g of salt | Boil 1 L of water with 7 g of salt. When boiling add 1 portion of spaghetti and boil for 8 min. Drain and consumed immediately. |
| Mee pok noodles | 92.4 g of noodles 1 L of water | Boil 1 L of water. When boiling, add 1 portion of noodles and cook for 45 s. Drain and consumed immediately. |
| White Rice | 63 g of rice 150 mL of water | Cook rice with water in rice cooker. |
| (Mean ± S.D.) | |
|---|---|
| Age (years) | 26.4 ± 5.4 |
| Height (cm) | 172.6 ± 9.9 |
| Weight (kg) | 68.0 ± 12.0 |
| BMI (kg/m) | 22.6 ± 2.1 |
| Body Fat % | 24.7 ± 7.2 |
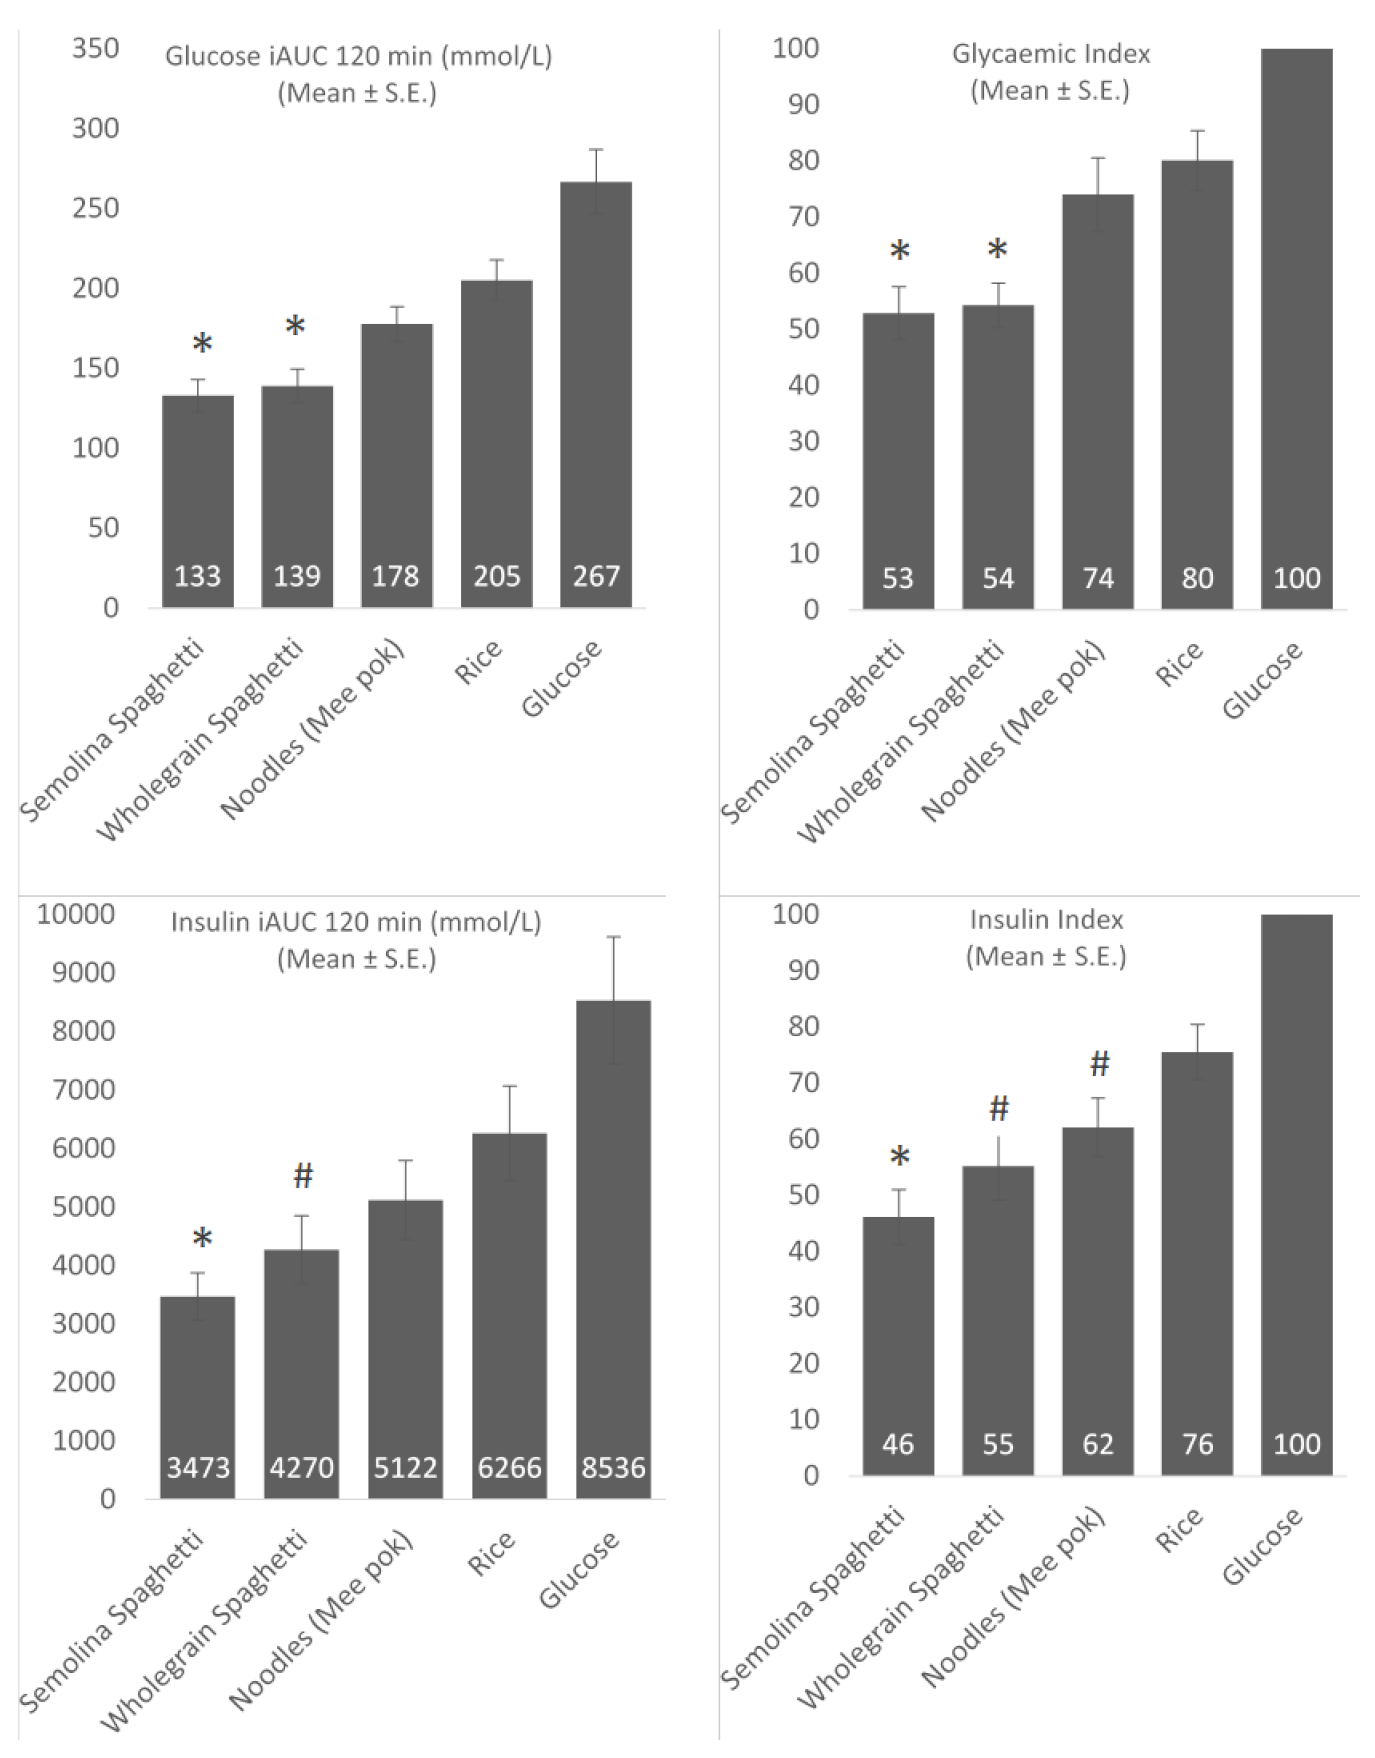
| GI (Mean ± S.D.) | GI (Median) | II (Mean ± S.D.) | II (Median) | Liking | |
|---|---|---|---|---|---|
| Semolina Spaghetti | 52.9 ± 24.0 | 53.1 | 46.0 ± 25.4 | 42.5 | 54.3 ± 23.9 |
| Wholegrain Spaghetti | 54.3 ± 21.9 | 51.4 | 55.1 ± 31.5 | 45.7 | 51.5 ± 26.1 |
| Noodles (Mee pok) | 74.0 ± 31.3 | 64.7 | 61.5 ± 24.0 | 57.8 | 46.2 ± 27.8 |
| Rice | 80.1 ± 25.8 | 78.9 | 75.0 ± 23.8 | 71.4 | 45.9 ± 25.3 |
Publisher’s Note: MDPI stays neutral with regard to jurisdictional claims in published maps and institutional affiliations. |
© 2021 by the authors. Licensee MDPI, Basel, Switzerland. This article is an open access article distributed under the terms and conditions of the Creative Commons Attribution (CC BY) license (http://creativecommons.org/licenses/by/4.0/).
Share and Cite
Camps, S.G.; Lim, J.; Koh, M.X.N.; Henry, C.J. The Glycaemic and Insulinaemic Response of Pasta in Chinese and Indians Compared to Asian Carbohydrate Staples: Taking Spaghetti Back to Asia. Nutrients 2021, 13, 451. https://doi.org/10.3390/nu13020451
Camps SG, Lim J, Koh MXN, Henry CJ. The Glycaemic and Insulinaemic Response of Pasta in Chinese and Indians Compared to Asian Carbohydrate Staples: Taking Spaghetti Back to Asia. Nutrients. 2021; 13(2):451. https://doi.org/10.3390/nu13020451
Chicago/Turabian StyleCamps, Stefan Gerardus, Joseph Lim, Melvin Xu Nian Koh, and Christiani Jeyakumar Henry. 2021. "The Glycaemic and Insulinaemic Response of Pasta in Chinese and Indians Compared to Asian Carbohydrate Staples: Taking Spaghetti Back to Asia" Nutrients 13, no. 2: 451. https://doi.org/10.3390/nu13020451