
Sexually Dimorphic Effects of a Western Diet on Brain Mitochondrial Bioenergetics and Neurocognitive Function

 , and
, and 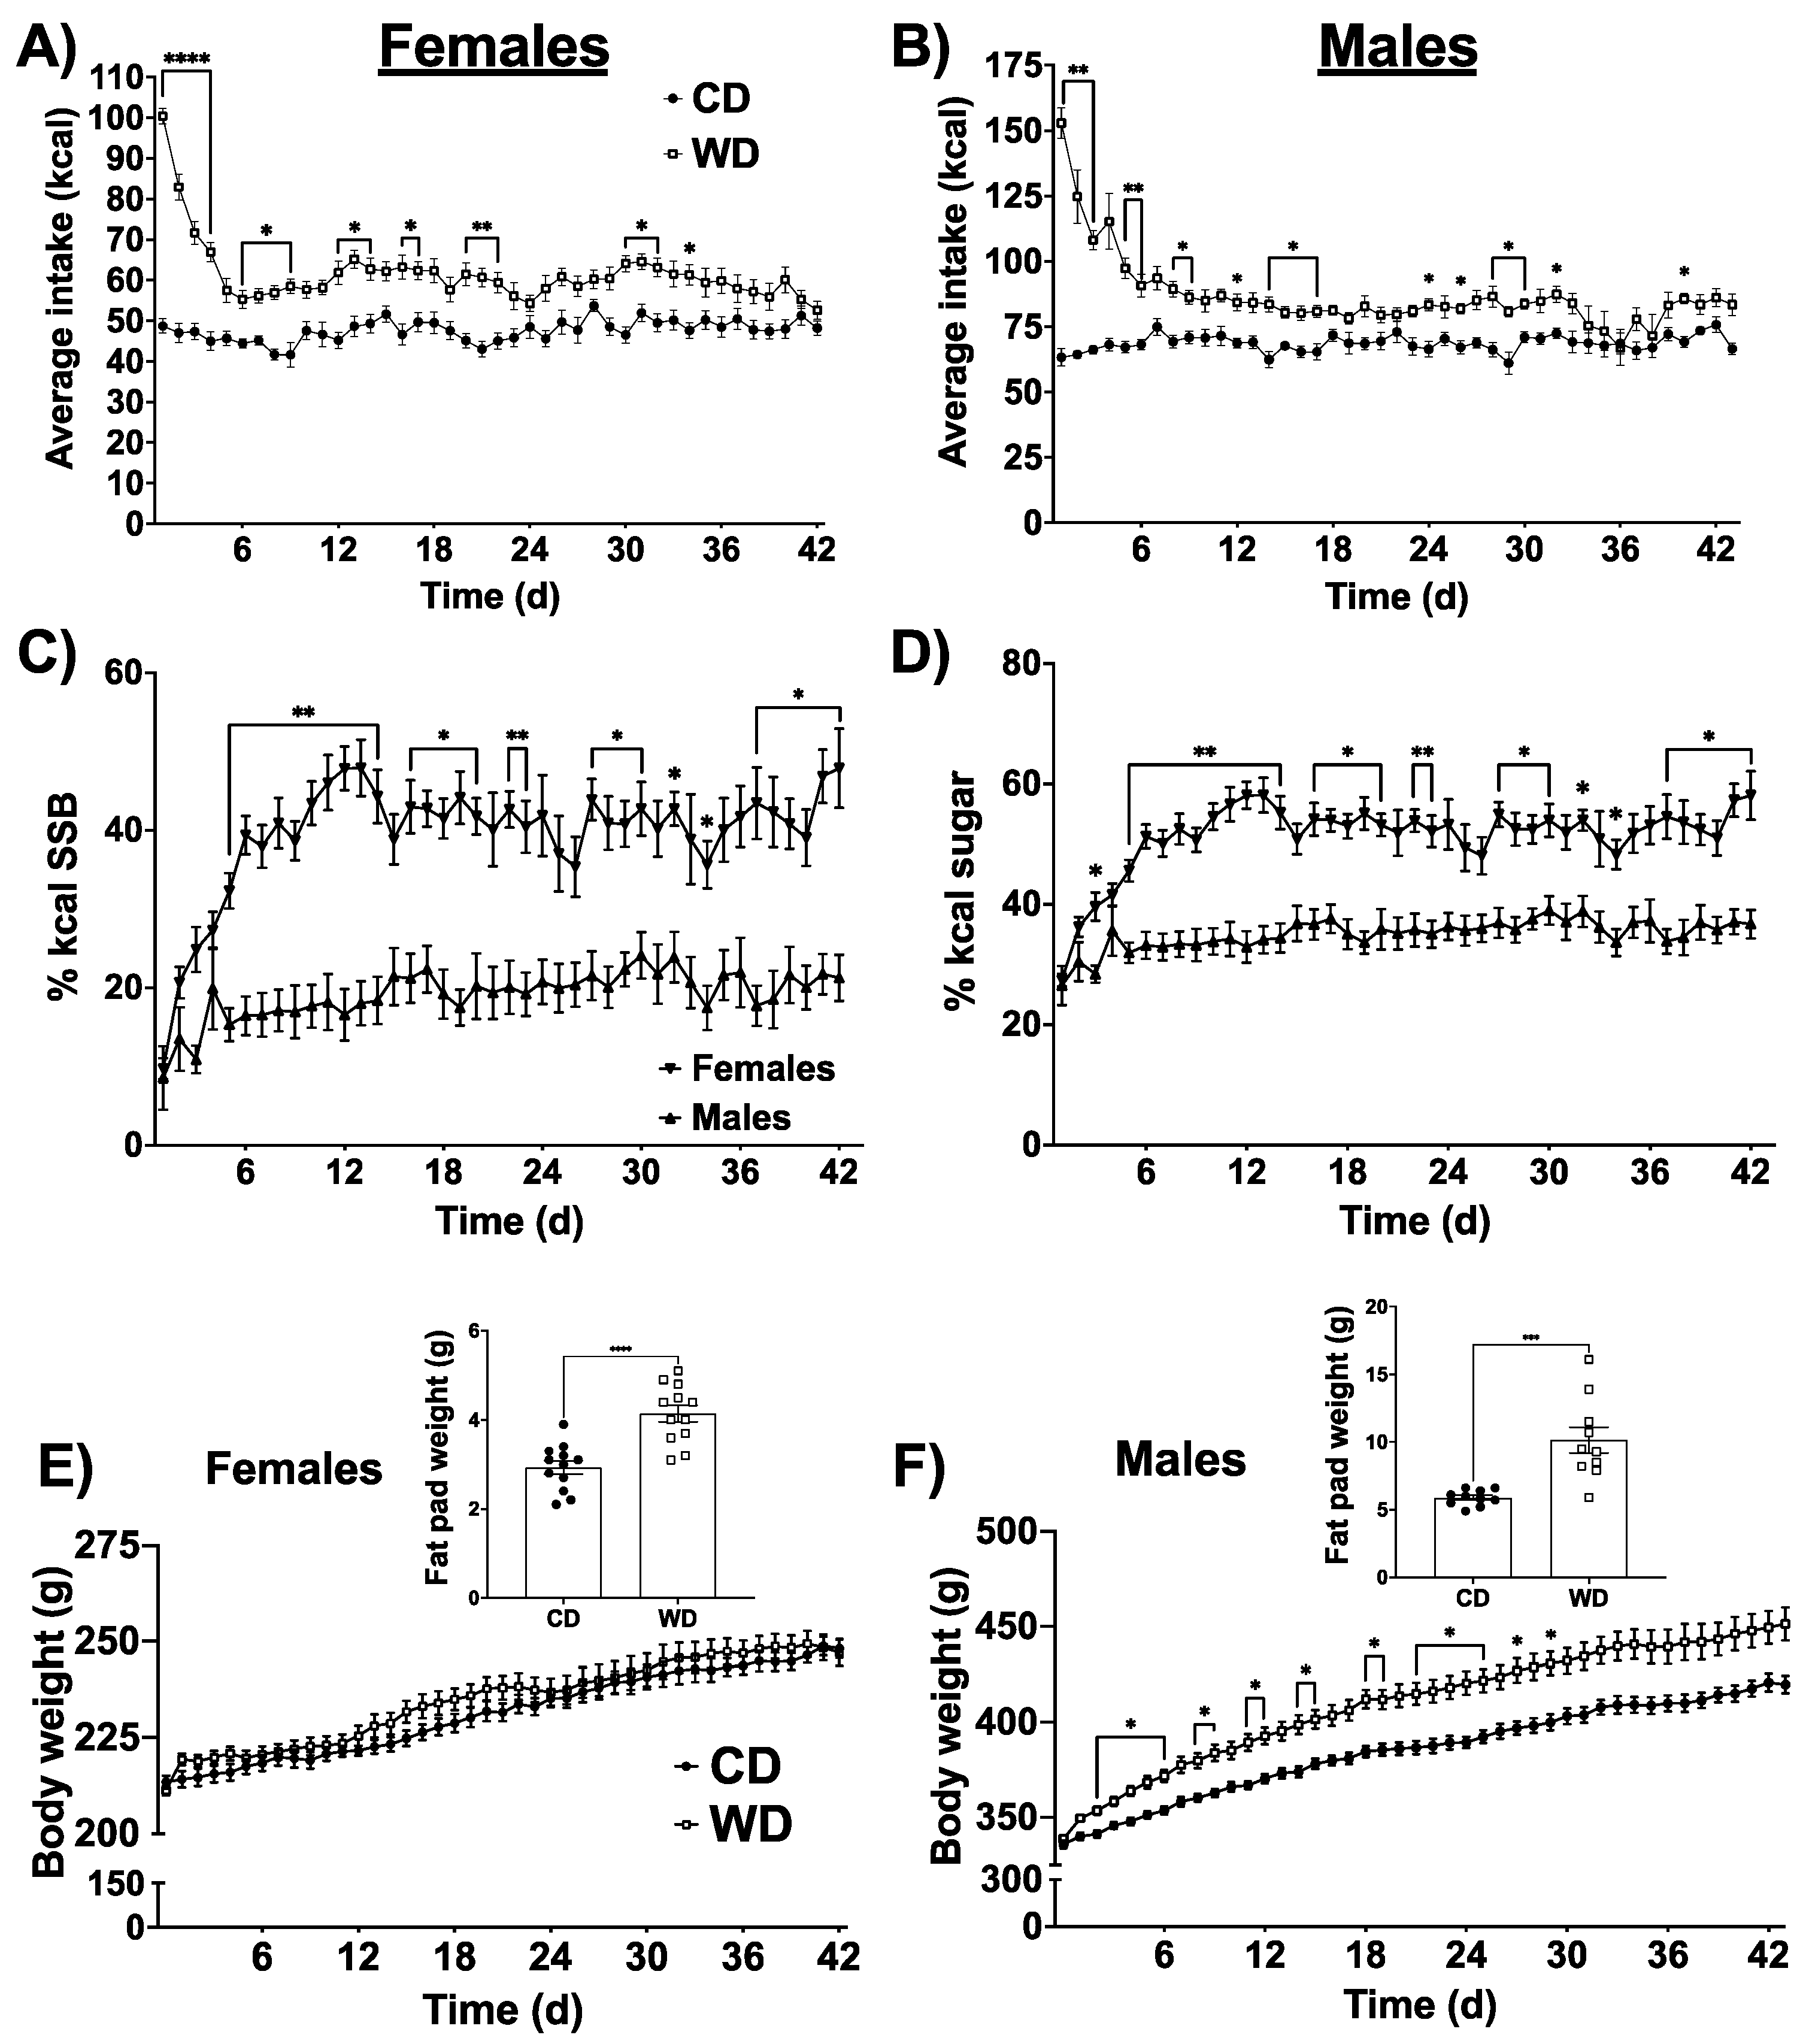
Abstract
1. Introduction
2. Materials and Methods
2.1. Subjects
2.2. Diet Protocol
2.3. Intraperitoneal Glucose Tolerance Test
2.4. Behavioral Testing and Experimental Timeline
2.5. Anxiety-like Behavior
2.6. Novel Location Recognition Task
2.7. Tissue Collection
2.8. Quantification of Liver Fat
2.9. Mitochondrial Respiration (JO2) Control
2.10. Mitochondrial Membrane Potential (∆ψm) and NAD(P)H/NAD(P)+ Redox States Assays
2.11. Citrate Synthase Activity
2.12. Stain-Free Western Blotting
2.13. Statistical Analyses
3. Results
3.1. Food Intake, Body Weight, and Sex Differences in Selection of Calories from Saturated Fat and HFCS Beverage
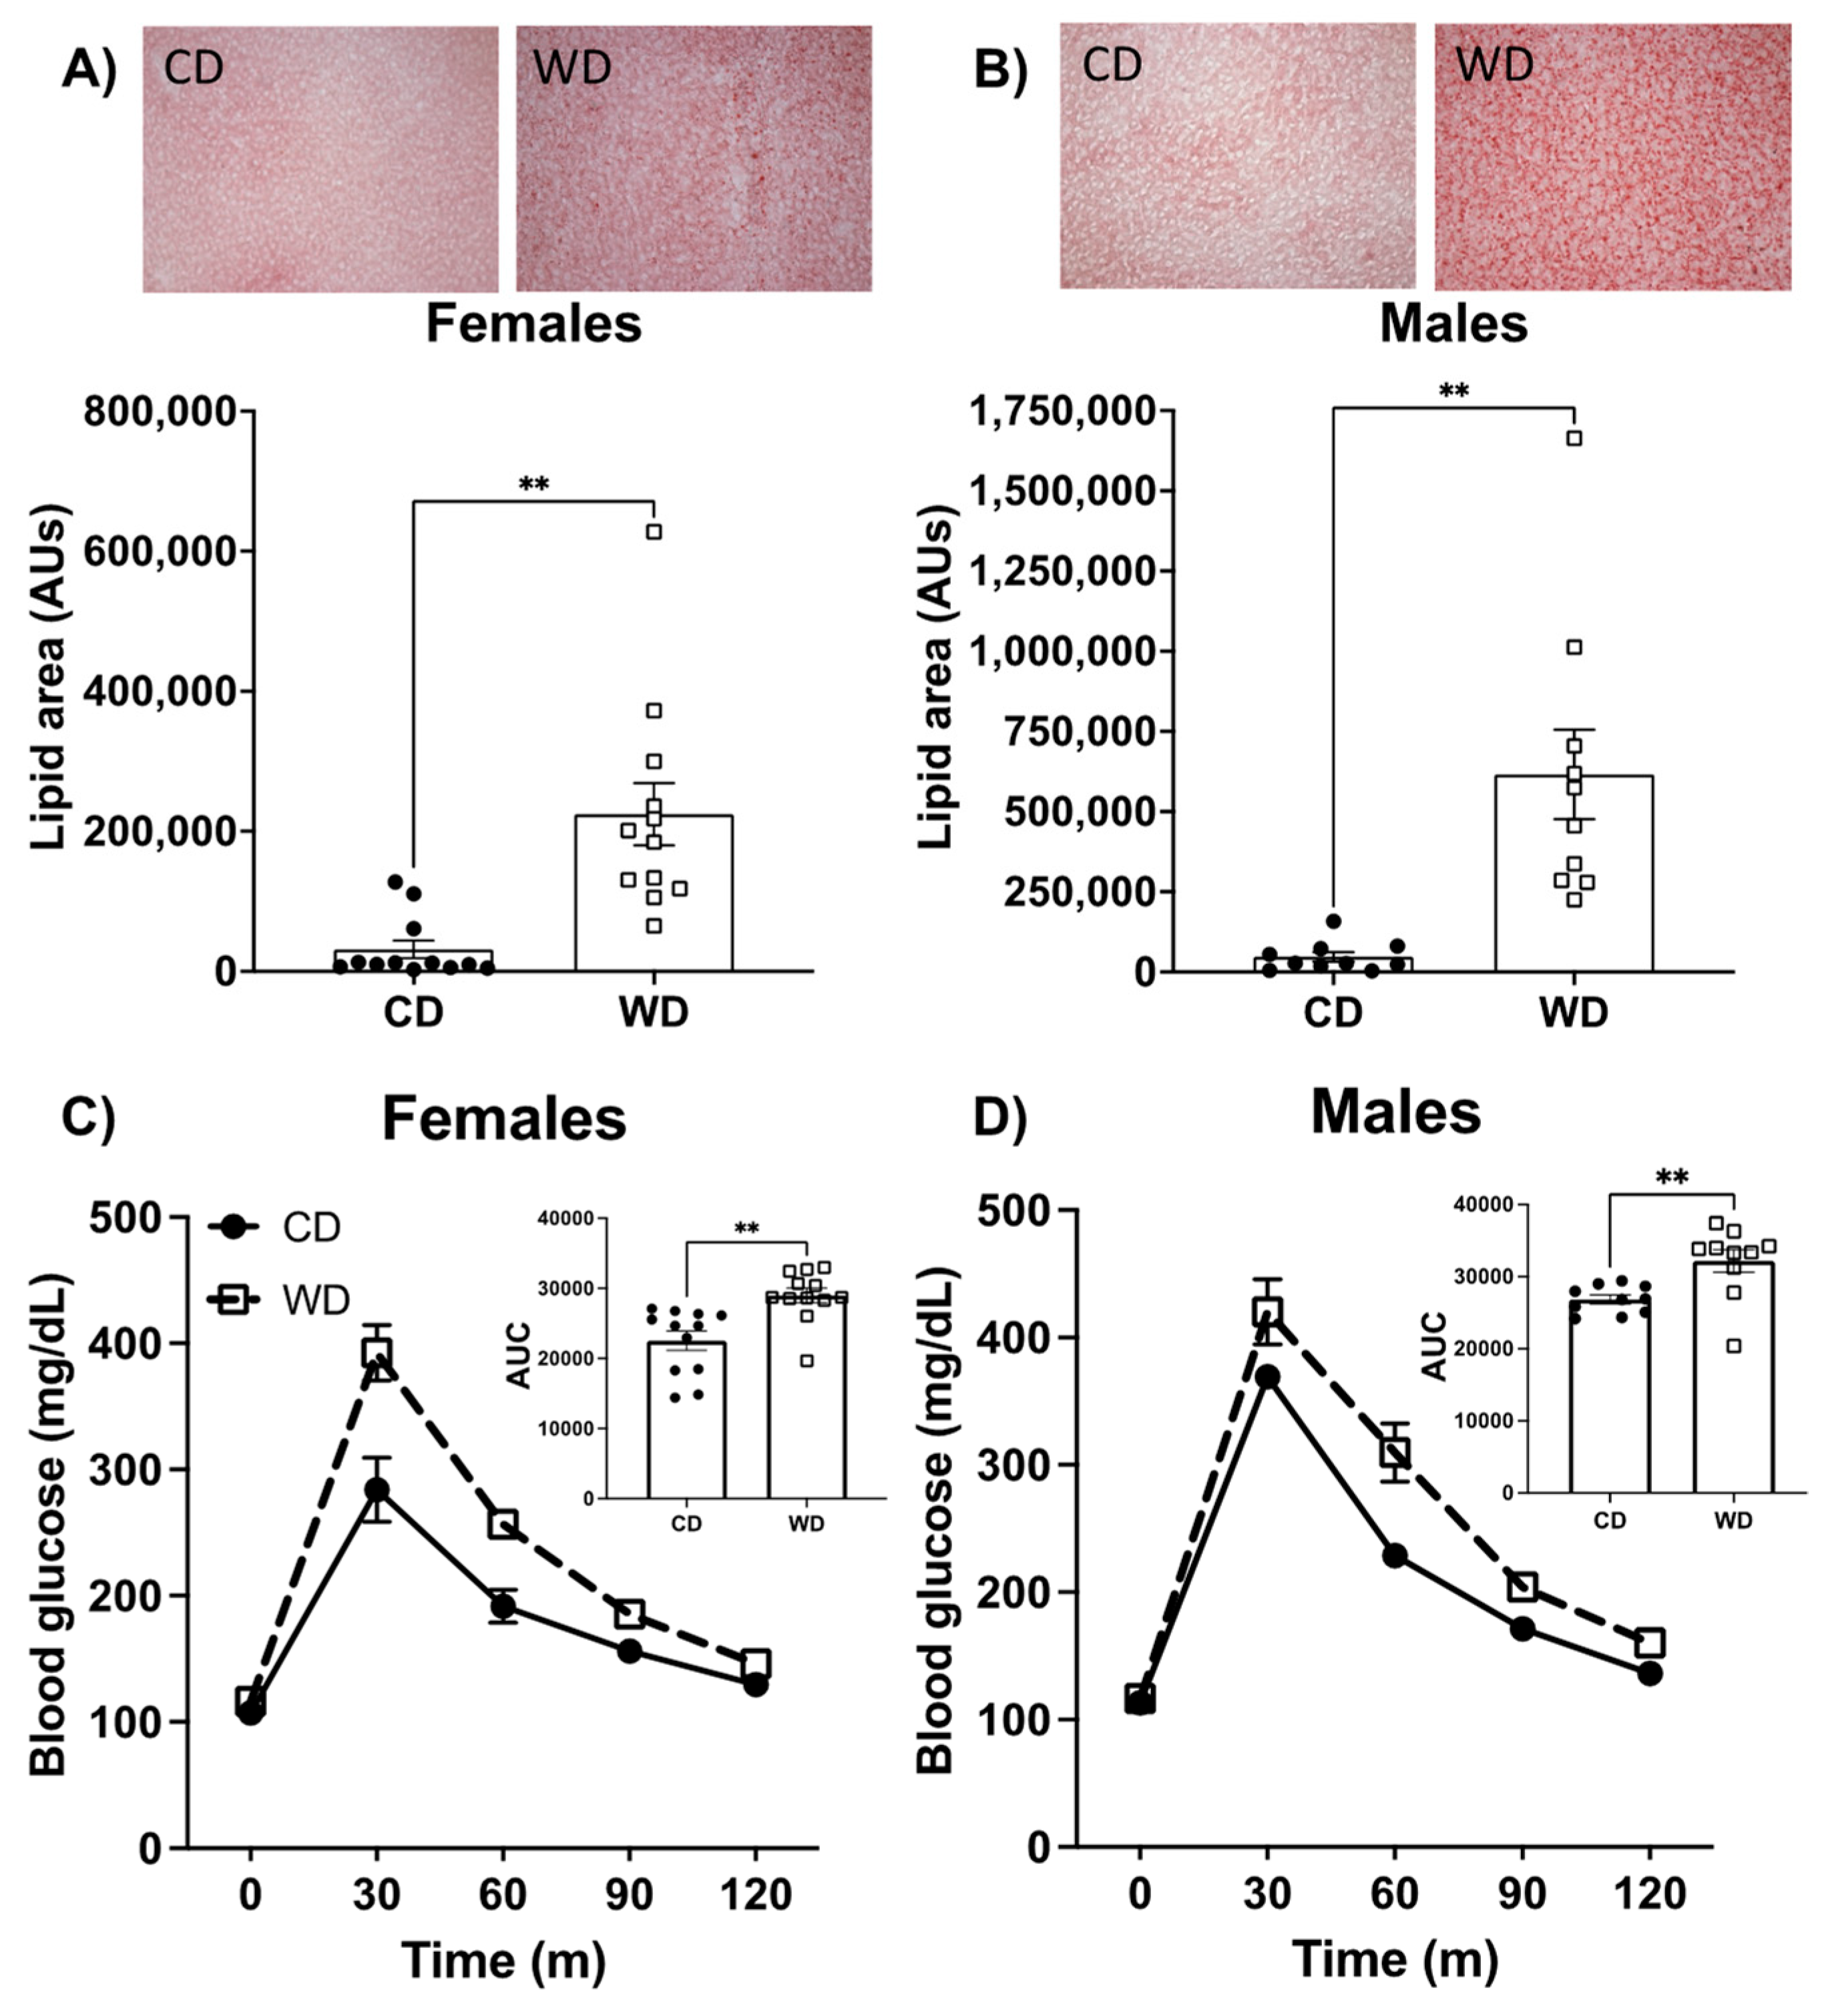
3.2. Consumption of the WD Negatively Impacts Glucose Metabolism and Elevates Liver Fat Content in Males and Females
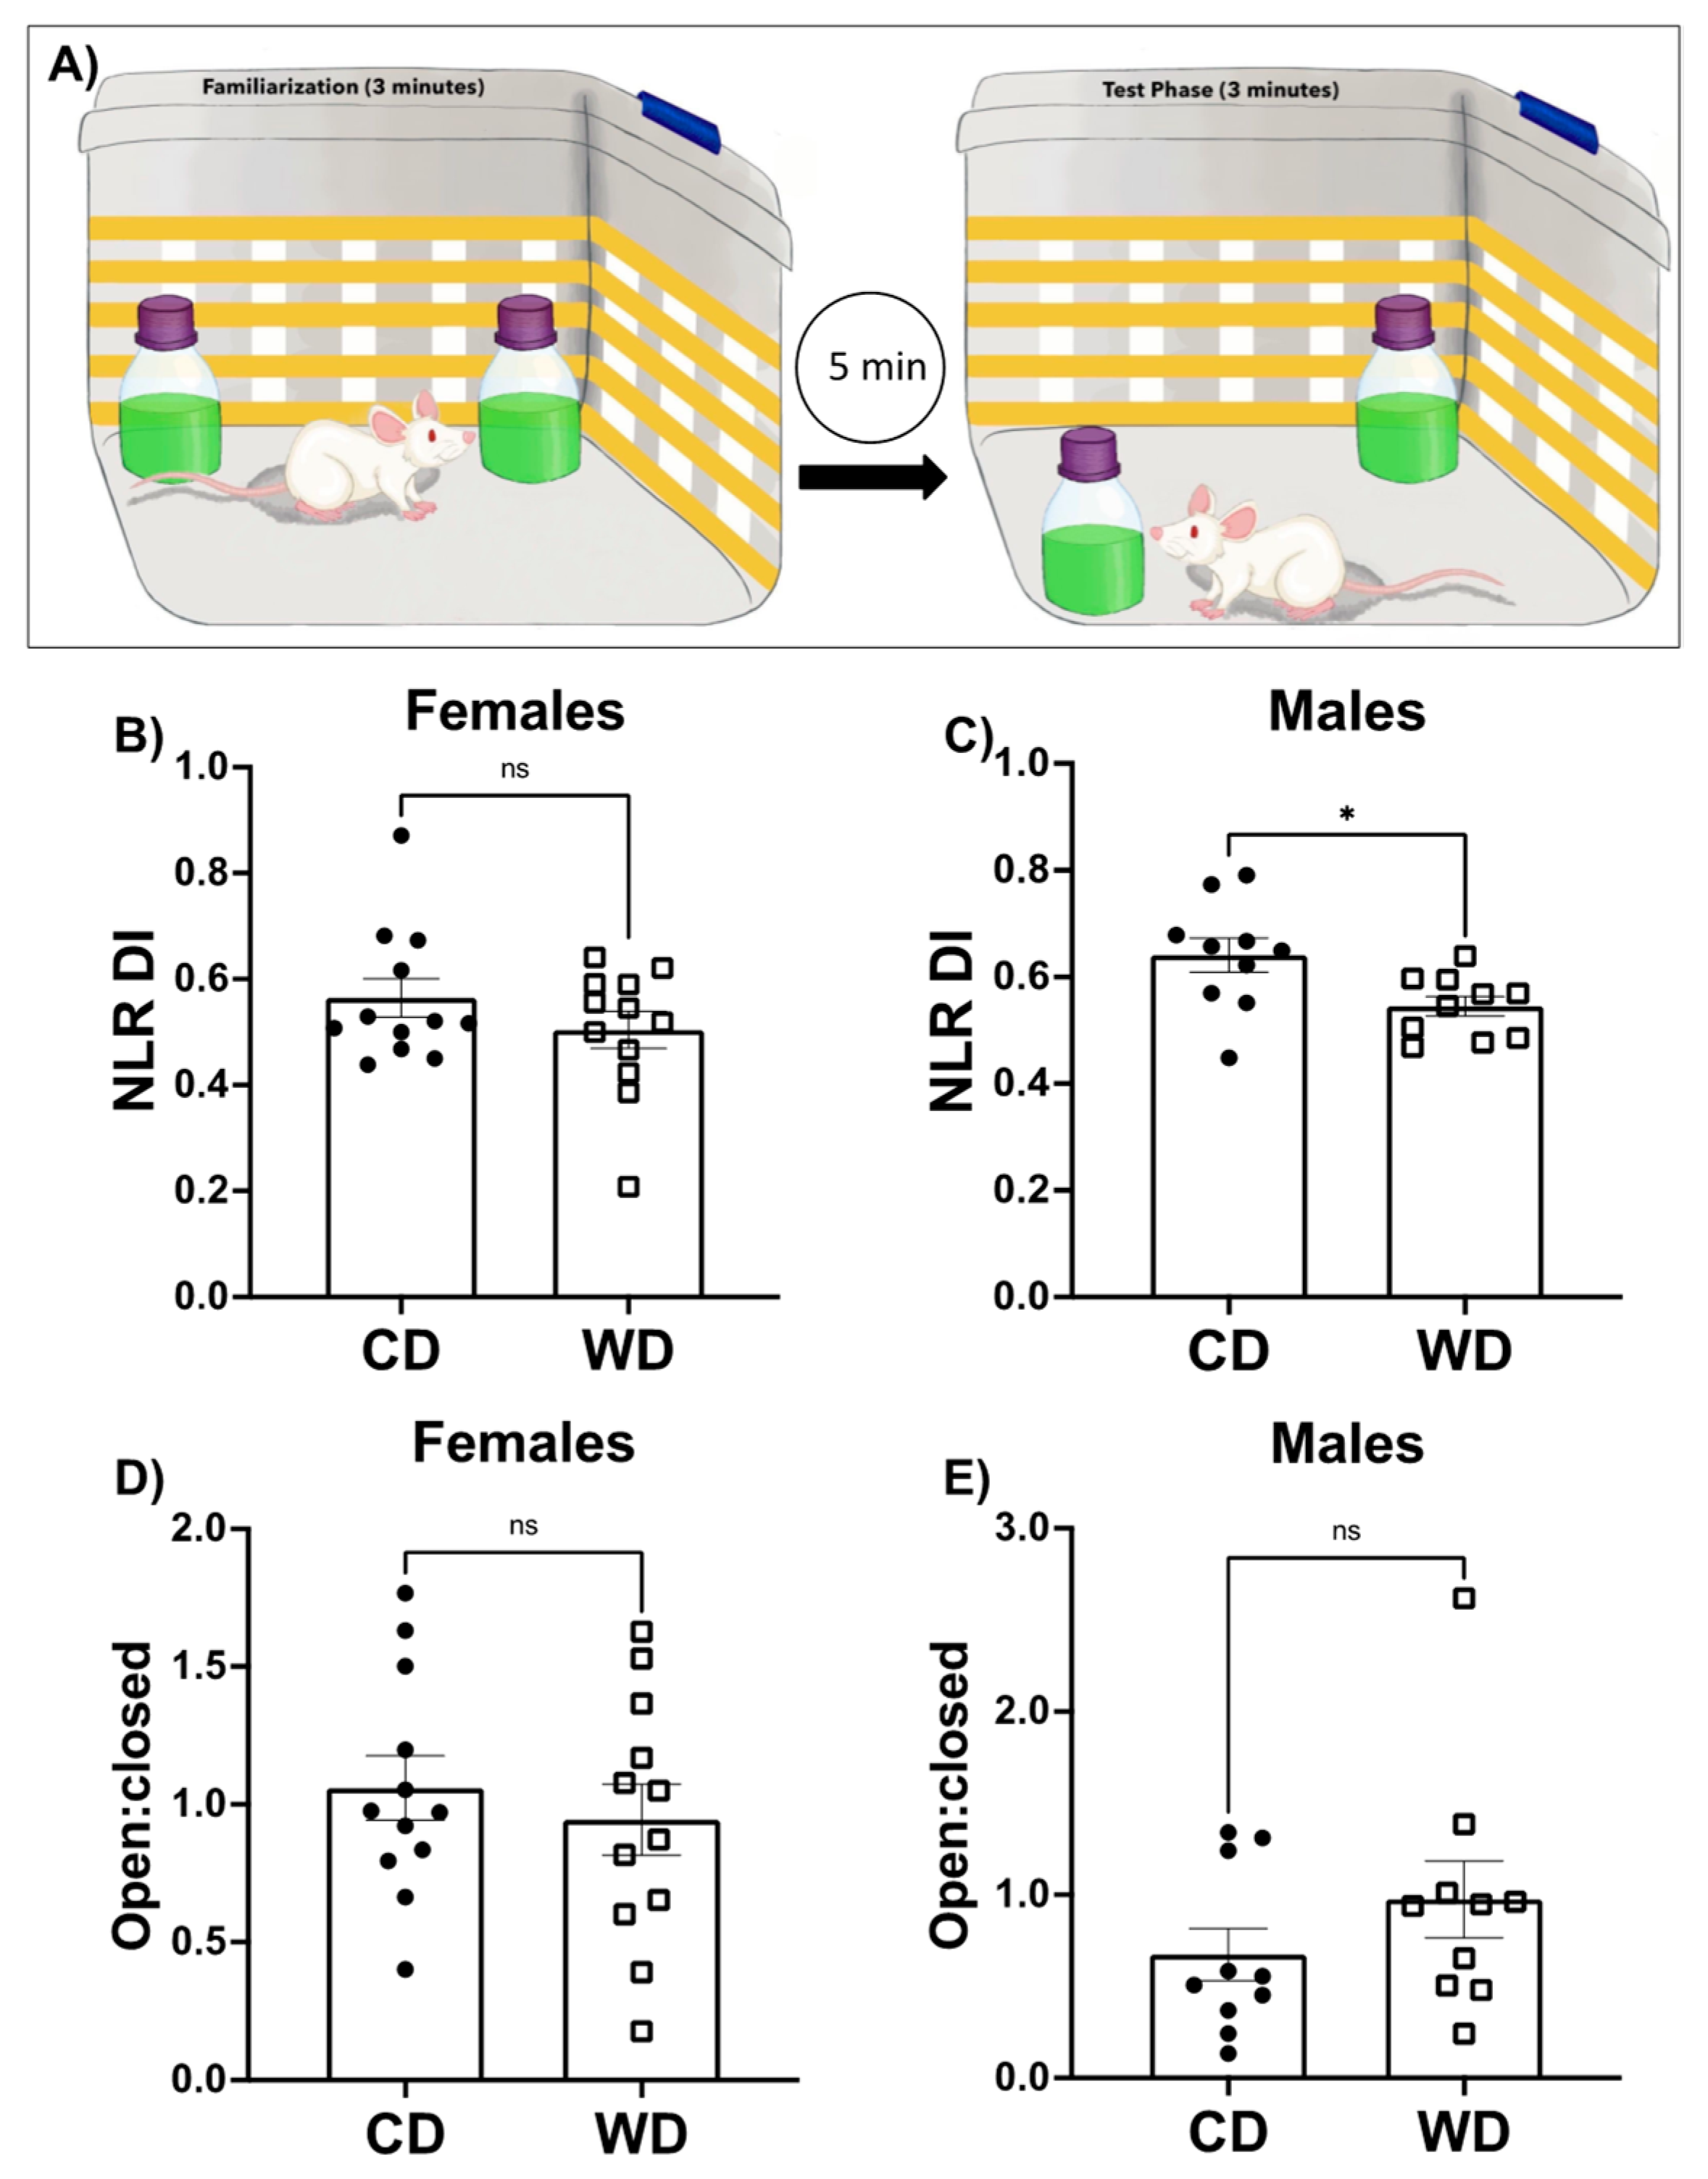
3.3. Consumption of a WD Impairs Hippocampal-Dependent Learning and Memory in Male Rats and Has No Effect on Anxiety-like Behavior
3.4. Rationale for Bioenergetics Approach
3.5. Validation of Mitochondrial Bioenergetics Technique in Brain Tissue
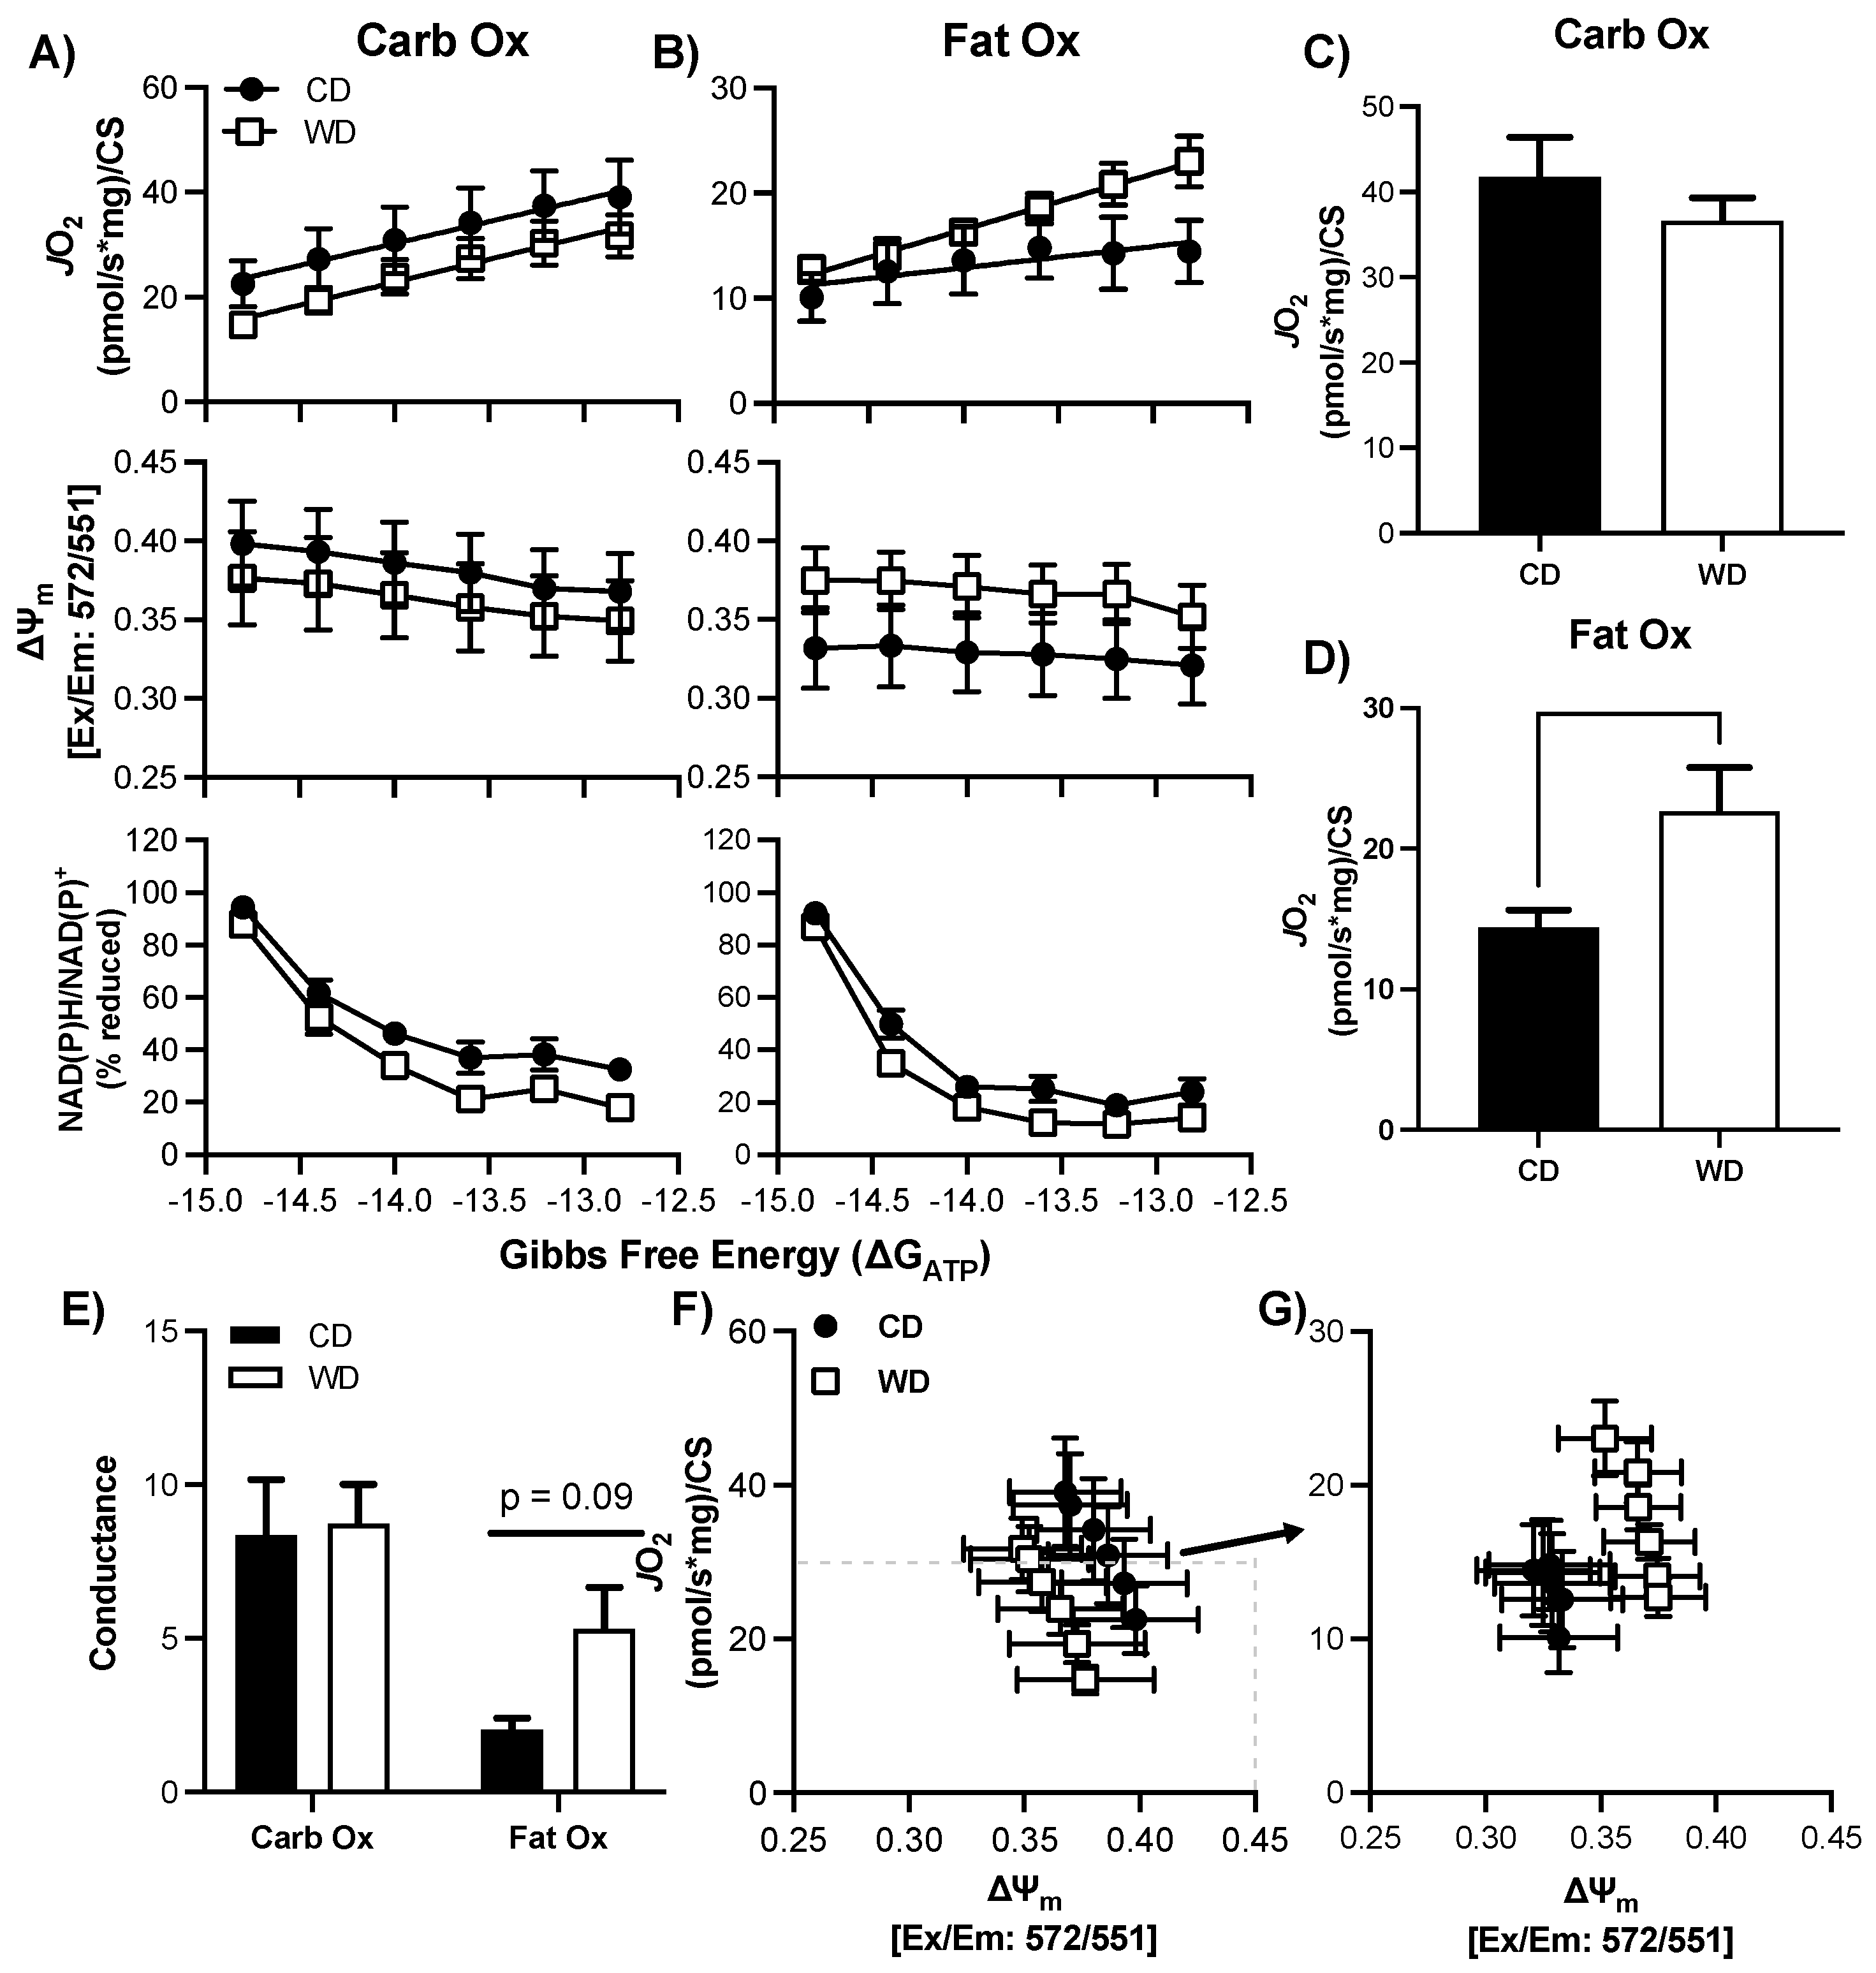
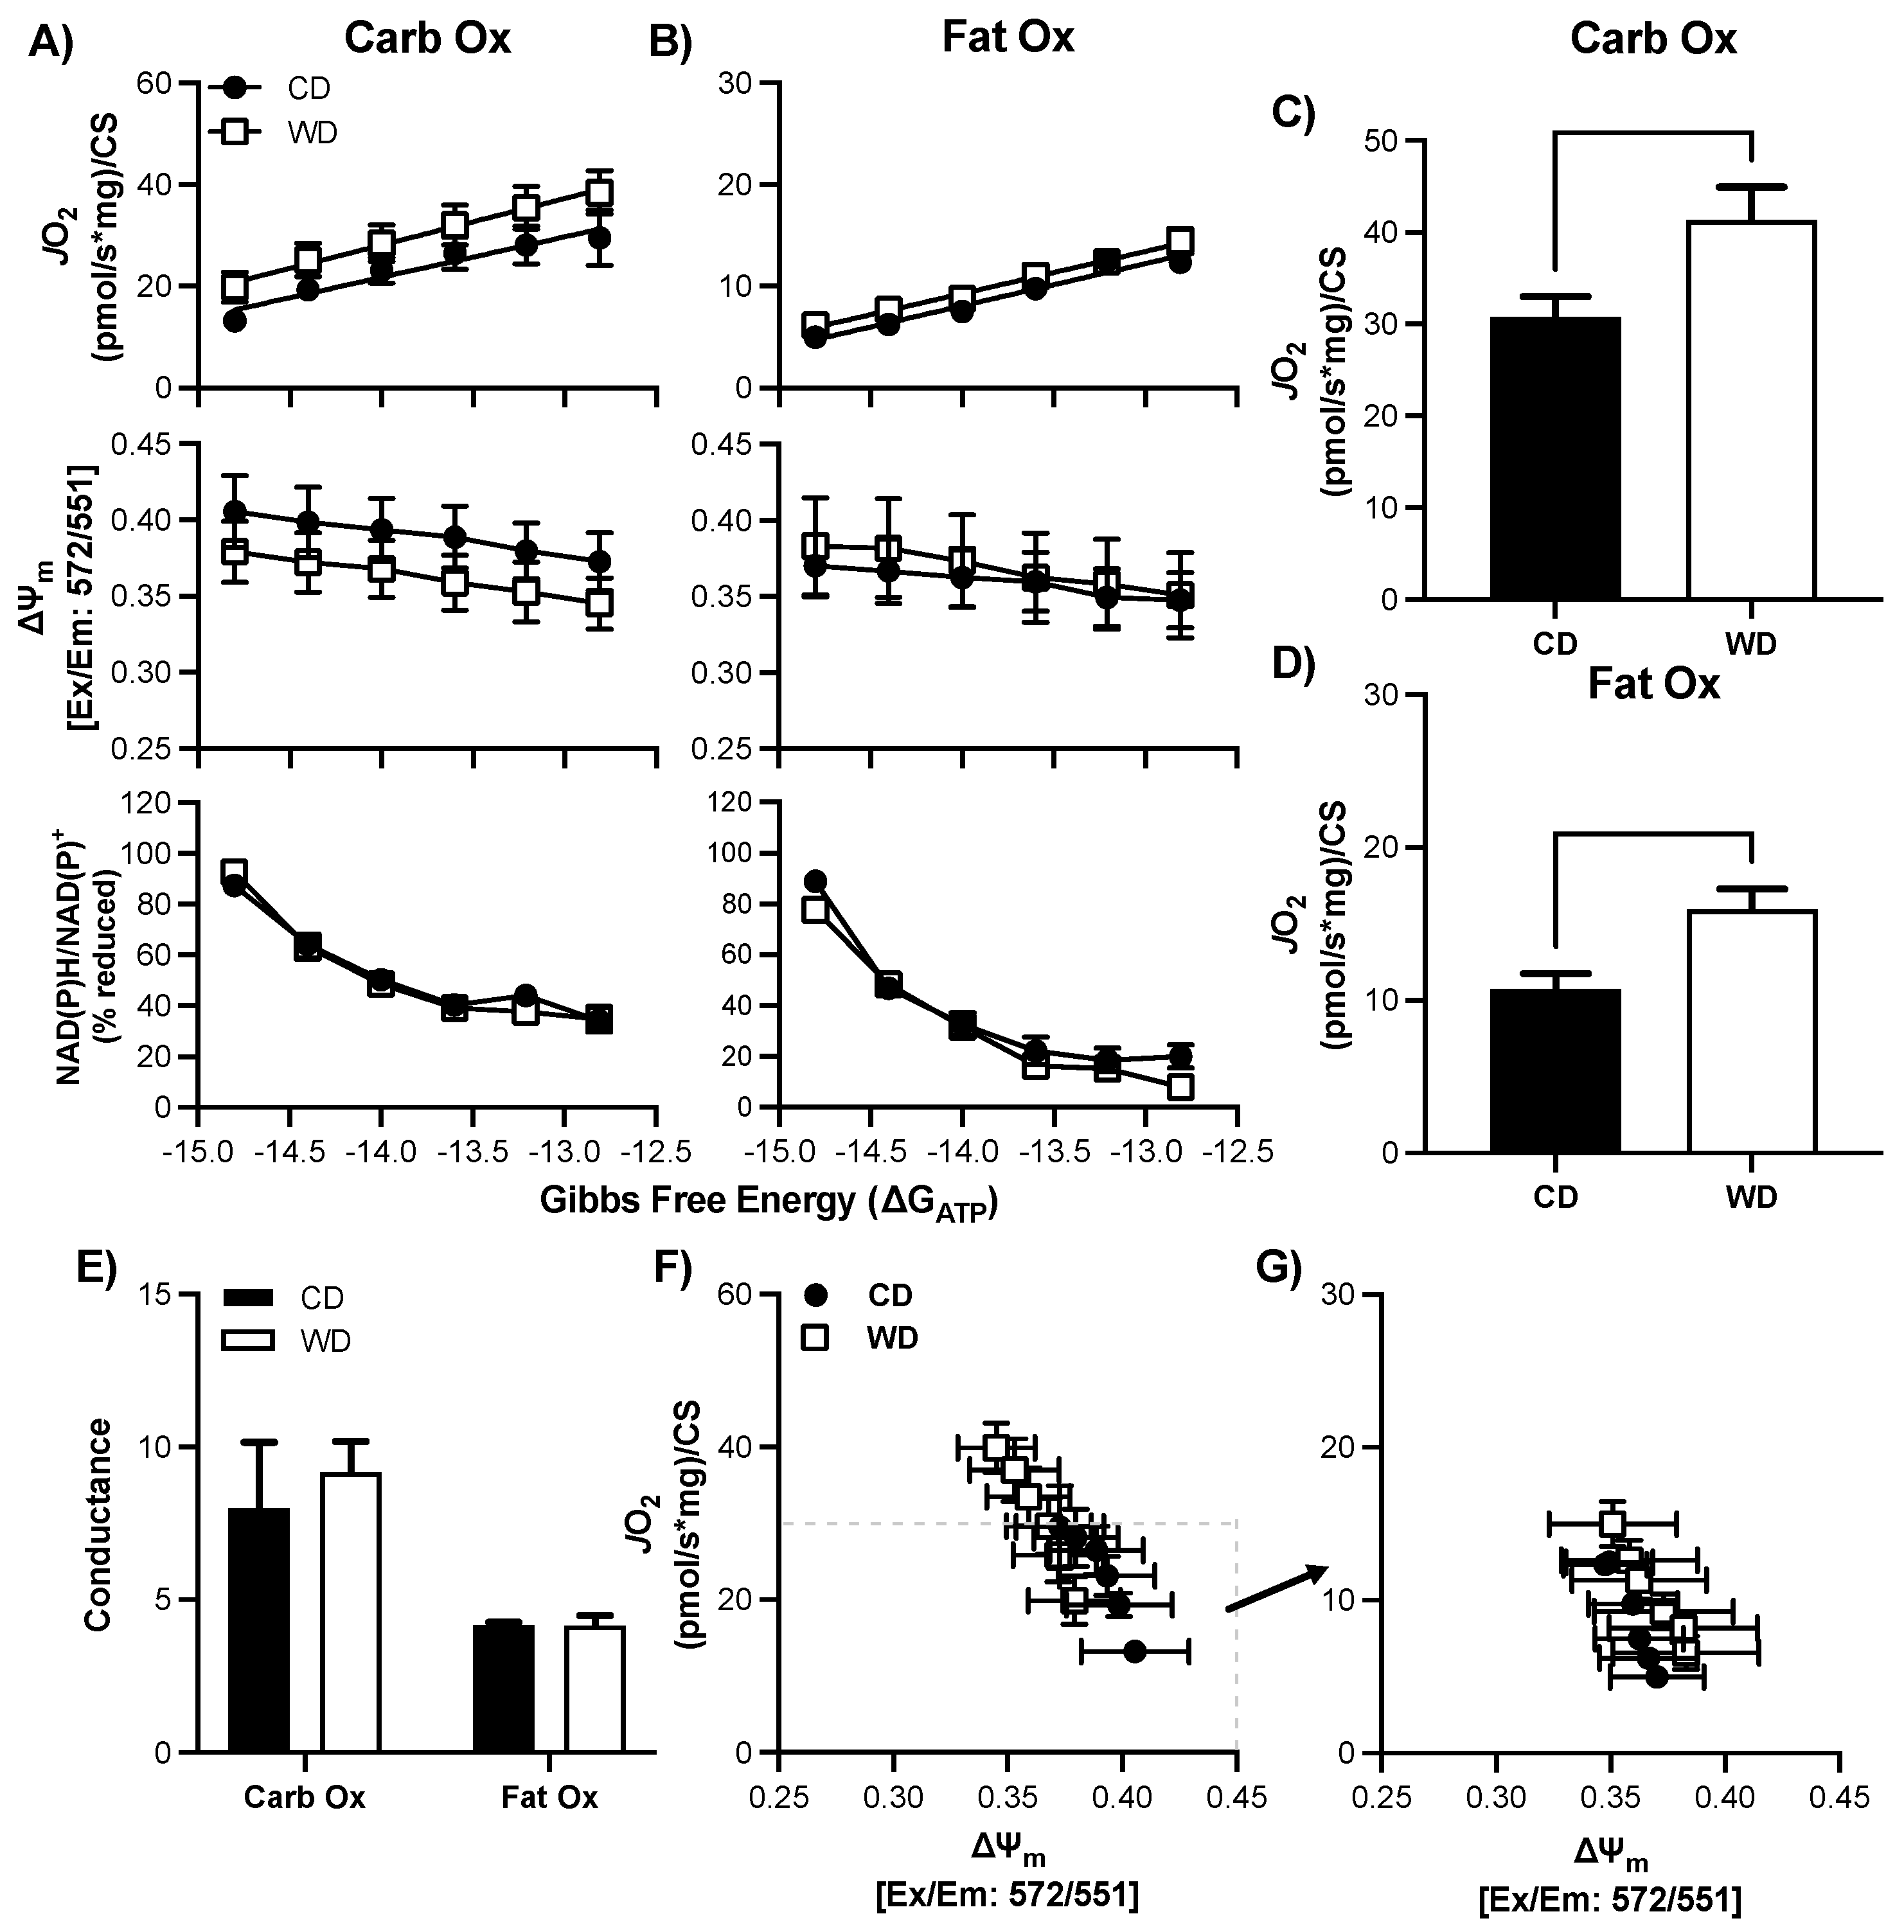
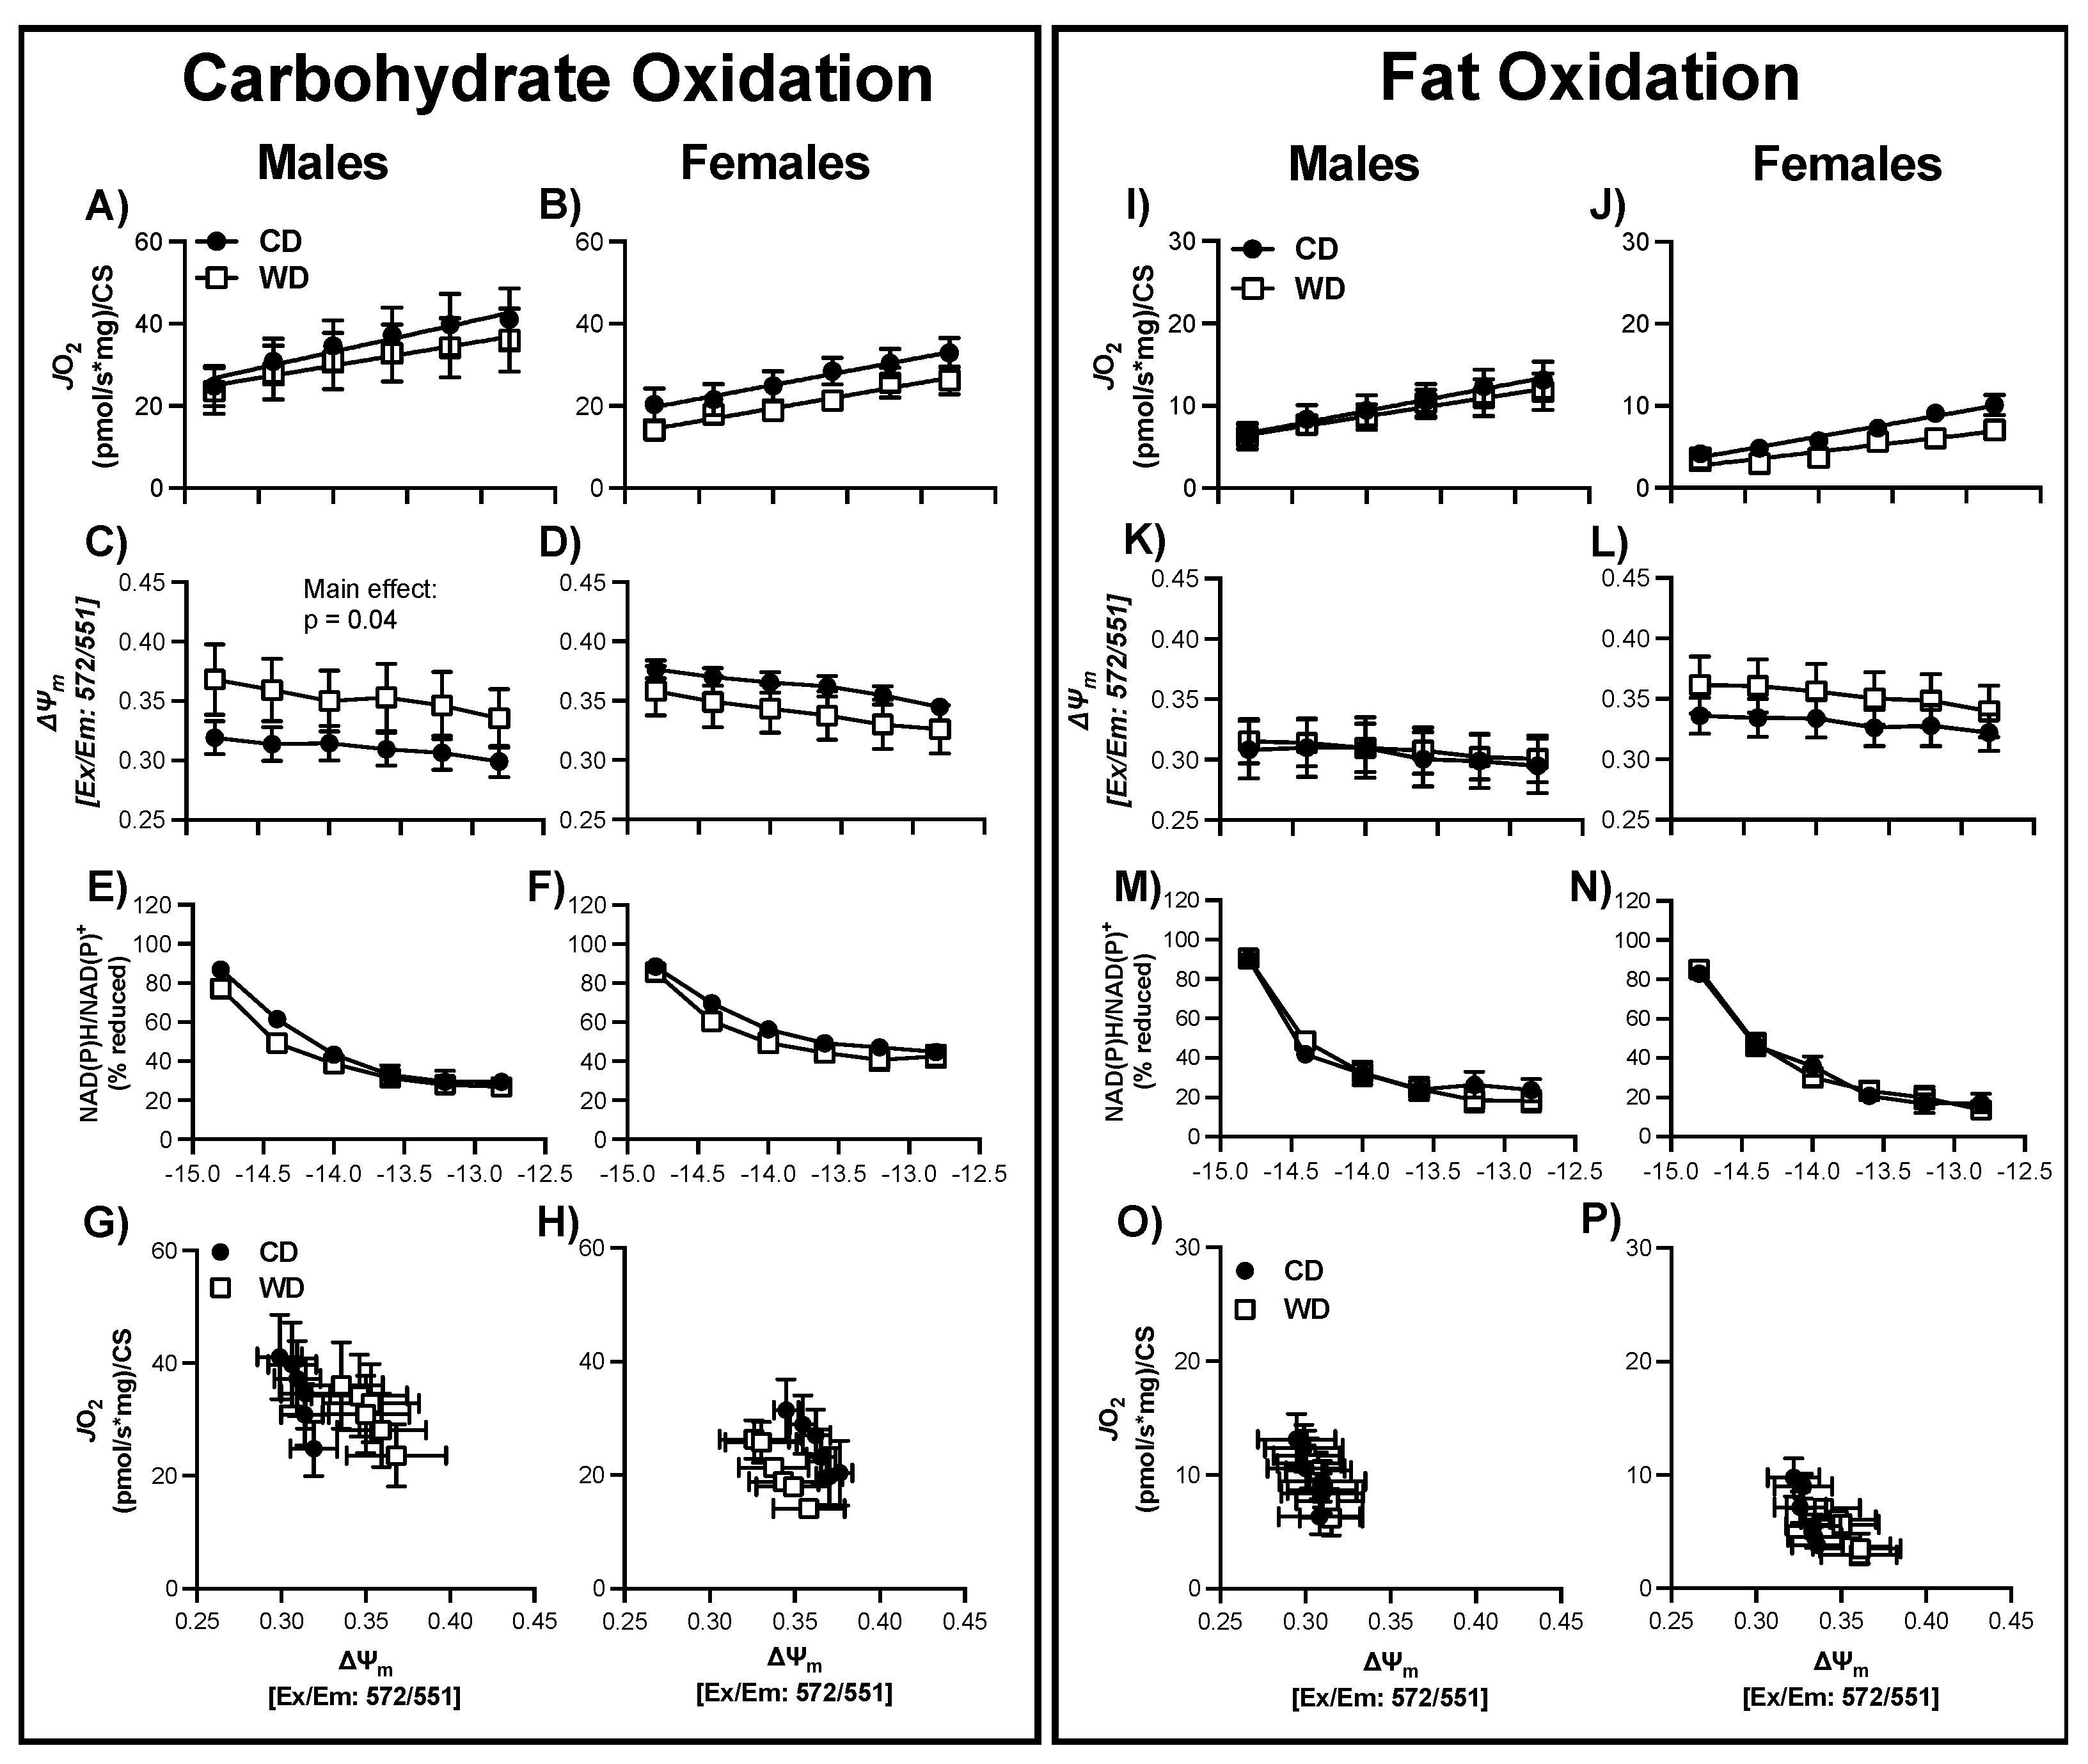
3.6. Consumption of a WD Alters Hypothalamic Mitochondrial Bioenergetics in Males
3.7. Consumption of a WD Alters Hypothalamic Mitochondrial Maximal Respiration in Females
3.8. Consumption of a WD Alters Hippocampal Mitochondrial Membrane Potential in Males during CarbOx
3.9. WD Consumption Does Not Alter Uncoupling Protein-2, Oxidative Phosphorylation Enzymes, or Reactive Oxygen Species
4. Discussion
5. Conclusions
Supplementary Materials
Author Contributions
Funding
Institutional Review Board Statement
Informed Consent Statement
Data Availability Statement
Acknowledgments
Conflicts of Interest
References
- Imamura, F.; Micha, R.; Khatibzadeh, S.; Fahimi, S.; Shi, P.; Powles, J.; Mozaffarian, D.; Global Burden of Diseases, N.; Chronic Diseases Expert, G. Dietary quality among men and women in 187 countries in 1990 and 2010: A systematic assessment. Lancet Glob. Health 2015, 3, e132–e142. [Google Scholar] [CrossRef]
- Francis, H.; Stevenson, R. The longer-term impacts of Western diet on human cognition and the brain. Appetite 2013, 63, 119–128. [Google Scholar] [CrossRef]
- Davidson, T.L.; Monnot, A.; Neal, A.U.; Martin, A.A.; Horton, J.J.; Zheng, W. The effects of a high-energy diet on hippocampal-dependent discrimination performance and blood-brain barrier integrity differ for diet-induced obese and diet-resistant rats. Physiol. Behav. 2012, 107, 26–33. [Google Scholar] [CrossRef]
- Hsu, T.M.; Konanur, V.R.; Taing, L.; Usui, R.; Kayser, B.D.; Goran, M.I.; Kanoski, S.E. Effects of sucrose and high fructose corn syrup consumption on spatial memory function and hippocampal neuroinflammation in adolescent rats. Hippocampus 2015, 25, 227–239. [Google Scholar] [CrossRef]
- Kanoski, S.E.; Davidson, T.L. Western diet consumption and cognitive impairment: Links to hippocampal dysfunction and obesity. Physiol. Behav. 2011, 103, 59–68. [Google Scholar] [CrossRef]
- Kanoski, S.E.; Meisel, R.L.; Mullins, A.J.; Davidson, T.L. The effects of energy-rich diets on discrimination reversal learning and on BDNF in the hippocampus and prefrontal cortex of the rat. Behav. Brain Res. 2007, 182, 57–66. [Google Scholar] [CrossRef]
- Kanoski, S.E.; Zhang, Y.; Zheng, W.; Davidson, T.L. The effects of a high-energy diet on hippocampal function and blood-brain barrier integrity in the rat. J. Alzheimers Dis. 2010, 21, 207–219. [Google Scholar] [CrossRef]
- Noble, E.E.; Kanoski, S.E. Early life exposure to obesogenic diets and learning and memory dysfunction. Curr. Opin. Behav. Sci. 2016, 9, 7–14. [Google Scholar] [CrossRef]
- Noble, E.E.; Mavanji, V.; Little, M.R.; Billington, C.J.; Kotz, C.M.; Wang, C. Exercise reduces diet-induced cognitive decline and increases hippocampal brain-derived neurotrophic factor in CA3 neurons. Neurobiol. Learn. Mem. 2014, 114, 40–50. [Google Scholar] [CrossRef]
- Molteni, R.; Barnard, R.J.; Ying, Z.; Roberts, C.K.; Gomez-Pinilla, F. A high-fat, refined sugar diet reduces hippocampal brain-derived neurotrophic factor, neuronal plasticity, and learning. Neuroscience 2002, 112, 803–814. [Google Scholar] [CrossRef]
- Molteni, R.; Wu, A.; Vaynman, S.; Ying, Z.; Barnard, R.J.; Gomez-Pinilla, F. Exercise reverses the harmful effects of consumption of a high-fat diet on synaptic and behavioral plasticity associated to the action of brain-derived neurotrophic factor. Neuroscience 2004, 123, 429–440. [Google Scholar] [CrossRef]
- Beilharz, J.E.; Kaakoush, N.O.; Maniam, J.; Morris, M.J. The effect of short-term exposure to energy-matched diets enriched in fat or sugar on memory, gut microbiota and markers of brain inflammation and plasticity. Brain Behav. Immun. 2016, 57, 304–313. [Google Scholar] [CrossRef]
- Beilharz, J.E.; Maniam, J.; Morris, M.J. Short exposure to a diet rich in both fat and sugar or sugar alone impairs place, but not object recognition memory in rats. Brain Behav. Immun. 2014, 37, 134–141. [Google Scholar] [CrossRef]
- Beilharz, J.E.; Maniam, J.; Morris, M.J. Short-term exposure to a diet high in fat and sugar, or liquid sugar, selectively impairs hippocampal-dependent memory, with differential impacts on inflammation. Behav Brain Res. 2016, 306, 1–7. [Google Scholar] [CrossRef]
- Baym, C.L.; Khan, N.A.; Monti, J.M.; Raine, L.B.; Drollette, E.S.; Moore, R.D.; Scudder, M.R.; Kramer, A.F.; Hillman, C.H.; Cohen, N.J. Dietary lipids are differentially associated with hippocampal-dependent relational memory in prepubescent children. Am. J. Clin. Nutr. 2014, 99, 1026–1032. [Google Scholar] [CrossRef]
- Khan, N.A.; Raine, L.B.; Drollette, E.S.; Scudder, M.R.; Hillman, C.H. The relation of saturated fats and dietary cholesterol to childhood cognitive flexibility. Appetite 2015, 93, 51–56. [Google Scholar] [CrossRef]
- Kanoski, S.E.; Grill, H.J. Hippocampus Contributions to Food Intake Control: Mnemonic, Neuroanatomical, and Endocrine Mechanisms. Biol. Psychiatry 2017, 81, 748–756. [Google Scholar] [CrossRef]
- Qin, S.; Sun, D.; Zhang, C.; Tang, Y.; Zhou, F.; Zheng, K.; Tang, R.; Zheng, Y. Downregulation of sonic hedgehog signaling in the hippocampus leads to neuronal apoptosis in high-fat diet-fed mice. Behav. Brain Res. 2019, 367, 91–100. [Google Scholar] [CrossRef]
- Beutler, L.R.; Corpuz, T.V.; Ahn, J.S.; Kosar, S.; Song, W.; Chen, Y.; Knight, Z.A. Obesity causes selective and long-lasting desensitization of AgRP neurons to dietary fat. Elife 2020, 9, e55909. [Google Scholar] [CrossRef]
- Li, M.M.; Madara, J.C.; Steger, J.S.; Krashes, M.J.; Balthasar, N.; Campbell, J.N.; Resch, J.M.; Conley, N.J.; Garfield, A.S.; Lowell, B.B. The Paraventricular Hypothalamus Regulates Satiety and Prevents Obesity via Two Genetically Distinct Circuits. Neuron 2019, 102, 653–667 e656. [Google Scholar] [CrossRef]
- Briggs, S.B.; Ware, C.B.; Sharma, K.; Davis, S.C.; Lalumiere, R.T.; Parent, M.B. Postmeal optogenetic inhibition of dorsal hippocampal principal neurons increases future intake in a time-dependent manner. Neurobiol. Learn. Mem. 2021, 183, 107478. [Google Scholar] [CrossRef]
- Jones, S.; Luo, S.; Dorton, H.M.; Angelo, B.; Yunker, A.G.; Monterosso, J.R.; Page, K.A. Evidence of a Role for the Hippocampus in Food-Cue Processing and the Association with Body Weight and Dietary Added Sugar. Obes. Silver Spring 2021, 29, 370–378. [Google Scholar] [CrossRef]
- Suarez, A.N.; Liu, C.M.; Cortella, A.M.; Noble, E.E.; Kanoski, S.E. Ghrelin and Orexin Interact to Increase Meal Size Through a Descending Hippocampus to Hindbrain Signaling Pathway. Biol. Psychiatry 2020, 87, 1001–1011. [Google Scholar] [CrossRef]
- Slomp, M.; Belegri, E.; Blancas-Velazquez, A.S.; Diepenbroek, C.; Eggels, L.; Gumbs, M.C.R.; Joshi, A.; Koekkoek, L.L.; Lamuadni, K.; Ugur, M.; et al. Stressing the importance of choice: Validity of a preclinical free-choice high-caloric diet paradigm to model behavioural, physiological and molecular adaptations during human diet-induced obesity and metabolic dysfunction. J Neuroendocr. 2019, 31, e12718. [Google Scholar] [CrossRef]
- Hwang, L.L.; Wang, C.H.; Li, T.L.; Chang, S.D.; Lin, L.C.; Chen, C.P.; Chen, C.T.; Liang, K.C.; Ho, I.K.; Yang, W.S.; et al. Sex differences in high-fat diet-induced obesity, metabolic alterations and learning, and synaptic plasticity deficits in mice. Obes. Silver Spring 2010, 18, 463–469. [Google Scholar] [CrossRef]
- Arcones, A.C.; Cruces-Sande, M.; Ramos, P.; Mayor, F., Jr.; Murga, C. Sex Differences in High Fat Diet-Induced Metabolic Alterations Correlate with Changes in the Modulation of GRK2 Levels. Cells 2019, 8, 1464. [Google Scholar] [CrossRef]
- Ingvorsen, C.; Karp, N.A.; Lelliott, C.J. The role of sex and body weight on the metabolic effects of high-fat diet in C57BL/6N mice. Nutr. Diabetes 2017, 7, e261. [Google Scholar] [CrossRef]
- Amengual-Cladera, E.; Llado, I.; Gianotti, M.; Proenza, A.M. Sex differences in the effect of high-fat diet feeding on rat white adipose tissue mitochondrial function and insulin sensitivity. Metabolism 2012, 61, 1108–1117. [Google Scholar] [CrossRef]
- Han, R.; Liang, J.; Zhou, B. Glucose Metabolic Dysfunction in Neurodegenerative Diseases-New Mechanistic Insights and the Potential of Hypoxia as a Prospective Therapy Targeting Metabolic Reprogramming. Int. J. Mol. Sci. 2021, 22, 5887. [Google Scholar] [CrossRef]
- Joshi, A.U.; Mochly-Rosen, D. Mortal engines: Mitochondrial bioenergetics and dysfunction in neurodegenerative diseases. Pharm. Res. 2018, 138, 2–15. [Google Scholar] [CrossRef]
- Cavaliere, G.; Trinchese, G.; Penna, E.; Cimmino, F.; Pirozzi, C.; Lama, A.; Annunziata, C.; Catapano, A.; Mattace Raso, G.; Meli, R.; et al. High-Fat Diet Induces Neuroinflammation and Mitochondrial Impairment in Mice Cerebral Cortex and Synaptic Fraction. Front. Cell Neurosci. 2019, 13, 509. [Google Scholar] [CrossRef]
- Johannsen, D.L.; Ravussin, E. The role of mitochondria in health and disease. Curr. Opin. Pharm. 2009, 9, 780–786. [Google Scholar] [CrossRef]
- Rabol, R.; Boushel, R.; Dela, F. Mitochondrial oxidative function and type 2 diabetes. Appl. Physiol. Nutr. Metab. 2006, 31, 675–683. [Google Scholar] [CrossRef]
- Angelova, P.R.; Abramov, A.Y. Role of mitochondrial ROS in the brain: From physiology to neurodegeneration. FEBS Lett. 2018, 592, 692–702. [Google Scholar] [CrossRef]
- Votyakova, T.V.; Reynolds, I.J. DeltaPsi(m)-Dependent and -independent production of reactive oxygen species by rat brain mitochondria. J. Neurochem. 2001, 79, 266–277. [Google Scholar] [CrossRef]
- Rousset, S.; Alves-Guerra, M.C.; Mozo, J.; Miroux, B.; Cassard-Doulcier, A.M.; Bouillaud, F.; Ricquier, D. The biology of mitochondrial uncoupling proteins. Diabetes 2004, 53 (Suppl. 1), S130–S135. [Google Scholar] [CrossRef]
- Muniyappa, R.; Lee, S.; Chen, H.; Quon, M.J. Current approaches for assessing insulin sensitivity and resistance in vivo: Advantages, limitations, and appropriate usage. Am. J. Physiol. Endocrinol. Metab. 2008, 294, E15–E26. [Google Scholar] [CrossRef] [PubMed]
- Walf, A.A.; Frye, C.A. The use of the elevated plus maze as an assay of anxiety-related behavior in rodents. Nat. Protoc. 2007, 2, 322–328. [Google Scholar] [CrossRef]
- Barker, G.R.; Warburton, E.C. When is the hippocampus involved in recognition memory? J. Neurosci 2011, 31, 10721–10731. [Google Scholar] [CrossRef]
- Schneider, C.A.; Rasband, W.S.; Eliceiri, K.W. NIH Image to ImageJ: 25 years of image analysis. Nat. Methods 2012, 9, 671–675. [Google Scholar] [CrossRef]
- EA, H.; GP, H. Permeabilization of brain tissue in situ enables multiregion analysis of mitochondrial function in a single mouse brain. J. Physiol. 2015, 593, 787–801. [Google Scholar] [CrossRef]
- Fisher-Wellman, K.H.; Davidson, M.T.; Narowski, T.M.; Lin, C.T.; Koves, T.R.; Muoio, D.M. Mitochondrial Diagnostics: A Multiplexed Assay Platform for Comprehensive Assessment of Mitochondrial Energy Fluxes. Cell Rep. 2018, 24, 3593–3606.e3510. [Google Scholar] [CrossRef]
- Southern, W.M.; Nichenko, A.S.; Tehrani, K.F.; McGranahan, M.J.; Krishnan, L.; Qualls, A.E.; Jenkins, N.T.; Mortensen, L.J.; Yin, H.; Yin, A.; et al. PGC-1alpha overexpression partially rescues impaired oxidative and contractile pathophysiology following volumetric muscle loss injury. Sci. Rep. 2019, 9, 4079. [Google Scholar] [CrossRef]
- Nichenko, A.S.; Southern, W.M.; Atuan, M.; Luan, J.; Peissig, K.B.; Foltz, S.J.; Beedle, A.M.; Warren, G.L.; Call, J.A. Mitochondrial maintenance via autophagy contributes to functional skeletal muscle regeneration and remodeling. Am. J. Physiol. Cell Physiol. 2016, 311, C190–C200. [Google Scholar] [CrossRef]
- Gurtler, A.; Kunz, N.; Gomolka, M.; Hornhardt, S.; Friedl, A.A.; McDonald, K.; Kohn, J.E.; Posch, A. Stain-Free technology as a normalization tool in Western blot analysis. Anal. Biochem. 2013, 433, 105–111. [Google Scholar] [CrossRef]
- Bradford, M.M. A rapid and sensitive method for the quantitation of microgram quantities of protein utilizing the principle of protein-dye binding. Anal. Biochem. 1976, 72, 248–254. [Google Scholar] [CrossRef]
- Tsan, L.; Decarie-Spain, L.; Noble, E.E.; Kanoski, S.E. Western Diet Consumption During Development: Setting the Stage for Neurocognitive Dysfunction. Front. Neurosci. 2021, 15, 632312. [Google Scholar] [CrossRef]
- Schmidt, C.A.; Fisher-Wellman, K.H.; Neufer, P.D. From OCR and ECAR to energy: Perspectives on the design and interpretation of bioenergetics studies. J. Biol. Chem. 2021, 297, 101140. [Google Scholar] [CrossRef]
- McLaughlin, K.L.; Hagen, J.T.; Coalson, H.S.; Nelson, M.A.M.; Kew, K.A.; Wooten, A.R.; Fisher-Wellman, K.H. Novel approach to quantify mitochondrial content and intrinsic bioenergetic efficiency across organs. Sci. Rep. 2020, 10, 17599. [Google Scholar] [CrossRef]
- United States Department of Health and Human Services; United States Department of Agriculture; United States Dietary Guidelines Advisory Committee. Dietary guidelines for Americans, 2015–2020, 8th ed.; U.S. Department of Health and Human Services and U.S. Department of Agriculture: Washington, DC, USA, 2015; p. 122.
- Curtis, K.S.; Stratford, J.M.; Contreras, R.J. Estrogen increases the taste threshold for sucrose in rats. Physiol. Behav. 2005, 86, 281–286. [Google Scholar] [CrossRef]
- Glancy, B.; Willis, W.T.; Chess, D.J.; Balaban, R.S. Effect of calcium on the oxidative phosphorylation cascade in skeletal muscle mitochondria. Biochemistry 2013, 52, 2793–2809. [Google Scholar] [CrossRef]
- Ahima, R.S.; Antwi, D.A. Brain regulation of appetite and satiety. Endocrinol. Metab. Clin. N. Am. 2008, 37, 811–823. [Google Scholar] [CrossRef]
- Iwasa, T.; Matsuzaki, T.; Yano, K.; Yiliyasi, M.; Kuwahara, A.; Matsui, S.; Irahara, M. Effects of chronic testosterone administration on the degree of preference for a high-fat diet and body weight in gonadal-intact and ovariectomized female rats. Behav. Brain Res. 2018, 349, 102–108. [Google Scholar] [CrossRef] [PubMed]
- Nadal-Casellas, A.; Proenza, A.M.; Llado, I.; Gianotti, M. Sex-dependent differences in rat hepatic lipid accumulation and insulin sensitivity in response to diet-induced obesity. Biochem. Cell Biol. 2012, 90, 164–172. [Google Scholar] [CrossRef]
- Underwood, E.L.; Thompson, L.T. A High-Fat Diet Causes Impairment in Hippocampal Memory and Sex-Dependent Alterations in Peripheral Metabolism. Neural Plast 2016, 2016, 7385314. [Google Scholar] [CrossRef] [PubMed][Green Version]
- Lopez, M. Hypothalamic AMPK and energy balance. Eur. J. Clin. Investig. 2018, 48, e12996. [Google Scholar] [CrossRef] [PubMed]
- Lam, T.K.; Schwartz, G.J.; Rossetti, L. Hypothalamic sensing of fatty acids. Nat. Neurosci. 2005, 8, 579–584. [Google Scholar] [CrossRef] [PubMed]
- Obici, S.; Feng, Z.; Arduini, A.; Conti, R.; Rossetti, L. Inhibition of hypothalamic carnitine palmitoyltransferase-1 decreases food intake and glucose production. Nat. Med. 2003, 9, 756–761. [Google Scholar] [CrossRef] [PubMed]
- Taylor, Z.B.; Stevenson, R.J.; Ehrenfeld, L.; Francis, H.M. The impact of saturated fat, added sugar and their combination on human hippocampal integrity and function: A systematic review and meta-analysis. Neurosci. Biobehav. Rev. 2021, 130, 91–106. [Google Scholar] [CrossRef] [PubMed]
- Noble, E.E.; Hsu, T.M.; Kanoski, S.E. Gut to Brain Dysbiosis: Mechanisms Linking Western Diet Consumption, the Microbiome, and Cognitive Impairment. Front. Behav. Neurosci. 2017, 11, 9. [Google Scholar] [CrossRef]
- Abbott, K.N.; Arnott, C.K.; Westbrook, R.F.; Tran, D.M.D. The effect of high fat, high sugar, and combined high fat-high sugar diets on spatial learning and memory in rodents: A meta-analysis. Neurosci. Biobehav. Rev. 2019, 107, 399–421. [Google Scholar] [CrossRef] [PubMed]
- Devan, B.D.; Tobin, E.L.; Dunn, E.N.; Magalis, C. Sex differences on the competitive place task in the water maze: The influence of peripheral pool time on spatial navigation performance in rats. Behav. Process. 2016, 132, 34–41. [Google Scholar] [CrossRef] [PubMed]
- Keeley, R.J.; Bye, C.; Trow, J.; McDonald, R.J. Strain and sex differences in brain and behaviour of adult rats: Learning and memory, anxiety and volumetric estimates. Behav. Brain Res. 2015, 288, 118–131. [Google Scholar] [CrossRef] [PubMed]
- Packard, M.G.; McGaugh, J.L. Inactivation of hippocampus or caudate nucleus with lidocaine differentially affects expression of place and response learning. Neurobiol. Learn. Mem. 1996, 65, 65–72. [Google Scholar] [CrossRef]
- Gibbs, A.C.; Wilson, J.F. Sex differences in route learning by children. Percept. Mot. Ski. 1999, 88, 590–594. [Google Scholar] [CrossRef]
- Jonasson, Z. Meta-analysis of sex differences in rodent models of learning and memory: A review of behavioral and biological data. Neurosci. Biobehav. Rev. 2005, 28, 811–825. [Google Scholar] [CrossRef]
- Rozin, P.; Dow, S.; Moscovitch, M.; Rajaram, S. What causes humans to begin and end a meal? A role for memory for what has been eaten, as evidenced by a study of multiple meal eating in amnesic patients. Psychol. Sci. 1998, 9, 392–396. [Google Scholar] [CrossRef]
- Higgs, S.; Williamson, A.C.; Rotshtein, P.; Humphreys, G.W. Sensory-specific satiety is intact in amnesics who eat multiple meals. Psychol. Sci. 2008, 19, 623–628. [Google Scholar] [CrossRef]
- Davidson, T.L.; Kanoski, S.E.; Chan, K.; Clegg, D.J.; Benoit, S.C.; Jarrard, L.E. Hippocampal lesions impair retention of discriminative responding based on energy state cues. Behav. Neurosci. 2010, 124, 97–105. [Google Scholar] [CrossRef]
- Henderson, Y.O.; Smith, G.P.; Parent, M.B. Hippocampal neurons inhibit meal onset. Hippocampus 2013, 23, 100–107. [Google Scholar] [CrossRef]
- Davidson, T.L.; Kanoski, S.E.; Walls, E.K.; Jarrard, L.E. Memory inhibition and energy regulation. Physiol. Behav. 2005, 86, 731–746. [Google Scholar] [CrossRef] [PubMed]
- Brand, M.D. Mitochondrial generation of superoxide and hydrogen peroxide as the source of mitochondrial redox signaling. Free Radic. Biol. Med. 2016, 100, 14–31. [Google Scholar] [CrossRef] [PubMed]
- Park, H.S.; Cho, H.S.; Kim, T.W. Physical exercise promotes memory capability by enhancing hippocampal mitochondrial functions and inhibiting apoptosis in obesity-induced insulin resistance by high fat diet. Metab. Brain Dis. 2018, 33, 283–292. [Google Scholar] [CrossRef] [PubMed]
- Cole, M.A.; Murray, A.J.; Cochlin, L.E.; Heather, L.C.; McAleese, S.; Knight, N.S.; Sutton, E.; Jamil, A.A.; Parassol, N.; Clarke, K. A high fat diet increases mitochondrial fatty acid oxidation and uncoupling to decrease efficiency in rat heart. Basic. Res. Cardiol. 2011, 106, 447–457. [Google Scholar] [CrossRef] [PubMed]


Publisher’s Note: MDPI stays neutral with regard to jurisdictional claims in published maps and institutional affiliations. |
© 2021 by the authors. Licensee MDPI, Basel, Switzerland. This article is an open access article distributed under the terms and conditions of the Creative Commons Attribution (CC BY) license (https://creativecommons.org/licenses/by/4.0/).
Share and Cite
Lord, M.N.; Heo, J.-W.; Schifino, A.G.; Hoffman, J.R.; Donohue, K.N.; Call, J.A.; Noble, E.E. Sexually Dimorphic Effects of a Western Diet on Brain Mitochondrial Bioenergetics and Neurocognitive Function. Nutrients 2021, 13, 4222. https://doi.org/10.3390/nu13124222
Lord MN, Heo J-W, Schifino AG, Hoffman JR, Donohue KN, Call JA, Noble EE. Sexually Dimorphic Effects of a Western Diet on Brain Mitochondrial Bioenergetics and Neurocognitive Function. Nutrients. 2021; 13(12):4222. https://doi.org/10.3390/nu13124222
Chicago/Turabian StyleLord, Magen N., Jun-Won Heo, Albino G. Schifino, Jessica R. Hoffman, Kristen N. Donohue, Jarrod A. Call, and Emily E. Noble. 2021. "Sexually Dimorphic Effects of a Western Diet on Brain Mitochondrial Bioenergetics and Neurocognitive Function" Nutrients 13, no. 12: 4222. https://doi.org/10.3390/nu13124222
APA StyleLord, M. N., Heo, J.-W., Schifino, A. G., Hoffman, J. R., Donohue, K. N., Call, J. A., & Noble, E. E. (2021). Sexually Dimorphic Effects of a Western Diet on Brain Mitochondrial Bioenergetics and Neurocognitive Function. Nutrients, 13(12), 4222. https://doi.org/10.3390/nu13124222