
Low- and No-Calorie Sweetener (LNCS) Presence and Consumption among the Portuguese Adult Population

 ,
,  , , ,
, , ,  and
and 
Abstract
:1. Introduction
2. Materials and Methods
2.1. Study Design and Sample
2.2. Data Collection
2.3. Statistical Analysis
3. Results
4. Discussion
5. Conclusions
Supplementary Materials
Author Contributions
Funding
Institutional Review Board Statement
Informed Consent Statement
Data Availability Statement
Acknowledgments
Conflicts of Interest
References
- Lustig, R.H.; Schmidt, L.A.; Brindis, C.D. Public health: The toxic truth about sugar. Nature 2012, 482, 27–29. [Google Scholar] [CrossRef] [PubMed]
- Amine, E.; Baba, N.; Belhadj, M.; Deurenberg-Yap, M.; Djazayery, A.; Forrester, T.; Galuska, D.; Herman, S.; James, W.; M’Buyamba, J. Diet, Nutrition and the Prevention of Chronic Diseases; Vol. Report No.: 0512-3054; World Health Organization: Geneva, Switzerland, 2003. [Google Scholar]
- Azaïs-Braesco, V.; Sluik, D.; Maillot, M.; Kok, F.; Moreno, L.A. A review of total & added sugar intakes and dietary sources in Europe. Nutr. J. 2017, 16, 6. [Google Scholar] [PubMed] [Green Version]
- Ashwell, M.; Gibson, S.; Bellisle, F.; Buttriss, J.; Drewnowski, A.; Fantino, M.; Gallagher, A.M.; de Graaf, K.; Goscinny, S.; Hardman, C.A.; et al. Expert consensus on low-calorie sweeteners: Facts, research gaps and suggested actions. Nutr. Res. Rev. 2020, 33, 145–154. [Google Scholar] [CrossRef] [PubMed] [Green Version]
- Riobó Serván, P.; Sierra Poyatos, R.; Soldo Rodríguez, J. Low and no calorie sweeteners (LNCS); myths and realities. Nutr. Hosp. 2014, 30 (Suppl. 2e), 49–55. [Google Scholar] [PubMed]
- Dunford, E.K.; Taillie, L.S.; Miles, D.R.; Eyles, H.; Tolentino-Mayo, L.; Ng, S.W. Non-nutritive sweeteners in the packaged food supply-an assessment across 4 countries. Nutrients 2018, 10, 257. [Google Scholar] [CrossRef] [Green Version]
- World Health Organization. Guideline: Sugars Intake for Adults and Children; World Health Organization: Geneva, Switzerland, 2015. [Google Scholar]
- Prada, M.; Saraiva, M.; Garrido, M.V.; Rodrigues, D.L.; Lopes, D. Knowledge about sugar sources and sugar intake guidelines in portuguese consumers. Nutrients 2020, 12, 3888. [Google Scholar] [CrossRef] [PubMed]
- Marinho, A.R.; Severo, M.; Correia, D.; Lobato, L.; Vilela, S.; Oliveira, A.; Ramos, E.; Torres, D.; Lopes, C. Total, added and free sugar intakes, dietary sources and determinants of consumption in Portugal: The national food, nutrition and physical activity survey (IAN-AF 2015–2016). Public Health Nutr. 2020, 23, 869–881. [Google Scholar] [CrossRef] [PubMed]
- Ruiz, E.; Rodriguez, P.; Valero, T.; Ávila, J.M.; Aranceta-Bartrina, J.; Gil, Á.; González-Gross, M.; Ortega, R.M.; Serra-Majem, L.; Varela-Moreiras, G. Dietary intake of individual (free and intrinsic) sugars and food sources in the spanish population: Findings from the ANIBES study. Nutrients 2017, 9, 275. [Google Scholar] [CrossRef] [PubMed] [Green Version]
- Desor, J.A.; Greene, L.S.; Maller, O. Preferences for sweet and salty in 9- to 15-year-old and adult humans. Sci. 1975, 190, 686–687. [Google Scholar] [CrossRef]
- Paglia, L. The sweet danger of added sugars. Eur. J. Paediatr. Dent. 2019, 20, 89. [Google Scholar] [PubMed]
- Desor, J.A.; Beauchamp, G.K. Longitudinal changes in sweet preferences in humans. Physiol. Behav. 1987, 39, 639–641. [Google Scholar] [CrossRef]
- Mattes, R.D. Gustation as a determinant of ingestion: Methodological issues. Am. J. Clin. Nutr. 1985, 41, 672–683. [Google Scholar] [CrossRef] [PubMed] [Green Version]
- Drewnowski, A.; Mennella, J.A.; Johnson, S.L.; Bellisle, F. Sweetness and food preference. J. Nutr. 2012, 142, 1142s–1148s. [Google Scholar] [CrossRef] [Green Version]
- Berridge, K.C. ‘Liking’ and ‘wanting’ food rewards: Brain substrates and roles in eating disorders. Physiol. Behav. 2009, 97, 537–550. [Google Scholar] [CrossRef] [PubMed] [Green Version]
- Cooper, J.M. Product Reformulation: Can sugar be replaced in foods? Int. Sugar J. 2012, 114, 642–645. [Google Scholar]
- Swithers, S.E.; Shearer, J. Obesity: Sweetener associated with increased adiposity in young adults. Nat. Rev. Endocrinol. 2017, 13, 443–444. [Google Scholar] [CrossRef] [PubMed]
- Hunt, K.J.; St Peter, J.V.; Malek, A.M.; Vrana-Diaz, C.; Marriott, B.P.; Greenberg, D. Daily eating frequency in US adults: Associations with low-calorie sweeteners, body mass index, and nutrient intake (NHANES 2007–2016). Nutrients 2020, 12, 2566. [Google Scholar] [CrossRef]
- Pearlman, M.; Obert, J.; Casey, L. The association between artificial sweeteners and obesity. Curr. Gastroenterol. Rep. 2017, 19, 64. [Google Scholar] [CrossRef]
- Aicep Portugal Global. The Regions of Portugal. Available online: portugalglobal.pt/EN/InvestInPortugal/RegionsofPortugal/Pages/TheRegionsofPortugal.aspx (accessed on 25 February 2021).
- Trinidad Rodríguez, I.; Fernández Ballart, J.; Cucó Pastor, G.; Biarnés Jordà, E.; Arija Val, V. Validación de un cuestionario de frecuencia de consumo alimentario corto: Reproducibilidad y validez. Nutr. Hosp. 2008, 23, 242–252. [Google Scholar]
- Redruello-Requejo, M.; González-Rodríguez, M.; Samaniego-Vaesken, M.; Montero-Bravo, A.; Partearroyo, T.; Varela-Moreiras, G. Low- and No-Calorie Sweetener (LNCS) consumption patterns amongst the spanish adult population. Nutrients 2021, 13, 1845. [Google Scholar] [CrossRef]
- Basílio, M.; Silva, L.J.G.; Pereira, A.; Pena, A.; Lino, C.M. Artificial sweeteners in non-alcoholic beverages: Occurrence and exposure estimation of the Portuguese population. Food Addit. Contam. Part A Chem. Anal. Control Expo. Risk Assess. 2020, 37, 2040–2050. [Google Scholar] [CrossRef] [PubMed]
- Russell, C.; Grimes, C.; Baker, P.; Sievert, K.; Lawrence, M.A. The drivers, trends and dietary impacts of non-nutritive sweeteners in the food supply: A narrative review. Nutr. Res. Rev. 2021, 34, 185–208. [Google Scholar] [CrossRef]
- Drewnowski, A.; Rehm, C.D. Socio-demographic correlates and trends in low-calorie sweetener use among adults in the United States from 1999 to 2008. Eur. J. Clin. Nutr. 2015, 69, 1035–1041. [Google Scholar] [CrossRef]
- Le Donne, C.; Mistura, L.; Goscinny, S.; Janvier, S.; Cuypers, K.; D′Addezio, L.; Sette, S.; Catasta, G.; Ferrari, M.; Piccinelli, R.; et al. Assessment of dietary intake of 10 intense sweeteners by the Italian population. Food Chem. Toxicol. Int. J. Publ. Br. Ind. Biol. Res. Assoc. 2017, 102, 186–197. [Google Scholar] [CrossRef] [PubMed]
- Huvaere, K.; Vandevijvere, S.; Hasni, M.; Vinkx, C.; Van Loco, J. Dietary intake of artificial sweeteners by the Belgian population. Food Addit. Contam. Part A Chem. Anal. Control Expo. Risk Assess. 2012, 29, 54–65. [Google Scholar] [CrossRef] [Green Version]
- Samaniego-Vaesken, M.L.; González-Fernández, B.; Partearroyo, T.; Urrialde, R.; Varela-Moreiras, G. Updated database and trends of declared low- and no-calorie sweeteners from foods and beverages marketed in Spain. Front. Nutr. 2021, 8, 670422. [Google Scholar] [CrossRef] [PubMed]
- Martínez, X.; Zapata, Y.; Pinto, V.; Cornejo, C.; Elbers, M.; Graaf, M.V.; Villarroel, L.; Hodgson, M.I.; Rigotti, A.; Echeverría, G. Intake of non-nutritive sweeteners in chilean children after enforcement of a new food labeling law that regulates added sugar content in processed foods. Nutrients 2020, 12, 1594. [Google Scholar] [CrossRef] [PubMed]
- Sambra, V.; López-Arana, S.; Cáceres, P.; Abrigo, K.; Collinao, J.; Espinoza, A.; Valenzuela, S.; Carvajal, B.; Prado, G.; Peralta, R.; et al. Overuse of non-caloric sweeteners in foods and beverages in chile: A threat to consumers’ free choice? Front. Nutr. 2020, 7, 68. [Google Scholar] [CrossRef] [PubMed]


Total | Men | Women | |||||
|---|---|---|---|---|---|---|---|
| n | % | n | % | N | % | ||
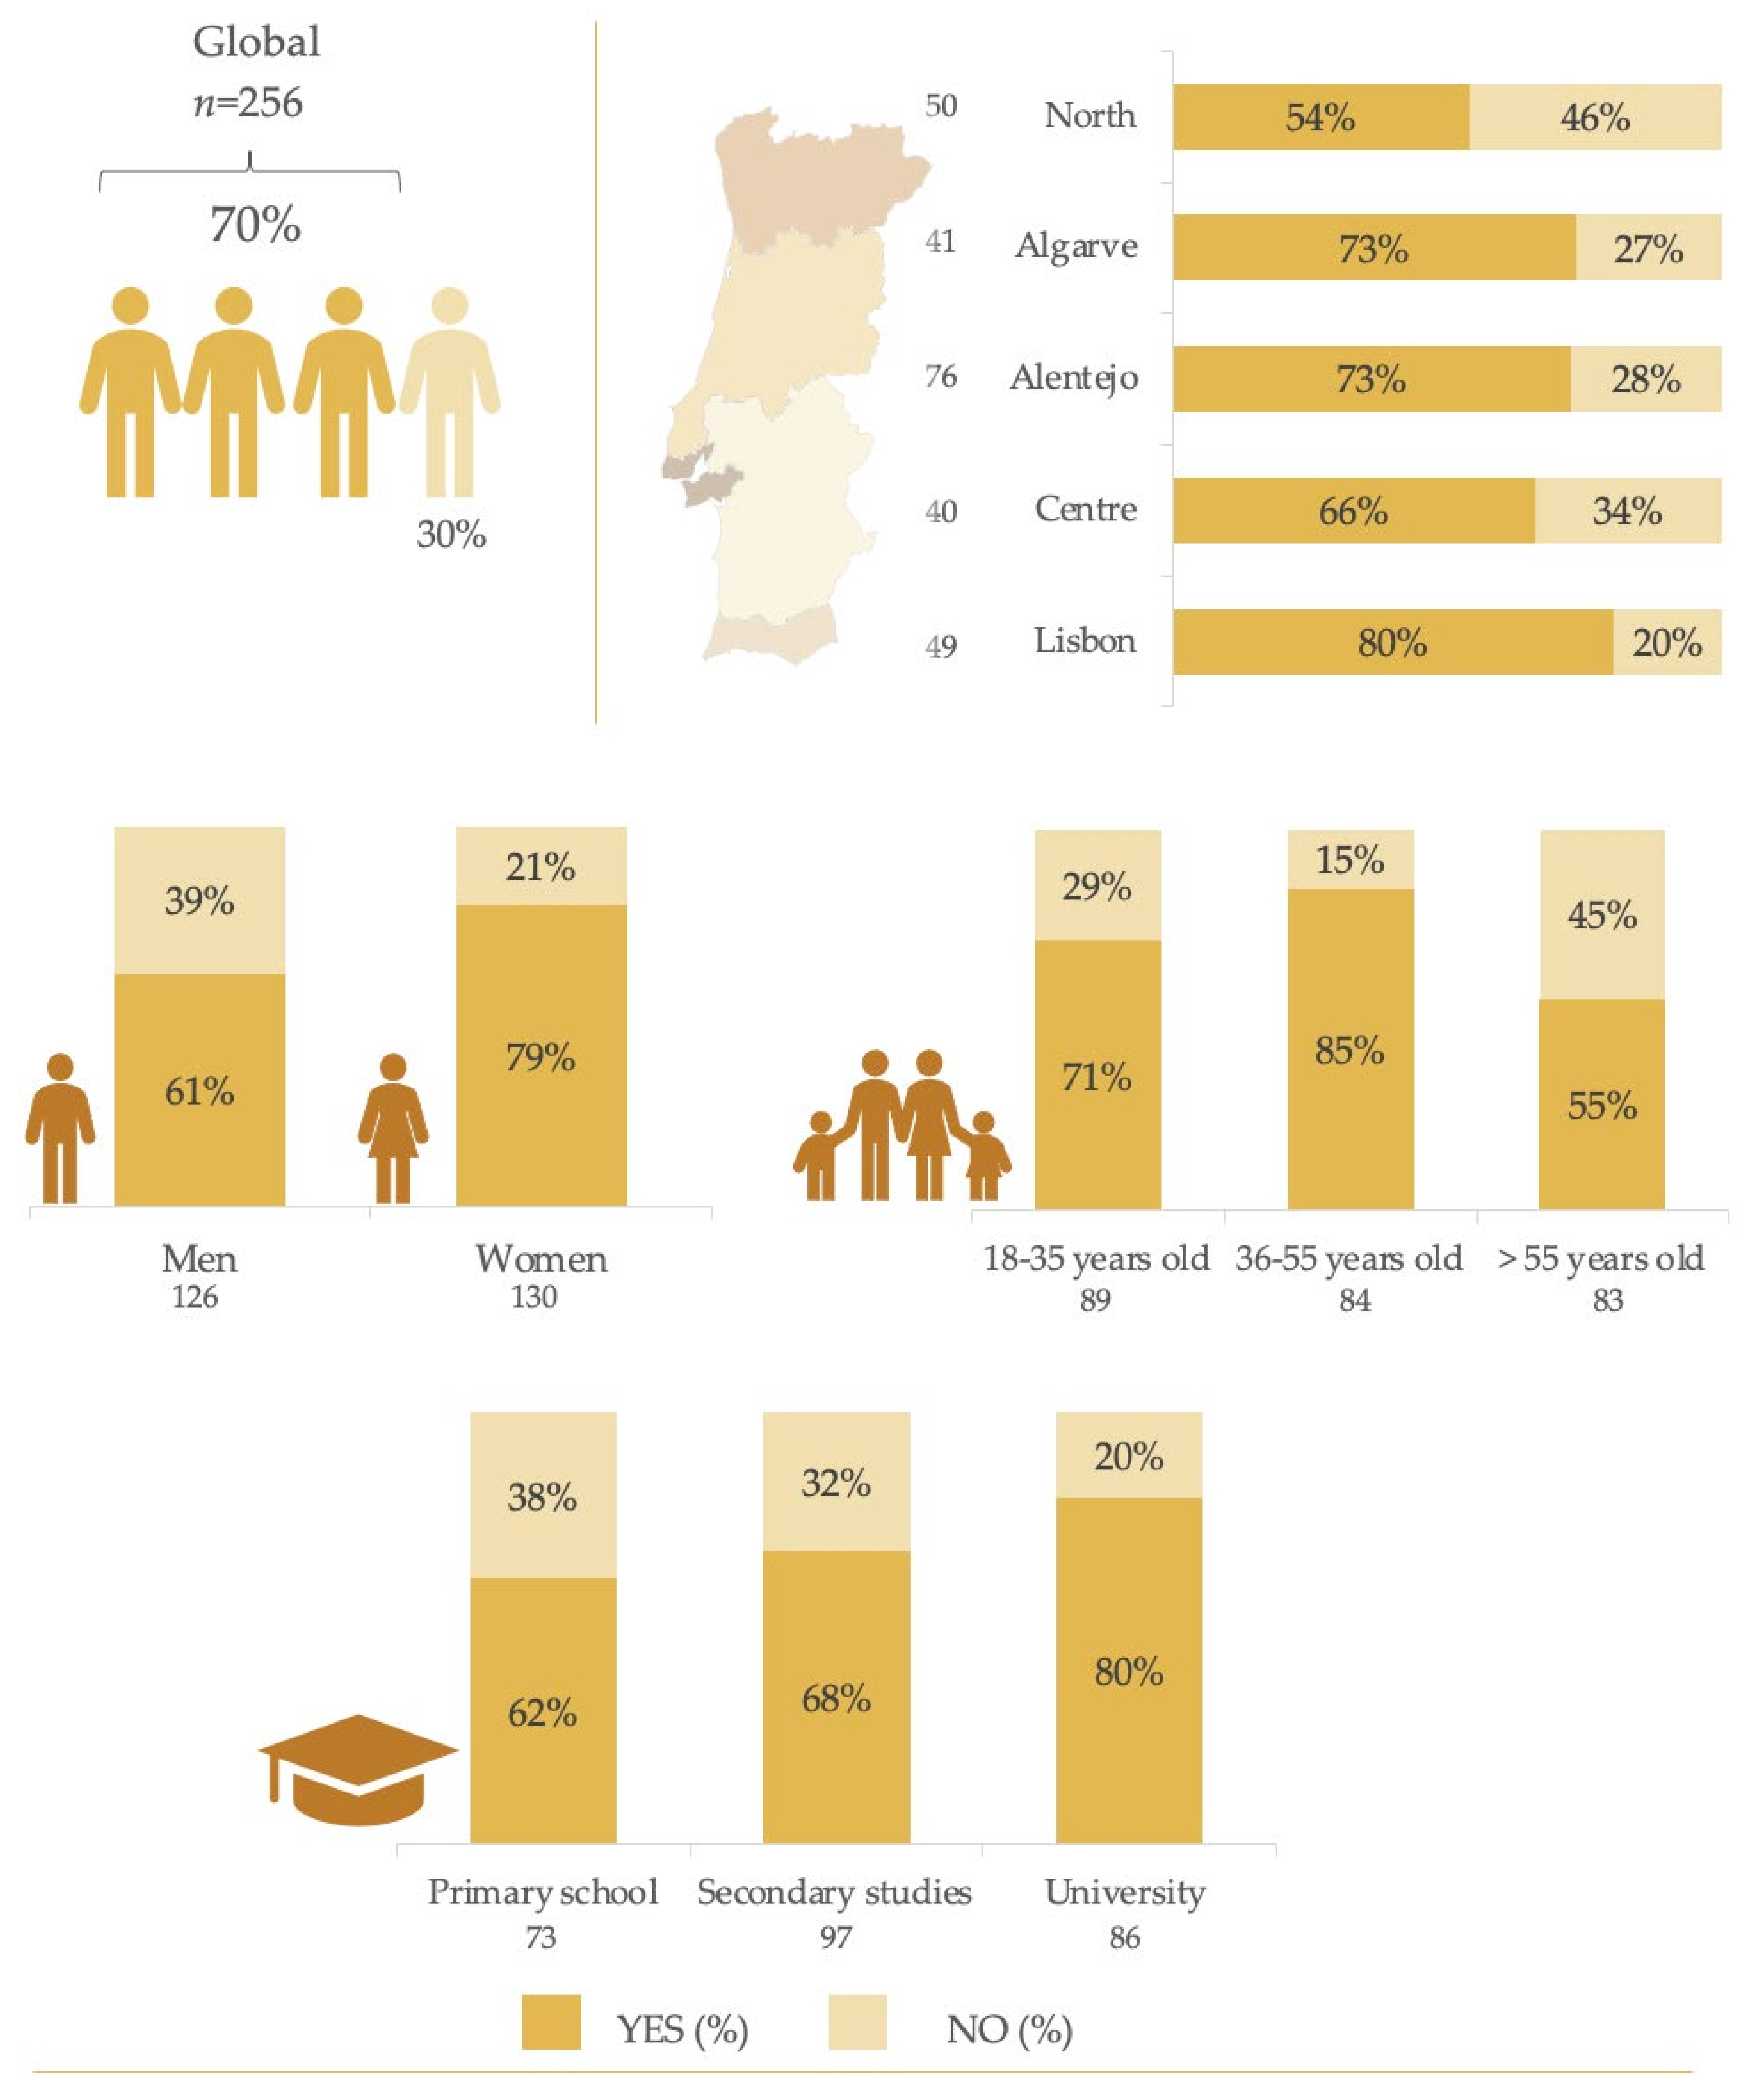
| Total Population | 256 | 100 | 126 | 49.2 | 130 | 50.8 | |
Age group | 18–35 years | 89 | 34.8 | 51 | 57.3 a | 38 | 42.7 a |
| 36–55 years | 84 | 32.8 | 29 | 34.5 b | 55 | 65.5 b | |
| >55 years | 83 | 32.4 | 46 | 55.4 a | 37 | 44.6 a | |
Education level | Primary or less | 73 | 28.5 | 41 | 56.2 | 32 | 43.8 |
| Secondary studies | 97 | 37.9 | 60 | 61.9 *** | 37 | 38.1 | |
| University | 86 | 33.6 | 25 | 29.1 *** | 61 | 70.9 | |
Occupational status | Working | 187 | 73.0 | 94 | 50.3 | 93 | 49.7 |
| Retired | 33 | 12.9 | 16 | 48.5 | 17 | 51.5 | |
| Other: unemployed, students, housewives | 36 | 14.1 | 16 | 44.4 | 20 | 55.6 | |
| Geographical distribution (NUTS II areas)  | North | 50 | 19.5 | 30 | 60.0 | 20 | 40.0 |
| Algarve | 49 | 19.1 | 28 | 57.1 | 21 | 42.9 | |
| Alentejo | 40 | 15.6 | 18 | 45.0 | 22 | 55.0 | |
| Centre | 41 | 16.0 | 25 | 61.0 | 16 | 39.0 | |
| Lisbon Metropolitan Area | 76 | 29.7 | 25 | 32.9 *** | 51 | 67.1 | |
| Presence of LNCS | ||
|---|---|---|
| Food Group | Yes (%) | No (%) |
| Beverages: non-alcoholic | 34.2 | 65.8 |
| Milk and dairy products | 16.5 | 83.5 |
| Appetizers | 8.6 | 91.4 |
| Sugar and sweets | 6.1 | 93.9 |
| Meat and derivative products | 2.2 | 97.8 |
| Canned fruit | 1.2 | 98.8 |
| Cereals and derivatives | 1.2 | 98.8 |
| Beverages: alcoholic | 0 | 100 |
| Eggs | 0 | 100 |
| Fish and shellfish | 0 | 100 |
| Fruits | 0 | 100 |
| Nuts and seeds | 0 | 100 |
| Pulses | 0 | 100 |
| Ready-to-eat meals | 0 | 100 |
| Sauces and condiments | 0 | 100 |
| Vegetables | 0 | 100 |
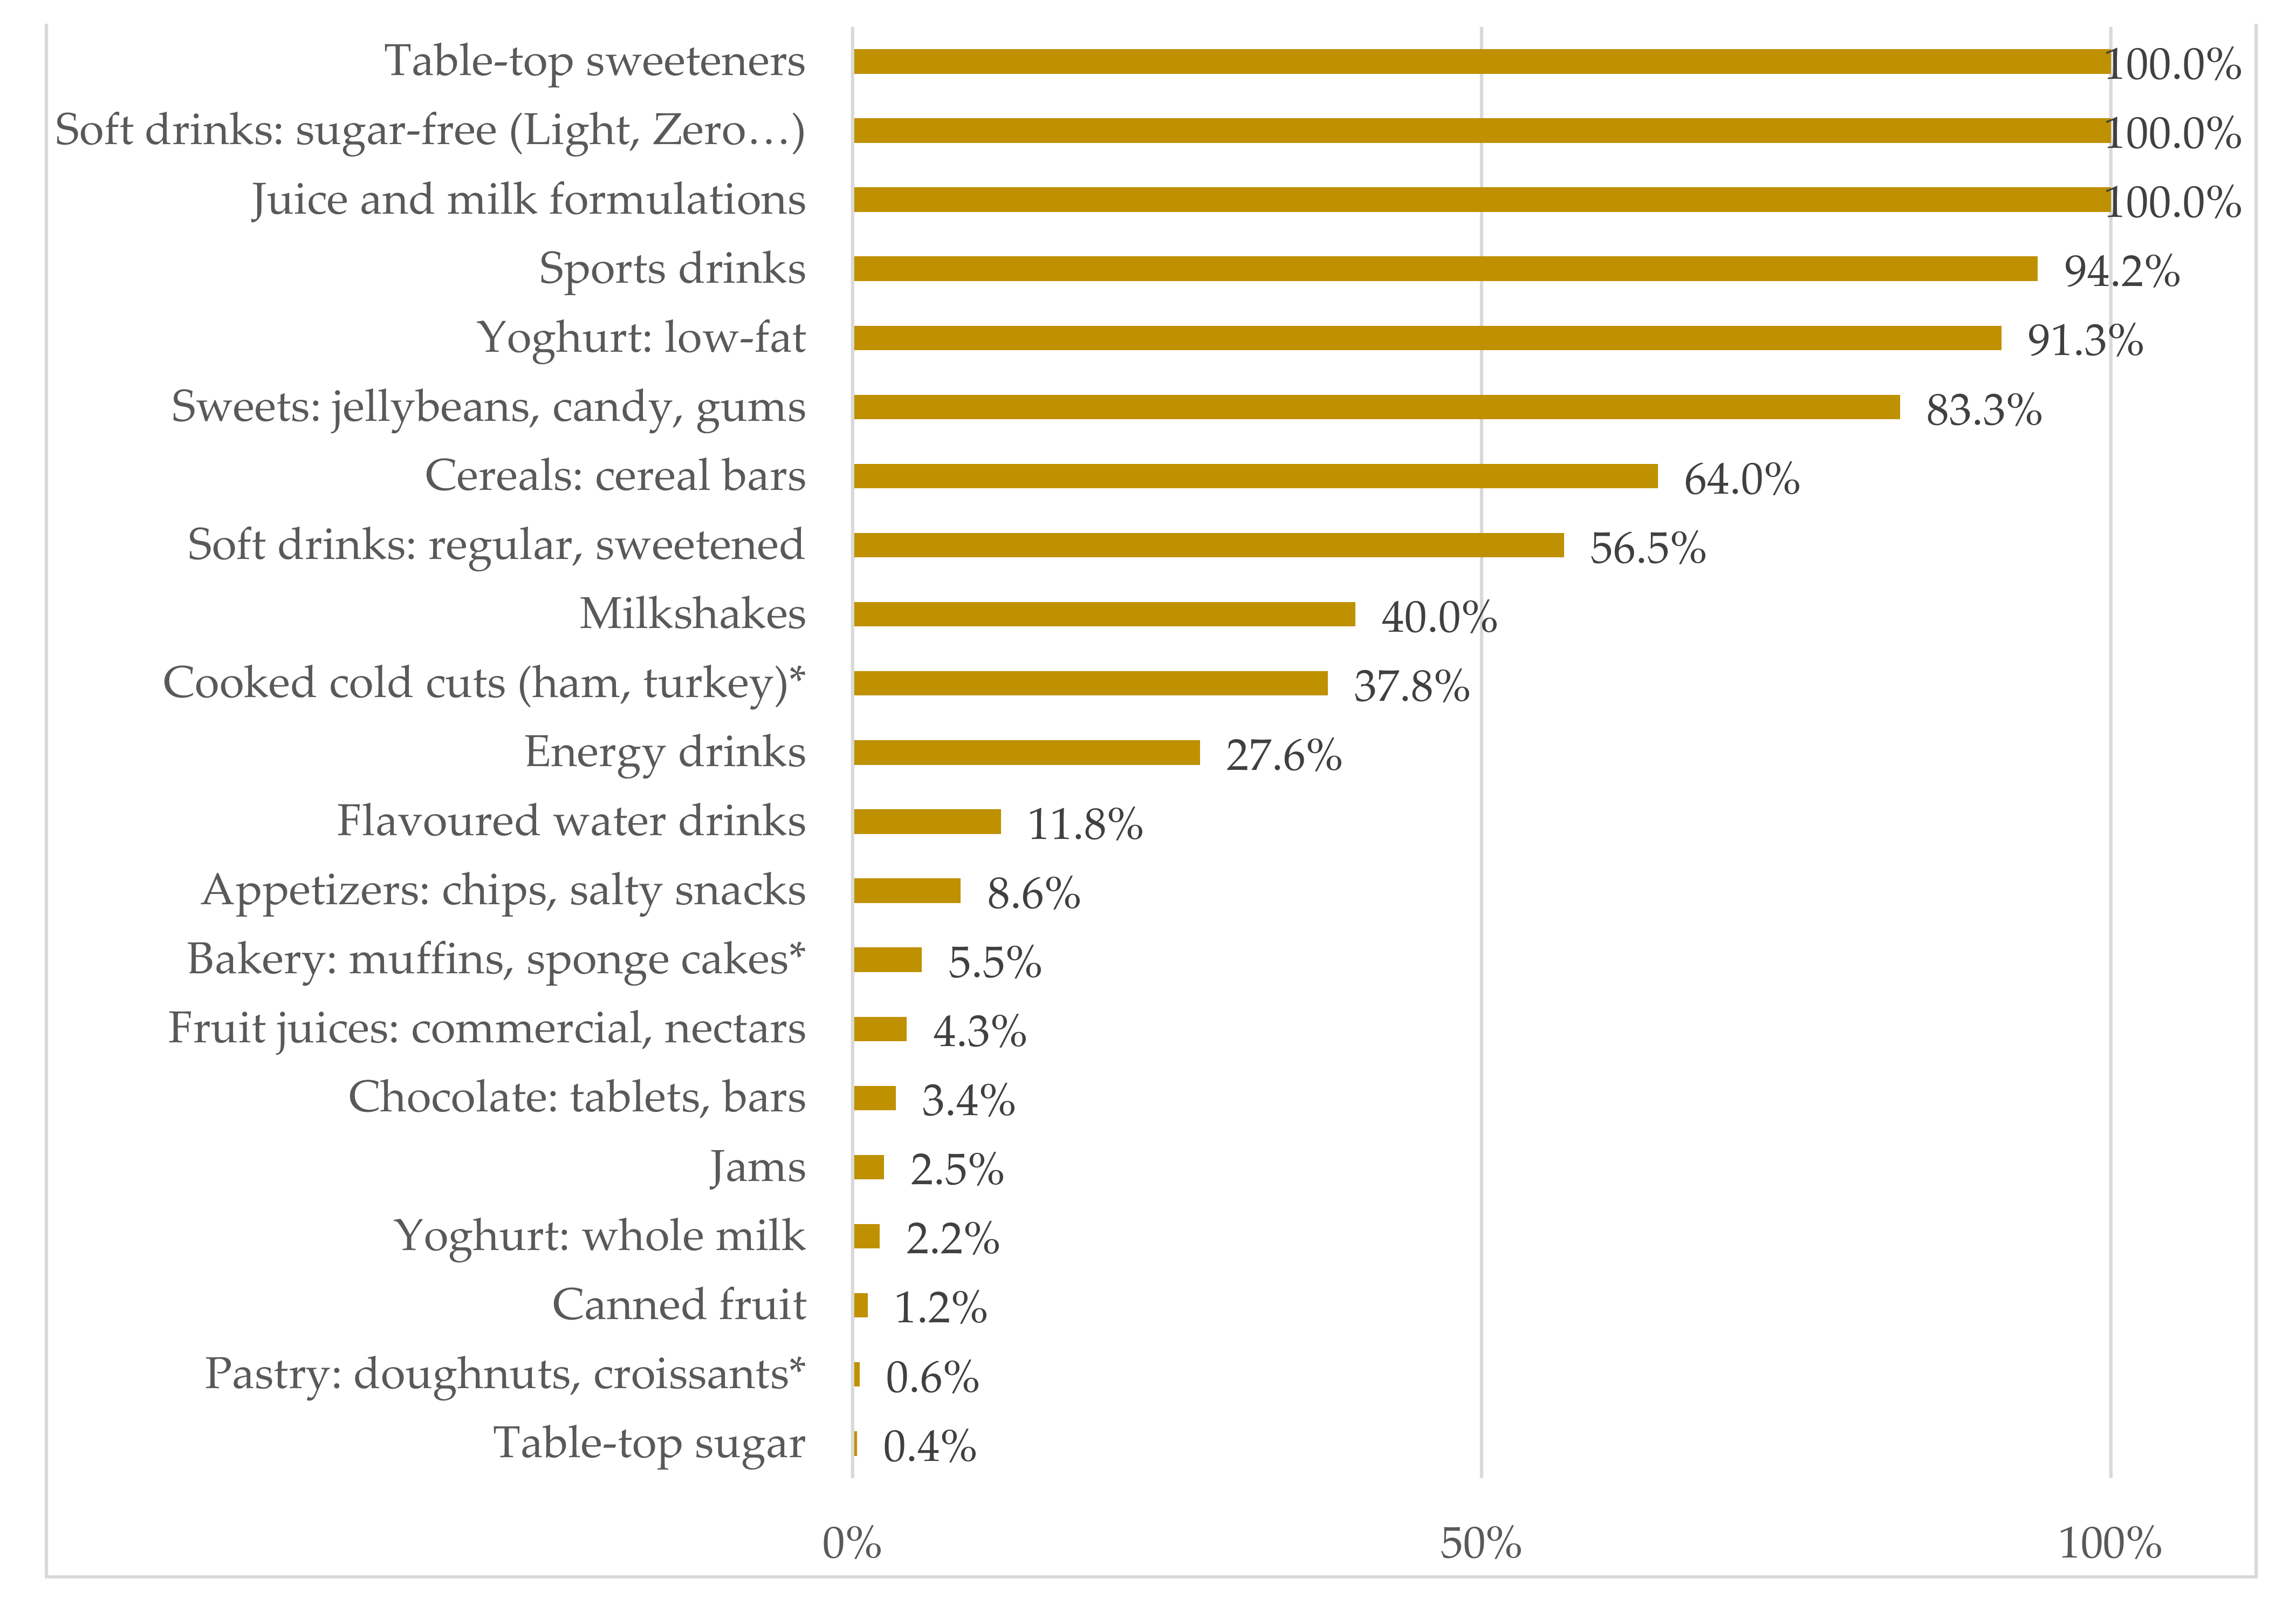
| Food Product | % | N | LNCS |
|---|---|---|---|
| Tabletop sweeteners | 100.0 | 5 | Acesulfame K (E-950) Aspartame (E-951) Saccharin and its salts (E-954) Steviol glycosides (E-960) Sucralose (E-955) |
| Soft drinks: Low or sugar-free (Light, Diet, Zero…) | 100.0 | 4 | Acesulfame K (E-950) Aspartame (E-951) Cyclamate (E-952) Sucralose (E-955) |
| Juice and milk formulations | 100.0 | 2 | Acesulfame K (E-950) Sucralose (E-955) |
| Sports drinks | 94.2 | 3 | Acesulfame K (E-950) Steviol glycosides (E-960) Sucralose (E-955) |
| Yoghurt: low-fat | 91.3 | 5 | Acesulfame K (E-950) Aspartame (E-951) Cyclamate (E-952) Neotame (E-961) Sucralose (E-955) |
| Sweets: jellybeans, candy, chewing gum | 83.3 | 12 | Acesulfame K (E-950) Aspartame (E-951) Cyclamate (E-952) Isomalt (E-953) Lactitol (E-966) Maltitol (E-965) Mannitol (E-421) Polyglycitol syrup (E-964) Saccharin and its salts (E-954) Sorbitol (E-420) Sucralose (E-955) Xylitol (E-967) |
| Cereals: cereal bars | 64.0 | 3 | Maltitol (E-965) Mannitol (E-421) Sorbitol (E-420) |
| Soft drinks: Regular (sweetened) | 56.5 | 6 | Acesulfame K (E-950) Aspartame (E-951) Cyclamate (E-952) Steviol glycosides (E-960) Neohesperidine-DC (E-959) Sucralose (E-955) |
| Milkshakes | 40.0 | 2 | Acesulfame K (E-950) Sucralose (E-955) |
| Cooked cold cuts (ham, turkey) | 37.8 | 1 | Sorbitol (E-420) * |
| Energy drinks | 27.6 | 1 | Acesulfame K (E-950) |
| Flavoured water drinks | 11.8 | 2 | Aspartame (E-951) Sucralose (E-955) |
| Appetizers: snacks, chips | 8.6 | 1 | Aspartame (E-951) |
| Bakery: muffin, sponge cakes | 5.5 | 1 | Sorbitol (E-420) * |
| Fruit juices: commercial, nectars | 4.3 | 3 | Cyclamate (E-952) Steviol glycosides (E-960) Sucralose (E-955) |
| Chocolate: tablets, bars | 3.4 | 1 | Maltitol (E-965) |
| Jams | 2.5 | 1 | Steviol glycosides (E-960) |
| Yoghurt: whole milk | 2.2 | 2 | Acesulfame K (E-950) Sucralose (E-955) |
| Canned fruits | 1.2 | 2 | Cyclamate (E-952) Saccharin and its salts (E-954) |
| Pastry: doughnuts, croissants | 0.6 | 1 | Sorbitol (E-420) * |
| Tabletop sugar | 0.4 | 1 | Steviol glycosides (E-960) |
Publisher’s Note: MDPI stays neutral with regard to jurisdictional claims in published maps and institutional affiliations. |
© 2021 by the authors. Licensee MDPI, Basel, Switzerland. This article is an open access article distributed under the terms and conditions of the Creative Commons Attribution (CC BY) license (https://creativecommons.org/licenses/by/4.0/).
Share and Cite
González-Rodríguez, M.; Redruello-Requejo, M.; Samaniego-Vaesken, M.d.L.; Montero-Bravo, A.; Puga, A.M.; Partearroyo, T.; Varela-Moreiras, G. Low- and No-Calorie Sweetener (LNCS) Presence and Consumption among the Portuguese Adult Population. Nutrients 2021, 13, 4186. https://doi.org/10.3390/nu13114186
González-Rodríguez M, Redruello-Requejo M, Samaniego-Vaesken MdL, Montero-Bravo A, Puga AM, Partearroyo T, Varela-Moreiras G. Low- and No-Calorie Sweetener (LNCS) Presence and Consumption among the Portuguese Adult Population. Nutrients. 2021; 13(11):4186. https://doi.org/10.3390/nu13114186
Chicago/Turabian StyleGonzález-Rodríguez, María, Marina Redruello-Requejo, María de Lourdes Samaniego-Vaesken, Ana Montero-Bravo, Ana M. Puga, Teresa Partearroyo, and Gregorio Varela-Moreiras. 2021. "Low- and No-Calorie Sweetener (LNCS) Presence and Consumption among the Portuguese Adult Population" Nutrients 13, no. 11: 4186. https://doi.org/10.3390/nu13114186
APA StyleGonzález-Rodríguez, M., Redruello-Requejo, M., Samaniego-Vaesken, M. d. L., Montero-Bravo, A., Puga, A. M., Partearroyo, T., & Varela-Moreiras, G. (2021). Low- and No-Calorie Sweetener (LNCS) Presence and Consumption among the Portuguese Adult Population. Nutrients, 13(11), 4186. https://doi.org/10.3390/nu13114186