
Blackcurrant Improves Diabetic Cardiovascular Dysfunction by Reducing Inflammatory Cytokines in Type 2 Diabetes Mellitus Mice

 , ,
, ,
Abstract
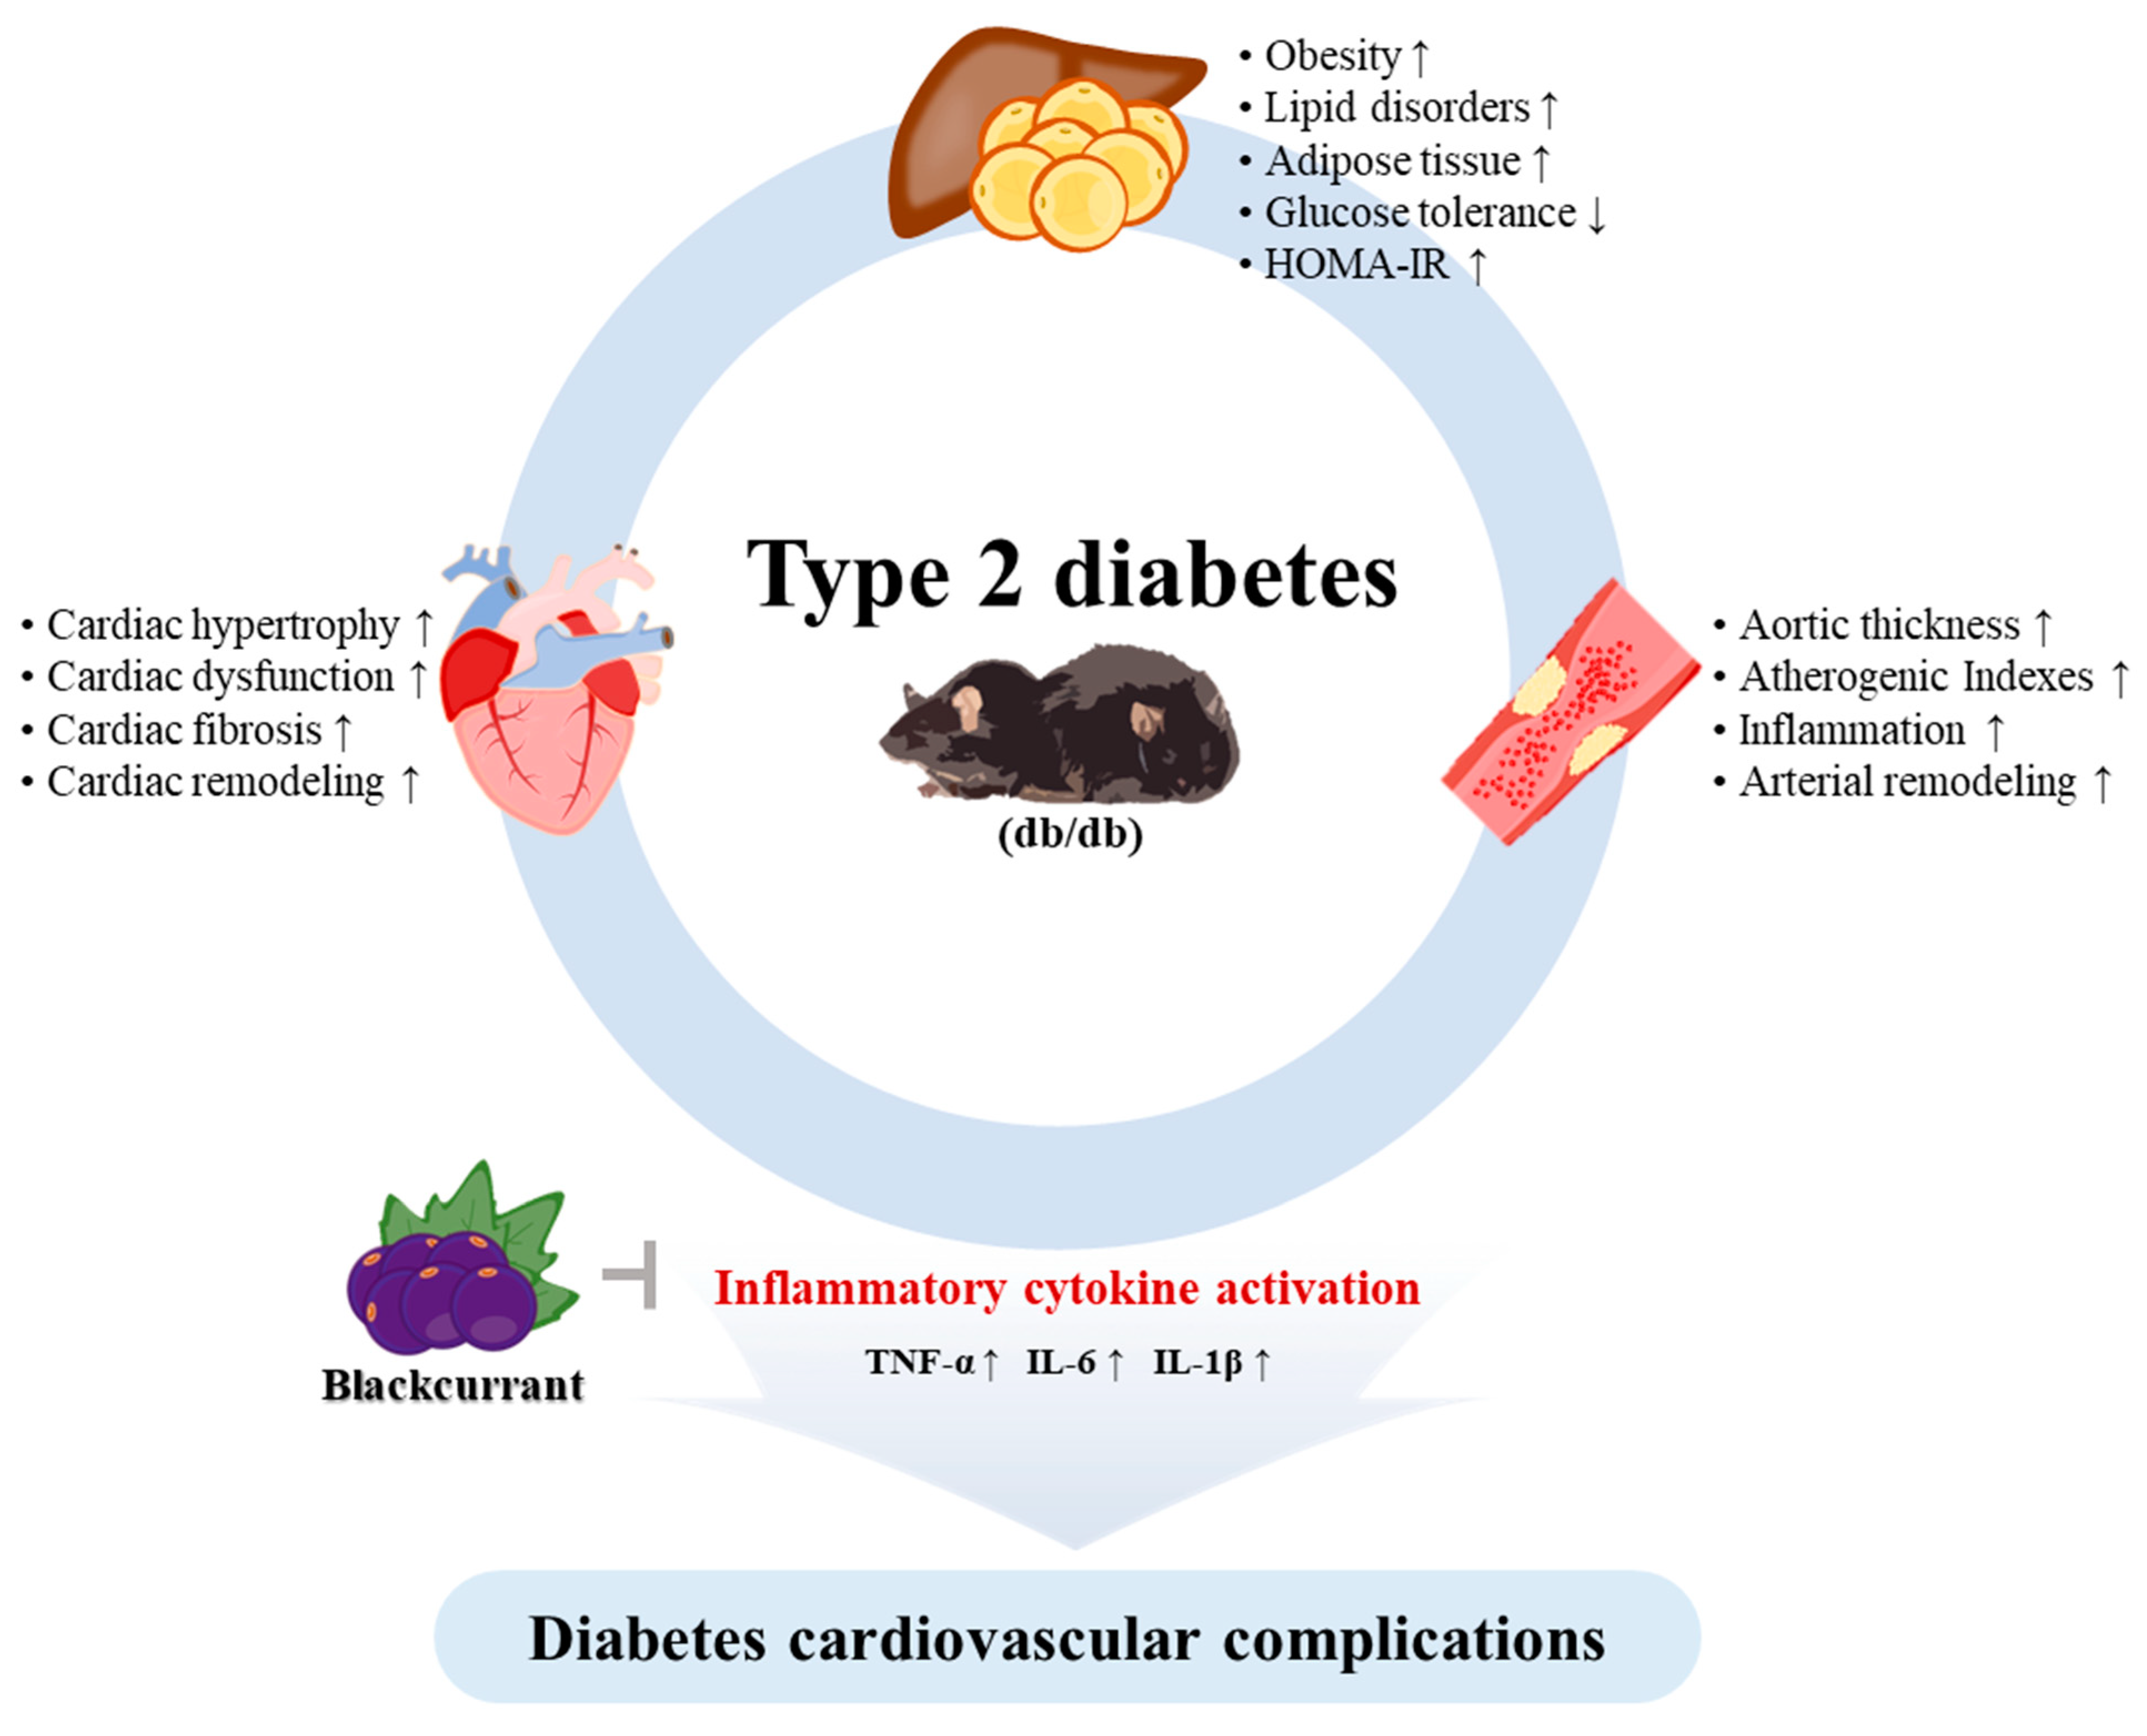
:1. Introduction
2. Materials and Methods
2.1. Blackcurrant Extraction
2.2. High-Performance Liquid Chromatography Analysis
2.3. Experimental Animals
2.4. Assessment of Insulin Resistance and Oral Glucose Tolerance Test
2.5. Echocardiographic Analysis
2.6. Determination of Lipid Profile and Atherogenic Indexes
2.7. Histological Analysis
2.8. Immunohistochemistry (IHC) Staining
2.9. Western Blot Analysis and Antibodies
2.10. Statistical Analyses
3. Results
3.1. HPLC Chromatograms of Quercetin-3-O-Glucuronide from Blackcurrant
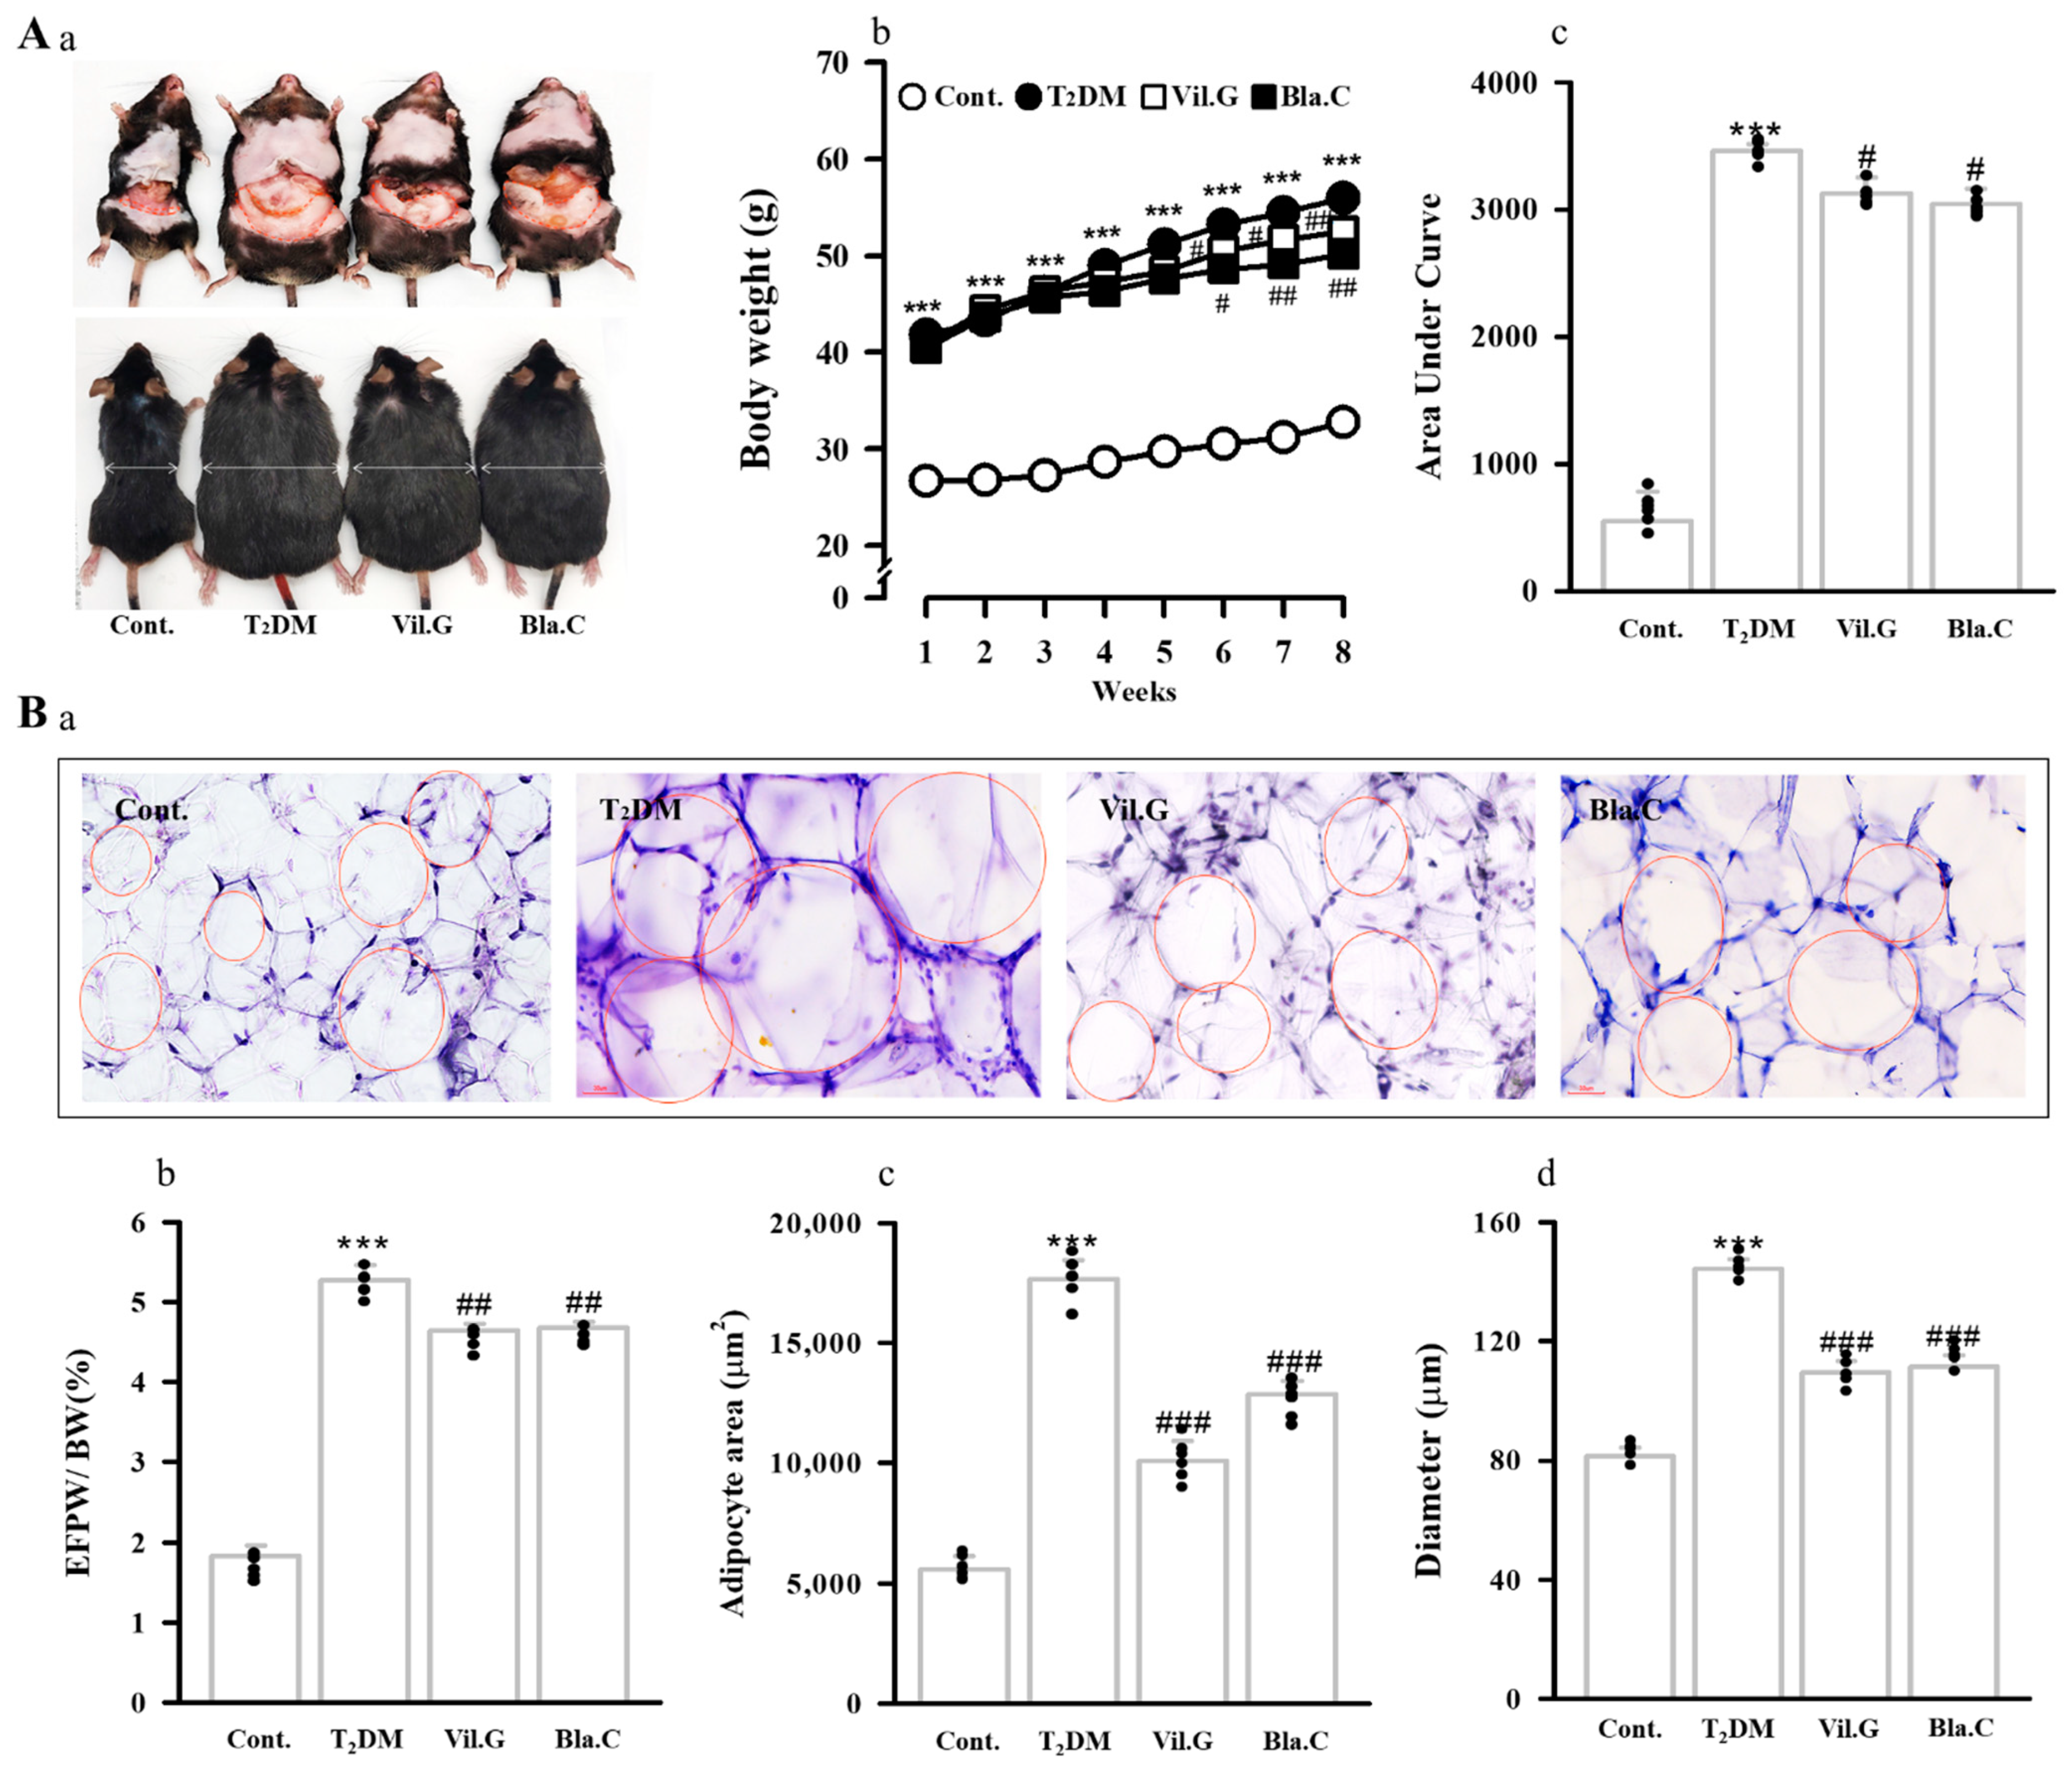
3.2. Effect of Blackcurrant on Obesity and Fat Improvement in Type 2 Diabetic Mice
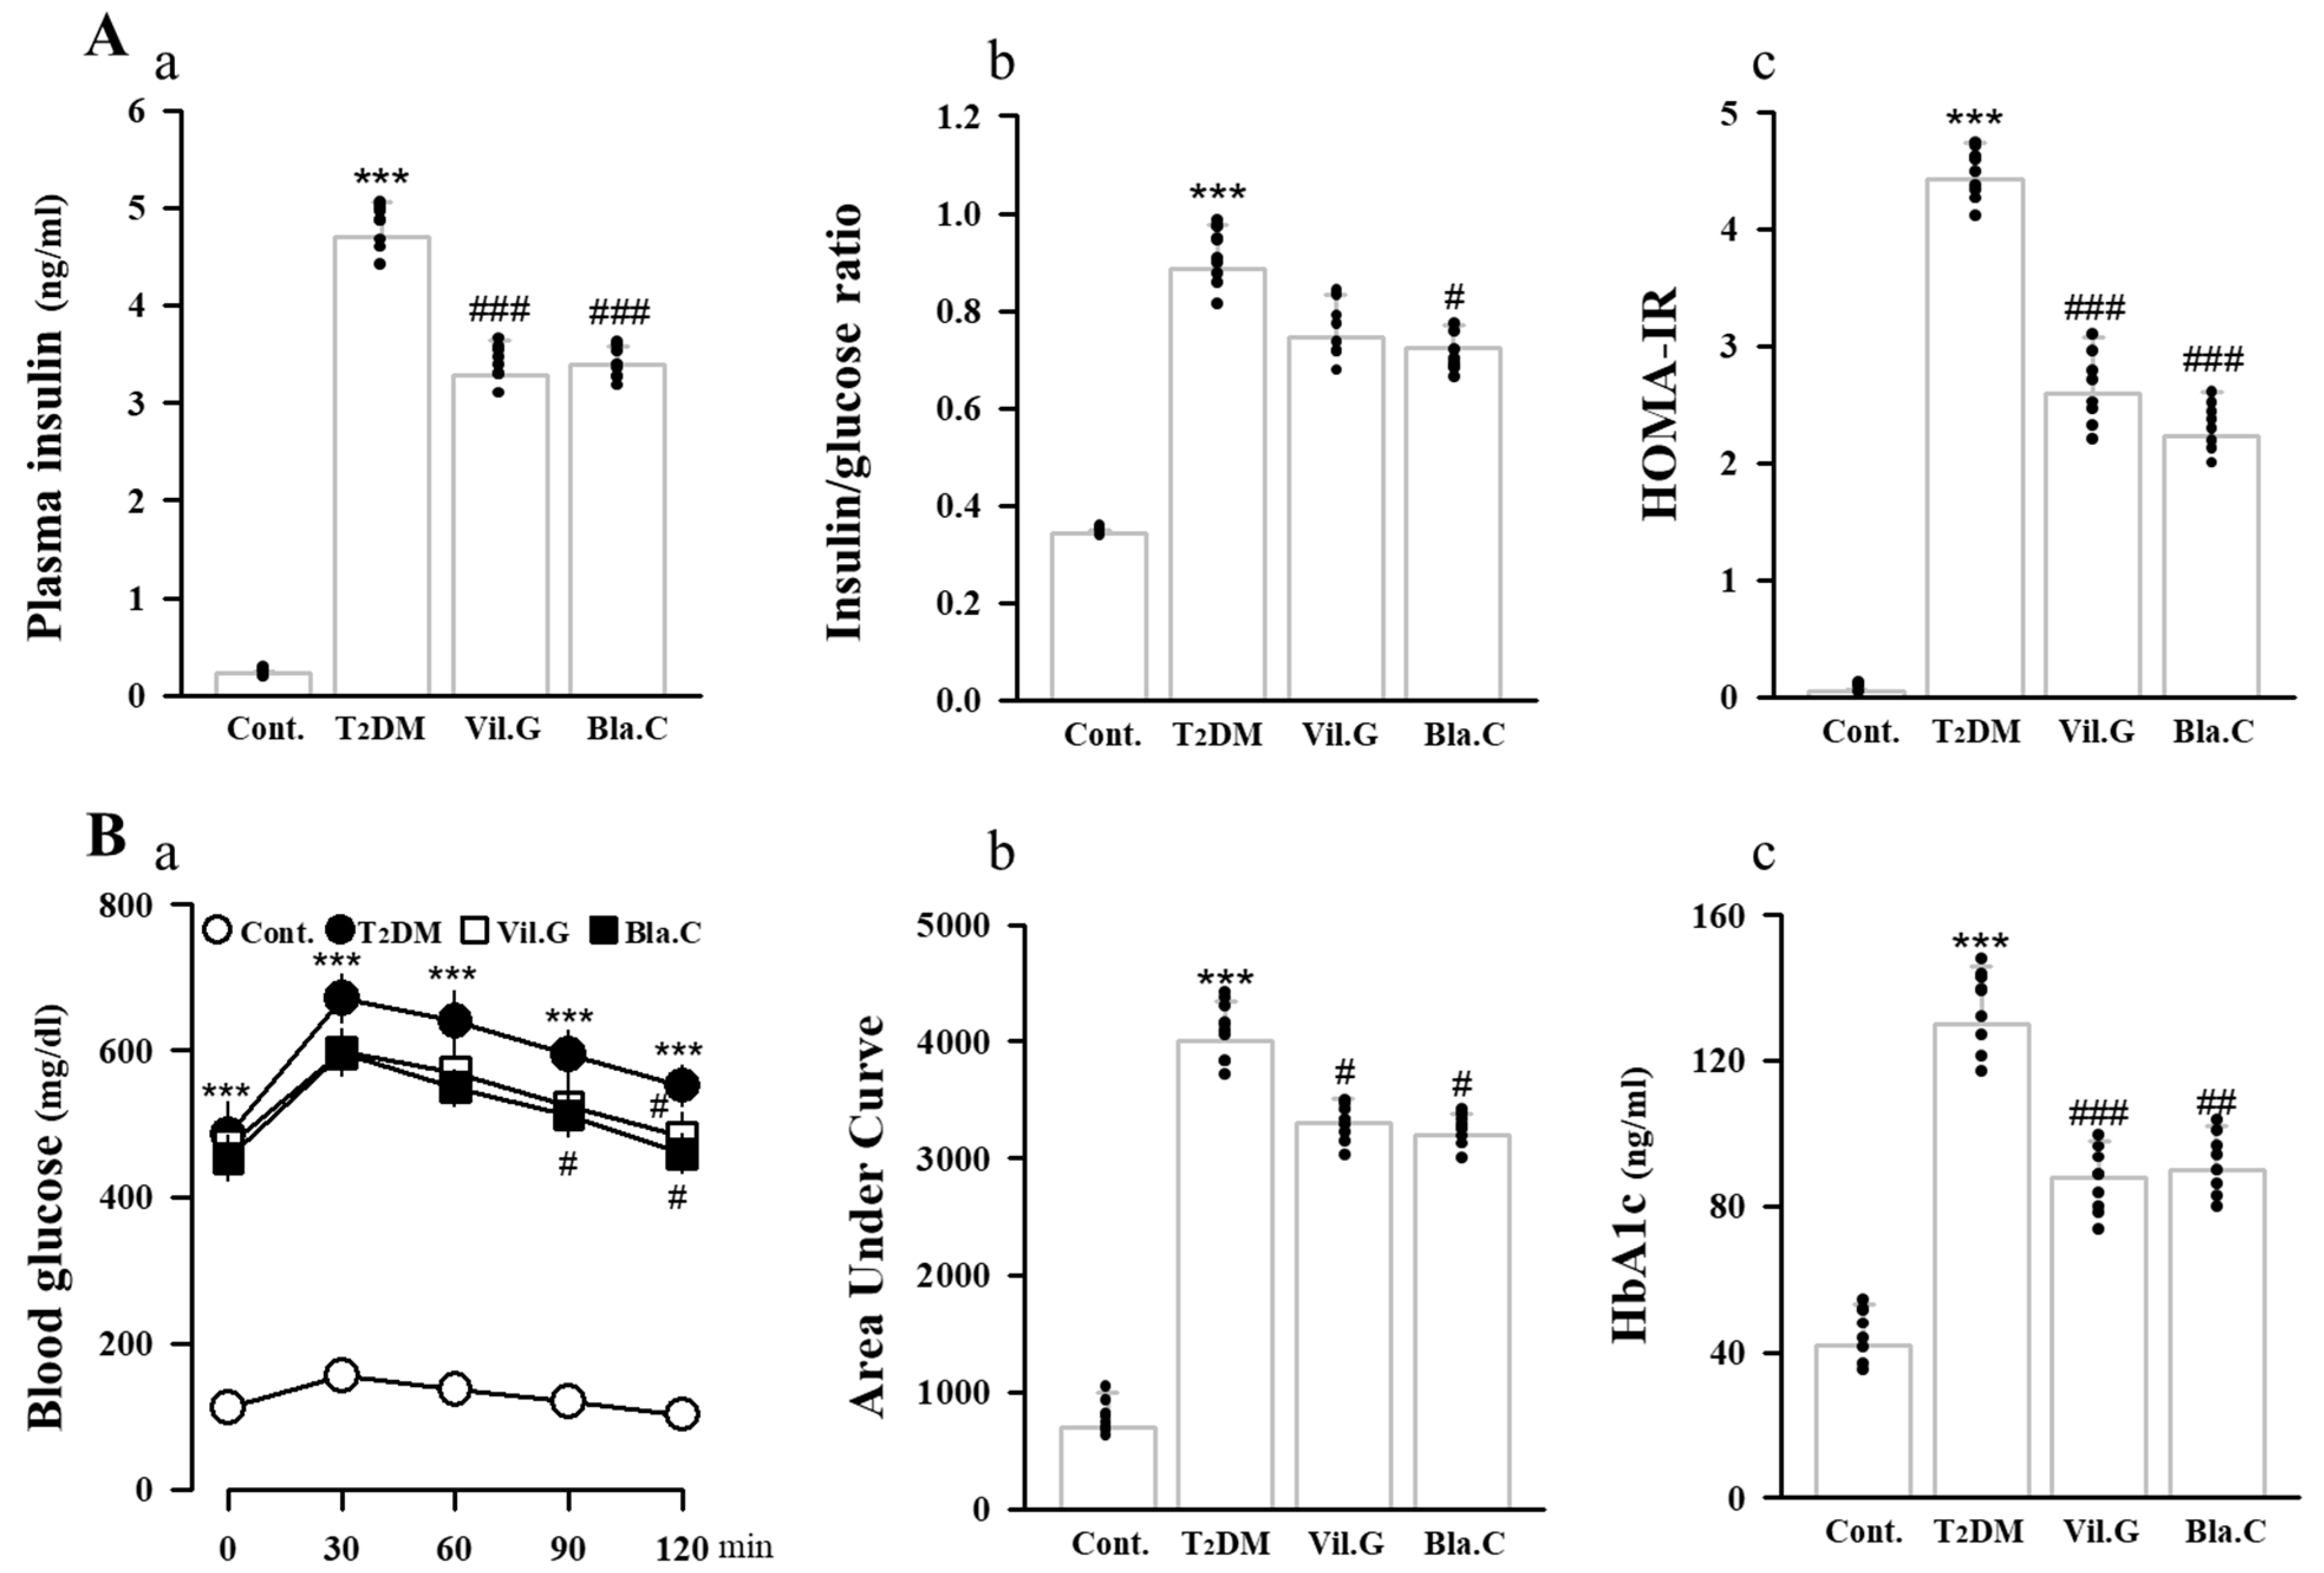
3.3. Blackcurrant Ameliorates Glucose Tolerance and Insulin Resistance in Type 2 Diabetes Mellitus Mice
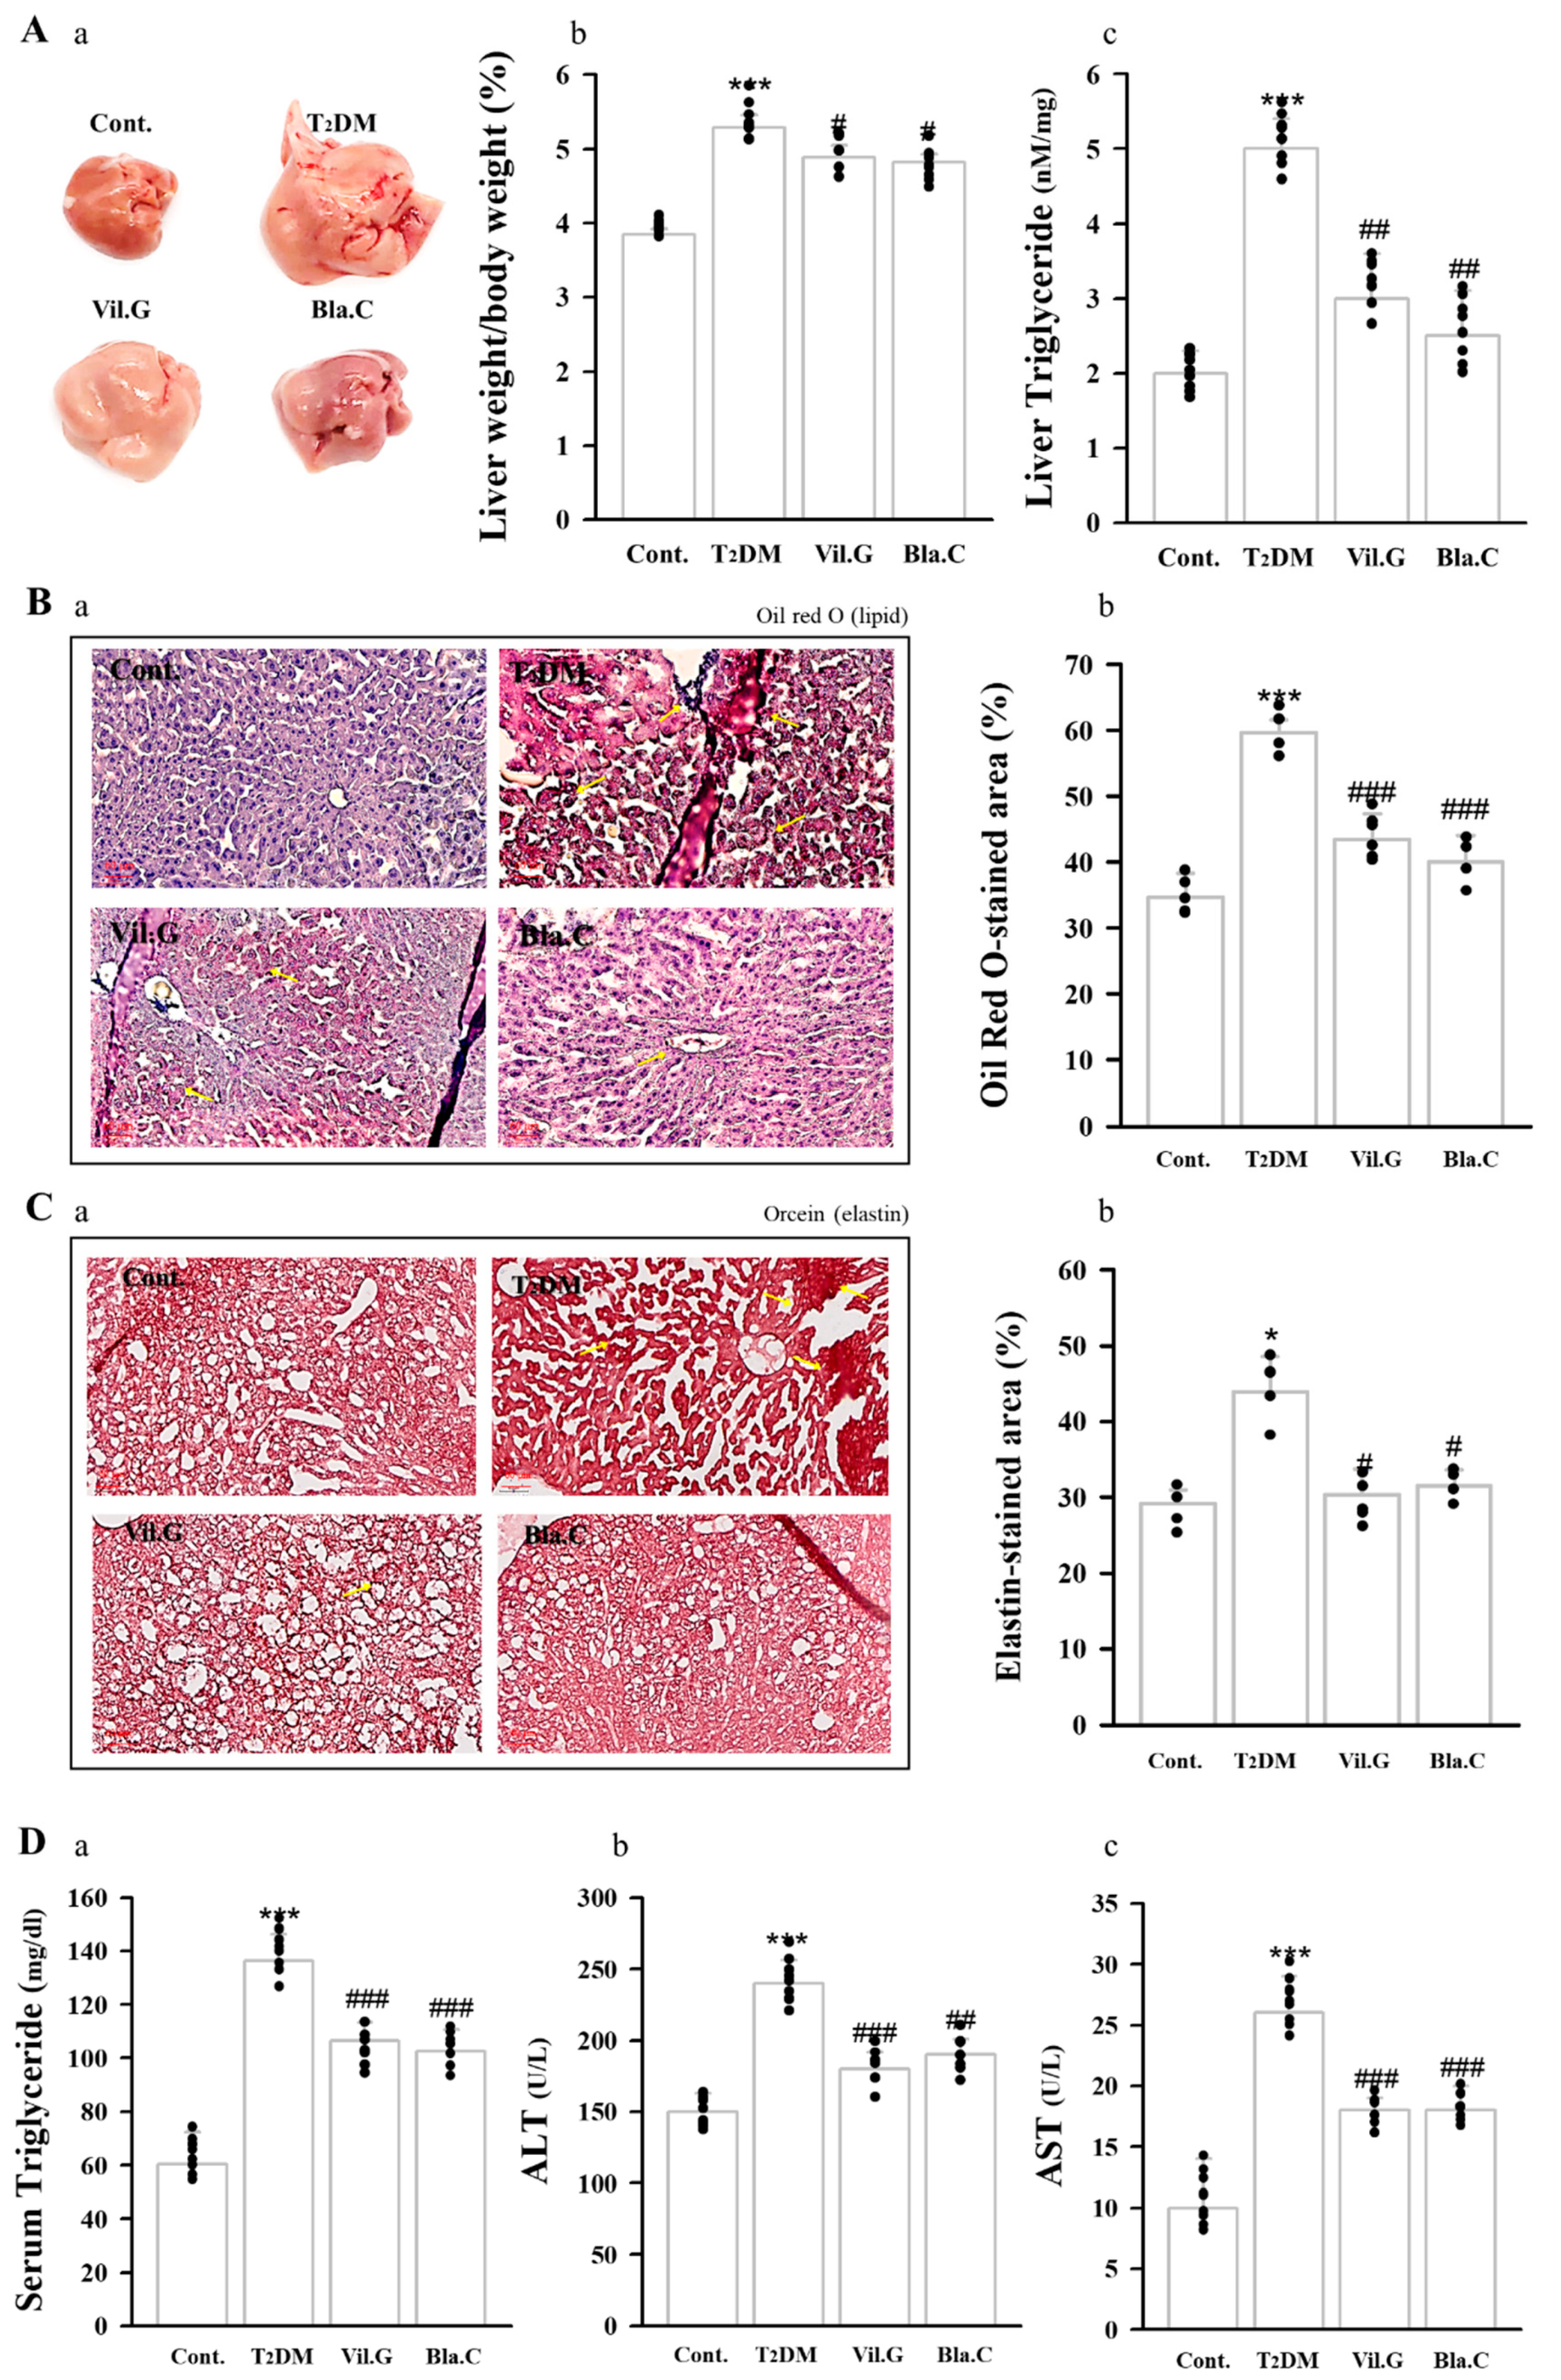
3.4. Blackcurrant Ameliorates Lipid Accumulation in the Liver
3.5. Blackcurrant Ameliorates Lipid Profile and Atherogenic Index Status in Type 2 Diabetes Mellitus Mice
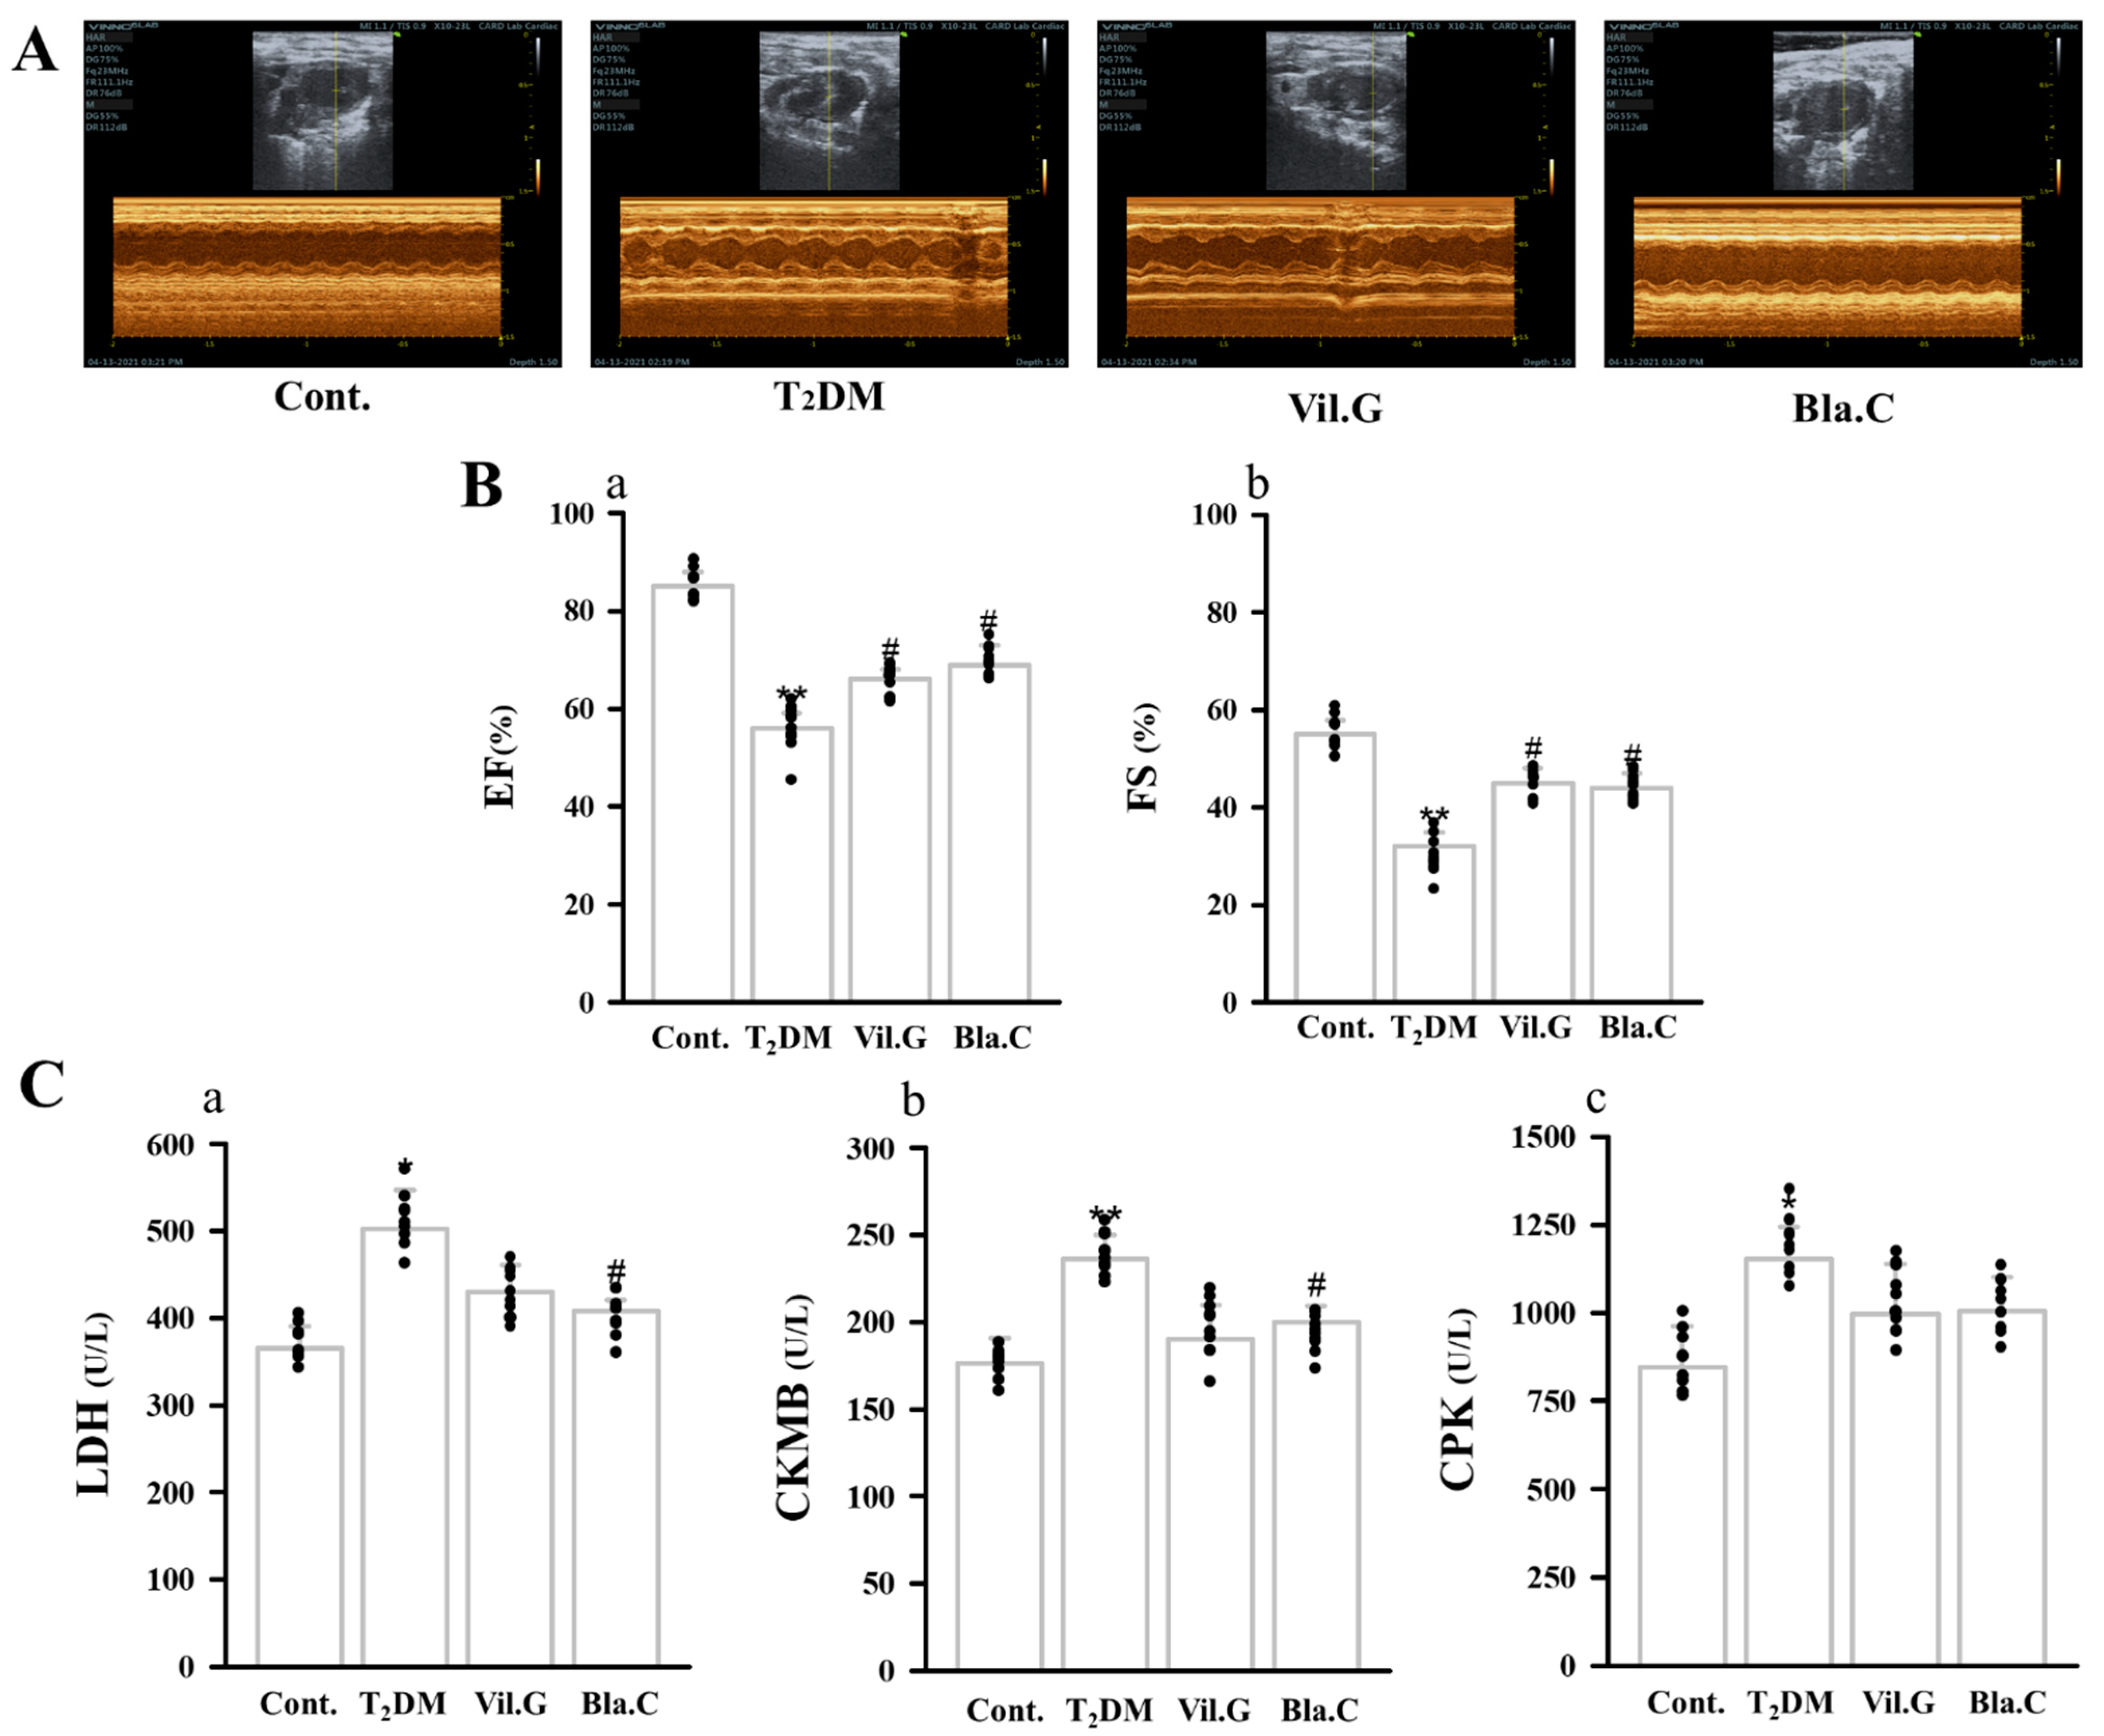
3.6. Blackcurrant Alleviates Cardiac Dysfunction in Type 2 Diabetes Mellitus Mice
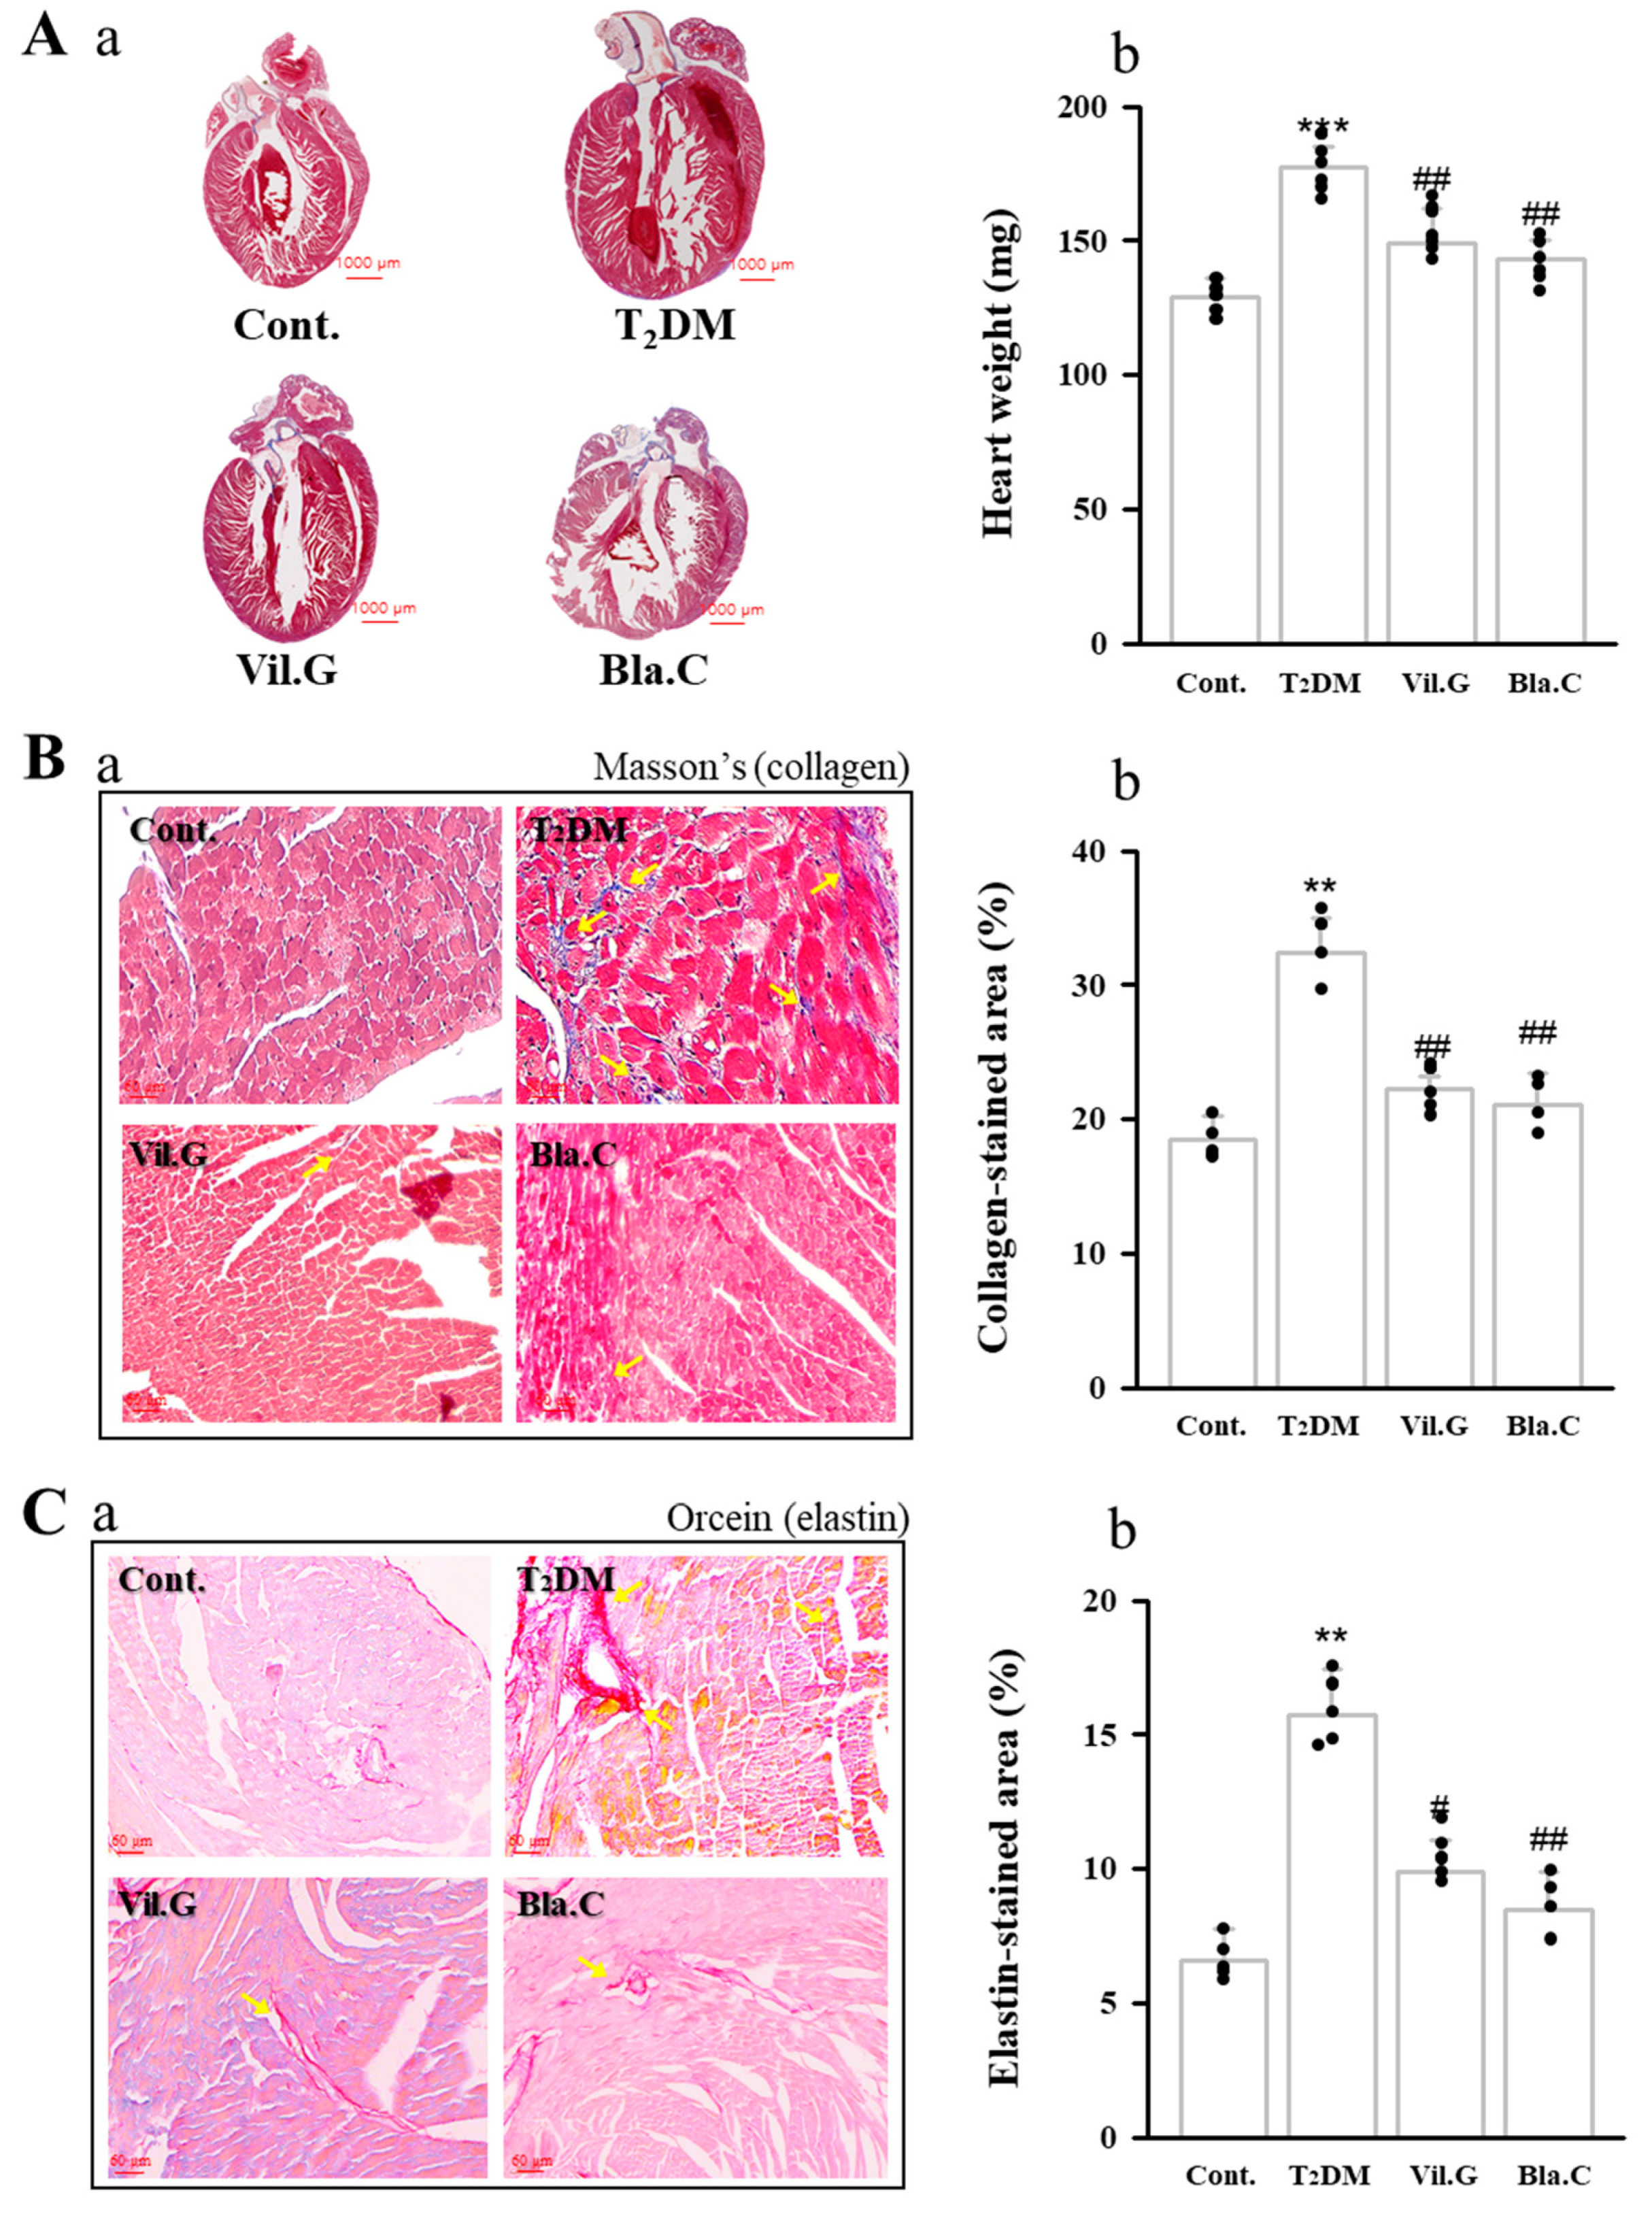
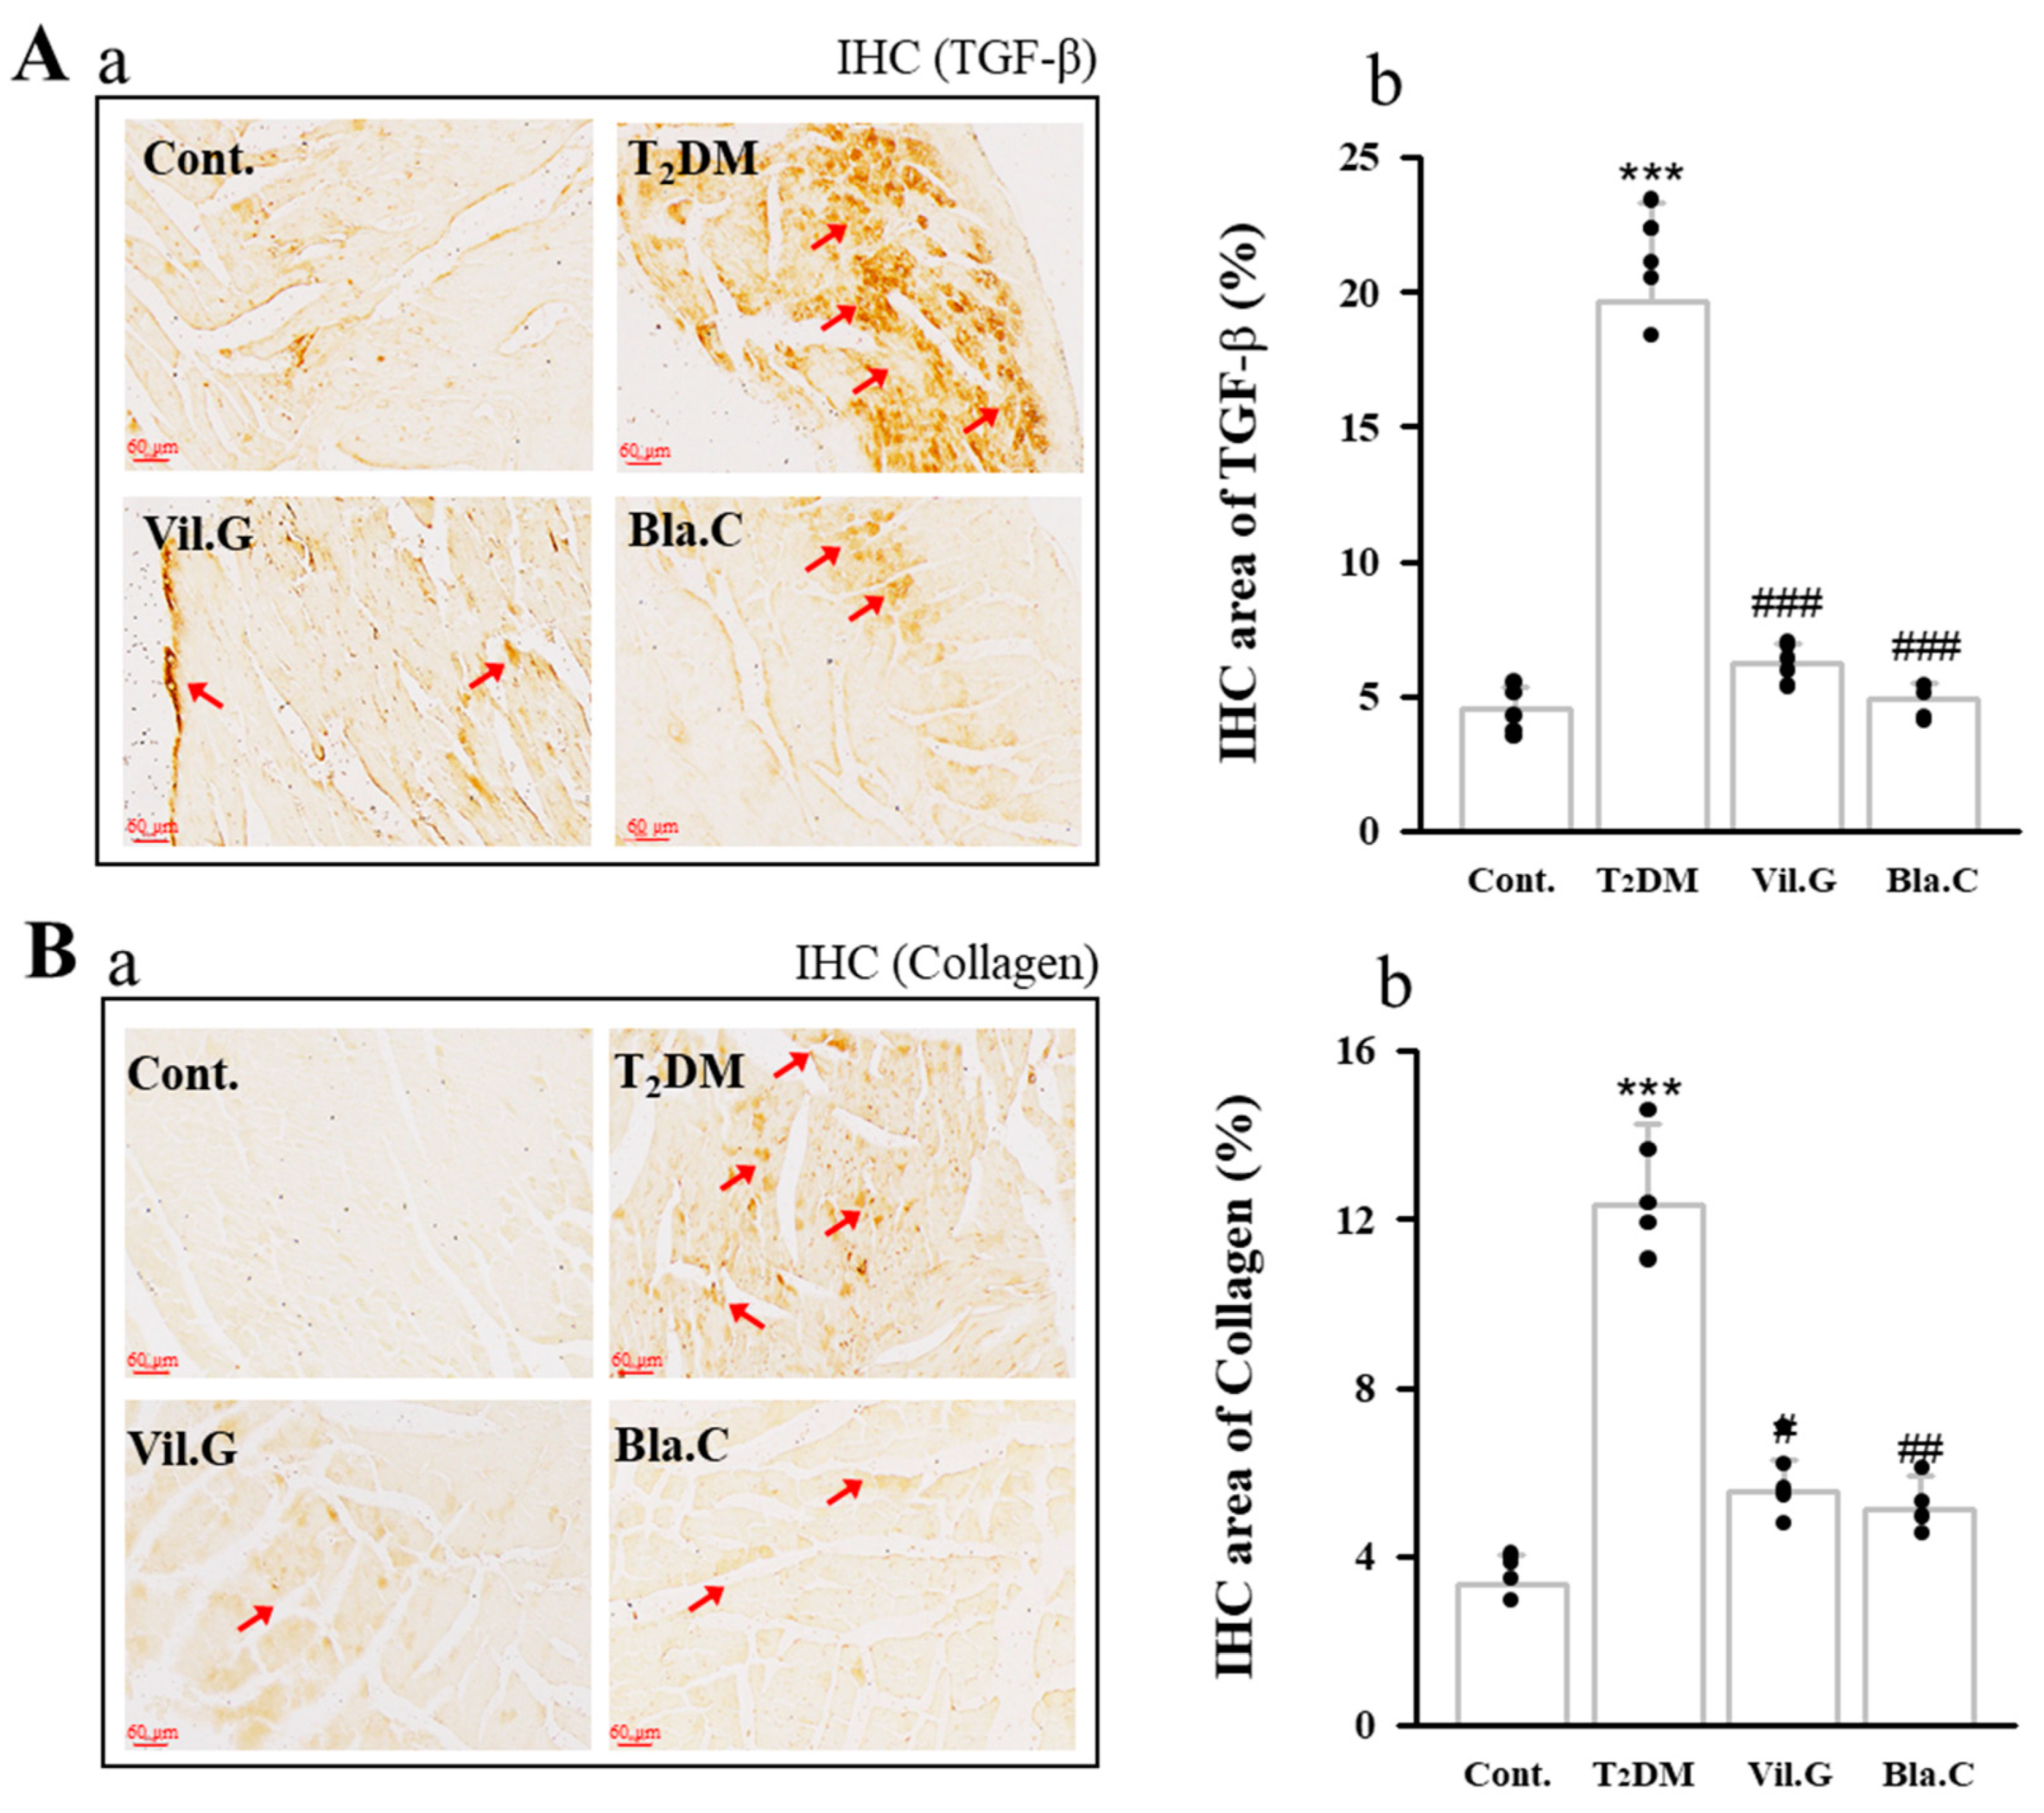
3.7. Effect of Blackcurrant on Cardiac Hypertrophy and Cardiovascular Fibrosis in Type 2 Diabetes Mellitus Mice
3.8. Effect of Blackcurrant on Vascular Fibrosis and Inflammation
4. Discussion
5. Conclusions
Author Contributions
Funding
Institutional Review Board Statement
Informed Consent Statement
Acknowledgments
Conflicts of Interest
References
- King, A.J. The use of animal models in diabetes research. Br. J. Pharmacol. 2012, 166, 877–894. [Google Scholar] [CrossRef] [Green Version]
- Meléndez, G.C.; McLarty, J.L.; Levick, S.; Du, Y.; Janicki, J.S.; Brower, G. Interleukin 6 Mediates Myocardial Fibrosis, Concentric Hypertrophy, and Diastolic Dysfunction in Rats. Hypertension 2010, 56, 225–231. [Google Scholar] [CrossRef] [Green Version]
- Bertoni, A.G.; Hundley, W.G.; Massing, M.W.; Bonds, D.E.; Burke, G.L.; Goff, D.C. Heart Failure Prevalence, Incidence, and Mortality in the Elderly with Diabetes. Diabetes Care 2004, 27, 699–703. [Google Scholar] [CrossRef] [Green Version]
- Amos, A.F.; Mccarty, D.J.; Zimmet, P. The rising global burden of diabetes and its complications: Estimates and projections to the year 2010. Diabet. Med. 1997, 14, S7–S85. [Google Scholar] [CrossRef]
- Boudina, S.; Abel, E.D. Diabetic Cardiomyopathy Revisited. Circulation 2007, 115, 3213–3223. [Google Scholar] [CrossRef] [PubMed]
- Mönkemann, H.; De Vriese, A.S.; Blom, H.J.; Kluijtmans, L.A.J.; Heil, S.G.; Schild, H.H.; Golubnitschaja, O. Early molecular events in the development of the diabetic cardiomyopathy. Amino Acids 2002, 23, 331–336. [Google Scholar] [CrossRef]
- Strain, W.D.; Paldanius, P. Diabetes, cardiovascular disease and the microcirculation. Cardiovasc. Diabetol. 2018, 17, 57. [Google Scholar] [CrossRef] [PubMed] [Green Version]
- Petrie, J.; Guzik, T.J.; Touyz, R.M. Diabetes, Hypertension, and Cardiovascular Disease: Clinical Insights and Vascular Mechanisms. Can. J. Cardiol. 2017, 34, 575–584. [Google Scholar] [CrossRef] [Green Version]
- Saltiel, A.R.; Olefsky, J.M. Inflammatory mechanisms linking obesity and metabolic disease. J. Clin. Investig. 2017, 127, 1–4. [Google Scholar] [CrossRef] [PubMed]
- Nakamura, K.; Fuster, J.J.; Walsh, K. Adipokines: A link between obesity and cardio-vascular disease. J. Cardiol. 2014, 63, 250–259. [Google Scholar] [CrossRef] [Green Version]
- Mahmoud, F.; Al-Ozairi, E. Inflammatory Cytokines and the Risk of Cardiovascular Complications in Type 2 Diabetes. Dis. Markers 2013, 35, 235–241. [Google Scholar] [CrossRef] [Green Version]
- Pollack, R.M.; Donath, M.Y.; Leroith, D.; Leibowitz, G. Anti-inflammatory Agents in the Treatment of Diabetes and Its Vascular Complications. Diabetes Care 2016, 39 (Suppl. 2), S244–S252. [Google Scholar] [CrossRef] [Green Version]
- Mijan, M.A.; Lim, B.O. Diets, functional foods, and nutraceuticals as alternative therapies for inflammatory bowel disease: Present status and future trends. World J. Gastroenterol. 2018, 24, 2673–2685. [Google Scholar] [CrossRef] [PubMed]
- Ruscica, M.; Penson, P.E.; Ferri, N.; Sirtori, C.R.; Pirro, M.; Mancini, G.J.; Sattar, N.; Toth, P.P.; Sahebkar, A.; Lavie, C.J.; et al. Impact of nutraceuticals on markers of systemic inflammation: Potential relevance to cardiovascular diseases—A position paper from the International Lipid Expert Panel (ILEP). Prog. Cardiovasc. Dis. 2021, 67, 40–52. [Google Scholar] [CrossRef]
- Tilg, H.; Hotamisligil, G.S. Nonalcoholic Fatty Liver Disease: Cytokine-Adipokine Interplay and Regulation of Insulin Resistance. Gastroenterology 2006, 131, 934–945. [Google Scholar] [CrossRef] [PubMed] [Green Version]
- Cortez, R.E.; Gonzalez de Mejia, E. Blackcurrants (Ribes nigrum): A Review on Chemistry, Processing, and Health Benefits. J. Food Sci. 2019, 84, 2387–2401. [Google Scholar] [CrossRef] [Green Version]
- Bishayee, A.; Mbimba, T.; Thoppil, R.J.; Háznagy-Radnai, E.; Sipos, P.; Darvesh, A.S.; Folkesson, H.G.; Hohmann, J. Anthocyanin-rich black currant (Ribes nigrum L.) extract affords chemoprevention against diethylnitrosamine-induced hepatocellular carcinogenesis in rats. J. Nutr. Biochem. 2011, 22, 1035–1046. [Google Scholar] [CrossRef] [PubMed]
- Thoppil, R.J.; Bhatia, D.; Barnes, K.F.; Haznagy-Radnai, E.; Hohmann, J.; Darvesh, A.S.; Bishayee, A. Black currant anthocyanins abrogate oxidative stress through Nrf2-mediated antioxidant mechanisms in a rat model of hepatocellular carcinoma. Curr. Cancer Drug Targets 2012, 12, 1244–1257. [Google Scholar]
- Ambrożewicz, E.; Augustyniak, A.; Gęgotek, A.; Bielawska, K.; Skrzydlewska, E. Black-Currant Protection Against Oxidative Stress Formation. J. Toxicol. Environ. Health Part. A 2013, 76, 1293–1306. [Google Scholar] [CrossRef]
- Keßler, T.; Jansen, B.; Hesse, A. Effect of blackcurrant-, cranberry- and plum juice consumption on risk factors associated with kidney stone formation. Eur. J. Clin. Nutr. 2002, 56, 1020–1023. [Google Scholar] [CrossRef] [Green Version]
- Kim, S.S.; Margaret, M.W.; Deborah, H.; Krista, T.; Joanne, M.R.; Marva, I.S.; Katherine, T.G.P.; Aidar, R.G. Effect of Blueberry Consumption on Cardiometabolic Health Parameters in Men with Type 2 Diabetes: An 8-Week, Double-Blind, Randomized, Placebo-Controlled Trial. Curr. Dev. Nutr. 2020, 4, nzaa030. [Google Scholar]
- Park, J.H.; Kho, M.C.; Kim, H.Y.; Ahn, Y.M.; Lee, Y.J.; Kang, D.G.; Lee, H.S. Blackcurrant Suppresses Metabolic Syndrome Induced by High-Fructose Diet in Rats. Evid.-Based Complement. Altern. Med. 2015, 2015, 385976. [Google Scholar] [CrossRef] [Green Version]
- Matthews, D.R.; Hosker, J.P.; Rudenski, A.S.; Naylor, B.A.; Treacher, D.F.; Turner, R.C. Homeostasis model assessment: Insulin resistance and beta-cell function from fasting plasma glucose and insulin concentrations in man. Diabetologia 1985, 28, 412–419. [Google Scholar] [CrossRef] [Green Version]
- Ikewuchi, J.C.; Ikewuchi, J.C. Alteration of plasma lipid profiles and atherogenic indeces by Stachytarpheta iamaicensis L. (Vahl). Biokemistri 2009, 21, 71–77. [Google Scholar]
- Ahmadvand, H.; Ghasemi-Dehnoo, M. Antiatherogenic, hepatoprotective, and hypolipidemic effects of coenzyme Q10 in alloxan-induced type 1 diabetic rats. ARYA Atheroscler. 2014, 10, 192–198. [Google Scholar] [PubMed]
- Ahmadvand, H.; Noori, A.; Dehnoo, M.G.; Bagheri, S.; Cheraghi, R.A. Hypoglycemic, hypolipidemic and antiatherogenic effects of oleuropein in alloxan-induced Type 1 diabetic rats. Asian Pac. J. Trop. Dis. 2014, 4, S421–S425. [Google Scholar] [CrossRef]
- Korzenszky, P.; Molnár, E. Examination of heat treatments at preservation of grape must. Potravin. Slovak J. Food Sci. 2014, 8. [Google Scholar] [CrossRef]
- León-González, A.J.; Sharif, T.; Kayali, A.; Abbas, M.; Dandache, I.; Etienne-Selloum, N.; Kevers, C.; Pincemail, J.; Auger, C.; Chabert, P.; et al. Delphinidin-3-O-glucoside and delphinidin-3-O-rutinoside mediate the redox-sensitive caspase 3-related pro-apoptotic effect of blackcurrant juice on leukaemia Jurkat cells. J. Funct. Foods 2015, 17, 847–856. [Google Scholar] [CrossRef]
- Benge, C.D.; Markley, B.; McFarland, M.S. Role of Aggressive LDL Reduction in Patients with Coronary Heart Disease. South. Med. J. 2012, 105, 48–55. [Google Scholar] [CrossRef] [PubMed]
- Samuel, V.T.; Shulman, G.I. Mechanisms for Insulin Resistance: Common Threads and Missing Links. Cell 2012, 148, 852–871. [Google Scholar] [CrossRef] [Green Version]
- Hummel, K.P.; Dickie, M.M.; Coleman, D.L. Diabetes, a New Mutation in the Mouse. Science 1966, 153, 1127–1128. [Google Scholar] [CrossRef]
- Naresh, N.K.; Butcher, J.T.; Lye, R.J.; Chen, X.; Isakson, B.E.; Gan, L.-M.; Kramer, C.M.; Annex, B.H.; Epstein, F.H. Cardiovascular magnetic resonance detects the progression of impaired myocardial perfusion reserve and increased left-ventricular mass in mice fed a high-fat diet. J. Cardiovasc. Magn. Reson. 2016, 18, 53. [Google Scholar] [CrossRef] [Green Version]
- Piattini, F.; Le Foll, C.; Kisielow, J.; Rosenwald, E.; Nielsen, P.; Lutz, T.; Schneider, C.; Kopf, M. A spontaneous leptin receptor point mutation causes obesity and differentially affects leptin signaling in hypothalamic nuclei resulting in metabolic dysfunctions distinct from db/db mice. Mol. Metab. 2019, 25, 131–141. [Google Scholar] [CrossRef] [PubMed]
- Stern, J.H.; Rutkowski, J.M.; Scherer, P.E. Adiponectin, Leptin, and Fatty Acids in the Maintenance of Metabolic Homeostasis through Adipose Tissue Crosstalk. Cell Metab. 2016, 23, 770–784. [Google Scholar] [CrossRef] [PubMed] [Green Version]
- Virtue, S.; Vidal-Puig, A. GTTs and ITTs in mice: Simple tests, complex answers. Nat. Metab. 2021, 3, 883–886. [Google Scholar] [CrossRef] [PubMed]
- Clifton, P. Metabolic Syndrome—Role of Dietary Fat Type and Quantity. Nutrients 2019, 11, 1438. [Google Scholar] [CrossRef] [Green Version]
- Gamboa, C.M.; Safford, M.M.; Levitan, E.B.; Mann, D.M.; Yun, H.; Glasser, S.P.; Woolley, J.M.; Rosenson, R.; Farkouh, M.; Muntner, P. Statin underuse and low prevalence of LDL-C control among U.S. adults at high risk of coronary heart disease. Am. J. Med. Sci. 2014, 348, 108–114. [Google Scholar] [CrossRef] [PubMed] [Green Version]
- Landmesser, U. Coronary artery disease: HDL and coronary heart disease—Novel insights. Nat. Rev. Cardiol. 2014, 11, 559–560. [Google Scholar] [CrossRef]
- Baliarsingh, S.; Sharma, N.; Mukherjee, R. Serum uric acid: Marker for atherosclerosis as it is positively associated with “atherogenic index of plasma”. Arch. Physiol. Biochem. 2012, 119, 27–31. [Google Scholar] [CrossRef]
- Wallace, T.M.; Levy, J.C.; Matthews, D.R. Use and Abuse of HOMA Modeling. Diabetes Care 2004, 27, 1487–1495. [Google Scholar] [CrossRef] [Green Version]
- Lyons, T.J.; Basu, A. Biomarkers in diabetes: Hemoglobin A1c, vascular and tissue markers. Transl. Res. 2012, 159, 303–312. [Google Scholar] [CrossRef] [PubMed] [Green Version]
- Nichols, G.A.; Gullion, C.M.; Koro, C.E.; Ephross, S.A.; Brown, J.B. The Incidence of Congestive Heart Failure in Type 2 Diabetes: An update. Diabetes Care 2004, 27, 1879–1884. [Google Scholar] [CrossRef] [Green Version]
- Escaneda, J.; Colmenáreza, H.; Ferrera, M.C.; Gutiérreza, M.; Quevedoa, P.J.; Hernándeza, R.; Alfonsoa, F.; Bañuelosa, C.; de Islaa, L.P.; Zamoranoa, J.L.; et al. Diastolic dysfunction in diabetic patients assessed with Doppler echocardiography: Relationship with coronary atherosclerotic burden and microcirculatory impairment. Rev. Esp. Cardiol. 2009, 62, 1395–1403. [Google Scholar] [CrossRef]
- Johari, T.Y.; Ghoneim, M.A.; Moselhy, S.S. Thyroid profile and LDH Isoenzymes as prognostic biomarkers for diabetic and/or obese subjects. Afr. Health Sci. 2018, 18, 697–706. [Google Scholar] [CrossRef]
- Ye, Y.; Birnbaum, Y.; Widen, S.G.; Zhang, Z.; Zhu, S.; Bajaj, M.; Chen, H. Acupuncture Reduces Hypertrophy and Cardiac Fibrosis, and Improves Heart Function in Mice with Diabetic Cardiomyopathy. Cardiovasc. Drugs Ther. 2020, 34, 835–848. [Google Scholar] [CrossRef]
- Donath, M.Y.; Shoelson, S.E. Type 2 diabetes as an inflammatory disease. Nat. Rev. Immunol. 2011, 11, 98–107. [Google Scholar] [CrossRef] [PubMed]
- Hotamisligil, G.S.; Peraldi, P.; Budavari, A.; Ellis, R.; White, M.F.; Spiegelman, B.M. IRS-1-Mediated Inhibition of Insulin Receptor Tyrosine Kinase Activity in TNF-alpha- and Obesity-Induced Insulin Resistance. Science 1996, 271, 665–670. [Google Scholar] [CrossRef] [PubMed]
- Miyazaki, Y.; Pipek, R.; Mandarino, L.J.; DeFronzo, R.A. Tumor necrosis factor α and insulin resistance in obese type 2 diabetic patients. Int. J. Obes. 2003, 27, 88–94. [Google Scholar] [CrossRef] [Green Version]
- Burke, S.J.; Stadler, K.; Lu, D.; Gleason, E.; Han, A.; Donohoe, D.R.; Collier, J.J. IL-1β reciprocally regulates chemokine and insulin secretion in pancreatic β cells via NF-κB. Am. J. Physiol. Endocrinol. Metab. 2015, 309, E715–E726. [Google Scholar] [CrossRef] [Green Version]
- Dobaczewski, M.; Chen, W.; Frangogiannis, N.G. Transforming growth factor (TGF)-β signaling in cardiac remodeling. J. Mol. Cell. Cardiol. 2011, 51, 600–606. [Google Scholar] [CrossRef] [Green Version]
- Wu, L.; Derynck, R. Essential role of TGF-beta signaling in glucose-induced cell hypertrophy. Dev. Cell 2009, 17, 35–48. [Google Scholar] [CrossRef] [PubMed] [Green Version]
- Talior-Volodarsky, I.; Connelly, K.A.; Arora, P.D.; Gullberg, D.; McCulloch, C.A. α11 integrin stimulates myofibroblast differentiation in diabetic cardiomyopathy. Cardiovasc. Res. 2012, 96, 265–275. [Google Scholar] [CrossRef] [PubMed] [Green Version]
- Cohen, M.P.; Lautenslager, G.T.; Shearman, C.W. Increased collagen IV excretion in diabetes. A marker of compromised filtration function. Diabetes Care 2001, 24, 914–918. [Google Scholar] [CrossRef] [PubMed] [Green Version]


| Parameters | Cont. | T2DM | Vil.G | Bla.C | ||||||||
|---|---|---|---|---|---|---|---|---|---|---|---|---|
| Cardiac risk ratio 1 (TC/HDL-C) | 1.217 | ± | 0.019 | 1.663 | ± | 0.086 ** | 1.298 | ± | 0.017 ## | 1.347 | ± | 0.080 ## |
| Cardiac risk ratio 2 (LDL-C/HDL-C) | 1.600 | ± | 0.054 | 2.504 | ± | 0.246 ** | 1.651 | ± | 0.095 ## | 1.398 | ± | 0.097 ## |
| Atherogenic coefficient (TC-HDL)/HDL-C | 0.217 | ± | 0.028 | 0.463 | ± | 0.096 *** | 0.298 | ± | 0.024 ### | 0.292 | ± | 0.026 ## |
| Atherogenic marker (TG/HDL-C ratio) | 0.885 | ± | 0.095 | 1.285 | ± | 0.182 *** | 1.138 | ± | 0.120 # | 1.038 | ± | 0.238 # |
| Atherogenic index log (TG/HDL-C) | 0.330 | ± | 0.046 | 0.475 | ± | 0.064 ** | 0.459 | ± | 0.040 # | 0.343 | ± | 0.038 ## |
| Characteristics | Cont. | T2DM | Vil.G | Bla.C | ||||||||
|---|---|---|---|---|---|---|---|---|---|---|---|---|
| LVEDV (mL) | 0.098 | ± | 0.013 | 0.185 | ± | 0.038 *** | 0.105 | ± | 0.012 ## | 0.121 | ± | 0.011 ## |
| LVESV (mL) | 0.013 | ± | 0.002 | 0.072 | ± | 0.020 *** | 0.018 | ± | 0.002 ### | 0.032 | ± | 0.009 ### |
| LVd Mass (g) | 0.109 | ± | 0.007 | 0.204 | ± | 0.040 *** | 0.106 | ± | 0.008 # | 0.111 | ± | 0.007 ## |
| LVIDd (mm) | 3.328 | ± | 0.134 | 4.017 | ± | 0.266 ** | 3.395 | ± | 0.126 ## | 3.609 | ± | 0.108 # |
| LVPWd (mm) | 1.038 | ± | 0.107 | 1.253 | ± | 0.107 ** | 0.893 | ± | 0.071 ## | 0.960 | ± | 0.050 ## |
Publisher’s Note: MDPI stays neutral with regard to jurisdictional claims in published maps and institutional affiliations. |
© 2021 by the authors. Licensee MDPI, Basel, Switzerland. This article is an open access article distributed under the terms and conditions of the Creative Commons Attribution (CC BY) license (https://creativecommons.org/licenses/by/4.0/).
Share and Cite
Kim, H.-Y.; Yoon, J.-J.; Lee, H.-K.; Tai, A.-L.; Lee, Y.-J.; Kim, D.-S.; Kang, D.-G.; Lee, H.-S. Blackcurrant Improves Diabetic Cardiovascular Dysfunction by Reducing Inflammatory Cytokines in Type 2 Diabetes Mellitus Mice. Nutrients 2021, 13, 4177. https://doi.org/10.3390/nu13114177
Kim H-Y, Yoon J-J, Lee H-K, Tai A-L, Lee Y-J, Kim D-S, Kang D-G, Lee H-S. Blackcurrant Improves Diabetic Cardiovascular Dysfunction by Reducing Inflammatory Cytokines in Type 2 Diabetes Mellitus Mice. Nutrients. 2021; 13(11):4177. https://doi.org/10.3390/nu13114177
Chicago/Turabian StyleKim, Hye-Yoom, Jung-Joo Yoon, Hyeon-Kyoung Lee, Ai-Lin Tai, Yun-Jung Lee, Dae-Sung Kim, Dae-Gill Kang, and Ho-Sub Lee. 2021. "Blackcurrant Improves Diabetic Cardiovascular Dysfunction by Reducing Inflammatory Cytokines in Type 2 Diabetes Mellitus Mice" Nutrients 13, no. 11: 4177. https://doi.org/10.3390/nu13114177
APA StyleKim, H.-Y., Yoon, J.-J., Lee, H.-K., Tai, A.-L., Lee, Y.-J., Kim, D.-S., Kang, D.-G., & Lee, H.-S. (2021). Blackcurrant Improves Diabetic Cardiovascular Dysfunction by Reducing Inflammatory Cytokines in Type 2 Diabetes Mellitus Mice. Nutrients, 13(11), 4177. https://doi.org/10.3390/nu13114177