
Trimester-Specific Reference Ranges for Saturated, Monounsaturated and Polyunsaturated Fatty Acids in Serum of Pregnant Women: A Cohort Study from the ECLIPSES Group

 , , ,
, , ,  and
and
Abstract
1. Introduction
2. Materials and Methods
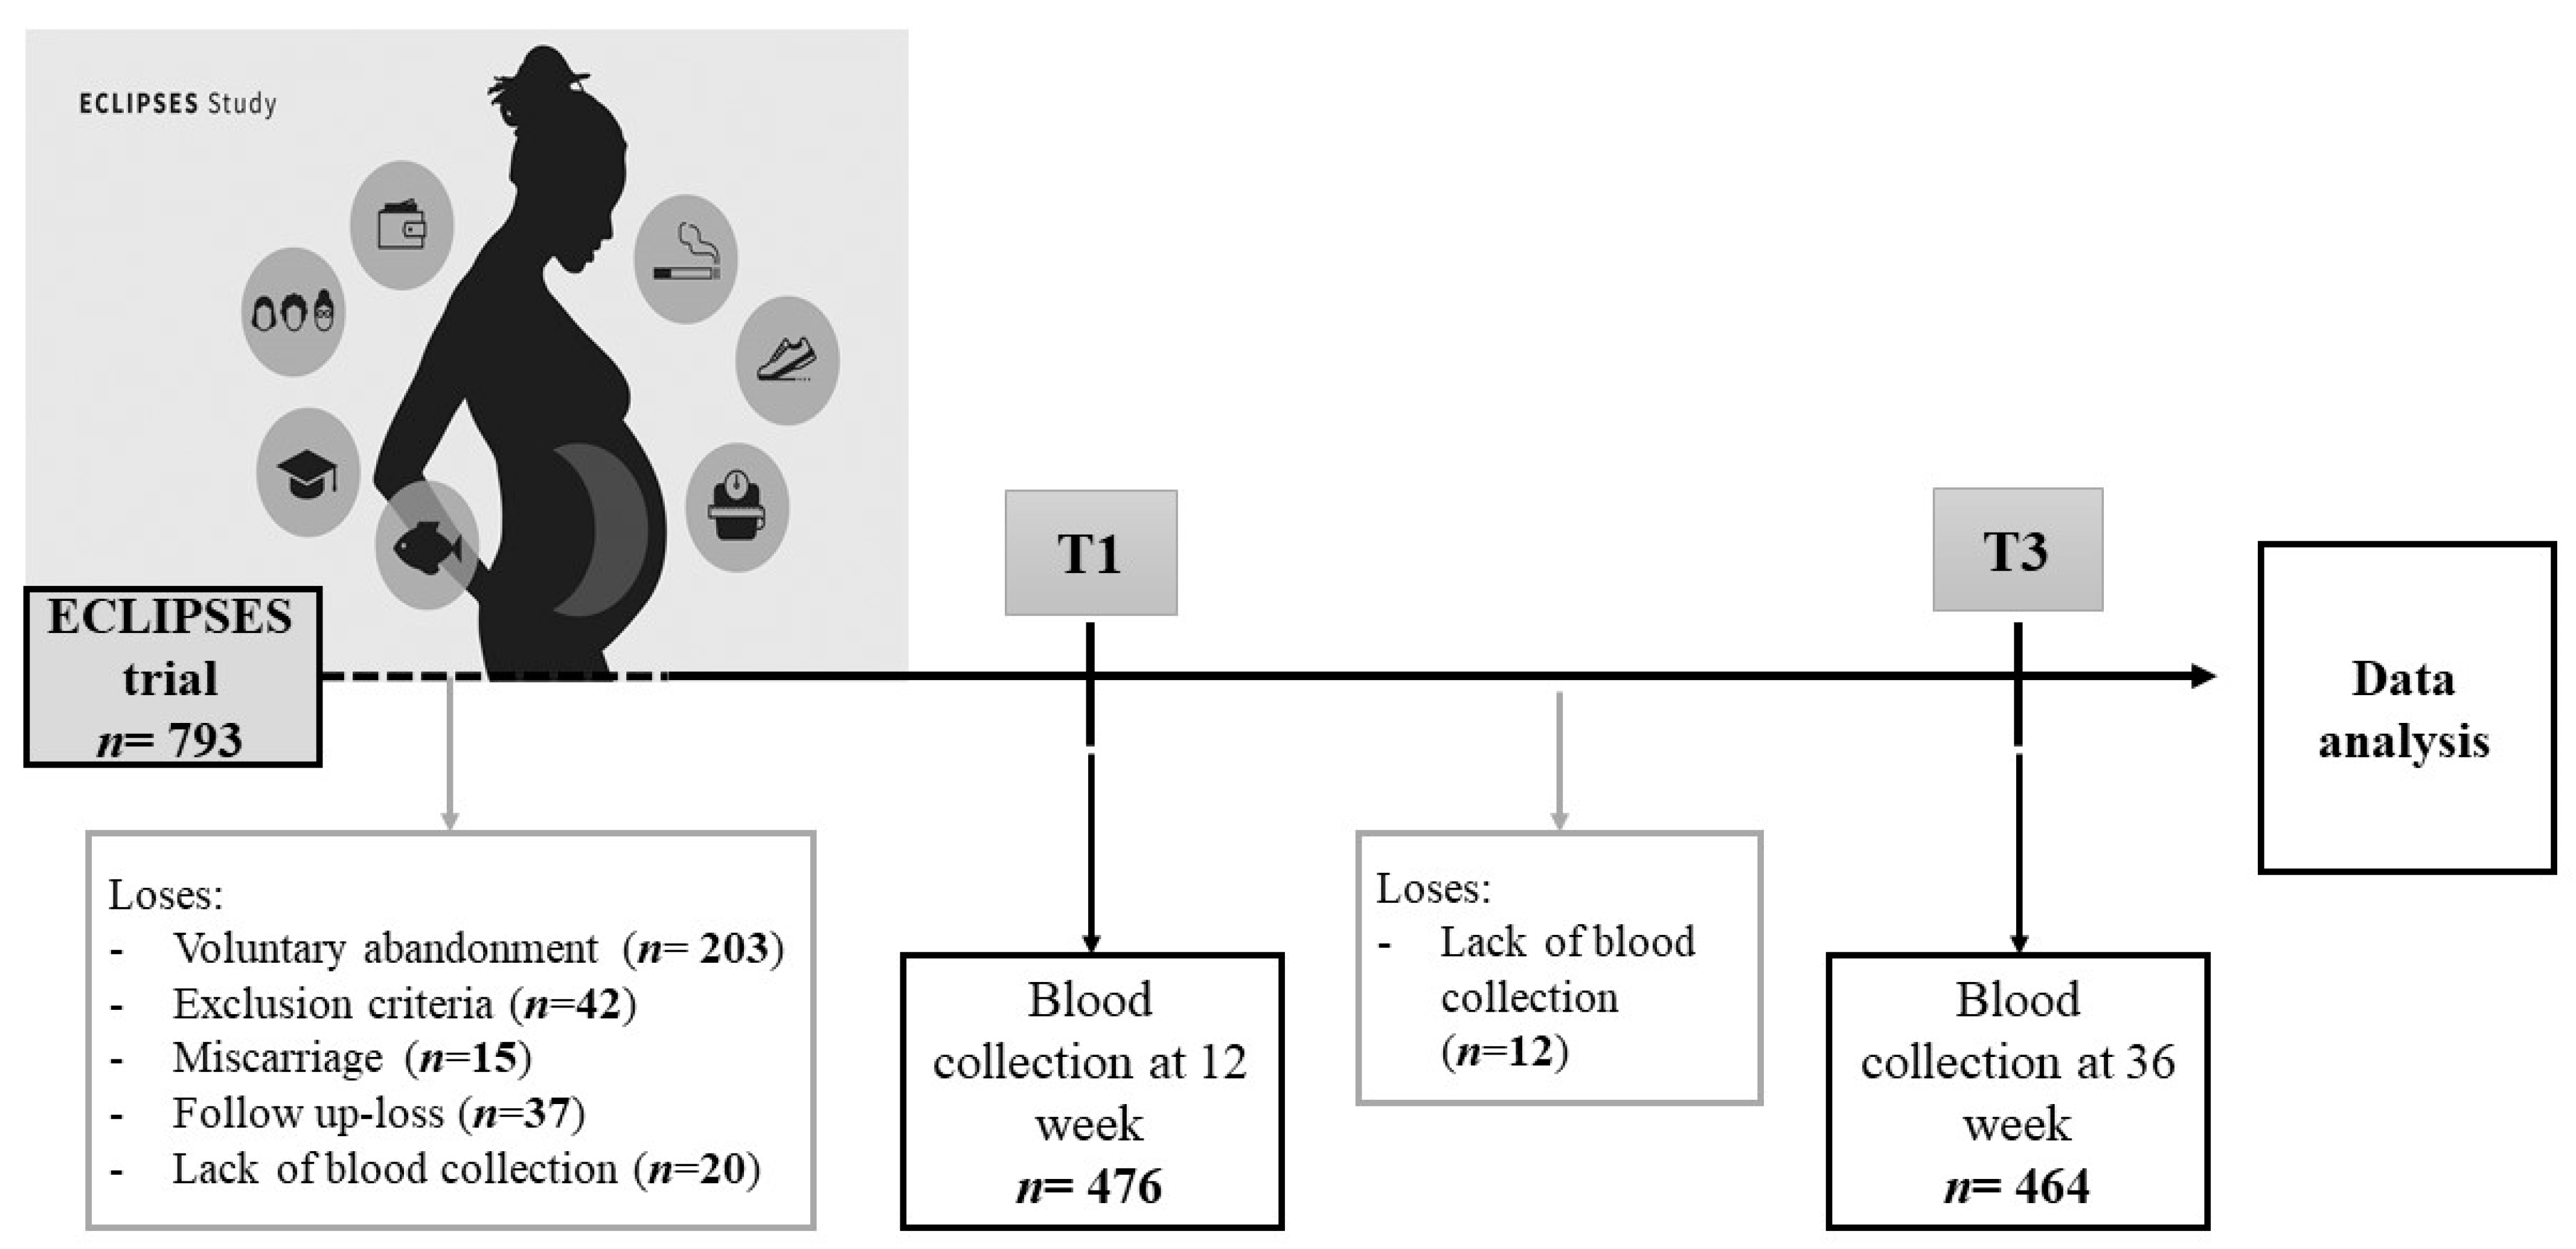
2.1. Population and Study Design
2.2. Sample Preparation and GC-MS Conditions
2.2.1. Extraction, Transfer and Storage of Biological Samples
2.2.2. Sample Preparation and GC-MS Conditions
2.3. Data Analysis
3. Results
3.1. Participants’ Characteristics
3.2. Fatty Acid Status in Serum of Pregnant Women
3.3. Influence of Maternal Factors on Fatty Acid Serum Profiles
4. Discussion
5. Conclusions
Supplementary Materials
Author Contributions
Funding
Institutional Review Board Statement
Informed Consent Statement
Data Availability Statement
Acknowledgments
Conflicts of Interest
References
- Mousa, A.; Naqash, A.; Lim, S. Macronutrient and micronutrient intake during pregnancy: An overview of recent evidence. Nutrients 2019, 11, 443. [Google Scholar] [CrossRef]
- Gernand, A.D.; Schulze, K.J.; Stewart, C.P.; West, K.P.; Christian, P. Micronutrient deficiencies in pregnancy worldwide: Health effects and prevention. Nat. Rev. Endocrinol. 2016, 12, 274–289. [Google Scholar] [CrossRef] [PubMed]
- Haggarty, P. Effect of placental function on fatty acid requirements during pregnancy. Eur. J. Clin. Nutr. 2004, 58, 1559–1570. [Google Scholar] [CrossRef] [PubMed]
- Hoge, A.; Tabar, V.; Donneau, A.-F.; Dardenne, N.; Degée, S.; Timmermans, M.; Nisolle, M.; Guillaume, M.; Castronovo, V. Imbalance between Omega-6 and Omega-3 Polyunsaturated Fatty Acids in Early Pregnancy Is Predictive of Postpartum Depression in a Belgian Cohort. Nutrients 2019, 11, 876. [Google Scholar] [CrossRef] [PubMed]
- Huang, Y.; Iosif, A.-M.; Hansen, R.L.; Schmidt, R. Maternal polyunsaturated fatty acids and risk for autism spectrum disorder in the MARBLES high-risk study. Autism 2020, 24, 1191–1200. [Google Scholar] [CrossRef] [PubMed]
- Wu, G.; Imhoff-Kunsch, B.; Girard, A.W. Biological Mechanisms for Nutritional Regulation of Maternal Health and Fetal Development. Paediatr. Périnat. Epidemiol. 2012, 26, 4–26. [Google Scholar] [CrossRef]
- Hoge, A.; Bernardy, F.; Donneau, A.-F.; Dardenne, N.; Degée, S.; Timmermans, M.; Nisolle, M.; Guillaume, M.; Castronovo, V. Low omega-3 index values and monounsaturated fatty acid levels in early pregnancy: An analysis of maternal erythrocytes fatty acids. Lipids Health Dis. 2018, 17, 1–11. [Google Scholar] [CrossRef]
- Lauritzen, L.; Brambilla, P.; Mazzocchi, A.; Harsløf, L.B.S.; Ciappolino, V.; Agostoni, C. DHA Effects in Brain Development and Function. Nutrients 2016, 8, 6. [Google Scholar] [CrossRef] [PubMed]
- Clinical and Laboratory Standards Institute (CLSI). Defining, Establishing, and Verifying Reference Intervals in the Clinical Laboratory, 3rd ed.; Clinical and Laboratory Standards Institute: Wayne, PA, USA, 2010. [Google Scholar]
- Sera, R.K.; McBride, J.H.; Higgins, S.A.; Rodgerson, D.O. Evaluation of reference ranges for fatty acids in serum. J. Clin. Lab. Anal. 1994, 8, 81–85. [Google Scholar] [CrossRef]
- Abdelmagid, S.A.; Clarke, S.E.; Nielsen, D.E.; Badawi, A.; El-Sohemy, A.; Mutch, D.M.; Ma, D.W. Comprehensive profiling of plasma fatty acid concentrations in young healthy Canadian adults. PloS ONE 2015, 10, e0116195. [Google Scholar] [CrossRef]
- Mayo Clinic Laboratories, Fatty Acid Profile, Essential, Serum. Available online: https://www.mayocliniclabs.com/test-catalog/Clinical+and+Interpretive/82426 (accessed on 9 November 2021).
- Khaw, K.-T.; Friesen, M.D.; Riboli, E.; Luben, R.; Wareham, N. Plasma Phospholipid Fatty Acid Concentration and Incident Coronary Heart Disease in Men and Women: The EPIC-Norfolk Prospective Study. PLoS Med. 2012, 9, e1001255. [Google Scholar] [CrossRef] [PubMed]
- Otto, S.J.; Van Houwelingen, A.C.; Badart-Smook, A.; Hornstra, G. Changes in the maternal essential fatty acid profile during early pregnancy and the relation of the profile to diet. Am. J. Clin. Nutr. 2001, 73, 302–307. [Google Scholar] [CrossRef]
- Enke, U.; Jaudszus, A.; Schleussner, E.; Seyfarth, L.; Jahreis, G.; Kuhnt, K. Fatty acid distribution of cord and maternal blood in human pregnancy: Special focus on individual trans fatty acids and conjugated linoleic acids. Lipids Health Dis. 2011, 10, 247. [Google Scholar] [CrossRef] [PubMed]
- Pinto, T.J.P.; Farias, D.R.; Rebelo, F.; Lepsch, J.; Vaz, J.S.; Moreira, J.D.; Cunha, G.M.; Kac, G. Lower Inter-Partum Interval and Unhealthy Life-Style Factors Are Inversely Associated with n-3 Essential Fatty Acids Changes during Pregnancy: A Prospective Cohort with Brazilian Women. PLoS ONE 2015, 10, e0121151. [Google Scholar] [CrossRef]
- Araujo, P.; Kjellevold, M.; Nerhus, I.; Dahl, L.; Aakre, I.; Moe, V.; Smith, L.; Markhus, M.W. Fatty Acid Reference Intervals in Red Blood Cells among Pregnant Women in Norway—Cross Sectional Data from the ‘Little in Norway’ Cohort. Nutrients 2020, 12, 2950. [Google Scholar] [CrossRef]
- Mazzocchi, A.; Leone, L.; Agostoni, C.; Pali-Schöll, I. The Secrets of the Mediterranean Diet. Does [Only] Olive Oil Matter? Nutrients 2019, 11, 2941. [Google Scholar] [CrossRef]
- Montes, R.; Chisaguano, A.M.; I Castellote, A.; Morales, E.; Sunyer, J.; López-Sabater, M.C. Fatty-acid composition of maternal and umbilical cord plasma and early childhood atopic eczema in a Spanish cohort. Eur. J. Clin. Nutr. 2013, 67, 658–663. [Google Scholar] [CrossRef] [PubMed]
- Kohlmeier, L. Future of dietary exposure assessment. Am. J. Clin. Nutr. 1995, 61, 702S–709S. [Google Scholar] [CrossRef]
- Bradbury, K.E.; Skeaff, C.M.; Crowe, F.L.; Green, T.J.; Hodson, L. Serum Fatty Acid Reference Ranges: Percentiles from a New Zealand National Nutrition Survey. Nutrients 2011, 3, 152–163. [Google Scholar] [CrossRef] [PubMed]
- Zhao, J.P.; Levy, E.; Shatenstein, B.; Fraser, W.D.; Julien, P.; Montoudis, A.; Spahis, S.; Xiao, L.; Nuyt, A.M.; Luo, Z.C. Longitudinal circulating concentrations of long-chain polyunsaturated fatty acids in the third trimester of pregnancy in gestational diabetes. Diabet. Med. 2015, 33, 939–946. [Google Scholar] [CrossRef]
- Ohnishi, H.; Saito, Y. Eicosapentaenoic Acid (EPA) Reduces Cardiovascular Events: Relationship with the EPA/Arachidonic Acid Ratio. J. Atheroscler. Thromb. 2013, 20, 861–877. [Google Scholar] [CrossRef] [PubMed]
- Christian, L.M.; Blair, L.M.; Porter, K.; Lower, M.; Cole, R.M.; Belury, M.A. Polyunsaturated Fatty Acid (PUFA) Status in Pregnant Women: Associations with Sleep Quality, Inflammation, and Length of Gestation. PLOS ONE 2016, 11, e0148752. [Google Scholar] [CrossRef]
- Hu, Y.; Tanaka, T.; Zhu, J.; Guan, W.; Wu, J.; Psaty, B.M.; McKnight, B.; King, I.B.; Sun, Q.; Richard, M.; et al. Discovery and fine-mapping of loci associated with MUFAs through trans-ethnic meta-analysis in Chinese and European populations. J. Lipid Res. 2017, 58, 974–981. [Google Scholar] [CrossRef] [PubMed]
- Gibson, R.A.; Muhlhausler, B.; Makrides, M. Conversion of linoleic acid and alpha-linolenic acid to long-chain polyunsaturated fatty acids (LCPUFAs), with a focus on pregnancy, lactation and the first 2 years of life. Matern. Child Nutr. 2011, 7, 17–26. [Google Scholar] [CrossRef]
- Szczuko, M.; Kikut, J.; Komorniak, N.; Bilicki, J.; Celewicz, Z.; Ziętek, M. The Role of Arachidonic and Linoleic Acid Derivatives in Pathological Pregnancies and the Human Reproduction Process. Int. J. Mol. Sci. 2020, 21, 9628. [Google Scholar] [CrossRef]
- Arija, V.; Fargas, F.; March, G.; Abajo, S.; Basora, J.; Canals, J.; Ribot, B.; Aparicio, E.; Serrat, N.; Hernández-Martínez, C.; et al. Adapting iron dose supplementation in pregnancy for greater effectiveness on mother and child health: Protocol of the ECLIPSES randomized clinical trial. BMC Pregnancy Childbirth 2014, 14, 33. [Google Scholar] [CrossRef] [PubMed]
- Jardí, C.; Aparicio, E.; Bedmar, C.; Aranda, N.; Abajo, S.; March, G.; Basora, J.; Arija, V.; the ECLIPSES Study Group Food Consumption during Pregnancy and Post-Partum. ECLIPSES Study. Nutrients 2019, 11, 2447. [Google Scholar] [CrossRef]
- Fernández, R.; Escuriet, R.; Costa, D.; Armelles, M.; Cabezas, C. Protocol de seguiment de l’embaràs a catalunya, Dir. Gen. Salut Pública. 2018. Available online: https://salutpublica.gencat.cat/web/.content/minisite/aspcat/promocio_salut/embaras_part_puerperi/protocol_seguiment_embaras/protocol-seguiment-embaras-2018.pdf. (accessed on 9 November 2021).
- De Catalunya, G. Classificació Catalana d’Ocupacions (CCO-2011). 2011. Available online: https://www.idescat.cat/serveis/biblioteca/docs/cat/cco2011.pdf (accessed on 9 November 2021).
- Edwards, M.K.; Loprinzi, P.D. Affective Responses to Acute Bouts of Aerobic Exercise, Mindfulness Meditation, and Combinations of Exercise and Meditation: A Randomized Controlled Intervention. Psychol. Rep. 2019, 122, 465–484. [Google Scholar] [CrossRef]
- World Health Organization (WHO). Obesity and overweight. Available online: https://www.who.int/news-room/fact-sheets/detail/obesity-and-overweight. (accessed on 9 November 2021).
- Norte Navarro, A.I.; Ortiz Moncada, R. Calidad de la dieta española según el índice de alimentación saludable. Nutr. Hosp. 2011, 26, 330–336. [Google Scholar] [CrossRef]
- Automated Sample Preparation for Profiling Fatty Acids in Blood and Plasma using the Agilent 7693. Available online: https://www.agilent.com/cs/library/applications/5990-4822EN.pdf. (accessed on 9 November 2021).
- Mowbray, F.I.; Fox-Wasylyshyn, S.M.; El-Masri, M.M. Univariate outliers: A conceptual overview for the nurse researcher. Can. J. Nurs. Res. 2019, 51, 31–37. [Google Scholar] [CrossRef]
- Cousineau, D.; Chartier, S. Outliers detection and treatment: A review. Int. J. Psychol. Res. 2010, 3, 58–67. [Google Scholar] [CrossRef]
- Vlaardingerbroek, H.; Hornstra, G. Essential fatty acids in erythrocyte phospholipids during pregnancy and at delivery in mothers and their neonates: Comparison with plasma phospholipids. Prostaglandins, Leukot. Essent. Fat. Acids 2004, 71, 363–374. [Google Scholar] [CrossRef] [PubMed]
- Wheeler, S.J.; Poston, L.; Thomas, J.E.; Seed, P.T.; Baker, P.N.; Sanders, T.A.B. Maternal plasma fatty acid composition and pregnancy outcome in adolescents. Br. J. Nutr. 2011, 105, 601–610. [Google Scholar] [CrossRef] [PubMed]
- Kish-Trier, E.; Schwarz, E.; Pasquali, M.; Yuzyuk, T. Quantitation of total fatty acids in plasma and serum by GC-NCI-MS. Clin. Mass Spectrom. 2016, 2, 11–17. [Google Scholar] [CrossRef]
- Lagerstedt, S.A.; Hinrichs, D.R.; Batt, S.M.; Magera, M.J.; Rinaldo, P.; McConnell, J.P. Quantitative Determination of Plasma C8–C26 Total Fatty Acids for the Biochemical Diagnosis of Nutritional and Metabolic Disorders. Mol. Genet. Metab. 2001, 73, 38–45. [Google Scholar] [CrossRef] [PubMed]
- Sergeant, S.; Ruczinski, I.; Ivester, P.; Lee, T.C.; Morgan, T.M.; Nicklas, B.J.; Mathias, R.A.; Chilton, F.H. Impact of methods used to express levels of circulating fatty acids on the degree and direction of associations with blood lipids in humans. Br. J. Nutr. 2016, 115, 251–261. [Google Scholar] [CrossRef] [PubMed]
- Mocking, R.J.T.; Assies, J.; Lok, A.; Ruhé, H.G.; Koeter, M.W.J.; Visser, I.; Bockting, C.L.H.; Schene, A.H. Statistical Methodological Issues in Handling of Fatty Acid Data: Percentage or Concentration, Imputation and Indices. Lipids 2012, 47, 541–547. [Google Scholar] [CrossRef]
- Aparicio, E.; Martín-Grau, C.; Hernández-Martinez, C.; Voltas, N.; Canals, J.; Arija, V. Changes in fatty acid levels (saturated, monounsaturated and polyunsaturated) during pregnancy. BMC Pregnancy Childbirth 2021. in process of being published. [Google Scholar]
- Volk, B.M.; Kunces, L.J.; Freidenreich, D.J.; Kupchak, B.R.; Saenz, C.; Artistizabal, J.C.; Fernandez, M.L.; Bruno, R.; Maresh, C.M.; Kraemer, W.J.; et al. Effects of Step-Wise Increases in Dietary Carbohydrate on Circulating Saturated Fatty Acids and Palmitoleic Acid in Adults with Metabolic Syndrome. PLoS ONE 2014, 9, e113605. [Google Scholar] [CrossRef]
- Ma, J.; Folsom, A.R.; Shahar, E.; Eckfeldt, J.H. Plasma fatty acid composition as an indicator of habitual dietary fat intake in middle-aged adults. The Atherosclerosis Risk in Communities (ARIC) Study Investigators. Am. J. Clin. Nutr. 1995, 62, 564–571. [Google Scholar] [CrossRef]
- Wilson, N.; Mantzioris, E.; Middleton, P.; Muhlhausler, B. Influence of sociodemographic, lifestyle and genetic characteristics on maternal DHA and other polyunsaturated fatty acid status in pregnancy: A systematic review. Prostaglandins Leukot. Essent. Fat. Acids 2020, 152, 102037. [Google Scholar] [CrossRef] [PubMed]


| General Characteristics | Summary Statistics |
|---|---|
| Maternal age (years) a | 30.6 ± 5.01 |
| Country of origin, Spain (%) | 84.1 |
| Primipara (%) | 37.5 |
| Gestational age (weeks) a | 39.8 ± 1.08 |
| BMI (kg/m2) at first trimester (%) | |
| 18.5–24.9 (normal weight) | 62.2 (22.10 ± 1.76) a |
| 25.0–29.9 (overweight) | 25.3 (27.32 ± 1.33) a |
| ≥30 (obesity) | 12.5 (33.31 ± 2.91) a |
| Gestational weight gain (kg) a | 10.86 ± 3.66 |
| Maternal educational level (%) | |
| Low (primary or less) | 30.1 |
| Medium (high school) | 38.3 |
| High (university or more) | 31.6 |
| Occupation (%) | |
| Student | 2.4 |
| Employed | 87.1 |
| Unemployed | 10.5 |
| Smoking status (%) | |
| Smoker | 15.3 |
| Non-Smoker | 69.5 |
| Ex-Smoker | 15.3 |
| Maternal alcohol consumption (%) | 14 |
| Physical Activity (METs/week) (%) | |
| Low (<600) | 56.4 |
| Moderate (≥600–2999) | 39.4 |
| High (≥3000) | 4.2 |
| SQDI (score) a | 9.73 ± 2.64 |
| Fatty Acids | Absolute Concentration (µmol/L) * | Absolute Percentiles (µmol/L) | |||||||||
|---|---|---|---|---|---|---|---|---|---|---|---|
| P2.5 | P5 | P10 | P25 | P50 | P75 | P90 | P95 | P97.5 | |||
| SFA | |||||||||||
| Lauric acid (C12:0) | T1, n = 469 | 40.14 ± 10.50 | 29.22 | 30.18 | 31.67 | 34.04 | 37.30 | 42.45 | 51.76 | 60.12 | 71.80 |
| T3, n = 466 | 60.19 ± 28.26 | 32.52 | 34.51 | 36.73 | 40.91 | 51.10 | 69.71 | 97.49 | 121.81 | 146.67 | |
| Myristic acid (C14:0) | T1, n = 471 | 118.16 ± 49.07 | 57.95 | 63.99 | 69.33 | 83.20 | 107.42 | 139.15 | 188.35 | 228.58 | 260.84 |
| T3, n = 470 | 207.80 ± 80.31 | 93.68 | 107.69 | 117.21 | 149.71 | 194.20 | 249.20 | 321.04 | 367.13 | 413.69 | |
| Palmitic acid (C16:0) | T1, n = 467 | 2904.40 ± 1403.47 | 1339.95 | 1463.74 | 1627.03 | 1937.08 | 2582.35 | 3500.79 | 4704.88 | 5573.20 | 7610.80 |
| T3, n = 466 | 8511.32 ± 4293.76 | 2477.62 | 3017.91 | 3880.25 | 5507.61 | 7500.15 | 10,738.06 | 14,966.15 | 17,376.53 | 18,980.26 | |
| Stearic acid (C18:0) | T1, n = 470 | 690.31 ± 208.05 | 398.5 | 435.26 | 465.17 | 547.46 | 639.97 | 804.96 | 1019.98 | 1139.45 | 1211.48 |
| T3, n = 472 | 808.08 ± 202.10 | 474.67 | 522.63 | 569.76 | 664.25 | 779.99 | 930.30 | 1081.33 | 1174.58 | 1302.64 | |
| Σ Total SFA | T1, n = 467 | 3765.31 ± 1614.17 | 1884.32 | 2073.77 | 2267.31 | 2646.97 | 3408.43 | 4504.30 | 5907.35 | 6961.68 | 8802.81 |
| T3, n = 467 | 9625.65 ± 4574.33 | 3171.60 | 3756.01 | 4644.10 | 6401.81 | 8574.46 | 11,903.47 | 16,488.0 | 18,902.97 | 20,791.60 | |
| MUFA | |||||||||||
| Palmitoleic acid (C16:1n-7) | T1, n = 465 | 186.37 ± 45.88 | 119.70 | 125.68 | 136.35 | 151.80 | 180.84 | 211.59 | 250.73 | 283.54 | 296.39 |
| T3, n = 468 | 256.66 ± 89.61 | 100.78 | 134.70 | 163.33 | 194.08 | 245.46 | 303.10 | 378.4 | 422.99 | 487.91 | |
| Oleic acid (C18:1n-9) | T1, n = 466 | 1444.74 ± 461.90 | 817.01 | 881.34 | 959.76 | 1097.08 | 1381.89 | 1666.88 | 2044.13 | 2333.50 | 2694.42 |
| T3, n = 466 | 2843.85 ± 1251.92 | 1083.25 | 1319.01 | 1507.87 | 1915.78 | 2602.09 | 3514.33 | 4400.45 | 5507.76 | 6221.64 | |
| Σ Total MUFA | T1, n = 466 | 1634.54 ± 500.21 | 959.91 | 1020.19 | 1104.29 | 1257.50 | 1555.50 | 1900.07 | 2275.35 | 2596.12 | 2979.46 |
| T3, n = 467 | 3116.39 ± 1330.86 | 1254.75 | 1475.81 | 1711.59 | 2157.40 | 2860.01 | 3823.08 | 4920.80 | 6034.19 | 6668.84 | |
| n-6 PUFA | |||||||||||
| LA (C18:2n-6) | T1, n = 466 | 3355.67 ± 1230.19 | 1602.64 | 1756.72 | 1927.14 | 2439.91 | 3213.76 | 4097.77 | 5012.97 | 5710.44 | 6211.58 |
| T3, n = 470 | 6321.14 ± 2786.02 | 2408.12 | 2737.37 | 3282.10 | 4194.24 | 5722.28 | 7957.48 | 10,332.80 | 11,602.18 | 13,327.69 | |
| DHGLA (C20:3n-6) | T1, n = 469 | 229.99 ± 90.64 | 101.13 | 114.98 | 127.81 | 165.93 | 216.25 | 280.67 | 360.30 | 407.91 | 450.08 |
| T3, n = 471 | 246.20 ± 85.27 | 116.31 | 129.41 | 146.81 | 184.03 | 233.43 | 300.70 | 363.36 | 397.26 | 445.50 | |
| AA (C20:4n-6) | T1, n = 473 | 830.82 ± 276.15 | 421.52 | 455.60 | 520.47 | 631.14 | 791.72 | 991.31 | 1247.92 | 1398.0 | 1523.56 |
| T3, n = 469 | 722.63 ± 220.05 | 387.52 | 423.29 | 472.62 | 560.47 | 692.0 | 855.29 | 1035.63 | 1114.09 | 1223.84 | |
| Σ Total n-6 PUFA | T1, n = 465 | 4433.77 ± 1469.64 | 2325.77 | 2420.11 | 2697.52 | 3325.21 | 4219.65 | 5333.68 | 6482.27 | 7114.28 | 7735.74 |
| T3, n = 469 | 7278.06 ± 2919.04 | 3126.65 | 3435.44 | 4072.94 | 5029.21 | 6758.36 | 9100.77 | 11,346.52 | 12,917.44 | 14,348.43 | |
| n-3 PUFA | |||||||||||
| EPA (C20:5n-3) | T1, n = 467 | 35.03 ± 23.95 | 7.80 | 9.51 | 11.58 | 17.67 | 29.30 | 45.36 | 74.50 | 87.17 | 103.34 |
| T3, n = 470 | 23.88 ± 16.93 | 3.96 | 5.07 | 6.35 | 11.10 | 19.04 | 32.31 | 47.78 | 59.45 | 68.46 | |
| DHA (C22:6n-3) | T1, n = 473 | 240.28 ± 73.47 | 119.02 | 134.43 | 151.61 | 185.65 | 234.05 | 291.00 | 340.30 | 381.36 | 406.58 |
| T3, n = 474 | 236.60 ± 71.77 | 123.02 | 132.54 | 150.80 | 182.27 | 224.54 | 283.39 | 336.38 | 374.51 | 396.16 | |
| Σ Total n-3 PUFA | T1, n = 473 | 276.98 ± 94.07 | 129.01 | 149.88 | 169.46 | 205.28 | 264.05 | 332.67 | 414.77 | 469.19 | 495.58 |
| T3, n = 473 | 260.52 ± 84.33 | 133.12 | 141.08 | 160.92 | 194.55 | 250.85 | 315.61 | 377.51 | 426.69 | 454.23 | |
| Total FAs | T1, n = 464 | 10,073.15 ± 3349.07 | 5589.89 | 5808.29 | 6420.65 | 7561.30 | 9551.76 | 11,982.98 | 14,557.61 | 16,156.53 | 18,491.35 |
| T3, n = 468 | 20,480.82 ± 8335.23 | 8214.61 | 9780.29 | 10,719.47 | 14,577.32 | 18,797.72 | 25,341.41 | 31,644.12 | 36,078.82 | 41,359.35 | |
| n-6/n-3 ratio (a) | T1, n = 471 | 16.80 ± 5.19 | 8.39 | 9.25 | 10.54 | 13.23 | 16.39 | 19.70 | 24.25 | 27.01 | 29.61 |
| T3, n = 471 | 29.29 ± 11.52 | 11.83 | 13.44 | 15.77 | 20.98 | 27.69 | 36.54 | 46.83 | 51.60 | 54.88 | |
| AA/EPA ratio | T1, n = 469 | 31.77 ± 19.08 | 6.31 | 7.66 | 11.10 | 17.73 | 27.44 | 42.68 | 57.56 | 72.19 | 80.34 |
| T3, n = 470 | 44.09 ± 30.61 | 9.19 | 10.80 | 13.36 | 22.56 | 37.83 | 57.30 | 92.27 | 113.43 | 133.61 | |
| AA/(EPA + DHA) | T1, n = 474 | 3.12 ± 0.87 | 1.65 | 1.83 | 2.05 | 2.49 | 3.05 | 3.73 | 4.32 | 4.53 | 5.06 |
| T3, n = 475 | 2.96 ± 0.91 | 1.46 | 1.61 | 1.82 | 2.30 | 2.85 | 3.56 | 4.14 | 4.55 | 4.99 | |
| LA/DHGLA ratio | T1, n = 469 | 15.45 ± 5.12 | 7.40 | 8.03 | 9.67 | 11.84 | 14.80 | 18.55 | 23.20 | 25.04 | 27.86 |
| T3, n = 471 | 26.59 ± 10.58 | 11.59 | 12.97 | 14.44 | 18.71 | 24.20 | 32.78 | 42.46 | 47.05 | 51.60 | |
| EFA index | T1, n = 473 | 2.91 ± 0.64 | 1.77 | 1.94 | 2.11 | 2.49 | 2.85 | 3.30 | 3.74 | 4.05 | 4.37 |
| T3, n = 470 | 2.53 ± 0.90 | 1.20 | 1.30 | 1.48 | 1.90 | 2.39 | 3.07 | 3.81 | 4.29 | 4.71 | |
| Fatty Acids | Relative Concentration (% of Total FAs) * | Relative Percentiles (%) | |||||||||
|---|---|---|---|---|---|---|---|---|---|---|---|
| P2.5 | P5 | P10 | P25 | P50 | P75 | P90 | P95 | P97.5 | |||
| SFA | |||||||||||
| Lauric acid (C12:0) | T1, n = 472 | 0.42 ± 0.13 | 0.20 | 0.23 | 0.27 | 0.33 | 0.40 | 0.49 | 0.60 | 0.65 | 0.74 |
| T3, n = 470 | 0.34 ± 0.20 | 0.12 | 0.14 | 0.16 | 0.20 | 0.28 | 0.40 | 0.62 | 0.79 | 0.94 | |
| Myristic acid (C14:0) | T1, n = 472 | 1.17 ± 0.32 | 0.65 | 0.71 | 0.80 | 0.94 | 1.12 | 1.37 | 1.62 | 1.74 | 1.90 |
| T3, n = 473 | 1.07 ± 0.36 | 0.49 | 0.56 | 0.67 | 0.81 | 1.02 | 1.29 | 1.59 | 1.76 | 1.97 | |
| Palmitic acid (C16:0) | T1, n = 471 | 28.09 ± 4.52 | 20.29 | 21.40 | 22.60 | 24.83 | 27.75 | 30.87 | 33.72 | 36.61 | 38.10 |
| T3, n = 475 | 40.89 ± 6.82 | 28.06 | 30.81 | 32.88 | 36.17 | 40.47 | 44.98 | 49.74 | 52.76 | 57.08 | |
| Stearic acid (C18:0) | T1, n = 475 | 6.88 ± 1.06 | 4.41 | 4.41 | 4.90 | 5.42 | 6.23 | 7.01 | 7.64 | 8.14 | 8.47 |
| T3, n = 474 | 4.20 ± 1.04 | 2.49 | 2.65 | 2.91 | 3.48 | 4.09 | 4.81 | 5.57 | 6.27 | 6.76 | |
| Σ Total SFA | T1, n = 470 | 36.57 ± 4.38 | 28.84 | 30.01 | 30.59 | 33.49 | 36.55 | 39.34 | 42.02 | 44.15 | 45.65 |
| T3, n = 474 | 46.51 ± 6.27 | 35.89 | 37.41 | 39.08 | 42.10 | 46.06 | 50.42 | 54.30 | 58.07 | 62.08 | |
| MUFA | |||||||||||
| Palmitoleic acid (C16:1n-7) | T1, n = 475 | 1.92 ± 0.45 | 1.14 | 1.25 | 1.39 | 1.62 | 1.87 | 2.19 | 2.58 | 2.78 | 2.96 |
| T3, n = 472 | 1.35 ± 0.45 | 0.61 | 0.72 | 0.81 | 1.02 | 1.33 | 1.60 | 1.91 | 2.23 | 2.52 | |
| Oleic acid (C18:1n-9) | T1, n = 474 | 14.52 ± 2.27 | 10.22 | 11.18 | 11.89 | 13.02 | 14.24 | 16.10 | 17.68 | 18.57 | 19.50 |
| T3, n = 471 | 14.16 ± 3.36 | 8.52 | 9.11 | 10.13 | 11.68 | 13.72 | 16.37 | 18.77 | 20.32 | 21.40 | |
| Σ Total MUFA | T1, n = 475 | 16.46 ± 2.53 | 11.47 | 12.57 | 13.55 | 14.79 | 16.18 | 18.16 | 19.83 | 20.91 | 21.68 |
| T3, n = 473 | 15.58 ± 3.51 | 9.50 | 10.49 | 11.32 | 12.93 | 15.14 | 17.84 | 20.19 | 31.81 | 22.98 | |
| n-6 PUFA | |||||||||||
| LA (C18:2n-6), n = 446 | T1, n = 476 | 33.30 ± 5.19 | 23.21 | 24.90 | 26.58 | 29.82 | 33.38 | 36.81 | 39.95 | 42.13 | 44.14 |
| T3, n = 476 | 31.13 ± 6.95 | 17.65 | 19.97 | 22.21 | 26.28 | 31.03 | 35.61 | 40.23 | 42.68 | 45.69 | |
| DHGLA (C20:3n-6), n = 450 | T1, n = 473 | 2.26 ± 0.58 | 1.20 | 1.38 | 1.54 | 1.84 | 2.21 | 2.61 | 2.96 | 3.33 | 3.52 |
| T3, n = 474 | 1.27 ± 0.40 | 0.63 | 0.71 | 0.81 | 0.98 | 1.21 | 1.54 | 1.78 | 2.05 | 2.20 | |
| AA (C20:4n-6), n = 451 | T1, n = 475 | 8.31 ± 2.05 | 4.33 | 4.88 | 5.62 | 7.09 | 8.29 | 9.66 | 10.95 | 11.89 | 12.69 |
| T3, n = 471 | 3.83 ± 1.33 | 1.79 | 2.03 | 2.27 | 2.91 | 3.62 | 4.54 | 5.69 | 6.30 | 7.55 | |
| Σ Total n-6 PUFA, n = 444 | T1, n = 474 | 44.35 ± 5.07 | 33.62 | 36.25 | 38.20 | 41.05 | 44.59 | 47.44 | 50.80 | 52.94 | 54.46 |
| T3, n = 476 | 36.50 ± 7.27 | 21.78 | 24.07 | 27.36 | 31.43 | 36.47 | 40.95 | 45.85 | 48.62 | 50.86 | |
| n-3 PUFA | |||||||||||
| EPA (C20:5n-3), n = 446 | T1, n = 467 | 0.36 ± 0.24 | 0.07 | 0.11 | 0.13 | 0.18 | 0.30 | 0.46 | 0.66 | 0.86 | 1.04 |
| T3, n = 470 | 0.13 ± 0.10 | 0.02 | 0.03 | 0.04 | 0.06 | 0.10 | 0.16 | 0.27 | 0.33 | 0.39 | |
| DHA (C22:6n-3), n = 456 | T1, n = 474 | 2.24 ± 0.66 | 1.25 | 1.49 | 1.63 | 1.97 | 2.37 | 2.85 | 3.35 | 3.58 | 3.87 |
| T3, n = 472 | 1.24 ± 0.46 | 0.58 | 0.65 | 0.73 | 0.92 | 1.17 | 1.50 | 1.89 | 2.08 | 2.41 | |
| Σ Total n-3 PUFA | T1, n = 470 | 2.77 ± 0.83 | 1.41 | 1.62 | 1.79 | 2.16 | 2.67 | 3.28 | 3.93 | 4.35 | 4.74 |
| T3, n = 470 | 1.36 ± 0.53 | 0.64 | 0.70 | 0.78 | 0.98 | 1.27 | 1.66 | 2.12 | 2.42 | 2.67 | |
| n-6/n-3 ratio (a) | T1, n = 472 | 16.93 ± 5.27 | 8.39 | 9.25 | 10.54 | 13.23 | 16.40 | 19.70 | 24.41 | 27.53 | 29.67 |
| T3, n = 472 | 29.54 ± 11.66 | 11.83 | 13.45 | 15.78 | 21.02 | 27.71 | 36.63 | 46.99 | 51.68 | 55.53 | |
| AA/EPA ratio | T1, n = 469 | 31.68 ± 19.01 | 6.31 | 7.66 | 11.10 | 17.73 | 27.44 | 42.68 | 57.56 | 72.19 | 80.34 |
| T3, n = 470 | 45.25 ± 32.05 | 9.19 | 10.80 | 13.36 | 22.56 | 37.83 | 57.30 | 92.27 | 113.43 | 133.61 | |
| AA/(EPA + DHA) | T1, n = 474 | 3.12 ± 0.87 | 1.65 | 1.83 | 2.05 | 2.49 | 3.05 | 3.73 | 4.32 | 4.53 | 5.06 |
| T3, n = 475 | 2.96 ± 0.91 | 1.46 | 1.61 | 1.82 | 2.30 | 2.85 | 3.56 | 4.14 | 4.55 | 4.99 | |
| LA/DHGLA ratio | T1, n = 471 | 15.69 ± 5.37 | 7.41 | 8.03 | 9.70 | 11.84 | 14.86 | 18.57 | 23.27 | 25.22 | 28.98 |
| T3, n = 472 | 26.64 ± 10.69 | 11.59 | 12.97 | 14.46 | 18.72 | 24.22 | 32.87 | 42.61 | 47.25 | 51.65 | |
| EFA index | T1, n = 473 | 2.93 ± 0.64 | 1.78 | 1.95 | 2.13 | 2.51 | 2.87 | 3.32 | 3.77 | 4.07 | 4.40 |
| T3, n = 470 | 2.55 ± 0.90 | 1.20 | 1.31 | 1.48 | 1.91 | 2.40 | 3.08 | 3.83 | 4.30 | 4.74 | |
| Fatty Acids | Our Reference Intervals (T1, n = 472; T3, n = 468) | Montes et al. [19] (n = 170) (Spain) | Otto et al. [14] (n = 23) (The Netherlands) | Enke et al. [15] (n = 55) (Germany) | Vlaardingerbroek et al. [38] (n = 172) (The Netherlands) | Wheeler et al. [39] (n = 142) (United Kingdom) | |
|---|---|---|---|---|---|---|---|
| Percentiles (2.5–97.5%) | Mean ± SD | ||||||
| SFA | |||||||
| Myristic acid (C14:0) | T1 | 0.65–1.90 | - | - | - | - | |
| T3 | 0.49–1.97 | - | - | 1.21 ± 0.40 | - | 1.21 ± 0.03 | |
| Palmitic acid (C16:0) | T1 | 20.29–38.10 | - | - | - | - | |
| T3 | 28.06–57.08 | - | - | 30.20 ± 2.31 * | - | 25.9 ± 0.17 * | |
| Stearic acid (C18:0) | T1 | 4.41–8.47 | - | - | - | - | |
| T3 | 2.49–6.76 | - | - | 5.59 ± 0.78 | - | 5.84 ± 0.05 | |
| Σ Total SFA | T1 | 28.84–45.65 | 30.34 ± 2.06 | 44.14 ± 0.46 | - | 45.06 ± 0.09 | |
| T3 | 25.89–62.08 | - | - | 67.80 ± 4.77 ⱡ | 45.80 ± 0.07 | 33.0 ± 0.20 | |
| MUFA | |||||||
| Palmitoleic acid (C16:1n-7) | T1 | 1.14–2.96 | - | - | - | - | |
| T3 | 0.61–2.52 | - | - | - | - | 2.41 ± 0.07 | |
| Oleic acid (C18:1n-9) | T1 | 10.22–19.50 | - | - | - | - | |
| T3 | 8.52–21.40 | - | - | 23.90 ± 2.45 ⱡ | - | 22.2 ± 0.40 ⱡ | |
| Σ Total MUFA | T1 | 11.47–21.68 | 23.29 ± 3.62 ⱡ | 12.05 ± 0.25 | - | 11.20 ± 0.08 * | |
| T3 | 9.50–22.98 | - | - | 29.20 ± 2.93 ⱡ | 11.99 ± 0.10 | 28.8 ± 0.25 ⱡ | |
| n-6 PUFA | |||||||
| LA (C18:2n-6) | T1 | 23.21–44.14 | 32.16 ± 4.16 | 20.48 ± 0.48 * | - | 21.28 ± 0.18 * | |
| T3 | 17.65–45.69 | - | - | 23.50 ± 3.41 | 21.78 ± 0.18 | 27.1 ±0.29 | |
| DHGLA (C20:3n-6) | T1 | 1.20–3.52 | 1.55 ± 0.56 * | 3.53 ± 0.17 ⱡ | - | 3.22 ± 0.05 | |
| T3 | 0.63–2.20 | - | - | 1.55 ± 0.32 | 3.46 ± 0.04 ⱡ | 7.88 ± 0.20 ⱡ | |
| AA (C20:4n-6) | T1 | 4.33–12.69 | 7.33 ± 1.74 | 9.34 ± 0.35 | - | 9.64 ± 0.11 | |
| T3 | 1.79–7.55 | - | - | 3.83 ± 0.89 | 8.15 ± 0.10 ⱡ | 5.40 ± 0.08 | |
| Σ Total n-6 PUFA | T1 | 33.62–54.46 | 42.56 ± 4.22 | 34.88 ± 0.62 | - | - | |
| T3 | 21.78–50.86 | - | - | - | - | 34.7 ± 0.31 | |
| n-3 PUFA | |||||||
| EPA (C20:5n-3) | T1 | 0.07–1.04 | 0.39 ± 0.30 | 0.62 ± 0.11 | - | 0.58 ± 0.02 | |
| T3 | 0.02–0.39 | - | - | 0.24 ± 0.10 | 0.34 ± 0.02 | 0.32 ± 0.02 | |
| DHA (C22:6n-3) | T1 | 1.25–3.87 | 2.68 ± 0.62 | 3.93 ± 0.22 ⱡ | - | 3.88 ± 0.07 ⱡ | |
| T3 | 0.58–2.41 | - | - | 1.21 ± 0.35 | 3.74 ± 0.06 ⱡ | 2.07 ± 0.04 | |
| Σ Total n-3 PUFA | T1 | 1.41–4.74 | 3.69 ± 0.87 | 5.35 ± 0.33 ⱡ | - | - | |
| T3 | 0.64–2.67 | - | - | 1.61 ± 0.46 | - | 2.72 ± 0.06 ⱡ | |
| n-6/n-3 ratio (a) | T1 | 8.39–29.61 | 12.16 ± 3.04 | 6.44 ± 0.29 * | - | - | |
| T3 | 11.83–54.88 | - | - | - | - | ||
| AA/(EPA + DHA) | T1 | 1.65–5.06 | - | - | - | - | |
| T3 | 1.46–4.99 | - | - | - | - | 2.32 ± 0.04 | |
| EFA index | T1 | 1.78–4.40 | - | 3.48 ± 0.09 | - | 3.62 ± 0.04 | |
| T3 | 1.20–4.74 | - | - | - | 3.34 ± 0.04 | ||
| Fatty Acids | ||||||||||||
|---|---|---|---|---|---|---|---|---|---|---|---|---|
| Total FA | Total SFA | Total MUFA | Total n-6 PUFA | |||||||||
| Maternal factors in T1 | B | SE | p | B | SE | p | B | SE | p | B | SE | p |
| Maternal Age | 5.8 | 44.0 | 0.895 | −14.5 | 21.1 | 0.494 | 0.3 | 6.6 | 0.959 | 2.1 | 19.6 | 0.915 |
| Occupation | 100.9 | 423.8 | 0.812 | 115.2 | 202.1 | 0.569 | 32.3 | 63.8 | 0.614 | 22.2 | 188.3 | 0.906 |
| Educational level | −152.8 | 299.0 | 0.610 | 16.2 | 143.1 | 0.910 | 47.1 | 45.4 | 0.300 | −124.4 | 132.8 | 0.350 |
| Ethnicity | 395.4 | 578.6 | 0.495 | 334.0 | 275.5 | 0.226 | 108.4 | 86.4 | 0.211 | 93.5 | 256.8 | 0.716 |
| Parity | 403.7 | 412.6 | 0.329 | 417.3 | 198.2 | 0.036 * | 116.5 | 62.4 | 0.063 | 115.2 | 183.0 | 0.530 |
| BMI | 97.3 | 43.2 | 0.025 | 56.1 | 20.4 | 0.006 * | 13.2 | 6.5 | 0.044 * | 34.7 | 19.2 | 0.072 |
| Gestational weight gain | 49.8 | 48.3 | 0.304 | −27.5 | 23.1 | 0.236 | −0.1 | 7.3 | 0.992 | −19.9 | 21.5 | 0.354 |
| Smoking | −148.3 | 256.3 | 0.563 | −4.1 | 123.0 | 0.973 | −35.1 | 39.0 | 0.369 | −99.6 | 113.8 | 0.382 |
| Alcohol consumption | −2790.3 | 3316.8 | 0.401 | −1917.9 | 1589.0 | 0.228 | −567.4 | 502.5 | 0.260 | −468.6 | 1473.4 | 0.751 |
| Physical Activity | −145.6 | 333.0 | 0.662 | 6.4 | 159.4 | 0.968 | −25.2 | 50.4 | 0.617 | −118.3 | 147.8 | 0.424 |
| Diet Quality | 106.3 | 73.4 | 0.149 | 55.8 | 35.1 | 0.113 | 16.5 | 11.1 | 0.138 | 21.0 | 32.6 | 0.520 |
| R2 = 0.056, F11,280= 1.502; p= 0.130 | R2 = 0.081, F11,281= 2.248; p= 0.012 * | R2 = 0.060, F11,281= 1.632; p= 0.089 | R2 = 0.041, F11,281= 1.101; p= 0.360 | |||||||||
| Maternal factors in T3 | ||||||||||||
| Maternal Age | 191.2 | 108.3 | 0.079 | 37.0 | 59.8 | 0.536 | 37.2 | 17.9 | 0.080 | 36.5 | 38.2 | 0.340 |
| Occupation | −1059.6 | 1058.4 | 0.318 | −878.9 | 576.9 | 0.129 | −306.2 | 174.3 | 0.511 | 154.0 | 369.9 | 0.677 |
| Educational level | −1453.6 | 737.6 | 0.050 | −1002.6 | 406.6 | 0.014 * | −81.1 | 123.4 | 0.026 * | −446.0 | 259.0 | 0.086 |
| Ethnicity | −1851.1 | 1429.2 | 0.196 | −922.6 | 785.1 | 0.241 | −527.1 | 235.1 | 0.384 | −761.8 | 500.1 | 0.129 |
| Parity | −745.5 | 1030.0 | 0.470 | 739.1 | 569.5 | 0.195 | −148.1 | 170.0 | 0.014 * | −483.3 | 360.8 | 0.181 |
| BMI | 254.1 | 108.4 | 0.020 | 164.3 | 59.5 | 0.006 * | 44.0 | 17.8 | 0.635 | 57.3 | 37.8 | 0.130 |
| Gestational weight gain | 149.2 | 119.7 | 0.214 | 107.2 | 66.2 | 0.106 | 9.5 | 20.0 | 0.229 | 17.3 | 42.2 | 0.683 |
| Smoking | −271.5 | 638.2 | 0.671 | −386.9 | 354.1 | 0.275 | −127.9 | 106.1 | 0.659 | −36.2 | 223.8 | 0.872 |
| Alcohol consumption | −4228.6 | 8281.3 | 0.610 | −1697.3 | 4543.5 | 0.709 | −609.0 | 1378.4 | 0.475 | −2083.2 | 2909.4 | 0.475 |
| Physical Activity | −482.1 | 818.8 | 0.557 | −688.4 | 456.4 | 0.133 | −97.2 | 136.0 | 0.507 | −49.0 | 287.8 | 0.865 |
| Diet Quality | 130.1 | 182.9 | 0.477 | 89.0 | 100.2 | 0.375 | 20.2 | 30.3 | 0.080 | 58.8 | 64.5 | 0.363 |
| R2 = 0.061, F11,283= 1.673; p= 0.079 | R2 = 0.091, F11,282= 2.573; p= 0.004 * | R2 = 0.091, F11,285= 2.587; p= 0.004 * | R2 = 0.041, F11,284= 1.098; p= 0.362 | |||||||||
| Total n-3 PUFA | Linoleic Acid | Arachidonic Acid | Docosahexaenoic Acid | |||||||||
| Maternal factors in T1 | B | SE | p | B | SE | p | B | SE | p | B | SE | p |
| Maternal Age | 2.9 | 1.3 | 0.027 * | 5.6 | 16.5 | 0.735 | −1.6 | 3.7 | 0.671 | 1.6 | 1.0 | 0.101 |
| Occupation | −9.1 | 12.5 | 0.465 | −52.1 | 159.1 | 0.744 | 26.7 | 36.1 | 0.460 | −9.7 | 9.7 | 0.316 |
| Educational level | 23.3 | 8.8 | 0.009 * | −161.1 | 111.8 | 0.151 | 33.4 | 25.6 | 0.193 | 17.2 | 6.8 | 0.012 * |
| Ethnicity | 42.3 | 16.8 | 0.012 * | 11.5 | 216.7 | 0.958 | 6.8 | 48.6 | 0.889 | 29.1 | 13.0 | 0.026 * |
| Parity | 13.8 | 12.1 | 0.257 | 81.4 | 154.6 | 0.599 | 70.2 | 35.1 | 0.046 * | 11.2 | 9.3 | 0.233 |
| BMI | 0.7 | 1.3 | 0.600 | 29.0 | 16.2 | 0.074 | 8.6 | 3.6 | 0.018 * | 0.8 | 1.0 | 0.404 |
| Gestational weight gain | −0.2 | 1.4 | 0.880 | −16.0 | 18.1 | 0.379 | 0.3 | 4.1 | 0.950 | −0.2 | 1.1 | 0.834 |
| Smoking | −2.6 | 7.6 | 0.736 | −122.6 | 96.1 | 0.203 | 8.2 | 22.0 | 0.709 | −3.3 | 5.8 | 0.570 |
| Alcohol consumption | −67.8 | 97.8 | 0.489 | −156.9 | 1245.0 | 0.900 | −303.4 | 284.6 | 0.287 | −25.1 | 75.6 | 0.740 |
| Physical Activity | −17.9 | 9.8 | 0.068 | −30.2 | 124.9 | 0.809 | −64.7 | 28.4 | 0.024 | −17.4 | 7.6 | 0.023 * |
| Diet Quality | 1.0 | 2.2 | 0.645 | 28.8 | 27.5 | 0.296 | −5.0 | 6.3 | 0.429 | 0.9 | 1.7 | 0.581 |
| R2 = 0.111, F11,283= 3.198; p= <0.001 * | R2 = 0.045, F11,282= 1.214; p= 0.277 | R2 = 0.061, F11,285= 1.675; p= 0.078 | R2 = 0.108, F11,284= 3.132; p= 0.001 * | |||||||||
| Maternal factors in T3 | ||||||||||||
| Maternal Age | 3.2 | 1.1 | 0.004 * | 27.5 | 35.3 | 0.437 | 1.8 | 2.9 | 0.543 | 2.8 | 0.9 | 0.002 |
| Occupation | −3.4 | 10.8 | 0.753 | 204.9 | 342.5 | 0.550 | 24.4 | 28.3 | 0.388 | −0.2 | 9.1 | 0.981 |
| Educational level | 8.8 | 7.6 | 0.246 | −419.4 | 239.4 | 0.081 | −11.1 | 19.9 | 0.578 | 6.4 | 6.4 | 0.314 |
| Ethnicity | 1.6 | 14.5 | 0.915 | −624.9 | 462.4 | 0.178 | −96.8 | 38.4 | 0.015 * | 5.2 | 12.2 | 0.674 |
| Parity | −7.0 | 10.4 | 0.501 | −406.5 | 334.1 | 0.225 | 1.8 | 27.4 | 0.947 | −9.1 | 8.8 | 0.304 |
| BMI | −0.2 | 1.1 | 0.855 | 49.3 | 34.9 | 0.160 | 6.0 | 2.9 | 0.036 * | −0.3 | 0.9 | 0.776 |
| Gestational weight gain | −0.2 | 1.2 | 0.876 | 11.3 | 39.0 | 0.773 | 3.1 | 3.6 | 0.384 | −0.2 | 1.0 | 0.825 |
| Smoking | 4.3 | 6.5 | 0.506 | −26.4 | 207.1 | 0.899 | 17.7 | 17.2 | 0.303 | 3.0 | 5.5 | 0.582 |
| Alcohol consumption | −86.9 | 84.8 | 0.306 | −1756.6 | 2690.1 | 0.514 | −161.6 | 221.9 | 0.467 | −62.4 | 71.7 | 0.385 |
| Physical Activity | −10.4 | 8.4 | 0.215 | 4.8 | 266.1 | 0.986 | −7.4 | 21.9 | 0.737 | −7.2 | 7.1 | 0.307 |
| Diet Quality | 3.6 | 1.9 | 0.055 | 38.9 | 60.0 | 0.517 | −7.5 | 5.0 | 0.133 | 3.1 | 1.6 | 0.050 * |
| R2 = 0.082, F11,286= 2.331; p= 0.009 * | R2 = 0.037, F 11,283= 0.996; p= 0.450 | R2 = 0.065, F11,283= 1.792; p= 0.049 * | R2 = 0.077, F11,287= 2.170; p= 0.016 * | |||||||||
Publisher’s Note: MDPI stays neutral with regard to jurisdictional claims in published maps and institutional affiliations. |
© 2021 by the authors. Licensee MDPI, Basel, Switzerland. This article is an open access article distributed under the terms and conditions of the Creative Commons Attribution (CC BY) license (https://creativecommons.org/licenses/by/4.0/).
Share and Cite
Martín-Grau, C.; Deulofeu, R.; Serrat Orus, N.; Arija, V.; on behalf of the ECLIPSES Study Group. Trimester-Specific Reference Ranges for Saturated, Monounsaturated and Polyunsaturated Fatty Acids in Serum of Pregnant Women: A Cohort Study from the ECLIPSES Group. Nutrients 2021, 13, 4037. https://doi.org/10.3390/nu13114037
Martín-Grau C, Deulofeu R, Serrat Orus N, Arija V, on behalf of the ECLIPSES Study Group. Trimester-Specific Reference Ranges for Saturated, Monounsaturated and Polyunsaturated Fatty Acids in Serum of Pregnant Women: A Cohort Study from the ECLIPSES Group. Nutrients. 2021; 13(11):4037. https://doi.org/10.3390/nu13114037
Chicago/Turabian StyleMartín-Grau, Carla, Ramón Deulofeu, Nuria Serrat Orus, Victoria Arija, and on behalf of the ECLIPSES Study Group. 2021. "Trimester-Specific Reference Ranges for Saturated, Monounsaturated and Polyunsaturated Fatty Acids in Serum of Pregnant Women: A Cohort Study from the ECLIPSES Group" Nutrients 13, no. 11: 4037. https://doi.org/10.3390/nu13114037
APA StyleMartín-Grau, C., Deulofeu, R., Serrat Orus, N., Arija, V., & on behalf of the ECLIPSES Study Group. (2021). Trimester-Specific Reference Ranges for Saturated, Monounsaturated and Polyunsaturated Fatty Acids in Serum of Pregnant Women: A Cohort Study from the ECLIPSES Group. Nutrients, 13(11), 4037. https://doi.org/10.3390/nu13114037