Article

Relationship between Energy Balance and Circulating Levels of Hepcidin and Ferritin in the Fasted and Postprandial States

School of Medicine, University of Auckland, Auckland 1023, New Zealand
*
Author to whom correspondence should be addressed.
Nutrients 2021, 13(10), 3557; https://doi.org/10.3390/nu13103557
Submission received: 31 August 2021 / Revised: 8 October 2021 / Accepted: 9 October 2021 / Published: 11 October 2021
(This article belongs to the Section Micronutrients and Human Health)

Abstract

:
Markers of iron metabolism are altered in new-onset diabetes, but their relationship with metabolic signals involved in the maintenance of energy balance is poorly understood. The primary aim was to explore the associations between markers of iron metabolism (hepcidin and ferritin) and markers of energy balance (leptin, ghrelin, and the leptin/ghrelin ratio) in both the fasted and postprandial states. These associations were also studied in the sub-groups stratified by diabetes status. This was a cross-sectional study of individuals without disorders of iron metabolism who were investigated after an overnight fast and, in addition, some of these individuals underwent a mixed meal test to determine postprandial responses of metabolic signals. The associations between hepcidin, ferritin, and leptin, ghrelin, leptin/ghrelin ratio were studied using several multiple linear regression models. A total of 76 individuals in the fasted state and 34 individuals in the postprandial state were included. In the overall cohort, hepcidin was significantly inversely associated with leptin (in the most adjusted model, the β coefficient ± SE was −883.45 ± 400.94; p = 0.031) and the leptin/ghrelin ratio (in the most adjusted model, the β coefficient ± SE was −148.26 ± 61.20; p = 0.018) in the fasted state. The same associations were not statistically significant in the postprandial state. In individuals with new-onset prediabetes or diabetes (but not in those with normoglycaemia or longstanding prediabetes or diabetes), hepcidin was significantly inversely associated with leptin (in the most adjusted model, the β coefficient ± SE was −806.09 ± 395.44; p = 0.050) and the leptin/ghrelin ratio (in the most adjusted model, the β coefficient ± SE was −129.40 ± 59.14; p = 0.037). Leptin appears to be a mediator in the link between iron metabolism and new-onset diabetes mellitus. These findings add to the growing understanding of mechanisms underlying the derangements of glucose metabolism.

1. Introduction

The central nervous system integrates metabolic signals from peripheral tissues to maintain energy balance. Leptin and ghrelin are key metabolic signals in this regard. Leptin is a hormone secreted primarily from the adipose tissue to relay the status of the energy stores to the central nervous system [1,2]. Leptin acts by stimulating the anorexigenic pathways in the appetite-regulating nucleus of the human hypothalamus, transmitting this information as peripheral signals that cause appetite suppression, limit food intake/energy consumption, and regulate energy expenditure [3,4]. Ghrelin is a hormone secreted mainly in the fundus of the stomach in adults (though the main source of ghrelin expression during perinatal life is the pancreas [5,6]) in response to a negative energy balance such as during fasting and starvation. Ghrelin primarily stimulates orexigenic pathways that trigger the feeling of hunger and increase appetite by affecting the same hypothalamic arcuate neurons engaged by leptin [7,8,9]. Ghrelin and leptin are antagonistic signals, and the leptin/ghrelin ratio is deemed a biomarker of metabolic adaptation to energy balance [10,11].
Iron is an essential inorganic micronutrient that plays a central role in numerous metabolic processes [12]. At the cellular level, iron acts as an indispensable co-factor to enzymes that catalyse metabolic pathways [13]. Iron levels are tightly regulated owing to their reactive nature and the potential to produce highly reactive free radicals that cause damage to cellular components [14]. Therefore, dysregulation of iron homeostasis plays an important role in the pathogenesis of metabolic diseases (including impaired glucose metabolism) [14]. Specifically, moderate to high body iron stores (as evidenced by increased serum ferritin levels) are a risk factor for type 2 diabetes, non-alcoholic fatty liver disease, and metabolic syndrome [15,16,17]. Likewise, deranged levels of circulating hepcidin (the liver-derived key regulator of iron metabolism) have been found in metabolic disorders [18,19,20,21,22]. Metabolic disorders are also often characterised by altered energy balance, and restoration of energy balance is emerging as a cornerstone of diabetes remission [23,24].
Several animal studies have reported a strong relationship between iron metabolism and serum leptin and ghrelin [25,26]. Dietary iron supplementation has been found to increase appetite and deplete leptin levels in rodents [26]. Further, increased iron stores (i.e., serum ferritin) were demonstrated to down-regulate leptin expression directly [26,27], and ghrelin was found to be involved in the regulation of the expression of ferroportin 1 (the transmembrane protein that allows entry and exit of iron into cells) [28]. Human studies have mainly focused on people with disorders of iron metabolism. For instance, thalassemia major patients with iron overload (as a result of multiple blood transfusions) were often reported to have markedly lower leptin levels when compared with healthy controls [29,30,31]. On the other hand, iron deficient people (who often have an accompanying poor appetite) were shown to have lower levels of ghrelin and hepcidin when compared with healthy controls [32], and dietary iron supplementation improved their appetite scores [33].
Despite the possible role of iron metabolism in the regulation of leptin and ghrelin, little is known about this relationship in humans with deranged glucose metabolism (who have no overt disorders of iron metabolism), possibly owing to the methodological difficulties of studying these populations. New-onset prediabetes/diabetes has been shown to occur in around 2 out of 5 individuals after an attack of acute pancreatitis (the most common disease of the exocrine pancreas) in the 2020 prospective longitudinal cohort study called LACERTA [34]. In comparison with other common types of diabetes (such as type 2 diabetes and type 1 diabetes), the cause of glucose abnormalities after acute pancreatitis is known (i.e., an attack of acute pancreatitis), and this presents an appealing opportunity to study a relatively homogenous population suitable for investigating the cross-talk between energy balance and iron metabolism in humans with no disorders of iron metabolism [35,36,37,38,39].
The primary aim of the present study was to explore the associations between markers of iron metabolism (specifically, hepcidin and ferritin) and metabolic signals involved in the maintenance of energy balance (specifically, leptin, ghrelin, and the leptin/ghrelin ratio) in individuals after an attack of acute pancreatitis, in both the fasted and postprandial states. The secondary aim was to investigate these associations in the sub-groups stratified by habitual dietary intake of iron and diabetes status.

2. Methods

2.1. Study Design and Participants

This cross-sectional study, which was part of the ANDROMEDA project, included adults (aged at least 18 years) with a history of acute pancreatitis (defined based on the international guidelines [40]). Participants were excluded if they had a history of iron overload, iron deficiency, haemochromatosis, chronic pancreatitis, post-endoscopic retrograde cholangiopancreatology pancreatitis, intraoperative diagnosis of pancreatitis, pregnancy or lactating at the time of pancreatitis or after, malignancy, or a recurrent attack of acute pancreatitis within three months of enrolment in the study. The study protocol was approved by the Health and Disability Ethics Committee (13/STH/182). All participants provided written informed consent.

2.2. Assessment of Dietary Iron Intake

The comprehensive EPIC-Norfolk food frequency questionnaire was used to record the participants’ usual food intake in the preceding 12 months [41,42]. Total dietary iron intake (mg/day) and total energy intake (kcal/day) were estimated using the standardised EPIC Nutrient Database [43]. Measurement of supplemental iron intake was beyond the scope of the data collection tool and, therefore, not considered in the present study. Iron intake was categorised into “insufficient” or “sufficient” iron intake as per sex- and age-specific recommended dietary allowances (RDAs) laid down by the Institute of Medicine (USA) [44]. The iron intake RDA for men and postmenopausal women was 8 mg/day, whereas that for premenopausal women was 18 mg/day. Participants with iron intake less than the RDA were deemed to have “insufficient” iron intake in the present study, whereas those with iron intake greater than or equal to the RDA were deemed to have “sufficient” iron intake.

2.3. Ascertainment of Diabetes Status

Diabetes status was categorised as normoglycaemia, type 2 prediabetes/diabetes mellitus (T2DM), and new onset prediabetes/diabetes after acute pancreatitis (NODAP) and defined according to the “DEP criteria” [45]. Normoglycaemia was defined as fasting blood glucose (FBG) <5.6 mmol/L (<100 mg/dL) and/or haemoglobin A1c (HbA1c) <5.7% (<39 mmol/mol). The T2DM group included individuals with HbA1c ≥5.7% (≥39 mmol/mol) before, during hospitalisation for acute pancreatitis, and within three months afterwards. The NODAP group included individuals with FBG ≥5.6 mmol/L (≥100 mg/dL) and/or HbA1c ≥5.9% (≥39 mmol/mol). FBG ≥5.6 mmol/L (≥100 mg/dL) during hospitalisation was not taken into account for the purpose of the above categorisation due to the possibility of stress-induced hyperglycaemia during an attack of acute pancreatitis [46].

2.4. Mixed Meal Test

A sub-cohort of included participants consumed a commercially available drink after an 8-h overnight fast. Each participant received the BOOST® original drink (Nestle Health Science, Bridgewater, NJ, USA), providing 61.5 g of carbohydrates, 15 g of protein, and 6 g of fat. Blood samples were drawn using a venous catheter with stopcock apparatus at 0 (baseline), 15, 30, 45, 60, 75, and 90 min following the consumption of the drink [47].

2.5. Laboratory Variables

Fasting (at least 8 h of an overnight fast) and postprandial blood samples were used to measure several analytes. The MILLIPLEX® MAP Human Metabolic Hormone Bead Panel—Metabolic Multiplex Assay, based on the Luminex xMAP (Luminex Corporation, Austin, TX, USA) technology, was used to measure leptin and ghrelin concentrations in plasma, following the assay protocol. The leptin/ghrelin ratio was calculated as leptin (ng/mL) × 1000/(ghrelin (pg/mL). Circulating hepcidin levels in plasma were measured using a solid phase enzyme-linked immunosorbent assay (DRG® Hepcidin 25 Bioactive) EIA-5258, DRG International, Inc., Springfield, NJ, USA). Circulating ferritin levels were measured using an electrochemiluminescence immunoassay (©Roche Products and Roche Diagnostics Ltd., Auckland, New Zealand). Blood tests for HbA1c (mmol/mol) were conducted immediately after blood collection on fresh and never frozen blood using the boronate affinity chromatography assay (Trinity Biotech, Bray, Ireland), which was standardised to the Diabetes Control and Complications Trial reference assay and certified by the U.S. National Glycohaemoglobin Standardisation Program at the laboratory of Auckland City Hospital. FPG (mmol/L) tests were conducted in the same laboratory using an enzymatic colourimetric assay (F.Hoffmann-La Roche Ltd., Basel, Switzerland).

2.6. Other Variables

Anthropometric measurements, including height, weight, waist circumference, hip circumference, were collected in line with a standardised protocol [48]. Body mass index (BMI) was derived from weight and height as weight (kg)/(height (m) × height (m)). Basal metabolic rate was determined using the Harris-Benedict equation [49]. Recurrence of acute pancreatitis was dichotomised depending on whether participants had been re-admitted to hospital due to an acute pancreatitis attack (at least 30 days apart) from their first episode until the time of the ANDROMEDA project. The aetiology of acute pancreatitis was defined as biliary, alcohol-related, and other. Use of antidiabetic medications was ascertained from medical records and recorded as “yes” or “no”.

2.7. Statistical Analyses

Statistical analyses were performed using SAS 9.4. (SAS Institute Inc., Cary, NC, USA). Quantitative variables were expressed as mean and standard deviation (SD) or as median and interquartile range (IQR), as appropriate. Categorical variables were expressed as frequencies and percentages. The normality of variables was assessed using the hypothesis test (Shapiro–Wilk). The incremental area under the concentration-time curve (iAUC) for leptin and ghrelin were calculated using the trapezoidal method.
Multilinear regression models were used to analyse the associations between markers of iron metabolism (hepcidin and ferritin) and leptin, ghrelin, and the leptin/ghrelin ratio in the overall cohort (in both the fasted and postprandial states) and in the sub-groups stratified by iron intake and diabetes status. Markers of iron metabolism were analysed as the independent variables, whereas leptin, ghrelin, and the leptin/ghrelin ratio were the dependent variables. Linear regression models were built as follows: model 1—unadjusted; model 2—adjusted for age, sex, and body mass index; model 3—adjusted for age, sex, body mass index, and use of antidiabetic medications; model 4—adjusted for age, sex, body mass index, use of antidiabetic medications, aetiology of acute pancreatitis, and recurrence of acute pancreatitis. Significance tests were two-sided and p values were deemed statistically significant at the 5% level or lower.

3. Results

3.1. Characteristics of Study Participants

A total of 76 individuals in the fasted state and a sub-cohort of 34 participants in the postprandial state were analysed. The baseline characteristics of the sub-cohort were similar to the ones of the overall cohort, with the exception of age and fasting plasma leptin (Table 1). The median (IQR) of hepcidin and ferritin were 11.8 (8.5–18.9) ng/mL and 144.5 (94.5–257.5) ng/mL, respectively, in the overall cohort and 11.8 (8.6–18.1) ng/mL and 130.0 (83.0–199.0) ng/mL, respectively, in the sub-cohort. The mean ± SD of the iAUC of leptin and ghrelin were 27.62 ng/mL × min and 100.8 ± 162.2 pg/mL × min. Dietary iron intake was significantly higher in the “Sufficient” iron intake (48 (63%)) than the “insufficient” iron intake (28 (37%)) participants (p < 0.0001).

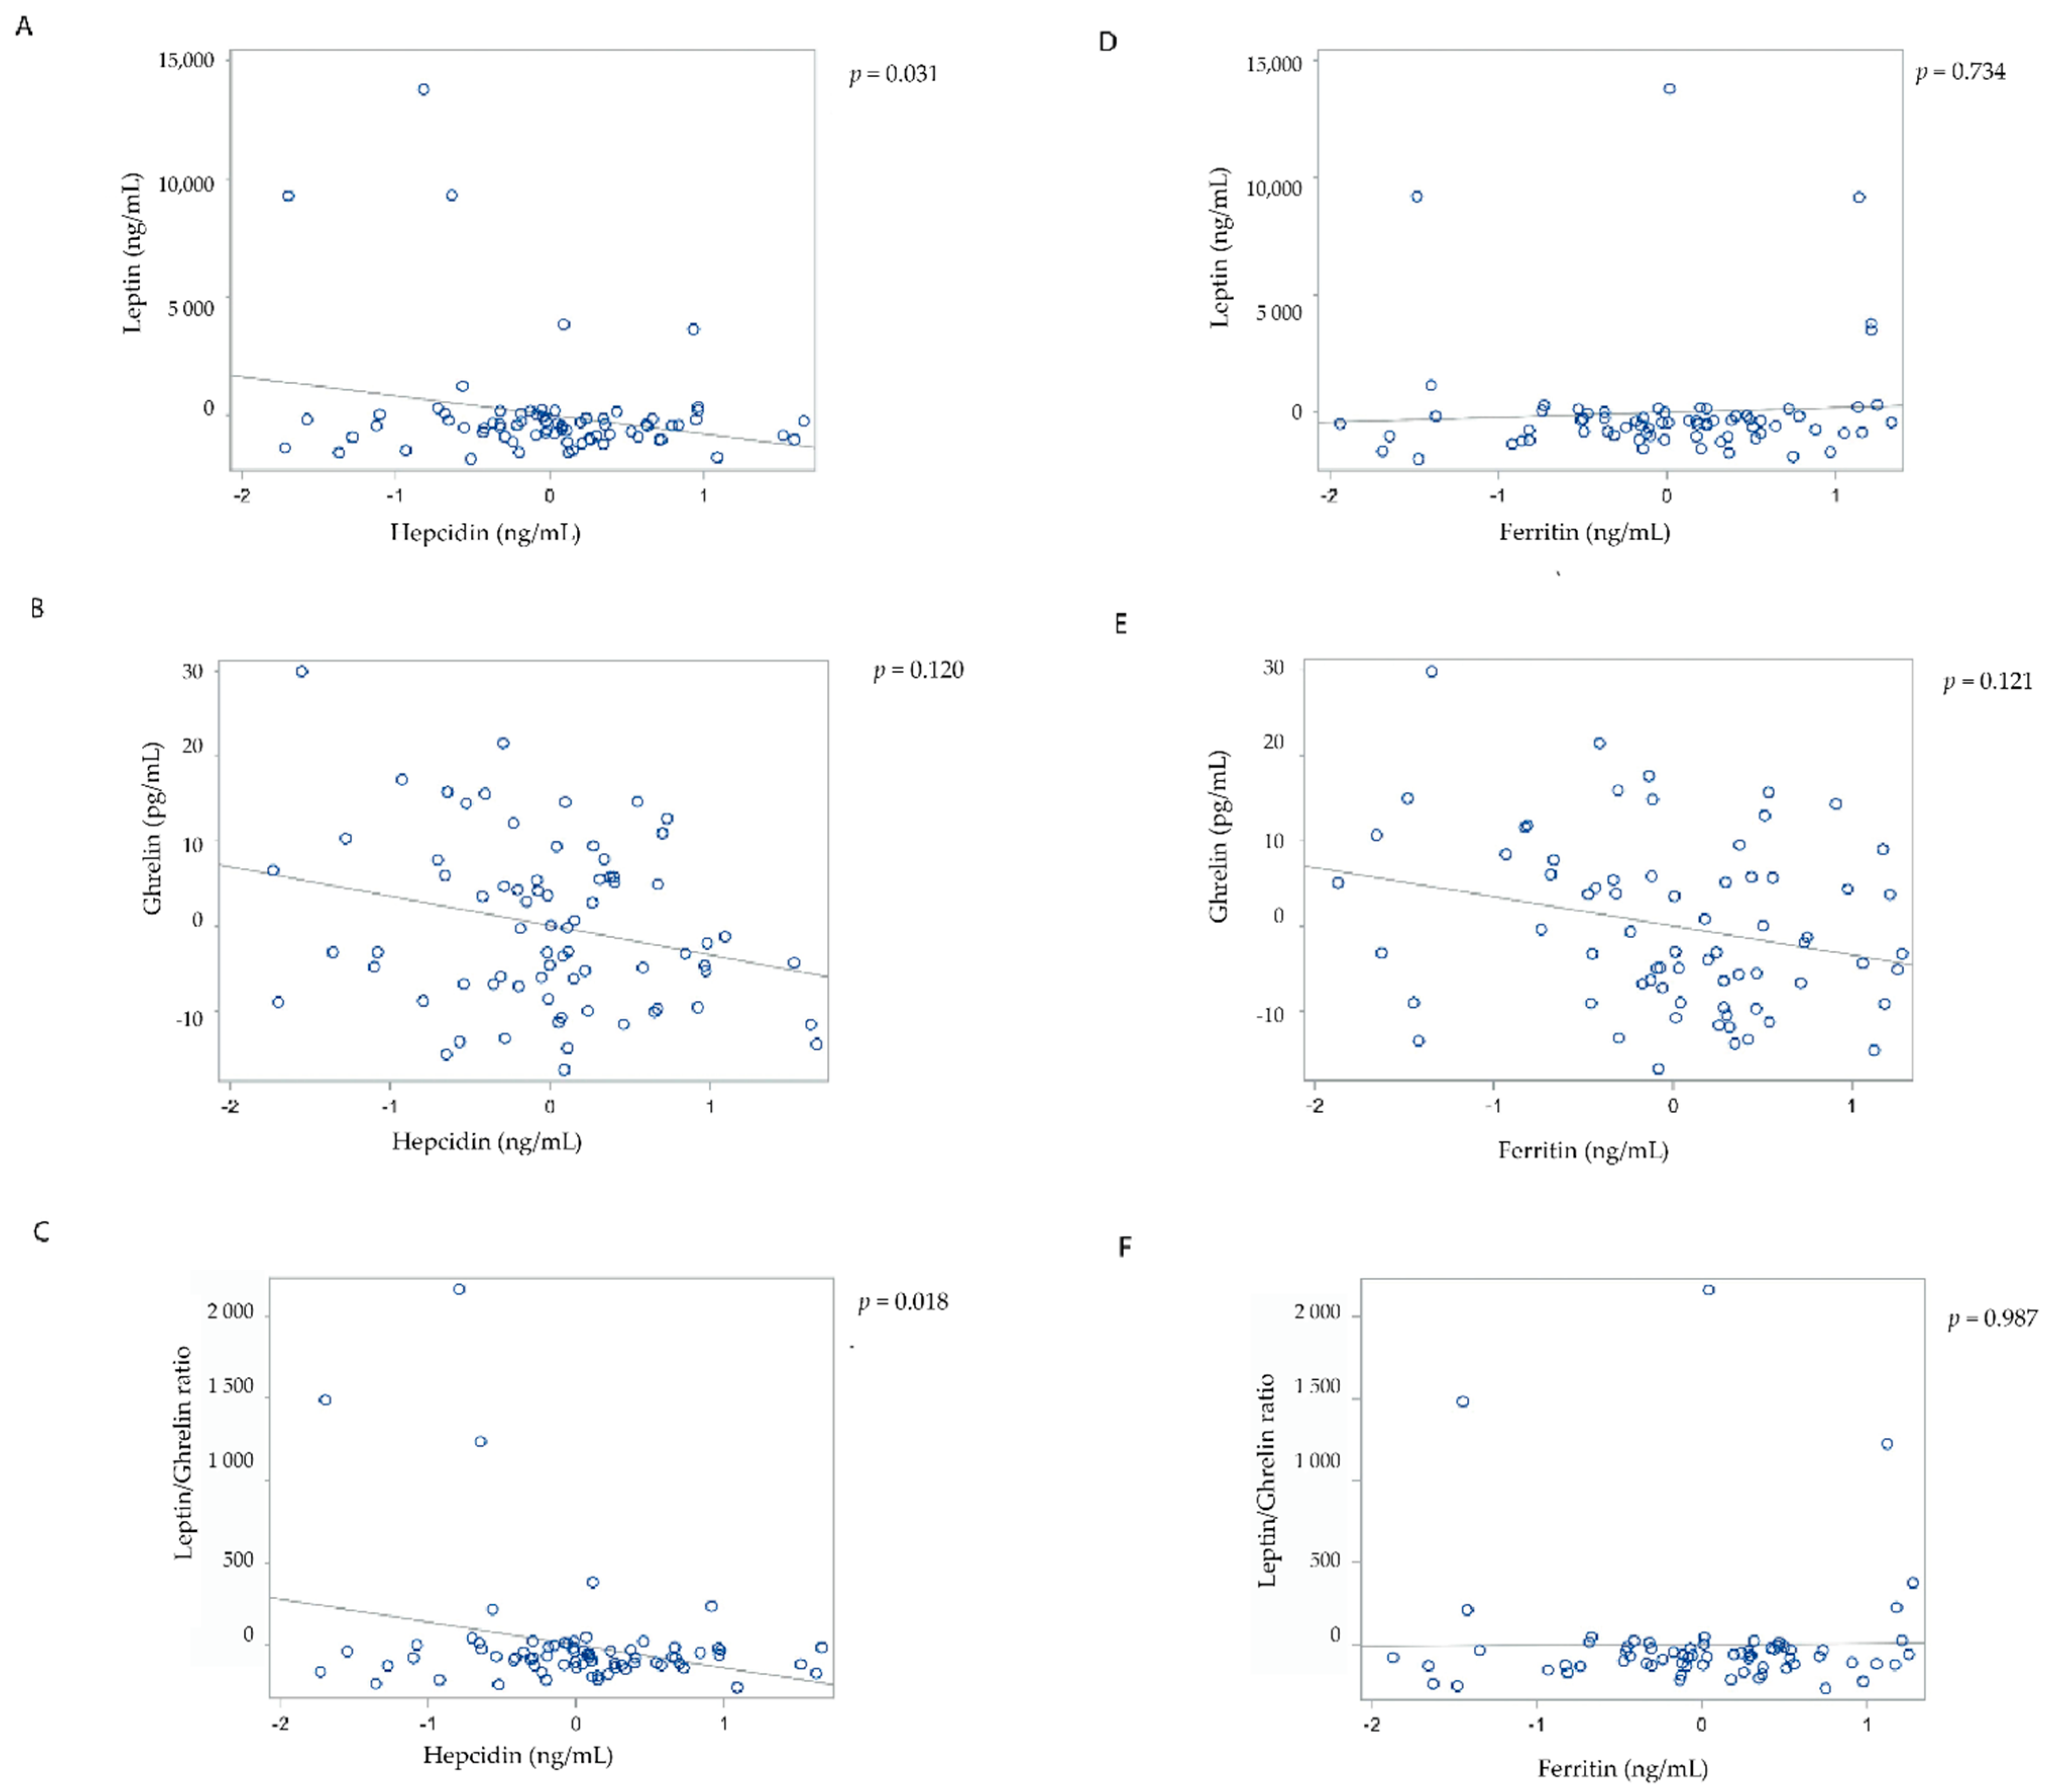
3.2. Associations of Markers of Iron Metabolism in the Overall Cohort

In the fasted state, hepcidin was significantly inversely associated with leptin in both the unadjusted and all the adjusted models. In the most adjusted model (model 4), the β coefficient ± SE was −883.45 ± 400.94; p = 0.031 (Table 2). Hepcidin was significantly inversely associated with the leptin/ghrelin ratio in both the unadjusted and all the adjusted models. In the most adjusted model (model 4), the β coefficient ± SE was −148.26 ± 61.20; p = 0.018. There was no significant association between hepcidin and ghrelin in all the models. Ferritin was not significantly associated with leptin, ghrelin, and the leptin/ghrelin ratio in both the unadjusted and adjusted models (Figure 1).
In the postprandial state, hepcidin was significantly directly associated with iAUC of ghrelin in the unadjusted model but not the adjusted models. In the unadjusted model (model 1), the β coefficient ± SE was 177.59 ± 81.60; p = 0.037. There was no significant association between ferritin and iAUC of ghrelin in all models. Further, iron metabolism markers were not significantly associated with iAUC of leptin, iAUC of ghrelin, and the iAUC leptin/iAUC ghrelin ratio (Table 2).

3.3. Associations of Markers of Iron Metabolism in the Sub-Groups Stratified by Dietary Iron Intake

In individuals with “sufficient” dietary iron intake, there were no significant associations between hepcidin and leptin, ghrelin, and the leptin/ghrelin ratio, in both the unadjusted and adjusted models (Table 3). The same was observed in individuals with “insufficient” dietary iron intake (Table 3). In individuals with “sufficient” dietary iron intake, ferritin was significantly inversely associated with ghrelin in the unadjusted model but not the adjusted models. In the unadjusted model, the β coefficient ± SE was −3.94 ± 1.88; p = 0.042 (Table 3). There were no significant associations between ferritin and leptin or the leptin/ghrelin ratio in both the unadjusted and adjusted models. In individuals with “insufficient” dietary iron intake, there were no significant associations between ferritin and leptin, ghrelin, and the leptin/ghrelin ratio, in both the unadjusted and adjusted models (Table 3).

3.4. Associations of Markers of Iron Metabolism in the Sub-Groups Stratified by Diabetes Status

In individuals with NODAP (n = 37), hepcidin was significantly inversely associated with leptin in the unadjusted and the most adjusted model. In the most adjusted model (model 4), the β coefficient ± SE was −806.09 ± 395.44; p = 0.050. Also, hepcidin was significantly inversely associated with the leptin/ghrelin ratio in both the unadjusted and adjusted models. In the most adjusted model (model 4), the β coefficient ± SE was −129.40 ± 59.14; p = 0.037 (Table 4). There was no significant association between hepcidin and ghrelin in both the unadjusted and adjusted models. There were no significant associations between ferritin and leptin, ghrelin, and the leptin/ghrelin ratio, in both the unadjusted and adjusted models (Table 4).
In individuals with T2DM (n = 23), hepcidin was significantly inversely associated with ghrelin in all but the most adjusted model. In model 3, the β coefficient ± SE was −6.24 ± 2.56; p = 0.028 (Table 4). There were no significant associations between hepcidin and either leptin or the leptin/ghrelin ratio, in both the unadjusted and adjusted models. There were no significant associations between ferritin and leptin, ghrelin, and the leptin/ghrelin ratio, in both the unadjusted and adjusted models (Table 4).
In individuals with normoglycaemia (n = 16), there were no significant associations between hepcidin and leptin, ghrelin, and the leptin/ghrelin ratio, in both the unadjusted and adjusted models. There were no significant associations between ferritin and leptin, ghrelin, and the leptin/ghrelin ratio, in both the unadjusted and adjusted models (Table 4).

4. Discussion

To the best of our knowledge, this is the first study in people with no diseases of iron metabolism reporting the associations between markers of iron metabolism and metabolic signals involved in the maintenance of energy balance (leptin, ghrelin, and the leptin/ghrelin ratio). Moreover, these associations were studied comprehensively by investigating both the fasted and postprandial levels of ghrelin and leptin. The present study also employed statistical models that took into account numerous possible confounding factors, including BMI, that accounted for the possible association between levels of leptin and the amount of adipose tissue [50]. The main finding of the present study was that hepcidin (but not ferritin) was significantly inversely associated with leptin and the leptin/ghrelin ratio in the fasted state (but not in the postprandial state) in both the adjusted and unadjusted models. This association remained significant in individuals with NODAP but not in those who had T2DM or normoglycaemia. The significance of the association with the leptin/ghrelin ratio was mainly driven by leptin and not by ghrelin (as evidenced by the lack of a significant association with ghrelin). Further, the stratification by habitual iron intake did not show any significant association between markers of iron metabolism and the leptin/ghrelin ratio, even after adjusting for demographics, anthropometrics, and other covariates.
The cellular regulation of leptin by iron has recently been suggested. The pioneering work by Gao et al., through studies in rodents and cultured cell models, demonstrated that cellular iron down-regulates transcription of leptin through phosphorylation of cAMP-responsive element-binding protein (i.e., CREB-activation) [26]. Specifically, treatment of 3T3-L1 adipocytes with iron led to CREB-activation and, when the iron-specific binding sites on the leptin promoter were mutated, the effect of iron status on leptin transcription was lost [26]. The iron-induced cellular changes in leptin triggered changes that led to rodent feeding behaviour where mice fed on high-iron chow had decreased leptin and increased food intake [26]. Although the precise mechanism of the link between iron and CREB-activation is unknown, iron has been shown to cause CREB-activation through decreasing levels of protein O-glycosylation (a nutrient-dependent mechanism of leptin regulation) [27]. Given that CREB is a key factor in the transition of fuel utilisation from feeding to fasting (leading to a gradual decrease of leptin) [51] and taking into account the evidence that hepcidin is involved in gluconeogenic sensing in the fasted state (by upregulation through PPARGC1A/CREBH potentiating reduced levels of circulating iron) [52], leptin could be a key mediator of the cross-talk between iron homeostasis and energy metabolism. Although we did not find a significant association between markers of iron metabolism and ghrelin, some cell culture studies showed that ghrelin increases the protein expression of ferroportin 1, internalisation of peripheral iron, and lowers ferritin levels [25]. The latter findings are yet to be reproduced in human studies.
Both iron and leptin have strong associations and are risk factors for derangements of glucose metabolism [53,54,55,56,57,58,59]. A key finding in the present study was the significant inverse association between hepcidin and leptin in individuals with NODAP, but not T2DM. Differing findings in the two types of glucose derangement states were not surprising given the evidence that both types are different. There is ample evidence that individuals with NODAP are at a higher risk of mortality [60], morbidities (including pancreatic cancer [61]), have poorer glycaemic control [62], differing gut hormone responses [47], and have different risks of mortality related to the use of antidiabetic medications [63,64] compared with those with T2DM. Further, NODAP is well characterised as derangements of glucose homeostasis after an attack of acute pancreatitis, whereas the underlying cause of T2DM is typically unknown [35]. In this study, the NODAP group included individuals who developed glucose derangements at an average of 20 months after hospitalisation, whereas T2DM included individuals with longstanding glucose derangements that began before hospitalisation for acute pancreatitis.
Leptin may be a candidate mediator for the link between iron and the development of NODAP because of its relationship with the factors unique to the pathogenesis of NODAP. First, there is evidence of a relationship between leptin and intra-pancreatic fat deposition [65]. One study showed a significant inverse association between leptin and intra-pancreatic fat deposition (determined with the use of magnetic resonance imaging), independent of abdominal fat distribution in individuals after an attack of acute pancreatitis [65]. Taking into account that individuals after an attack of pancreatitis have significantly higher intra-pancreatic fat deposition compared with healthy controls [66] and given the findings of significant inverse associations of intra-pancreatic fat deposition and indices of insulin sensitivity in non-obese NODAP individuals (but not in T2DM) [67], leptin could be a potential driver of glucose metabolism abnormalities in NODAP. Second, it is thought that leptin may share similar appetite regulating pathways with oxyntomodulin—a gut peptide that whose circulating levels are lower in individuals with NODAP [68]. Oxyntomodulin is derived from the posttranslational modification of proglucagon and appears to exert its anorectic actions, in part, through the glucagon-like peptide-1 receptor [69]. There is evidence suggesting that leptin interacts with the glucagon-like peptide-1 receptor in the vagal afferent neurons to induce satiety (by increasing calcium release) [70], potentially directly stimulating the action of oxyntomodulin. Considering that postprandial levels of oxyntomodulin were found to be markedly lower in NODAP compared with T2DM and healthy controls (independent of insulin secretion) [47], it is possible that leptin is an important factor in differentiating the pathogenesis of the two diabetes states. Individuals with NODAP have abnormal iron metabolism [71,72] and it is conceivable that the association between hepcidin and leptin observed in the present study could play a part in the complex pathophysiology of glucose derangements after acute pancreatitis.
Several limitations should be considered in interpreting the results of the present study. First, the cross-sectional nature of the study design precluded us from making a cause-effect inference. Longitudinal studies are warranted to investigate the relationship between iron metabolism and leptin with a view to establishing causality. Second, habitual iron intake was assessed using a food frequency questionnaire whose use might have led to measurement error. However, the EPIC Norfolk food frequency questionnaire is widely validated and gives a robust estimation of food and nutrient intake [43]. Third, undiagnosed diseases of iron metabolism that cause iron overload and deficiency might have affected the study’s associations. However, the median (IQR) of ferritin in our study population was 144.5 (94.5–257.5) ng/mL, negating iron overload and/or deficiency. Fourth, physiological variations between individuals undergoing the mixed meal test might have influenced postprandial responses of ghrelin and leptin. However, the variation of the basal metabolic rate of participants in the present study was minimal, as demonstrated by a mean ± SD of 1595.0 (307.0) kcal/day. Last, leptin and insulin play synergistic glucose-lowering roles and further regulate each other through the adipo–insular axis (where leptin diminishes insulin secretion by pancreatic beta cells and, in turn, insulin stimulates leptin secretion in the adipose tissue) [73,74]. Therefore, insulin levels might have affected the studied associations.
In conclusion, the present findings suggest the existence of an inverse association between hepcidin and leptin in humans with no overt disorders of iron metabolism. The leptin-iron interaction represents a largely unexplored pathway that may play a role in the pathogenesis of NODAP.

Author Contributions

Conceptualisation and study design, M.S.P.; patient recruitment, S.H.B., J.C. and J.K.; analysis and interpretation of data, W.K.; drafting of manuscript, W.K.; critical revision of the manuscript, J.K., J.C., S.H.B. and M.S.P.; study supervision, M.S.P. All authors have read and agreed to the published version of the manuscript.

Funding

This research was funded by the Royal Society of New Zealand (Rutherford Discovery Fellowship to Maxim S. Petrov).

Institutional Review Board Statement

The study was conducted according to the guidelines of the Declaration of Helsinki and approved by the Health and Disability Ethics Committee (13/STH/182).

Informed Consent Statement

Informed consent was obtained from all subjects involved in the study.

Data Availability Statement

All data analysed are included in the present manuscript.

Acknowledgments

The study was part of the Clinical and epidemiOlogical inveStigations in Metabolism, nutritiOn, and pancreatic diseaseS (COSMOS) program.

Conflicts of Interest

The authors declare no conflict of interest.

References

  1. Friedman, J.M.; Halaas, J.L. Leptin and the regulation of body weight in mammals. Nature 1998, 395, 763–770. [Google Scholar] [CrossRef]
  2. Zhang, Y.; Proenca, R.; Maffei, M.; Barone, M.; Leopold, L.; Friedman, J.M. Positional cloning of the mouse obese gene and its human homologue. Nature 1994, 372, 425–432. [Google Scholar] [CrossRef]
  3. Halaas, J.L.; Boozer, C.; Blair-West, J.; Fidahusein, N.; Denton, D.A.; Friedman, J.M. Physiological response to long-term peripheral and central leptin infusion in lean and obese mice. Proc. Natl. Acad. Sci. USA 1997, 94, 8878–8883. [Google Scholar] [CrossRef] [Green Version]
  4. Elmquist, J.K.; Maratos-Flier, E.; Saper, C.B.; Flier, J.S. Unraveling the central nervous system pathways underlying responses to leptin. Nat. Neurosci. 1998, 1, 445–450. [Google Scholar] [CrossRef] [PubMed]
  5. Wierup, N.; Svensson, H.; Mulder, H.; Sundler, F. The ghrelin cell: A novel developmentally regulated islet cell in the human pancreas. Regul. Pept. 2002, 107, 63–69. [Google Scholar] [CrossRef]
  6. Cortelazzi, D.; Cappiello, V.; Morpurgo, P.; Ronzoni, S.; Nobile De Santis, M.; Cetin, I.; Beck-Peccoz, P.; Spada, A. Circulating levels of ghrelin in human fetuses. Eur. J. Endocrinol. 2003, 111–116. [Google Scholar] [CrossRef] [Green Version]
  7. Kirsz, K.; Zieba, D.A. Ghrelin-mediated appetite regulation in the central nervous system. Peptides 2011, 32, 2256–2264. [Google Scholar] [CrossRef]
  8. Hosoda, H. Ghrelin and the regulation of food intake and energy balance. Mol. Interv. 2002, 2, 494–503. [Google Scholar] [CrossRef] [PubMed]
  9. Nakazato, M.; Murakami, N.; Date, Y.; Kojima, M.; Matsuo, H.; Kangawa, K.; Matsukura, S. A role for ghrelin in the central regulation of feeding. Nature 2001, 409, 194–198. [Google Scholar] [CrossRef]
  10. Borer, K.T.; Wuorinen, E.; Burant, C. Ghrelin/leptin ratio tracks energy balance, while ratings of appetite track only meal size and give paradoxical values to exercise energy expenditure. Appetite 2008, 51, 355. [Google Scholar] [CrossRef]
  11. Crujeiras, A.B.; Díaz-Lagares, A.; Abete, I.; Goyenechea, E.; Amil, M.; Martínez, J.A.; Casanueva, F.F. Pre-treatment circulating leptin/ghrelin ratio as a non-invasive marker to identify patients likely to regain the lost weight after an energy restriction treatment. J. Endocrinol. Investig. 2014, 37, 119–126. [Google Scholar] [CrossRef]
  12. Finch, C. Regulators of iron balance in humans. Blood 1994, 84, 1697–1702. [Google Scholar] [CrossRef] [PubMed] [Green Version]
  13. Cook, J.D. Adaptation in Iron Metabolism. Am. J. Clin. Nutr. 1990, 51, 305–308. [Google Scholar] [CrossRef] [PubMed] [Green Version]
  14. Cooksey, R.C.; Jouihan, H.A.; Ajioka, R.S.; Hazel, M.W.; Jones, D.L.; Kushner, J.P.; McClain, D.A. Oxidative stress, β-cell apoptosis, and decreased insulin secretory capacity in mouse models of hemochromatosis. Endocrinology 2004, 145, 5305–5312. [Google Scholar] [CrossRef] [PubMed]
  15. Bao, W.; Rong, Y.; Rong, S.; Liu, L. Dietary iron intake, body iron stores, and the risk of type 2 diabetes: A systematic review and meta-analysis. BMC Med. 2012, 10, 119. [Google Scholar] [CrossRef] [PubMed] [Green Version]
  16. Shi, Z.; Hu, X.; Yuan, B.; Pan, X.; Meyer, H.E.; Holmboe-Ottesen, G. Association between serum ferritin, hemoglobin, iron intake, and diabetes in adults in Jiangsu, China. Diabetes Care 2006, 29, 1878–1883. [Google Scholar] [CrossRef] [PubMed] [Green Version]
  17. Jiang, R.; Ma, J.; Ascherio, A.; Stampfer, M.J.; Willett, W.C.; Hu, F.B. Dietary iron intake and blood donations in relation to risk of type 2 diabetes in men: A prospective cohort study. Am. J. Clin. Nutr. 2004, 79, 70–75. [Google Scholar] [CrossRef] [PubMed] [Green Version]
  18. Pigeon, C.; Ilyin, G.; Courselaud, B.; Leroyer, P.; Turlin, B.; Brissot, P.; Loréal, O. A new mouse liver-specific gene, encoding a protein homologous to human antimicrobial peptide hepcidin, is overexpressed during iron overload. J. Biol. Chem. 2001, 276, 7811–7819. [Google Scholar] [CrossRef] [PubMed] [Green Version]
  19. Jiang, F.; Sun, Z.Z.; Tang, Y.T.; Xu, C.; Jiao, X.Y. Hepcidin expression and iron parameters change in Type 2 diabetic patients. Diabetes Res. Clin. Pract. 2011, 93, 43–48. [Google Scholar] [CrossRef] [PubMed]
  20. Martinelli, N.; Traglia, M.; Campostrini, N.; Biino, G.; Corbella, M.; Sala, C.; Busti, F.; Masciullo, C.; Manna, D.; Previtali, S.; et al. Increased serum hepcidin levels in subjects with the metabolic syndrome: A population study. PLoS ONE 2012, 7, e48250. [Google Scholar] [CrossRef]
  21. Rodríguez-Mortera, R.; Caccavello, R.; Hermo, R.; Garay-Sevilla, M.E.; Gugliucci, A. Higher hepcidin levels in adolescents with obesity are associated with metabolic syndrome dyslipidemia and visceral fat. Antioxidants 2021, 10, 751. [Google Scholar] [CrossRef]
  22. Pechlaner, R.; Weiss, G.; Bansal, S.; Mayr, M.; Santer, P.; Pallhuber, B.; Notdurfter, M.; Bonora, E.; Willeit, J.; Kiechl, S. Inadequate hepcidin serum concentrations predict incident type 2 diabetes mellitus. Diabetes. Metab. Res. Rev. 2016, 32, 187–192. [Google Scholar] [CrossRef]
  23. Bawadi, H.; Katkhouda, R.; Al-Haifi, A.; Tayyem, R.; Elkhoury, C.F.; Jamal, Z. Energy balance and macronutrient distribution in relation to C-reactive protein and HbA1c levels among patients with type 2 diabetes. Food Nutr. Res. 2016, 60, 29904. [Google Scholar] [CrossRef] [PubMed]
  24. Ryan, D.H. Energy balance and weight loss for diabetes remission. Diabetes Spectr. 2020, 33, 117–124. [Google Scholar] [CrossRef] [PubMed]
  25. Luo, Q.Q.; Zhou, G.; Huang, S.N.; Mu, M.D.; Chen, Y.J.; Qian, Z.M. Ghrelin is negatively correlated with iron in the serum in human and mice. Ann. Nutr. Metab. 2018, 72, 37–42. [Google Scholar] [CrossRef]
  26. Gao, Y.; Li, Z.; Gabrielsen, J.S.; Simcox, J.A.; Lee, S.; Jones, D.; Cooksey, B.; Stoddard, G.; Cefalu, W.T.; McClain, D.A. Adipocyte iron regulates leptin and food intake. J. Clin. Investig. 2015, 125, 3681–3691. [Google Scholar] [CrossRef] [PubMed] [Green Version]
  27. Gao, Y.; Liu, J.; Bai, Z.; Sink, S.; Zhao, C.; Lorenzo, F.R.; McClain, D.A. Iron down-regulates leptin by suppressing protein O-GlcNAc modification in adipocytes, resulting in decreased levels of O-glycosylated CREB. J. Biol. Chem. 2019, 294, 5487–5495. [Google Scholar] [CrossRef] [PubMed] [Green Version]
  28. Luo, Q.; Hu, J.; Yang, G.; Yuan, X.; Chen, Z.; Wang, D.; Lu, Y.; Zhu, L.; Wang, G. Fasting increases iron export by modulating ferroportin 1 expression through the ghrelin/GHSR1α/MAPK pathway in the liver. Biol. Trace Elem. Res. 2021, 199, 267–277. [Google Scholar] [CrossRef] [PubMed]
  29. Shahramian, I.; Akhlaghi, E.; Ramezani, A.; Rezaee, A.; Noori, N.; Sharafi, E. A study of leptin serum concentrations in patients with major beta-thalassemia. Iran. J. Pediatr. Hematol. Oncol. 2013, 3, 59–63. [Google Scholar]
  30. Karachaliou, F.; Vlachopapadopoulou, E.; Theochari, M.; Konstandellou, E.; Michalados, S. Leptin levels in patients with thalassemia major. Minerva Pediatr. 2006, 58, 373–378. [Google Scholar] [PubMed]
  31. Dedoussis, G.V.; Kyrtsonis, M.C.; Andrikopoulos, N.E.; Voskaridou, E.; Loutradis, A. Inverse correlation of plasma leptin and soluble transferrin receptor levels in beta-thalassemia patients. Ann. Hematol. 2002, 81, 543–547. [Google Scholar] [CrossRef] [PubMed]
  32. Kucuk, N.; Orbak, Z.; Karakelloglu, C.; Akcay, F. The effect of therapy on plasma ghrelin and leptin levels, and appetite in children with iron deficiency anemia. J. Pediatr. Endocrinol. Metab. 2019, 32, 275–280. [Google Scholar] [CrossRef] [PubMed]
  33. Lawless, J.W.; Latham, M.C.; Stephenson, L.S.; Kinoti, S.N.; Pertet, A.M. Iron supplementation improves appetite and growth in anemic Kenyan primary school children. J. Nutr. 1994, 124, 645–654. [Google Scholar] [CrossRef] [PubMed]
  34. Bharmal, S.H.; Pendharkar, S.A.; Singh, R.G.; Cameron-Smith, D.; Petrov, M.S. Associations between ketone bodies and fasting plasma glucose in individuals with post-pancreatitis prediabetes. Arch. Physiol. Biochem. 2020, 126, 308–319. [Google Scholar] [CrossRef]
  35. Petrov, M.S. Post-pancreatitis diabetes mellitus: Prime time for secondary disease. Eur. J. Endocrinol. 2021, 184, R137–R149. [Google Scholar] [CrossRef]
  36. McKenzie, S.J.L.; Premkumar, R.; Askelund, K.J.; Pendharkar, S.A.; Phillips, A.R.J.; Windsor, J.A.; Petrov, M.S. The effect of enteral nutrition on adipokines in patients with acute pancreatitis. J. Nutr. Sci. 2015, 4, e33. [Google Scholar] [CrossRef] [Green Version]
  37. Wu, L.M.; Premkumar, R.; Phillips, A.R.; Windsor, J.A.; Petrov, M.S. Ghrelin and gastroparesis as early predictors of clinical outcomes in acute pancreatitis. Pancreatology 2016, 16, 181–188. [Google Scholar] [CrossRef]
  38. Kennedy, J.I.; Askelund, K.J.; Premkumar, R.; Phillips, A.R.; Murphy, R.; Windsor, J.A.; Petrov, M.S. Leptin is associated with persistence of hyperglycemia in acute pancreatitis. Medicine 2016, 95, e2382. [Google Scholar] [CrossRef]
  39. Singh, R.G.; Pendharkar, S.A.; Gillies, N.A.; Miranda-Soberanis, V.; Plank, L.D.; Petrov, M.S. Associations between circulating levels of adipocytokines and abdominal adiposity in patients after acute pancreatitis. Clin. Exp. Med. 2017, 17, 477–487. [Google Scholar] [CrossRef]
  40. Maraví Poma, E.; Zubia Olascoaga, F.; Petrov, M.S.; Navarro Soto, S.; Laplaza Santos, C.; Morales Alava, F.; Darnell Martin, A.; Gorraiz López, B.; Bolado Concejo, F.; Casi Villarroya, M.; et al. SEMICYUC 2012. Recommendations for intensive care management of acute pancreatitis. Med. Intensiva 2013, 37, 163–179. [Google Scholar] [CrossRef]
  41. Kimita, W.; Petrov, M.S. Iron metabolism and the exocrine pancreas. Clin. Chim. Acta 2020, 511, 167–176. [Google Scholar] [CrossRef]
  42. Li, X.; Kimita, W.; Cho, J.; Ko, J.; Bharmal, S.H.; Petrov, M.S. Dietary fibre intake in type 2 and new-onset prediabetes/diabetes after acute pancreatitis: A nested cross-sectional study. Nutrients 2021, 13, 1112. [Google Scholar] [CrossRef]
  43. Mulligan, A.A.; Luben, R.N.; Bhaniani, A.; Parry-Smith, D.J.; O’Connor, L.; Khawaja, A.P.; Forouhi, N.G.; Khaw, K.T. A new tool for converting food frequency questionnaire data into nutrient and food group values: FETA research methods and availability. BMJ Open 2014, 4, e004503. [Google Scholar] [CrossRef] [Green Version]
  44. Institute of Medicine (US) Panel on Micronutrients Iron. Dietary Reference Intakes for Vitamin A, Vitamin K, Arsenic, Boron, Chromium, Copper, Iodine, Iron, Manganese, Molybdenum, Nickel, Silicon, Vanadium, and Zinc; National Academies Press (US): Washington, DC, USA, 2001; ISBN 10: 0-309-07290-5. [Google Scholar]
  45. Petrov, M.S.; Basina, M. Diagnosis of endocrine disease: Diagnosing and classifying diabetes in diseases of the exocrine pancreas. Eur. J. Endocrinol. 2021, 184, R151–R163. [Google Scholar] [CrossRef]
  46. Bharmal, S.H.; Pendharkar, S.; Singh, R.G.; Cho, J.; Petrov, M.S. Glucose counter-regulation after acute pancreatitis. Pancreas 2019, 48, 670–681. [Google Scholar] [CrossRef]
  47. Bharmal, S.H.; Cho, J.; Stuart, C.E.; Alarcon Ramos, G.C.; Ko, J.; Petrov, M.S. Oxyntomodulin may distinguish new-onset diabetes after acute pancreatitis from type 2 diabetes. Clin. Transl. Gastroenterol. 2020, 11, e00132. [Google Scholar] [CrossRef]
  48. Cervantes, A.; Singh, R.G.; Kim, J.U.; DeSouza, S.V.; Petrov, M.S. Relationship of anthropometric indices to abdominal body composition: A multi-ethnic New Zealand magnetic resonance imaging study. J. Clin. Med. Res. 2019, 11, 435–446. [Google Scholar] [CrossRef] [Green Version]
  49. Harris, J.A.; Benedict, F.G. A biometric study of human basal metabolism. Proc. Natl. Acad. Sci. USA 1918, 4, 370–373. [Google Scholar] [CrossRef] [PubMed] [Green Version]
  50. Paul, R.F.; Hassan, M.; Nazar, H.S.; Gillani, S.; Afzal, N.; Qayyum, I. Effect of body mass index on serum leptin levels. J. Ayub Med. Coll. Abbottabad 2011, 23, 40–43. [Google Scholar]
  51. Altarejos, J.Y.; Montminy, M. CREB and the CRTC co-activators: Sensors for hormonal and metabolic signals. Nat. Rev. Mol. Cell Biol. 2011, 12, 141–151. [Google Scholar] [CrossRef] [Green Version]
  52. Vecchi, C.; Montosi, G.; Garuti, C.; Corradini, E.; Sabelli, M.; Canali, S.; Pietrangelo, A. Gluconeogenic signals regulate iron homeostasis via hepcidin in mice. Gastroenterology 2014, 146, 1060–1069.e3. [Google Scholar] [CrossRef] [PubMed] [Green Version]
  53. McNeely, M.J.; Boyko, E.J.; Weigle, D.S.; Shofer, J.B.; Chessler, S.D.; Leonnetti, D.L.; Fujimoto, W.Y. Association between baseline plasma leptin levels and subsequent development of diabetes in Japanese Americans. Diabetes Care 1999, 22, 65–70. [Google Scholar] [CrossRef] [PubMed]
  54. Dubuc, P.U. The development of obesity, hyperinsulinemia, and hyperglycemia in ob/ob mice. Metabolism 1976, 25, 1567–1574. [Google Scholar] [CrossRef]
  55. Fumeron, F.; Péan, F.; Driss, F.; Balkau, B.; Tichet, J.; Marre, M.; Grandchamp, B.; Insulin Resistance Syndrome (DESIR) Study Group. Ferritin and transferrin are both predictive of the onset of hyperglycemia in men and women over 3 years: The data from an epidemiological study on the Insulin Resistance Syndrome (DESIR) study. Diabetes Care 2006, 29, 2090–2094. [Google Scholar] [CrossRef] [PubMed] [Green Version]
  56. Jiang, R.; Manson, J.E.; Meigs, J.B.; Ma, J.; Rifai, N.; Hu, F.B. Body iron stores in relation to risk of type 2 diabetes in apparently healthy women. JAMA 2004, 291, 711–717. [Google Scholar] [CrossRef] [PubMed] [Green Version]
  57. Kunutsor, S.K.; Apekey, T.A.; Walley, J.; Kain, K. Ferritin levels and risk of type 2 diabetes mellitus: An updated systematic review and meta-analysis of prospective evidence. Diabetes. Metab. Res. Rev. 2013, 29, 308–318. [Google Scholar] [CrossRef]
  58. Welsh, P.; Murray, H.; Buckley, B.; de Craen, A.; Ford, I.; Jukema, J.; Macfarlane, P.; Packard, C.; Stott, D.; Westendorp, R.; et al. Leptin predicts diabetes but not cardiovascular disease: Results from a large prospective study in an elderly population. Diabetes Care 2009, 32, 308–310. [Google Scholar] [CrossRef] [PubMed] [Green Version]
  59. Wyse, B.M.; Dulin, W.E. The influence of age and dietary conditions on diabetes in the db mouse. Diabetologia 1970, 6, 268–273. [Google Scholar] [CrossRef]
  60. Cho, J.; Scragg, R.; Petrov, M.S. Risk of mortality and hospitalization after post-pancreatitis diabetes mellitus vs type 2 diabetes mellitus: A population-based matched cohort study. Am. J. Gastroenterol. 2019, 114, 804–812. [Google Scholar] [CrossRef]
  61. Cho, J.; Scragg, R.; Petrov, M.S. Postpancreatitis diabetes confers higher risk for pancreatic cancer than type 2 diabetes: Results from a nationwide cancer registry. Diabetes Care 2020, 43, 2106–2112. [Google Scholar] [CrossRef]
  62. Woodmansey, C.; McGovern, A.P.; McCullough, K.A.; Whyte, M.B.; Munro, N.M.; Correa, A.C.; Gatenby, P.A.C.; Jones, S.A.; de Lusignan, S. Incidence, demographics, and clinical characteristics of diabetes of the exocrine pancreas (Type 3c): A retrospective cohort study. Diabetes Care 2017, 40, 1486–1493. [Google Scholar] [CrossRef] [PubMed] [Green Version]
  63. Cho, J.; Scragg, R.; Pandol, S.J.; Goodarzi, M.O.; Petrov, M.S. Antidiabetic medications and mortality risk in individuals with pancreatic cancer-related diabetes and postpancreatitis diabetes: A nationwide cohort study. Diabetes Care 2019, 42, 1675–1683. [Google Scholar] [CrossRef] [PubMed]
  64. Olesen, S.S.; Svane, H.M.L.; Nicolaisen, S.K.; Kristensen, J.K.; Drewes, A.M.; Brandslund, I.; Beck-Nielsen, H.; Nielsen, J.S.; Thomsen, R.W. Clinical and biochemical characteristics of postpancreatitis diabetes mellitus: A cross-sectional study from the Danish Nationwide DD2 cohort. J. Diabetes 2021. [Online ahead of print]. [Google Scholar] [CrossRef] [PubMed]
  65. Singh, R.G.; Nguyen, N.N.; Cervantes, A.; Alarcon Ramos, G.C.; Cho, J.; Petrov, M.S. Associations between intra-pancreatic fat deposition and circulating levels of cytokines. Cytokine 2019, 120, 107–114. [Google Scholar] [CrossRef] [PubMed]
  66. Stuart, C.E.; Ko, J.; Modesto, A.E.; Alarcon Ramos, G.C.; Bharmal, S.H.; Cho, J.; Singh, R.G.; Petrov, M.S. Implications of tobacco smoking and alcohol consumption on ectopic fat deposition in individuals after pancreatitis. Pancreas 2020, 49, 924–934. [Google Scholar] [CrossRef] [PubMed]
  67. Ko, J.; Skudder-Hill, L.; Cho, J.; Bharmal, S.H.; Petrov, M.S. The relationship between abdominal fat phenotypes and insulin resistance in non-obese individuals after acute pancreatitis. Nutrients 2020, 12, 2883. [Google Scholar] [CrossRef]
  68. Cohen, M.A.; Ellis, S.M.; Le Roux, C.W.; Batterham, R.L.; Park, A.; Patterson, M.; Frost, G.S.; Ghatei, M.A.; Bloom, S.R. Oxyntomodulin suppresses appetite and reduces food intake in humans. J. Clin. Endocrinol. Metab. 2003, 88, 4696–4701. [Google Scholar] [CrossRef]
  69. Schepp, W.; Dehne, K.; Riedel, T.; Schmidtler, J.; Schaffer, K.; Classen, M. Oxyntomodulin: A cAMP-dependent stimulus of rat parietal cell function via the receptor for glucagon-like peptide-1 (7-36)NH2. Digestion 1996, 57, 398–405. [Google Scholar] [CrossRef]
  70. Williams, D.L.; Baskin, D.G.; Schwartz, M.W. Leptin regulation of the anorexic response to glucagon-like peptide-1 receptor stimulation. Diabetes 2006, 55, 3387–3393. [Google Scholar] [CrossRef] [Green Version]
  71. Chand, S.K.; Singh, R.G.; Pendharkar, S.A.; Petrov, M.S. Iron: A strong element in the pathogenesis of chronic hyperglycaemia after acute pancreatitis. Biol. Trace Elem. Res. 2018, 183, 71–79. [Google Scholar] [CrossRef]
  72. Chand, S.K.; Singh, R.G.; Pendharkar, S.A.; Bharmal, S.H.; Petrov, M.S. Interplay between innate immunity and iron metabolism after acute pancreatitis. Cytokine 2018, 103, 90–98. [Google Scholar] [CrossRef] [PubMed]
  73. Ceddia, R.B.; Koistinen, H.A.; Zierath, J.R.; Sweeney, G. Analysis of paradoxical observations on the association between leptin and insulin resistance. FASEB J. 2002, 16, 1163–1176. [Google Scholar] [CrossRef] [PubMed]
  74. Seufert, J. Leptin effects on pancreatic β-cell gene expression and function. Diabetes 2004, 53, S152–S158. [Google Scholar] [CrossRef] [PubMed] [Green Version]
Figure 1. Associations between hepcidin and leptin (A), ghrelin (B), and the leptin/ghrelin ratio (C); and ferritin and leptin (D), ghrelin (E), and the leptin/ghrelin ratio (F) in the fasted state. All partial residual plots were adjusted for age, sex, body mass index, use of antidiabetic medications, aetiology of pancreatitis, and recurrence of pancreatitis. Hepcidin and ferritin data were transformed using natural logarithm transformation.
Nutrients 13 03557 g001
Table 1. Characteristics of the study population.
CharacteristicOverall Cohort
(n = 76)
Postprandial Sub-Cohort
(n = 34)
p-Value
Age (years)52.8 (14.9)58.7 (6.4)0.011
Men n (%)51 (67)24 (71)0.850
Body mass index (kg/m2)29.3 (6.3)28.5 (6.4)0.461
Waist circumference (cm)99.6 (14.8)99.2 (15.9)0.973
Hip circumference (cm)104.5 (14.9)101.8 (13.3)0.199
Waist-to-hip ratio 0.96 (0.08)0.97 (0.07)0.131
Fasting plasma leptin (ng/mL)5.4 (2.5–16.2)4.1 (2.4–13.7) a0.010
Fasting plasma ghrelin (pg/mL)16.2 (8.2–25.5)14.4 (9.0–27.7) a0.801
Dietary iron intake (mg/day)9.4 (7.5–13.3)10.4 (8.1–13.5)0.592
Energy intake (kcal/day)1628.0 (1226.5–2135.7)1983.9 (1288.7–2382.3)0.404
Alcohol (g/day)1.6 (0–10.0)3.3 (0–10.7)0.531
Basal metabolic rate (kcal/day)1626.9 (296.0)1595.0 (307.0)0.522
Fasting blood glucose (mmol/L)5.5 (5.1–6.5)5.5 (5.3–7.1)0.215
Haemoglobin A1c (mmol/mol)38 (35–41)40 (37–44)0.202
Recurrence of acute pancreatitis 0.760
No55 (72)23 (68)
Yes21 (28)11 (32)
Aetiology 0.441
Biliary 34 (41)17(51)
Alcohol-related 16 (20)6 (18)
Other 26 (39)10 (30)
Use of antidiabetic medications 0.563
No6630
Yes104
Time since first pancreatitis attack (months)19 (14–27)19.6 (10–23)0.060
Footnotes: Data are presented as mean ± standard deviation median, (interquartile range) or count. a At baseline (0 min) before the mixed meal test. p-values were from t-test (for continuous variables) and chi-square (for categorical variables) between the overall cohort and postprandial sub-cohort. p-values ≤ 0.05 are shown in bold.
Table 2. Associations between hepcidin, ferritin, and markers of energy balance in the fasted and postprandial states.
MarkerStateModelHepcidin Ferritin
βSEp-ValueβSEp-Value
Leptin Fasted1−839.02343.390.017−84.02327.210.798
2−766.37380.790.048183.02382.640.634
3−797.52384.130.042163.51387.230.674
4−883.45400.940.031138.11403.840.734
Postprandial139.7953.480.46384.0533.390.444
2−11.8464.910.85797.4043.020.247
3−13.5966.440.84098.4944.140.171
4−12.2171.670.86683.9545.710.420
Ghrelin Fasted1−2.311.530.136−2.191.420.126
2−2.531.690.139−2.831.670.094
3−1.841.570.247−2.071.560.189
4−2.471.570.120−2.461.560.121
Postprandial1177.5981.600.03728.0272.700.703
2176.1792.700.06723.8788.230.789
3178.6498.090.07915.0192.350.872
4203.55107.530.0708.28100.950.936
Leptin/ghrelin ratioFasted1−135.6451.640.011−25.0150.840.624
2−131.0957.030.0254.2059.490.944
3−136.3257.650.0210.6260.480.992
4−148.2661.200.018−1.0263.920.987
Postprandial1508.933474.500.884−658.641324.330.623
2−1703.074307.240.696−1581.141818.220.394
3−1924.324549.600.676−1587.831933.070.421
4−1501.894261.400.728−939.351902.810.628
Abbreviations: β, regression coefficient estimate; SE, standard error of β. Footnotes: Postprandial data were incremental area under the concentration-time curve for leptin and ghrelin, calculated using the trapezoidal method. Hepcidin and ferritin were transformed using natural logarithm-transformation and fitted as the independent variables in linear regression models. Model 1: unadjusted; model 2: adjusted for age, sex, body mass index; model 3: adjusted for age, sex, body mass index, use of antidiabetic medications; model 4: adjusted for age, sex, body mass index, use of antidiabetic medications, aetiology of acute pancreatitis, recurrence of acute pancreatitis. p-values ≤ 0.05 are shown in bold.
Table 3. Associations between hepcidin, ferritin, and markers of energy balance in the fasted state, stratified by dietary intake.
MarkerIron IntakeModelHepcidinFerritin
βSEp-ValueβSEp-Value
Leptin“Insufficient” iron intake1−560.17527.670.299384.06457.410.409
2−299.91693.950.670995.04571.630.096
3−289.77708.710.690998.47583.610.103
4−456.75718.980.533975.97634.170.141
“Sufficient” iron intake1−678.34460.410.14886.43400.900.830
2−673.04454.840.147−3.74456.760.994
3−714.47469.010.136−22.07476.690.963
4−496.29529.240.35453.15482.070.913
Ghrelin“Insufficient” iron intake1−0.562.720.838−0.662.440.788
2−1.683.480.635−1.813.230.582
3−1.683.520.640−1.643.300.625
4−2.893.370.403−2.993.160.358
“Sufficient” iron intake1−4.112.220.070−3.941.880.042
2−3.982.300.091−4.142.260.075
3−2.331.950.239−2.211.950.263
4−3.202.170.148−2.061.990.308
Leptin/ghrelin ratio“Insufficient” iron intake1−76.1571.960.30160.7765.090.360
2−50.9193.830.593139.1082.510.107
3−50.8995.830.601137.5484.900.121
4−74.0097.200.456119.7088.820.195
“Sufficient” iron intake1−107.56724.540.1457.7864.330.904
2−105.2771.710.150−6.9973.440.925
3−111.1673.890.141−9.8876.520.898
4−696.8985.150.41810.6777.880.892
Abbreviations: β, regression coefficient estimate; SE, standard error of β. Footnotes: Hepcidin and ferritin data were transformed using natural logarithm transformation and fitted as the independent variables in linear regression models. Model 1: unadjusted; model 2: adjusted for age, sex, body mass index; model 3: adjusted for age, sex, body mass index, use of antidiabetic medications; model 4: adjusted for age, sex, body mass index, use of antidiabetic medications, aetiology of acute pancreatitis, recurrence of acute pancreatitis. Insufficient and sufficient iron intake was defined in accordance with the recommendations of the Institute of Medicine [44]. p-values ≤ 0.05 are shown in bold.
Table 4. Associations between hepcidin, ferritin, and markers of energy balance in the fasted state, stratified by diabetes status.
MarkerModelDiabetes StatusHepcidinFerritin
βSEp-Valueβ SEp-Value
Leptin1Normoglycaemia−1964.101549.340.226927.801697.090.595
2 −2813.722088.470.2051484.942131.150.504
3 −2809.742187.830.2281464.942332.290.547
4 −3051.062258.880.2101550.022407.590.540
1T2DM185.92283.340.519108.88283.220.705
2 400.71265.850.149362.17272.180.201
3 351.80275.210.218332.78275.190.244
4 126.98366.450.734191.25317.290.556
1NODAP−818.31346.000.024−336.33301.000.272
2 −752.19389.380.062−214.77412.010.606
3 −754.03395.130.066−212.73418.320.615
4 −806.09395.440.050−302.96415.910.472
Ghrelin1Normoglycaemia−1.693.860.669−3.593.650.345
2 3.555.040.496−5.184.500.280
3 3.585.230.510−6.084.760.237
4 3.785.080.476−5.534.730.281
1T2DM−7.502.780.014−5.943.470.104
2 −7.822.960.018−6.403.770.110
3 −6.242.560.028−5.243.170.121
4 −7.023.700.080−4.414.170.311
1NODAP0.031.930.986−1.021.580.525
2 −0.392.120.856−2.122.100.321
3 0.613.121.856−2.102.130.332
4 −1.272.000.531−2.191.960.274
Leptin/ghrelin ratio1Normoglycaemia−295.69232.250.224118.84255.850.651
2 −439.54305.440.178190.01317.450.564
3 −439.25320.270.200191.90347.430.596
4 −478.67328.580.179202.71357.650.589
1T2DM15.9826.430.55371.7030.430.816
2 29.6925.740.26625.4430.390.416
3 23.3426.340.38920.8630.370.503
4 −8.9235.630.806−8.4137.230.825
1NODAP−133.4151.650.014−63.7545.060.166
2 −121.1358.020.045−49.1661.580.431
3 −121.4458.850.048−48.8162.510.441
4 −129.4059.140.037−62.1962.300.326
Abbreviations: β, regression coefficient estimate; SE, standard error of β; T2DM, type 2 prediabetes/diabetes mellitus; NODAP, new-onset prediabetes/diabetes after acute pancreatitis. Footnotes: Hepcidin and ferritin data were transformed using natural logarithm transformation and fitted as the independent variables in linear regression models. Model 1: unadjusted; model 2: adjusted for age, sex, body mass index; model 3: adjusted for age, sex, body mass index, use of antidiabetic medications, aetiology of acute pancreatitis, recurrence of acute pancreatitis. p-values ≤ 0.05 are shown in bold.
Publisher’s Note: MDPI stays neutral with regard to jurisdictional claims in published maps and institutional affiliations.

