
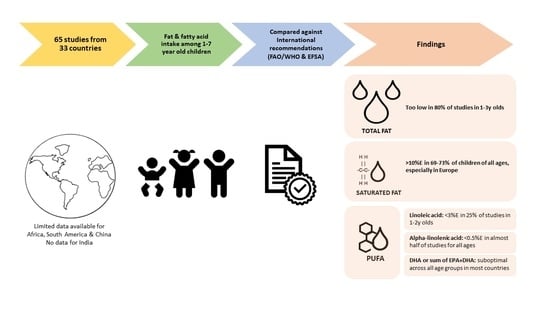
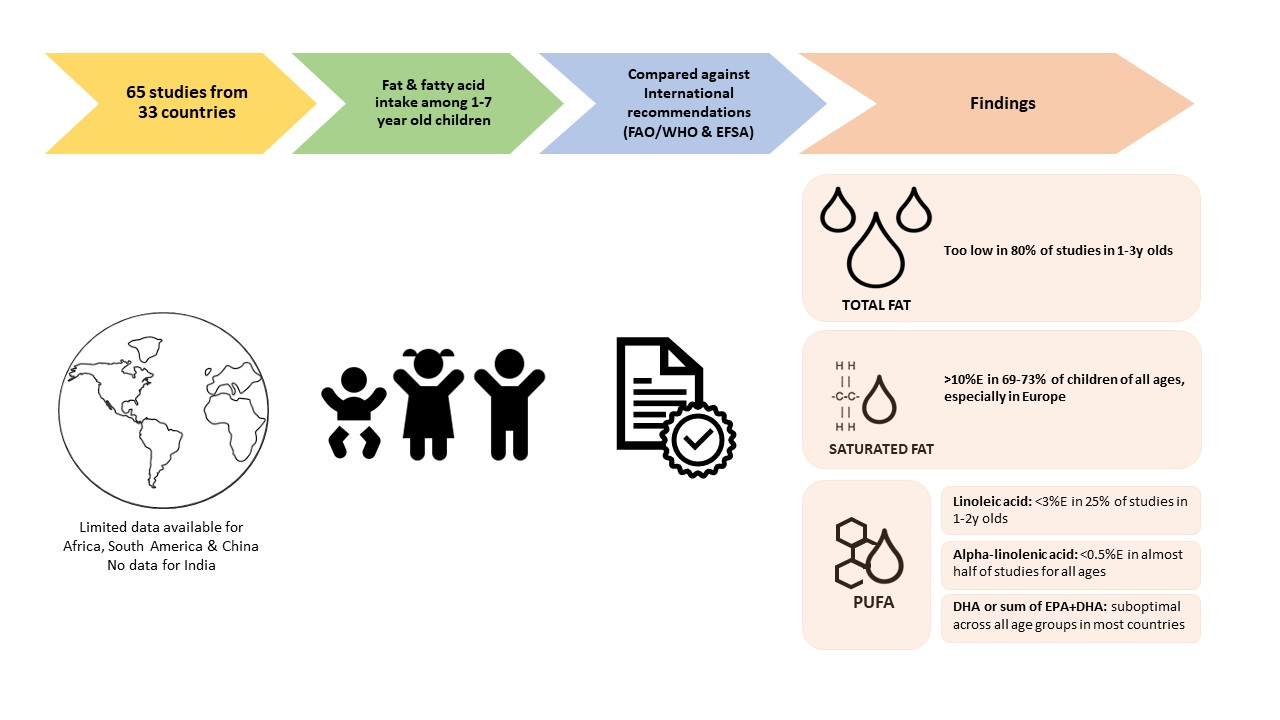
Total Fat and Fatty Acid Intake among 1–7-Year-Old Children from 33 Countries: Comparison with International Recommendations


Abstract
1. Introduction
2. Materials and Methods
2.1. Evaluation of Current Recommendations for Intake of Total Fat and Specific Fatty Acids
2.2. Evaluation of Current Intakes for Total Fat and Specific Fatty Acids
2.2.1. Search Methods for Identification of Studies
2.2.2. Data Selection
2.2.3. Data Extraction
2.2.4. Data Assessment
3. Results
3.1. Intake Recommendations for Total and Specific Fatty Acids
3.1.1. Total Fat Intake Recommendations
3.1.2. Total Saturated Fatty Acid Intake Recommendations
3.1.3. N-6 PUFA—Linoleic and Arachidonic Acid Intake Recommendations
3.1.4. N-3 PUFA: Alpha-Linolenic Acid and EPA + DHA Intake Recommendations
3.1.5. Comparison between FAO/WHO and EFSA Fat Recommendations
3.2. Effective Intake for Total and Specific Fatty Acids
3.2.1. Data Extracted: Reported Intakes of Total and Specific Fatty Acids
- Three in Africa: Gambia, South Africa (two).
- Twelve in North America: Canada (six), USA (four), Mexico (two)
- Three in South America: Argentina, Brazil, Chile
- Fifteen in Asia: Bangladesh, China, Indonesia, Japan (four), South Korea (two), Malaysia, Philippines (two), Singapore (three)
- Twenty-five in Europe: Belgium (two), Cyprus, Finland (three), France (two), Germany (two), Greece, Ireland (two), Italy, Poland, Spain (two), Sweden, The Netherlands (two), UK (four), Turkey
- Two in Middle East: Lebanon, United Arab Emirates (UAE)
- Five in Oceania: Australia (five)

| Country Year Data Collect. Study Type | Ref. | Dietary Method | Population Age, Gender, n | Energy kJ/kcal | Total Fat (%E or g) | SFA (%E or g) | LA (%E or g) | ALA (%E or mg) | DHA (mg) | EPA + DHA (mg) | Other FA |
|---|---|---|---|---|---|---|---|---|---|---|---|
| Africa | |||||||||||
| The Gambia (rural, one village) 1978–80 | Prentice 2000 [43] | >1 d Record | 1–2 y 13–17 Mon. n = 115 | 3673 kJ (878 kcal) 1 | ~27.5%E 2 26.85 g | ~8.7%E 8.49 g | 5.1%E 4.95 g | 0.23%E 220 mg | 80 | NR | MUFA: 12.75 g n-6 PUFA: 5.26 g n-3 PUFA: 380 mg PUFA: 5.61 g ARA: 60 mg |
| 2 y 24 Mon. (=after weaning) n = 42 | 3263 kJ (780 kcal) | ~15%E 13 g | ~3.6%E 3.16 g | 4.6%E 3.99 g | 0.13%E 120 mg | 10 | NR | MUFA: 5.86 g n-6 PUFA: 4 g n-3 PUFA:140 mg PUFA: 4.09 g ARA: 10 mg | |||
| S. Africa 1 (2 similar informal household settlements in Mangaung: Joe Slovo, JB Mafora) 1998 Cross-sectional survey | Dannhauser 2000 [44] | 24 h | 2–3.9 y JS n = 63 JB n = 68 | JS 3424 kJ (1489) ~818 kcal (355.8) JB 4274 kJ (1653) ~1022 kcal (395.1) Medians: JS 3246.78 kJ ~776 kcal JB 3995.72 kJ ~955 kcal | JS ~26.4%E 24 g (12.2) JB ~26%E 29.5 g (19.1) Medians: JS 23.7 g JB 15.3 g | JS ~9.6%E 8.7 g (5) JB ~8.7%E 9.9 g (6.7) Medians: JS 8.2 g JB 8.0 g | “n-6 EFA” JS ~5.5%E 5.0 g (4.2) JB ~6.5%E 7.4 g (7.2) Medians: JS 3.7 g JB 2.9 g | “n-3 EFA” JS ~0.44%E 400 mg JB ~0.35%E 400 mg Medians: JS 300 mg JB 200 mg | NR | NR | PUFA: JS 5.4 g (4.2) JB 7.8 g (7.1) Medians: JS 4.2 g JB 5.9 g |
| 4–5.9 y JS n = 46 JB n = 54 | JS 3780 kJ (1610.8) ~903 kcal (384.9) JB 4383 kJ (1560.6) ~1048 kcal (372.8) Medians: JS 3535.4 kJ ~845 kcal JB 4184 kJ ~1000 kcal | JS ~25.3%E 25.4 g (18.1) JB ~23.8%E 27.7 g (17.3) Medians: JS 22.5 g JB 24 g | JS ~9.0%E 9.0 g (5.4) JB ~7.9%E 9.2 g (5.8) Medians: JS 8.6 g JB 8.9 g | “n-6 EFA” JS ~6.2%E 6.2 g (7.3) JB ~5.8%E 6.7 g (5.6) Medians: JS 3.8 g JB 5.4 g | “n-3 EFA” JS ~0.30%E 300 mg (300) JB ~0.26%E 300 mg (300) Medians: JS 200 mg JB 300 mg | NR | NR | PUFA: JS 6.5 g (7.2) JB 7.1 g (5.6) Median JS 4.1 g JB 5.8 g | |||
| S.Africa 2 2 provinces (mixed urban and rural) (PDIS) 2018–2019 Cross sectional survey | Steyn 2020 [45] | 24 h + 2x (24 h) | 1–<3 y n = 333 | Mean (SE) 3 4944 kJ (244.6) ~1182 kcal (58.5) | 30.3%E (0.9) 39.4 g (2.3) | 8.9%E (0.7) 12 g (1) | NR | NR | NR | NR | MUFA: 9.0%E (0.7) 11.4 g PUFA: 7.8%E (0.5) 9.5 g |
| 3–<6 y n = 514 | 5626 kJ (184.4) ~1345 kcal (44.1) | 28.7%E (0.6) 44 g (2.6) | 8.5%E (0.3) 13.1 g (1.2) | NR | NR | NR | NR | MUFA: 9%E (0.2) 13.7 g PUFA: 8.1%E (0.2) 12.2 g | |||
| America North | |||||||||||
| Canada 1 National (CCHS) 2015 Cross-sectional survey | Barr 2018 [46] | 24 h | 6–12 y (breakfast eaters) n = 2227 | Mean (SE) ~7757.14 kJ (92) 1854 kcal (22) | 30.1 (0.3)%E 64 (1.0) g | ~10.9%E 23.1 (0.4) g | NR | NR | NR | NR | MUFA:~11%E; 22.7 (0.4) g PUFA: ~6%E; 12.4 (0.3) g |
| Canada 2 National (CCHS) 2004 Cross-sectional survey | Health Canada 2012 [47,48] | 24 h | 1–3 y n = NR | ~6700 kJ 4 1611 kcal | 30.3% | 12%E | NR | Median ~0.47% 840 mg | NR | NR | MUFA: 11%E PUFA: 4%E |
| 4–8 y n = NR | ~7995 kJ 4 1911 kcal | 30.1% | 12%E | NR | Median ~0.49% 1023 mg | NR | NR | MUFA: 11%E PUFA: 4%E | |||
| Canada 3 Vancouver 2003 Cross-sectional study | Innis 2004 [49] | FFQ Total n = 84 | 1.5–2 y (18–24 Mon.) n = NR | Mean (SE) 7327 kJ (509) ~1751 kcal (120) | 32(1.83)%E | 26.7 g (3.09) | ~2.98%E 5.80 g (0.57) | ~0.60%E 1160 mg (160) | 41 (10) | ~70 5 | MUFA: 21.4 g (2.36) PUFA: 7.58 g (0.67) EPA: 29 mg (8) ARA: 133 mg (21) |
| 2–3 y (25–36 Mon.) n = NR | Mean (SE) 9619 kJ (707) ~2299 kcal (169) | 34.6(1.53)%E | ~13.3%E 35.7 g (3.67) | ~3.5%E 9.04 g (0.63) | ~0.79%E 2020 mg (230) | 95 (16) | ~152 5 | MUFA: 30.9 g (2.83) PUFA: 11.7 g (0.84) EPA: 57 mg (11) ARA: 260 mg (39) | |||
| 3–5 y (37–60 Mon.) n = NR | Mean (SE) 9518 kJ (426) ~2278 kcal (102) | 32.4(0.75)%E | 12%E 30.4 g (1.67) | ~3.7%E 9.39 g (0.63) | ~0.70%E 1720 mg (170) | 96 (14) | ~156 5 | MUFA: 29.9 g (1.86) PUFA: 11.3 g (0.74) EPA: 60 mg (8) ARA: 226 mg (17) | |||
| Canada 4 Alberta (e.g., far from coastal) 2001–2002 Cross-sectional study | Lien 2009 [50] | 3 d Record | 4–7 y n = 78 | ~7363.8 kJ (1840.96) 1760 (440) kcal Median ~7238 kJ 1730 kcal | 33%E (4.5) 63 g (17) Median 33%E 63 g | 12%E (2.4) 23 g (7.9) Median 12%E 22 g | 3.9%E (1.6) 7.4 g (3.3) Median 3.7%E 6.8 g | 0.36%E (0.20) 710 mg Median 0.35%E 620 mg | 37 (63) Median 16.5 | ~54 | MUFA: 12%E (2.3) = 22 g (6.1) Medians: 11%E = 22 g n-6 PUFA: 7.4 g (3.3) Median: 6.7 g n-3 PUFA: 750 mg (500) Median: 720 mg PUFA: 5.1%E (1.6) = 9.8 g (3.6) Medians: 5%E = 9.4 g ARA: 57 mg (30.5) Median: 51 mg EPA: 17 mg (30.6) Median 4.6 |
| Canada 5 Ontario 2009 Survey type not reported | Madden 2009 [51] | Chemical analysis (3 d food collection aliquots) | 4–8 y n = 41 | Mean (SEM) 5879 kJ (209) ~1405 (50) kcal | 22.8%E (0.9) 36.3 g (2.5) | 8.4%E 13.1 g (0.7) Median 13 g | 4.9%E 7.6 g (0.7) Median 6.3 g | 0.74%E 1161 mg (108) Median 1007 mg | 54.1 (11.4) Median 21.9 | 92.5 (20.2) Median 31.5 | MUFA: 9.3%E,14.6 g n-6 PUFA 5%E, 7.7 g (0.7) n-3 PUFA 0.83%E, 1298 mg (119) PUFA: 5.8%E, 9.0 g ARA: 61.7 mg (5.8) Median 58.5 mg EPA: 38.4 mg (9.3) Median 12.0 mg DPA: 26.3 mg (3.9) Median 18.8 mg |
| Canada 6 Vancouver 2010–2014 Secondary analysis of DBRCT | Wiedeman 2020 [52] | 3 d Record | 1 y (12–14 Mon.) n = 110 | NR | NR | NR | 3.74%E (1.52) 3.95 g (1.78) Median 3.42%E 3.63 g | 0.53%E 0.26) 560 mg (290) Median 0.47%E 500 mg | 31. (58.7) Median 10 | 47. (100) Median 10 | EPA: 16 mg (42.2) Median 0 DPA: 3.52 mg (9.72) Median 0 ARA: 36.8 mg (30.4) Median 30 mg |
| 2 y n = 86 | NR | NR | NR | 4.2%E (1.68) 5.19 g (2.63) Median 3.96%E 4.3 g | 0.59%E (0.31) 740 mg (490) Median 0.49%E 580 mg | 64.8 (107) Median 20 | 100 (177) Median 20 | EPA: 35.8 mg (72.7) Median 0 DPA: 9.42 mg (19.6) Median 0 ARA: 52.7 mg (36.2) Median 45 mg | |||
| Mexico 1 National (ENSANUT) 2012 Cross sectional survey | Jiménez-Aguilar 2018 [53] | 7 d semi-quantitative FFQ | 1–2 y (12–35 Mon.) n = 593 | Median ~4585.66 kJ 1096 kcal | Median ~32.1%E 39.1 g | Median ~14.6%E 17.8 g | NR | NR | NR | NR | Median PUFA: ~5.7%E 7 g |
| 3–4 y (3–59 Mon.) n = 619 | Median ~5669 kJ 1355 kcal | Median ~32.2%E 48.5 g | Median ~14.2%E 21.4 g | NR | NR | NR | NR | Median PUFA: ~6%E 9 g | |||
| Mexico 2 National (ENSANUT) 2006 Cross sectional survey | Ramirez-Silva 2011 [54] | 7 d FFQ | 5–11 y n = 8690 | Mean (SE) ~5840.8 kJ (49.8) 1396 kcal (~11.9) | 26.7%E (0.16) 39.5 g (0.5) | 11.4%E (0.08) 15.6 g (0.2) | ~3.2%E 4.4 g (0.05) | ~0.2%E 300 mg (50) | NR | NR | MUFA: 9.4%E (0.06) 13.1 g (0.15) n-6 PUFA: 3.3%E 4.5 g (0.05) n-3 PUFA: 0.2%E ~300 mg (10) PUFA: 5.9% (0.04) = 8.2 g (0.10) |
| USA 1 National (NHANES) 2009–2012 Cross-sectional survey | Ahluwalia 2016 [55] | 2x 24 h + 1x (24 h) | 1–2 y (12–23 Mon.) n = 516 | Mean (SE) ~4995.7 kJ (103.3) 1194 (24.7) Median: ~4916.2 kJ 1175 kcal | 32.9 (0.4)%E 44.1 (1) g Median: 33% = 43.1 g | ~13.6%E = 18.0 (0.5) g Median: 17.5 g | ~4.98%E = 6.6 (0.2) g Median: 6.3 g | ~0.65%E = 860 (20) mg Median: 830 mg | NR | NR | MUFA: 14.5 (0.5) g Median: 14.1 g PUFA: 7.6 (0.3) g Median: 7.2 g |
| USA 2 National (FITS) 2016 Cross-sectional study | Bailey 2018 [33] | 24 h + 1x (24 h) | 1–2 y (12–23.9 Mon.) n = 1133 | Mean (SE) ~4891.1 kJ (37.6) 1169 kcal (9) Median: ~4732 kJ 1131 kcal | 33 (0.1)%E = 44 ± 0.4 Median: 33%E = 42 g | 13 (0.1)%E = 18 ±0.2 g Median: 13%E = 17 g | NR | NR | NR | NR | NR |
| 2–3 y (24–35.9 Mon.) n = 305 | ~5769.7 kJ (87.86) 1379 kcal (21) Median: ~5594 kJ 1337 kcal | 31 (0.3)%E = 49 ± 0.9 Median: 31%E = 47 g | 11 (0.2)%E = 18 ± 0.4 g Median: 11%E = 17 g | NR | NR | NR | NR | NR | |||
| 3–4 y (36–47.9 Mon.) n = 295 | ~5920 kJ (92.0) 1415 (22) Median: ~5732 kJ 1370 kcal | 31 (0.3)%E = 50 (0.9) g Median: 31%E = 48 g | 11 (0.2)%E = 18 (0.4) g Median: 11%E = 17 g | NR | NR | NR | NR | NR | |||
| USA 3 National (MEC component of NHANES) 2003–2008 Cross-sectional study | Keim 2015 [56] | 24 h | 1–2 y (17–24 Mon.) n = 802 | NR | NR | NR | Mean (SE) ~>5.5%E 6 7.03 (0.290) g | ~0.65%E 6 820 (33) mg | 19.78 (3.00) | ~24.78 | n-6 PUFA: 6.97 (0.29) g n-3 PUFA: 940 (30) mg ARA: 56.13 (3.24) mg EPA: 5 (0.56) |
| 2–3 y (25–36 Mon.) n = 858 | NR | NR | NR | ~>5.5%E 7 7.99 (0.283) g | ~0.59%E 7 860 (32) mg | 20.50 (3.03) | ~26.22 | n-6 PUFA: 8.19 (0.3) g n-3 PUFA: 890 (35) mg ARA: 56.87 (2.71) mg EPA: 5.72 (0.63) mg | |||
| 3–4 y (37–48 Mon.) n = 454 | NR | NR | NR | ~6.2%E 7 9.01 (0.315) g | ~0.59%E 7 870 (34) mg | 20.80 (3.20) | ~27.21 | n-6 PUFA: 9.10 (0.33) g n-3 PUFA: 900 (38) mg ARA: 61.64 (3.96) mg EPA: 6.41 (0.70) mg | |||
| 4–5 y (49–60 Mon.) n = 496 | NR | NR | NR | ~6%E 8 10.16 (0.40) g | ~0.53%E 8 900 (39) mg | 21.00 (3.59) | ~28.18 | n-6 PUFA: 10.16 (0.40) g n-3 PUFA: 930 (43) mg ARA: 67.63 (4.38) mg EPA: 7.18 (0.82) mg | |||
| USA 4 National (NHANES) 2003–2014 Cross-sectional survey | Thompson 2019 [39] | 2x 24 h | 1–5 y n = 5392 | NR | NR | NR | NR | NR | Mean (SE) ~19.5–25 mg 9 16.1 (0.6) mg/1000 kcal | ~24.7–35.4 mg 9 23.1 (0.6) mg/1000 kcal | NR |
| 6–11 y n = 5550 | NR | NR | NR | NR | NR | ~34 mg 10 17.5 (0.9) mg/1000 kcal | ~50.8 mg 10 25.9 (1.4) mg/1000 kcal | NR | |||
| America South | |||||||||||
| Argentina Buenos Aires province 2013 Cross-sectional study | Lazaro-Cuesta 2018 [57] | 24 h | 6–8 y n = 387 | Medians M ~8681.8 kJ 2075 kcal F ~8468.4 kJ 2024 kcal | Medians M ~37.6%E 86.7 g F ~36.7%E 82.5 g | Medians M ~13.1%E 30.2 g F ~11.4%E 25.6 g | NR | NR | NR | NR | Medians MUFA: F 34.4 g; M 30.8 g PUFA: F 22.3 g; M 17.6 g |
| Brazil 9 cities 2007 Cross-sectional study | Bueno 2013 [58] | 1 d Record + 1x (1 d Record) | 2–3 y public school (n = 1278) private school (n = 425) | Mean (SD or SE [not specified]) ~6945.4 kJ (1551) 1660 kcal (371) ~6861.8 kJ (1647.2) 1640 kcal (394) | 28.1 (5.8)%E 28.5 (5.5)%E | 9.9 (2.2)%E 9.9 (2.4)%E | NR | NR | NR | NR | NR |
| 4–6 y public school (n = 1041) private school (n = 314) | ~7066.8 kJ 1689 kcal (364.4) ~6962.2 kJ 1664 kcal (357.3) | 28.6 (5.7)%E 28.8 (5.4)%E | 9.8 (2.1)%E 9.8 (2.2)%E | NR | NR | NR | NR | NR | |||
| Chile South-East Santiago (FECHIC cohort) 2016 Cohort study | Rebolledo 2019 [59] | 24 h + 1x (24 h) | 3–6 y n = 839 (low and middle income) | Mean (SE) ~5259.3 kJ (56.9) 1257 kcal (13.6) | NR | 9.9 (0.1)%E 13.9 (0.2) g | NR | NR | NR | NR | NR |
| Asia | |||||||||||
| Bangladesh 2 rural districts 2007–2008 Cross-sectional survey | Yakes 2011 [60] | 2x (24 h) + correction | 2–3 y (24–35 Mon.) n = 221 | Mean (SE) ~3426.7 kJ 819 kcal (~89) | 17:2 (6.1)%E 15.2 (5.5) g | ~5.7%E 5 (2.5) g | 3.3 (1.4)%E 3 (1.4) g | 0.4 (0.16)%E 370 (168) mg | 30 (20) | NR | MUFA: 5.1 (2.0) g PUFA: 3.5 (1.7) g ARA: 60 (58) mg |
| 3–4 y (36–48 Mon.) n = 236 | ~3895.3 kJ 931 kcal (72) | 12.9 (5.2)%E 13.5 (6) g | ~3.4%E 3.6 (1.9) g | 2.9 (1.3)%E 3.1 (1.6) g | 0.41 (0.18)%E 430 (200) mg | 20 (5) | NR | MUFA: 4.8 (2.2) g PUFA: 3.6 (1.9) g ARA: 50 (31) mg | |||
| China Yunnan province (rural) 2003–2004 Cross-sectional survey | Barbarich 2006 [61] | 3x 24 h | 1–3 y n = 126 | ~2761.4 kJ (1079) 660 kcal (258) | 24 (7)%E 18 (10) g | NR | 2.9 (1.2)%E 2.08 (1.17) g | 0.4 (0.3)%E 278 (229) mg | 34 (148) | NR | n-6 PUFA: 2.2 (1.3)%E 2.14 (1.24) g n-3 PUFA: 0.5 (0.4)%E 366 (343) mg ARA: 55 (42) mg |
| 4–5 y n = 70 | ~3418.3 kJ (933) 817 kcal (223) | 21(7)%E 19 (9) g | NR | 2.5 (1.1)%E 2.27 (1.22) g | 0.4 (0.3)%E 335 (232) mg | 23 (87) | NR | n-6 PUFA: 2.5 (1.1)%E 2.27 (1.22) g n-3 PUFA: 376 (319) mg ARA: 23 (87) mg | |||
| Indonesia National (RISKESDAS) 2010 Cross sectional | Neufingerl 2016 [62] | 1x 24 h | 4–8 y n = 25,417 | Median 4398 kJ ~1050 kcal | Median 27.2%E 31.2 g | Median 11.6%E 13.3 g | Median 3.3%E 4.0 | Median 0.20%E = 245 mg | NR | Median 30 mg | Median PUFA: 4.0%E 4.7 g |
| Japan 1 Seiiku Boshi cohort 2010–2013 Cohort study | Ando 2019 [63] | 1 Mon. FFQ | 3 y n = 153 | 3399.9 kJ (906.3) ~812.6 kcal (217) | NR | NR | n-6 PUFA 11 ~4.7%E 5.0 g (1.5) | ~>0.5%E ~540 mg (estimated) 12 | 98.3 (64.6) | 148.4 (106) | n-3 PUFA: 0.9 g (0.3) PUFA: 5.8 g (1.7) ARA: 53.5 mg (21.4) EPA: 49.4 (43.5) mg |
| Japan 2 National (NHNS-J) 2012 Cross sectional study | Murakami, 2018a [30] | 1 d Record | > = 1–6 y (12–83 Mon.) n = 1289 | Mean (SE) 1278 kcal (10.3) | 28.3 (0.2)%E | 9.2 (0.1)%E | NR | NR | NR | NR | MUFA: 9.8 (0.1)%E PUFA: 5.4 (0.1)%E |
| Japan 3 Nationwide (DONGuRI) 2015 Cross sectional study | Murakami 2018b [64] | 3 d Record | Volunteer children attending nursery facilities 3–5 y (36–71 Mon.) M: 143 F: 143 | Mean (SE) M 5761 kJ (908) ~1377 kcal (180) F: 5414 kJ (920) ~1294 kcal (179) Medians M 5699 kJ ~1362 kcal F 5435 kJ ~1299 | M: 29.3%E (2.3) = 45.3 g (6.1) F: 29.2%E (2.2) = 42.6 g (7.0) Medians M 29.2%E = 44.7 g F 29.3%E = 41.7 g | M 9.9%E (1.4) = 15.2 g (2.5) F 9.6%E (1.2) = 14.1 g (2.5) Medians M 9.8%E = 14.8 g F 9.6%E = 13.7 g | n-6 PUFA 11 4.3% M, 4.5% F M 6.7 g (1.0), F 6.5 g (1.2) Medians: M 6.7 g F 6.3 g | ~ > 0.5%E ~840 mg (estimated) 12 | NR | NR | n-3 PUFA M 1.4 g (0.3), F 1.4 g (0.3) Medians: M 1.4 g, F 1.4 g |
| Japan 4 National (NHNS-J) 2005–2009 Cross-sectional survey | Tsuboyama-Kasaoka 2013 [65] | 1 d Record | > = 1–2 y (19–35 Mon.) M: 351 F: 338 | M: ~1096 kcal 13 F: ~1021.75 kcal 13 | NR | NR | n-6 PUFA 11 M 5.2 g (2.7) 4.27%E F 4.9 g (2.9 (~4.31%E) Median M 4.8 g; F 4.5 g | ~0.52%E ~630 mg (estimated) 12 | NR | NR | n-3 PUFA: M 1.1 g (0.7) F 1.0 g (0.7) (0.9%E) Median M 0.9 g; F 0.9 g |
| > = 3–5 y (36–71 Mon.) M: 631 F: 640 | M: 1428.25 kcal 13 F: 1288 kcal 13 | NR | NR | n-6 PUFA 11 M 7.1 g (3.1) (~4.47%E) F 6.6 g (2.9 (~4.61%E) Median M 6.5 g; F 6.2 g | ~0.55%E ~870 mg (estimated) 12 | NR | NR | n-3 PUFA: Mean (SD) M 1.5 g (1.0) F 1.4 g (0.9) (~0.96%E) Median M 1.2 g; F 1.2 g | |||
| > = 6–7 y (72–95 Mon.) M: 434 F: 453 | M: 1682.75 kcal 13 F: 1539.25 kcal 13 | NR | NR | n-6 PUFA 11 M: 8.4 g (3.6) (~4.49%E) F: 7.8 g (3.5) (~4.56%E) Median M 7.9 g; F 7.2 g | ~0.67%E ~1200 mg (estimated) 12 | NR | NR | n-3 PUFA: M 1.8 g (1.1) F 1.6 g (1.0) (~0.95%E) Median M 1.5 g; F 1.3 g | |||
| Malaysia urban areas 2010–2011 Cross-sectional study | Mohd Shariff 2015 [66] | 24 h + 1x (1d Record) | 1–3 y Income levels: Low (n = 72) Middle (n = 56) High (n = 53) | Mean (SE) L ~5204.9 kJ (186.6) 1244 kcal (44.6) M ~5422 kJ (215.97) 1296 kcal (51.62) H ~5050.1 kJ (221.4) 1207 kcal (52.91) | L 32.61%E (1.12) M 30.29%E (1.29) H 32.5%E (1.33) | L 13.37%E (0.48) M 12.5%E (0.56) H 11.95%E (0.57) | NR | NR | NR | NR | NR |
| 4–6 y Income levels: Low (n = 85) Middle (n = 89) High (n = 78) | L ~4983.1 kJ (152.3) 1191 kcal (36.41) M ~5702.8 kJ (148.4) 1363 kcal (35.47) H ~6460.1 kJ (160.2) 1544 kcal (38.28) | L 32.34%E (1.08) M 30.79%E (1.06) H 33.32%E (1.14) | L 11.88%E (0.45) M 10.68%E (0.44) H 11.65%E (0.48) | NR | NR | NR | NR | NR | |||
| Philippines 1 National (NNS) 2013 | Angeles-Agdeppa 2019 [67] | 24 h + 1x (24 h) | 6–9 y n = 3594 | 1242.6 (SE = 7) Median 1184 | 17.8%E (0.1) = 26.1 g (0.3) Median 17.2%E = 23.1 g | ~9.27%E 12.8 g (0.2) Median 10g | NR | NR | NR | NR | NR |
| Philippines 2 National (NNS) 2013 Cross sectional survey | Denney 2018 [68] | 24 h + 1x (24 h) | 1–2 y n = 714 | Mean (SE) ~3225.9 kJ (50.2) 771 kcal (12) Median ~3000 kJ 717 kcal | 29.6%E = 23.8 g Median 30.3% (20.3 g) | ~9.9%E = 8.5 g Median 7.9 g | NR | NR | NR | NR | NR |
| 2–3 y n = 727 | ~3510.4 kJ (54.4) 839 kcal (13) Median ~3276.1 kJ 783 kcal | 23.4%E = 23.3 g Median 23.1% (20.3 g) | ~9.4 E% = 8.8 g Median 6.9 g | NR | NR | NR | NR | NR | |||
| 3–5 y n = 2427 | ~4171.4 kJ (29.3) 997 kcal (7) Median ~3970.6 kJ 949 kcal | 20.2%E = 24.1 g Median 20% (21 g) | ~9.9%E = 11 gMedian 8 g | NR | NR | NR | NR | NR | |||
| Singapore 1 2015–2016 Validation study | Allan 2018 [69] | 2 d Record vs. FFQ (calibrated) | 12–36 Mon. n = 91 | Medians: Record 4608 kJ ~1101.34 kcal FFQ 4629 kJ ~1106.36 kcal | Medians: Record ~29.9%E 36.7 g FFQ ~30.26%E 37.2 g | Medians: Record ~12.09%E 14.8 g FFQ ~12.28%E 15.1 g | NR | NR | Medians: Record 100 FFQ: 120 | NR | Medians: MUFA Record: 14.1 g FFQ: 14.5 g PUFA Record: 6.1 g FFQ: 6.8 g |
| Singapore 2 Sub-study of GUSTO Study 2011–2013 Validation study | Lim 2019 [70] | 24 h + 1x (24 h) vs. FFQ | 18 Mon. n = 188 | Medians 24 h 3740 kJ 894 kcal FFQ 4301 kJ 1028 kcal | Medians 24 h ~30.2%E; 30 g FFQ ~28.9%E; 33 g | Medians 24 h ~6.5%E; 6.5 g FFQ ~7.0%E; 8.0 g | NR | NR | NR | NR | NR |
| Singapore 3 Sub-study of GUSTO Study 2015–2016 Validation study | Sugianto 2019 [71] | 3 d Record (DR) vs. FFQ | 5 y n = 361 | Means DR ~5389 kJ (1209.2) 1288 kcal (289) FFQ ~6041.7 kJ (2129.7) 1444 kcal (509) | Medians DR ~26.5%E 37.9 g FFQ ~25.0%E 40.1 g | Medians DR ~9.1%E 13.0 g FFQ ~9.3%E 14.9 g | NR | NR | NR | NR | Medians MUFA DR 10.3 g; FFQ 12.4 g PUFA DR: 5.2 g FFQ: 5.1 g |
| South Korea 1 National (KNHANES VI) 2013–15 Cross sectional survey | Baek 2018 [72] | 24 h | 1–2 y n = 401 | NR | Mean (SE) 23.3%E (0.5) 27.1 g (0.8) | Mean (SE) 9.2%E (0.3) 10.5 g (0.3) | n-6 PUFA 11: 3.7%E (0.1) = 4.4 g (0.2) | n-3 PUFA 14: 0.5%E (0.02) = 600 mg (30) | NR | NR | MUFA 7.3%E (0.2) = 8.5 g (0.3) PUFA 4.2%E (0.1) = 4.9 g (0.2) |
| 3–5 y n = 640 | NR | Mean (SE) 23%E (0.3) 35.5(0.7) | Mean (SE) 8.3%E (0.1) 12.7 g (0.3) | n-6 PUFA 11: 4.0%E (0.1) = 6.3 g (0.2) | n-3 PUFA 14 0.6%E (0.02) = 900 mg (40) | NR | NR | MUFA 7.3%E (0.1) = 11.3 g (0.2) PUFA 4.6%E (0.1) = 7.1 g (0.2) | |||
| South Korea 2 National (KNHANES V & VI) 2010–15 Cross sectional survey | Kim 2019 [73] | 24 h | > = 1–2 y (12–24 Mon.) n = 544 | NR | NR | NR | 3.5%E (SEM 0.13) = 3.91 g (SEM 0.14) | 0.47%E (SEM 0.02) = 529.94 mg (SEM 24.28) | 37.02 (SEM 3.46) | ~59.39 | n-6 PUFA: 3.6%E = 4.04 g (SEM 0.14) n-3 PUFA: 0.53%E = 590 mg (SEM 30) ARA = 20.03 mg (SEM 1.52) EPA: 22.37 mg (SEM 1.77) |
| Europe | |||||||||||
| Belgium 1 National 2014–2015 Cross-sectional survey | De Ridder 2015 [42] | 2x 24 h + FFQ | 3–5 y n = 500 | ~5866 kJ 1402 kcal | 32.7%E | 13.5%E | NR | NR | NR | NR | MUFA: 11.6%E PUFA: 5.2%E |
| 6–9 y n = 500 | ~6924.5 kJ 1655 kcal | 34.6%E | 13.2%E | NR | NR | NR | NR | MUFA 12.5%E PUFA 5.6%E | |||
| Belgium 2 (Flanders) 2002–2003 Cross-sectional study | Sioen 2007 [40] | 3 d Record | 2.5–3 y (30–48 Mon.) n = 197 | NR | NR | NR | 4.03%E = 6.667 g | 0.48%E = 798 mg | 43 | ~65 | n-6 PUFA: 4.05%E = 6.685 g n-3 PUFA: 0.53%E = 885 mg EPA: 22 mg DPA: 10 mg ARA: 17 mg |
| 4–6.5 y (49–78 Mon.) n = 464 | NR | NR | NR | 4.25%E = 7.018 g | 0.54%E = 904 mg | 49 | ~75 | n-6 PUFA: 4.24 5%E = 7.030 g n-3 PUFA: 0.58%E = 963 mg EPA 26 DPA: 10 mg ARA: 18 mg | |||
| Cyprus (non-occupied part) Nationally representative sample 2009–2010 Cross-sectional study | Tornaritis 2014 [74] | 3 d Record | 6–8.9 y 162 M, 158 F | M: ~7765.5 kJ (1142) 1856 kcal (273) F: ~7577.2 kJ (1138) 1811 kcal (272) | M: 34.7 (5)%E F: 34.1 (14.2)%E | M: 14 (2.7)%E F: 13.7 (2.6)%E | NR | NR | NR | NR | MUFA: M: 15.2 (3.2)%E; F: 15.1 (2.7)%E PUFA: M: 5 (1.6)%E; F: 4.8 (1.4)%E |
| Finland 1 DAGIS 2015–16 Cross-sectional study | Korkalo 2019 [75] | 3 d Record | 3–4 y n = 324 | 5590 kJ (1100) ~1336 kcal (277) | ~31.7%E = 47 g (13) | ~11.7%E = 17.3 g (5.3) | NR | NR | NR | NR | MUFA 16.5 g (5.1) PUFA 8 g (2.9) |
| 5–6 y n = 233 | 6370 kJ (1250) ~1522 kcal (298) | ~31.9%E = 54 g (14) | ~11.5%E = 19.5 g (6.2) | NR | NR | NR | NR | MUFA 18.8 g (5.3) PUFA 9.4 g (3.1) | |||
| Finland 2 children participating in DIPP study 2003–2005 Cross-sectional study | Kyttälä 2010 [76] | 3 d Record | 1 y n = 455 | 3800 (640) kJ ~908 kcal | 29 (6)%E = 30 (8) g | 11.6 (3.3)%E = 12 (4.2) g | NR | NR | NR | NR | MUFA 10.5%E = 10.5 g PUFA 5.1%E = 5.2 g |
| 2 y n = 230 | 4570 (930) kJ ~1092 kcal | 30 (6)%E = 37 (12) g | 13.2 (3.6)%E = 16.4 (5.9) g | NR | NR | NR | NR | MUFA10.2%E = 12.7 g PUFA 3.8%E = 4.8 g | |||
| 3 y n = 471 | 5210 (990) kJ ~1245 kcal | 31 (6)%E = 43 (13) g | 13.2 (3.1)%E = 18.7 (6.1) g | NR | NR | NR | NR | MUFA 10.5%E = 14.8 g PUFA 4.1%E = 5.7 g | |||
| 4 y n = 554 | 5650 (1050) kJ ~1350 kcal | 31 (5)%E = 48 (13) g | 13.7 (3.2)%E = 21.1 (6.8) g | NR | NR | NR | NR | MUFA13.7%E = 16.3 g PUFA 4.0%E = 6.2 g | |||
| 6 y n = 713 | 6350 (1170) kJ ~1518 kcal | 31 (5)%E = 54 (15) g | 13.7 (3.0)%E = 23.6 (7.3) g | NR | NR | NR | NR | MUFA 10.7%E = 18.5 g PUFA 4.2%E = 7.2 g | |||
| Finland 3 (Kuopio) PANIC Study 2007–2009 Cross-sectional study | Naveed 2020 [77] | 4 d Record | 6–9 y n = 487 (250 M, 237 F) | ALL: ~6799 kJ (1297) 1625 kcal (310) M: ~7150 kJ (1299.6) 1709 kcal (310.6) F: ~6430 kJ (1190) 1537 kcal (284.4) | ALL: 30%E = 54.6 g (14.9) M: 30.4%E = 57.8 g (14.5) F: 29.9%E = 51.1 g (14.5) | ALL: 12.2%E = 22.1 g (7.1) M: 12.3%E = 23.4 g (6.9) F: 12.1%E = 20.7(7.1) | ALL: 3.6%E 6.6 g (2.4) M: 3.6%E = 7.0 g (2.5) F: 3.6%E = 6.1 g (2.3) | ALL: 0.78%E = 1400 (500) mg M: 0.79%E; 1500 (500) mg F: 0.76%E; 1300 (400) mg | ALL: 100 (100) M: 100 (100) F:100 (100) | ALL: ~140 M: ~140 F: ~130 | ALL: MUFA: 18.1 g (5.1) (10%) PUFA: 8.9 g (2.8) (4.9%E) ARA: 90 mg (100) EPA: 40 mg (100) |
| France 1 Nutri-Bébé study 2013 Cross-sectional study | Chouraqui 2020 [78] | 3 d Record | 12–17 Mon., n = 121 | ~3819.6 kJ (1054.8) 912.9 kcal (252.1) Median: ~3714 kJ 887.7 kcal | ~28.1%E = 28.6 (10.7) g Median: ~27.4%E = 27 g | NR | ~2.8%E; 2.844 (1.627) g Median: ~2.92%E 2.884 g | ~0.42%E; 431 (250) Median: ~0.42%E; 417 mg | 36 (68) Median: 18 | NR | ARA: 16 mg (24) Median: 9 mg |
| 18–23 Mon., n = 120 | ~4241.3 kJ 1013.7 kcal (290.5) Median: ~4185.3 kJ 1000.3 kcal | ~29.8%E; 33.6 (11.8) g Median: ~29.5%E; 32.8 g | NR | ~2.74%E; 3.084 (1.638) g Median: ~2.83%E; 3.142 g | ~0.38%E; 427 (227) Median: ~0.37%E; 416 mg | 37(68) Median: 19 | NR | ARA: 25 mg (42) Median: 16 mg | |||
| 24–29 Mon., n = 125 | ~4154.3 kJ (1214.6) 992.9 kcal (290.3) Median: ~4119.15 kJ 984.5 kcal | ~32.6%E 33.7 (13.1) Median: ~29.6%E; 32.4 g | NR | ~2.48%E; 2.559(1.779) g Median: ~2.10%E; 2.297 g | ~0.34%E; 347 (215) mg Median: ~0.28%E; 304 mg | 48(79) Median: 22 | NR | ARA: 23 mg (25) Median: 19 mg | |||
| 30–35 Mon., n = 81 | ~4395.7 kJ (1928.4) 1050.6 kcal (460.9) Median: ~4267.3 kJ 1019.9 kcal | ~30.6%E; 35.7 (20.8) Median: ~29.2%E; 33.1 g | NR | ~2.17%E; 2.534 (1913) Median: ~2.1%E; 2.384 g | ~0.31%E; 356 (289) mg Median: ~0.29%E; 327 mg | 61(131) Median: 37 | NR | ARA: 30 mg (35) Median: 24 mg | |||
| France 2 National (INCA 2) 2006–2007 Cross-sectional study | Guesnet 2019 [79] | 7 d Record | 3–5 y, n = 163 | NR | 38.4%E (5.1) = 62.1(16.9) | NR | 3.7%E (2) 6.1 (4.2) | 0.4%E (0.2) 700 (300) | 107 (303) | 184 (250) | ARA: 70 mg (70) EPA: 77 mg (215) |
| 6–8 y, n = 228 | NR | 38.2%E (4.2) 73.5 (19) | NR | 3.5%E (1.3) 6.8 (2.9) | 0.4%E (0.2) 800 (400) | 80 (55) | 144 (50) | ARA: 77 mg (38) EPA: 60 mg (45) | |||
| Germany 1 DONALD (Dortmund) 2010 Cross-sectional study | Libuda 2014 [80] | 3 d Record | 2–3 y 221 M, 206 F | Median: 4100 kJ ~980 kcal | Median: 34.6%E; 37.2 g | Median: 15.2%E; 15.9 g | NR | NR | NR | NR | Medians: MUFA: 15.7 g; 14.7%E PUFA: 5 g; 4.5 E |
| 4–12 y 296 M, 285 F | Median: 6500 kJ ~1554 kcal | Median: 33.8%E; 59.1 g | Median: 14.8%E; 25.9 g | NR | NR | NR | NR | Medians: MUFA: 23.7 g; 13.7%E PUFA: 8 g; 4.7%E | |||
| Germany 2 National KiGGS (EsKIMO module) 2006 Cross-sectional study | Stahl 2009 [81] | 3 d Record | 6–11 y n = 1234 | Medians: M: 7580 kJ ~1812 kcal F: 7010 kJ ~1676 kcal | Medians: M: 32%E; 66 g F: 32%E; 60 g | Medians: M: ~14%E; 28 g F: ~ 14%E; 26 g | NR | NR | NR | NR | Medians: MUFA: ~11%E (M. 23 g; F: 20 g) PUFA: ~4%E (M. 8 g; F: 8 g) |
| Greece Crete, 2006–2007 Cross-sectional study | Smpokos 2014 [82] | 3 d Record | 5.7–7.6 y, n = 257 | Mean (SE) M 8646 kJ (180) ~2066.4 kcal (43) F 7963 kJ (197) ~1903.2 kcal (47.08) | M 42.8 (0.5)%E F 43.1 (0.6)%E Medians M ~88.4 g F ~82.8 g | M 15.4 (0.3)%E F 15.3 (0.3)%E Medians M ~35.3 g F ~32.4 g | n-6 PUFA 11: M 8 g ~3.5%E F 7.4 g ~3.5%%E | n-3 PUFA 14: M 692 mg ~0.38%E F 590 mg ~0.28%E | NR | NR | MUFA: M 17.6%E (0.3) F 18.1%E (0.4) PUFA: M 4.7%E (0.1) F 4.7%E (0.1) |
| Ireland 1 National NCFS II 2019 Cross-sectional study | O’Connor 2021 [41] | 4 d weighed Record + correction | 5–8 y n = 300 | ~5773.9 kJ (979.1) 1380 kcal (234) | 33.1(3.85)%E; 51.6 (11.0) g | 14.2(2.17)%E; 22.1 (5.20) g | n-6 PUFA 11: 3.50 (0.59)%E; 5.45 (1.32) g | 0.6 (0.16)%E 910 mg (270) | 61.1 (46.6) | 100.3 | MUFA: 13.3%E (1.77) = 20.8 g (4.67) n-3 PUFA: 0.74 (0.18)%E; 1.15 (0.35) g PUFA: 5.49%E (0.97) = 8.51 g (2.09) EPA: 39.2 (29.2) mg |
| Ireland 2 National (NPNS) 2010–2011 Cross-sectional study | Walton 2017 [83] | 4 d weighed Record + correction | 1 y n = 126 | 4300 kJ (300) 1019 kcal (60) | 33.8%E (1.3) 38.8 (2.9) | 15.7%E (0.8) = 18.0 g (1.5) | NR | 0.46 (0.04)%E = 530 (60) mg | 30.3 (10) | 64.6 (15.3) | MUFA: 11.7%E (0.5) = 13.5 g (1.1) n-3 PUFA: 0.52%E (0.05); 600 (100) mg PUFA: 4.1%E (0.3) = 4.7 g (0.5) EPA: 30.2 (7.8) mg |
| 2 y n = 124 | 4800 kJ (300) 1131 kcal (67) | 32.8%E (1.3) 41.8 (3.2) | 14.8%E (0.8) = 18.9 g (1.6) | NR | 0.46 (0.05)%E = 580 (70) mg | 40.2 (14) | 68.2 (16.9) | MUFA: 11.1%E (0.6) = 14.2 g (1.2) n-3 PUFA: 0.52%E (0.05) = 700 (100) mg PUFA: 4.4%E (0.4) = 5.6 g (0.6) EPA: 28.6 (6.7) mg | |||
| 3 y n = 126 | 4800 kJ (300) 1151 kcal (69) | 31.8%E (1.3) 41.3 g (3.2) | 14.5%E (0.8) = 18.9 g (1.7) | NR | 0.44 (0.04)%E 570 (70) mg | 39.5 (14) | 68.0 (17.1) | MUFA: 10.6%E (0.6) = 13.8 g (1.2) n-3 PUFA: 0.5%E (0.05) = 600 (100) mg PUFA: 4.3%E (0.4) = 5.5 g (0.6) EPA: 32.2 (9.1) mg | |||
| 4 y n = 124 | 5300 kJ (300) 1265 kcal (73) | 31.5%E (1.3) 44.8 g (3.4) | 14.1%E (0.8) = 20.1 g (1.7) | NR | 0.44 (0.05)%E = 630 (80) mg | 45.4 (15.4) | 79.8 (19.9) | MUFA: 10.6%E (0.6) = 15.2 g (1.3) n-3 PUFA: 0.5%E (0.05) = 700 (100) mg PUFA: 4.3%E (0.4) = 6.1 g (0.7) EPA: 34.4 (9.3) mg | |||
| Italy National (INRAN-SCAI) 2005–2006 Cross-sectional study | Sette 2011 [84] | 3 d Record | 3–9.9 y n = 193 | 8000 kJ 1914 (488) kcal Median 8000 kJ 1906 kcal | 37.4 (4.9)%E 79.5 (22.8) g Median 37.3%E 78.8 g | 11.9 (2.5)%E 25.4 (8.5) g Median 11.7%E 24.6 g | NR | NR | NR | NR | MUFA: 17.4 (2.8)%E Median 4.4%E 37.0 (10.9) g Median 34.9 g PUFA: 4.5 (1.0)%E Median 4.4%E 9.8 (3.5) g Median 9.3 g |
| The Netherlands 1 2011–2014 Cross sectional study | Goldbohm 2016 [85] | 2 d Record | 1 y n = 411 | 4954 kJ (822) = ~1184 kcal (196) | 28.7%E (4.8) 38 g (10) | 10.3%E (1.9) 13.5 g (3.4) | 5.1%E (1.7) = 6.7 g (2.7) | 0.7%E (0.2) 900 (300) | 20 (50) | ~40 | MUFA: 12.9(4.2) g = 9.8%E (2.4) n-6 PUFA: 5.7 (1.7)%E = 6.8 (2.7) g n-3 PUFA: 1.0 (0.3) g = 0.7%E (0.2) PUFA: 8.0 (3.1) g = 6.1%E (1.9) EPA: 20 mg (30) |
| 2 y n = 497 | 5424 kJ (872) = ~1296 kcal (208) | 28.9%E (4.5) 42 g (10) | 10.3%E (1.8) = 14.8 g (3.7) | 5.0%E (1.5) = 7.2 g (2.6) | 0.7%E (0.2) 1000 (300) | 20 (40) | ~30 | MUFA: 9.9%E (2.3) 14.4 g (4.5) n-6 PUFA: 5.0 (1.5)%E 7.3 (2.6) g n-3 PUFA: 0.7%E (0.2) 1.0 g (0.4) PUFA: 5.9%E (1.7) 8.6 g (3.0) EPA 10 mg (20) | |||
| 3 y (3 y–48 Mon.) n = 410 | 5841 kJ (923) = ~1396 kcal (221) | 29.3%E (4.3) 45 g (11) | 10.4%E (1.7) = 16.1 g (3.8) | 5.1%E (1.5) = 7.9 g (3.0) | 0.7%E (0.2) 1000 (400) | 20 (40) | ~30 | MUFA 10.2%E (2.2) 15.8 g (4.4) n-6 PUFA 5.1 (1.5)%E 8.0 (3.0) g n-3 PUFA 0.7%E (0.2) 1.1 g (0.4) PUFA 6.0%E (1.7) 9.4 g (3.4) EPA 10 mg (30) | |||
| The Netherlands 2 National Survey 2012–2016 Cross sectional study | Van Rossum 2020; Steenbergen 2021 [35,86] | 2x 24 h + FFQ | 1–3 y M: n = 332 F: n = 340 | M: 5500 kJ ~1315 kcal Median 5300 kJ ~1267 kcal F: 5200 kJ ~1243 kcal Median 5100 kJ ~1219 kcal | M: 29.5%E = 44 g Median 29.4%E = 42 g F: 29.4%E = 42 g Median 29.4%E = 41 g | M: 11.1%E = 16 g Median 11%E = 16 g F: 11%E = 16 g Median 10.9%E = 16 g | M: 4.6%E = 7 g Median 4.5%E = 7 g F: 4.6%E = 7 g Median 4.5%E = 6 g | M: 0.6%E = 900 mg Median 0.6%E = 800 mg F: 0.6%E = 900 mg Median 0.6%E = 800 mg | NR | M: 51 Median 34 F: 63 Median 43 | Cis- UFA FA M: 15.8%E = 23 g Median 15.6%E = 22 g F: 15.6%E = 23 g Median 15.4%E = 22 g |
| 4–8 y M: n = 261 F: n = 259 | M: 7600 kJ ~1816 kcal Median 7400 kJ ~1625 kcal F: 6800 kJ ~1625 kcal; Median 6700 kJ ~1601 kcal | M: 31.7%E = 65 g Median 31.6%E = 63 g F: 31.8%E = 58 g Median 31.7%E = 57 g | M: 11.8%E = 24 g Median 11.7%E = 24 g F: 11.8%E = 22 g Median 11.7%E = 21 g | M: 5%E = 11 g Median 4.9%E = 8 g F: 5.1%E = 10 g Median 5.0%E = 7 g | M: 0.6%E = 1300 mg Median 0.6%E = 1200 mg F: 0.6%E = 1100 mg Median 0.6%E = 1100 mg | NR | M: 74 Median 50 F: 81 Median 56 | Cis- UFA FA M: 17%E = 36 g Median 16.8%E = 34 g F: 17.2%E = 32 g Median 17%E = 31 g | |||
| Poland One medium size city & his area Date of data collection not found Cross-sectional study | Merkiel 2014 [87] | 3 d Record | 6 y N = 120 | 7707 kJ (1335) 1840 kcal (319) Median (SE) 7589 kJ (122) 1812 kcal (29) | 32.7 (4.0)%E = 68.2 (16.3) g Median 32.7 (0.4)%E = 66.1 (1.5) g | 14.5 (2.3)%E = 29.79 (8.21) g Median 14.4 (0.2)%E = 29.13 (0.75) g | NR | NR | NR | NR | MUFA: 12.3 (1.8)%E; 25.36 (6.41) g Median 12.2 (0.2)%E 24.38 0.58 PUFA: 4.1 (1.4)%E = 8.26 (2.87) Medians: 3.8 (0.1)%E = 7.87 (0.26) g |
| Spain 1 National (ENALIA) 2013–2014 Cross-sectional study | López-Sobaler 2019 [88] | 2 d Record + FFQ | 1–3 y n = 407 M 218 F 189 | M: ~6188.1 kJ (895); 1479 kcal (214) F: ~5773.9 kJ (723.8); 1380 kcal (173) Medians: M: ~6163 kJ; 1473 kcal F: ~5740 kJ; 1372 kcal | M: 34.6 (3.4)%E; 57.7 g (11.9) F: 34.6 (3.1)%E; 52.8 g (8.7) Medians: M: 34.6%E; 57.1 g F: 34.6%E; 52.2 g | M: 11.9 (3.2)%E; 19.8 g (7) F: 11.9 (3.6)%E; 18.3 g (6.5) Medians: M: 12%E; 19.5 g F: 12%E; 17.7 g | NR | NR | NR | NR | MUFA M: 11.3%E; 19.2 (6.1) g F: 11.6%E; 17.8 (5.0) g Medians: M 11:.3%E; 18.8 g F: 11.5%E; 17.5 g PUFA Means: M: 4.9 (0.9)%E; 8.4; (2.2) g F: 5.0 (0.7)%E; 7.7 (1.3) g Medians: M: 4.8%E; 8.1 g F: 4.9%E; 7.5 g |
| 4–8 y n = 418 M 211 F 207 | M ~ 7727.8 kJ (882) 1847 kcal (211) F ~6912 kJ (657) 1652 kcal (157) Medians M ~7694.4 kJ 1839 kcal F ~6887 kJ 1646 kcal | M 34.8 (2.9)%E = 71.9 g (8.7) g F 35.6 (2.8)%E = 65.4 g (7.2) g Medians M 34.8%E = 71.5 g F 35.6%E = 65.1 g | M 13.1 (1.6)%E = 27.1 g (4.6) F 13.1 (1.9)%E = 24 g (4) Medians M 13.1%E = 26.8 g F 13.1%E = 23.7 g | NR | NR | NR | NR | MUFA M 13.2%E = 27.4 g (4.3) F 14.1%E = 25.9 g (2.6) Medians: M 13.2%E = 27.1 g F 14%E = 25.8 g PUFA M 5.1%E = 10.5 g (0.8) F 4.9%E = 9.1 g (1.7) Medians: M 5.1%E = 10.5 g F 4.8%E = 8.9 g | |||
| Spain 2 Urban areas across 9 Spain geographical areas (EsNuPI Study 2018–2019) prospective, cross-sectional, observational | Madrigal 2020 [89,90] | 2x 24 h + correction | 1–<3 y n = 162 | ~5142 kJ (1452) 1229 kcal (347) Median ~5083.6 kJ 1215 kcal | 36.7%E; 49.6 g (16.84) Median 47.34 g | 13.1%E = 17.58 g (7.81) Median 16.88 g | ~3.7% = 5.03 g (3.28) Median 4.45 g | ~0.26%E = 360 (150) mg Median 350 mg | 80 (120) Median 20 | ~130 | MUFA: 19.19 g (8.75) 14.5%E Median 19.25 n-6 PUFA: 5.09 g (3.28) = 3.6%E Median 4.51 g n-3 PUFA: 0.53 g (0.28) 0.4%E Median 0.49 g PUFA: 5.66 g (3.79) 3.9%E Median 5.15 g DPA: 30 mg (30) Median 20 EPA: 50 mg (70) Median 10 ARA: 60 mg (50) Median 50 |
| 3–<6 y n = 244 | ~6242.5 kJ (1451.8) 1492 kcal (347) Median ~6263.4 kJ 1497 kcal | 36.8%E; 60.83 (17.89) g Median 60.34 g | 13.5%E = 22.43 (7.20) g Median 22.18 g | ~3.8%E; 6.36 (3.24) g Median 5.85 g | ~0.27%E 450 (160) mg Median 430 mg | 80 (140) Median 20 | ~130 | MUFA: 25.56 g (8.21) 15.5%E Median 25.29 g n-6 PUFA: 6.44 g (3.25) 3.9%E Median 5.91 g n-3 PUFA: 0.63 g (0.27) 0.4%E Median 0.59 g PUFA: 7.72 g (3.41) 4.2%E Median 7.16 g DPA: 50 mg (40) Median 40 EPA: 50 mg (70) Median 10 ARA: 80 mg (50) Median 70 | |||
| Sweden National Food Survey 2003 | Enghardt Barbieri, 2003 [91] | 4 d Record | 4 y n = 590 | 6300 kJ 1505 kcal | 31.7%E (4.4) = 54 g (14) Median: 31.7%E = 53 g | 14.4%E (2.5) = 25 g (7) Median: 14.3%E = 24 g | 3%E = 5 g (1.6) Median 4.8 g | 0.6%E = 1000 (300)mg Median 900 mg | 100 (180) Median 60 | 140 | MUFA: 11.3%E (1.8) = 19 g (5) Medians: 11.2%E = 19 g n-6 (LA+ARA): 3%E (0.8); 5 (1.7) g Medians: 2.8%E = 4.9 g n-3 (ALA+ EPA+ DPA+ DHA): 0.7%E (0.2); 1.1(0.5) Medians: 0.6%E = 1.1 g PUFA: 3.7%E (0.9–1.0) = 6 g (2) Medians: 3.5%E = 6 g EPA 40: (80)mg Median: 10 mg DPA: 30 (50) mg Median: 20 mg |
| Turkey Nutrition and Health Survey 2010 Nationally representative Cross-sectional survey | Reported in Rippin 2018 (review) [14] | 24 h FFQ, or face to face interview | 2–5 y | M 5500 kJ 1253 kcal; F 5300 kJ 1190 kcal | M ~37.4%E = 52 g; F~37.0%E = 49 g | M ~12.9%E = 17.9 g; F ~12.8%E = 16.9 g | n-6 PUFA 11: M ~9.1%E = 12.6 g F ~8.7%E = 11.5 g | n-3 PUFA 14: M: ~0.7%E = 1000 mg F 0.7%E = 900 mg | NR | NR | NR |
| 6–8 y | M 1587; F 1510 | M: ~35.2%E = 62 g; F: ~35.8%E = 60 g | M ~12.0%E = 21.1 g; F ~11.7%E = 19.6 g | n-6 PUFA 11: M ~8.8%E = 15.6 g F ~9.3%E = 15.6 g | n-3 PUFA 14: M ~0.6%E = 1100 mg; F ~0.7%E = 1200 mg | NR | NR | NR | |||
| UK 1 National (NDNS) 2008–2011 Cross-sectional survey | Gibson 2014 [92] | 4 d Record | 1.5–3 y n = 185 | 4700 kJ 1110 kcal | 34.1%E = 42 g | 15.1%E = 18.8 g | n-6 PUFA 11: 3.8%E = 4.7 g | n-3 PUFA 14: 0.7%E = 800 mg | NR | NR | MUFA: 13.9 g (11.2%E) |
| UK 2 National (DNSIYC) 2011 Cross-sectional survey | Gibson 2014 [92] | 4 d Record | 12–18 Mon. n = 1275 | 4100 kJ 967 kcal | 35.4%E = 38 g | 16.3%E = 17.5 g | n-6 PUFA 11: 3.7%E = 4 g | n-3 PUFA 14: 0.7%E = 700 mg | NR | NR | MUFA: 12.4 g (11.5%E) |
| UK 3 National (NDNS) 2014–2016 Cross-sectional survey | NDNS website, results from y 7–8 of the Rolling Programme [93] | 4 d Record | 1.5–3 y n = 250 | ~4502 kJ (1013) 1076 kcal (242) Median 4309.5 kJ 1030 kcal | 34.4%E (5.4) = 41.3 (12)g Median: 34.6%E = 39 g | 14.5%E (3.4) = 17.5 (6.2)g Median: 14.7%E = 16.6 g | NR | NR | NR | NR | NR |
| 4–10 y n = 514 | 5991.5 kJ (1368.2) 1432 kcal (327) Median: 4309.5 kJ 1400 kcal | 33.4%E (4.4) = 53.5 g (15.6) Median: 33.7%E = 51.7 g | 13 (2.7)%E = 20.9 (7.1) g Median: 12.9%E = 19.9 g | NR | NR | NR | NR | NR | |||
| UK 4 National (NDNS) 2008–2009 & 2011–2012 Cross-sectional survey | SACN Report 2019 [24] | 3–4 d Record | 4–10 y n = not indicated | NR | NR | NR | n-6 PUFA 11: 4.4 (1.3)%E 7.5 (2.9) g Median: 4.2%E = 7 g | n-3 PUFA 14: = 0.8 (0.3)%E 1400 (600) mg Median: 0.8%E = 1300 mg | NR | NR | MUFA: 20.5 (6.3) g = 12 (2.1)%E Median: 20 g = 11.9%E |
| Middle East | |||||||||||
| Lebanon National 2012 Cross-sectional study | Reported in Nasreddine 2018 (review) [16] | 24 h | 2–5 y n = 531; M: n = 284; F: n = 247 | ~6618.25 kJ (2689.1) 1581.8 kcal (642.7) | 38.8%E = 69.9 g (34.7) | 12.7%E | NR | NR | NR | NR | NR |
| United Arab Emirates (UAE) National Cross-sectional study | Ali 2013 [94] | 24 h | 6–8 y M: n = 78 F: n = 85 | M: ~6389 kJ (SE 284.1) 1527 kcal (SE 67.9) F: ~6125.4 kJ (SE 261.9) 1464 kcal (SE 62.6) | M: 26.3%E (SE 0.9) F: 24.4%E (SE 1.5) | M: 9.77%E (SE 0.6) F:8.9%E (SE 0.7) | NR | NR | NR | NR | NR |
| Oceania | |||||||||||
| Australia 1 Melbourne 2008–2010 Control arm of a RCT | Lioret 2013 [95] | 3x 24 h | 18 Mon. n = 177 | 4473.3 kJ (779.4) 1069 kcal (186.3) Median 4408.4 kJ 1054 kcal | ~32.75%E = 38.9 g (9.3) Median ~32.5%E = 38.1 g | ~16.7%E = 19.8 g (5.2) Median ~16.6%E = 19.4 g | NR | NR | NR | NR | NR |
| Australia 2 National (ANCNPA) 2007 Cross-sectional survey | Meyer 2011 [36] | 2x 24 h | 2–3 y n = 1071 | 6038 kJ 15 1443 kcal | NR | NR | ~3.3%E = 5.3 g (2.7) Median 4.7 g | ~0.53%E = 850 mg (510) Median 750 mg | NR 16 | NR 16 | |
| 4–8 y n = 1216 | 7245 kj 15 1732 kcal | NR | NR | ~3.5%E = 6.7 g (3.4) Median 6.0 g | ~0.57%E = 1010 mg (560) Median 910 mg | NR 16 | NR 16 | ||||
| Australia 3 National (ANCNPA) 2007 Cross-sectional survey | Rahmawaty 2013 [37] | 2x 24 h | 2–3 y n = 1071 | NR | NR | NR | NR | NR | 31.2 (77.2) Median 3.9 | ~47.7 Median ~9.2 mg | LC n-3 PUFA: (EPA+DPA+DHA) 59.7 (128.5) Median: 21.5 mg DPA: 12 mg (18.6) Median: DPA 6.2 mg EPA 16.5 mg (40.5) Median: 5.3 mg |
| 4–8 y n = 1216 | NR | NR | NR | NR | NR | 35.9 (92.7) Median 5.1 | 55.1 | LC n-3 PUFA (EPA+DPA+DHA): 70.5 (152.7) Median: 26.1 DPA: 15.3 (23.5) Median: 8.2 mg EPA: 19.2 (47.6) Median: 6.7 mg | |||
| Australia 4 National (ANCNPA) 2007 Cross-sectional survey | Rangan 2014 [38] | 24 h | 2–8 y n = 2078 (only plausible energy intake reporters) | 7010 kJ (40) ~1675 kcal (9.56) | 30.4%E (0.15) | 13.8%E (0.09) | NR | NR | NR | NR | MUFA: 10.4%E (0.07) PUFA: 3.8%E (0.04) |
| Australia 5 Adelaide (South) 2005–2007 Cross-sectional survey | Zhou 2012 [96] | 3 d Record | 1–2 y n = 92 | Median: 4241 kJ 1013 kcal | Median: 40 g ~35.5%E | Median: 20 g ~17.7%E | Median: n-6 PUFA 11 ~2.11%E 2.380 g | Median: n-3 PUFA 14 474 mg ~0.42%E | NR | NR | Median: n-3 LCPUFA (EPA + DPA + DHA): 22 mg |
| >2–3 y n = 67 | Median: 5024 kJ 1201 kcal | Median: 46 g ~34.5%E | Median: 23 g ~17.2%E | Median: n-6 PUFA 11 3.123 g ~2.34%E | Median: n-3 PUFA 14 562 mg ~0.42%E | NR | NR | Median: n-3 LCPUFA (EPA + DPA + DHA): 20 mg | |||
| >3–4 y n = 70 | Median: 5049 kJ 1207 kcal | Median: 43 g ~32.1%E | Median: 20 g ~14.9%E | Median: n-6 PUFA 11 3.478 g ~2.6%E | Median: n-3 PUFA 14 459 mg ~0.34%E | NR | NR | Median: n-3 LCPUFA (EPA + DPA + DHA): 26 mg | |||
| >4–5 y n = 68 | Median: 5982 kJ 1430 kcal | Median: 51 g ~32.1%E | Median: 24 g ~15.1%E | Median: n-6 PUFA 11 4.357 g ~2.7%E | Median: n-3 PUFA 14 581 mg ~0.37%E | NR | NR | Median: n-3 LCPUFA (EPA + DPA + DHA): 34 mg | |||
3.2.2. Recommended Cut-Off Values Used as a Basis of Comparison between Effective and Recommended Intake
Total Fat
Total SFA
LA
ALA
EPA and DHA
3.2.3. Recommended Intake vs. Effective Intake: Comparisons by Age Group
Children 1–2 Years
Children 2–3 Years
Children 3–5 Years
Children 5–7 Years
4. Discussion
4.1. Summary of Findings
4.2. Methodological Considerations
4.3. Contribution of Breastmilk to Fat and Fatty Acid Intake
4.4. Total Fat
4.5. Total SFA
4.6. Essential Fatty Acids: Linoleic Acid and Alpha-Linolenic Acid
4.7. Arachidonic Acid
4.8. EPA and DHA
4.8.1. Distribution of Intakes within the Population
4.8.2. Effect of Methodology (Dietary Assessment, Food Composition Database, Inclusion of Fish Oil Supplement in the Assessment) on the Results for EPA and DHA
4.8.3. N-3 PUFA Supplementation
4.9. Studies with All Parameters Outside of the Recommended Range
4.10. Strengths and Limitations
5. Conclusions
Supplementary Materials
Author Contributions
Funding
Institutional Review Board Statement
Informed Consent Statement
Conflicts of Interest
References
- Uauy, R.; Dangour, A.D. Fat and Fatty Acid Requirements and Recommendations for Infants of 0–2 Years and Children of 2–18 Years. Ann. Nutr. Metab. 2009, 55, 76–96. [Google Scholar] [CrossRef] [PubMed]
- Milner, J.A.; Allison, R.G. The Role of Dietary Fat in Child Nutrition and Development: Summary of an ASNS Workshop. J. Nutr. 1999, 129, 2094–2105. [Google Scholar] [CrossRef] [PubMed]
- Uauy, R.; Hoffman, D.R.; Peirano, P.; Birch, D.; Birch, E. Essential fatty acids in visual and brain development. Lipids 2001, 36, 885–895. [Google Scholar] [CrossRef] [PubMed]
- Calder, P.C. Functional Roles of Fatty Acids and Their Effects on Human Health. J. Parenter. Enter. Nutr. 2015, 39, 18S–32S. [Google Scholar] [CrossRef] [PubMed]
- Radzikowska, U.; Rinaldi, A.O.; Sözener, Z.; Karaguzel, D.; Wojcik, M.; Cypryk, K.; Akdis, M.; Akdis, C.A.; Sokolowska, M. The Influence of Dietary Fatty Acids on Immune Responses. Nutrients 2019, 11, 2990. [Google Scholar] [CrossRef] [PubMed]
- Drewnowski, A.; Almiron-Roig, E. Human Perceptions and Preferences for Fat-Rich Foods. In Fat Detection: Taste, Texture, and Post Ingestive Effects; Montmayeur, J.P., le Coutre, J., Eds.; CRC Press: Boca Raton, FL, USA, 2010. [Google Scholar]
- French, S.J.; Murray, B.; Rumsey, R.D.E.; Fadzlin, R.; Read, N.W. Adaptation to high-fat diets: Effects on eating behaviour and plasma cholecystokinin. Br. J. Nutr. 1995, 73, 179–189. [Google Scholar] [CrossRef]
- Boyd, K.A.; O’Donovan, D.G.; Doran, S.; Wishart, J.; Chapman, I.M.; Horowitz, M.; Feinle, C. High-fat diet effects on gut motility, hormone, and appetite responses to duodenal lipid in healthy men. Am. J. Physiol. Liver Physiol. 2003, 284, G188–G196. [Google Scholar] [CrossRef] [PubMed]
- Delplanque, B.; Gibson, R.; Koletzko, B.; Lapillonne, A.; Strandvik, B. Lipid Quality in Infant Nutrition: Current Knowledge and Future Opportunities. J. Pediatr. Gastroenterol. Nutr. 2015, 61, 8–17. [Google Scholar] [CrossRef]
- Koletzko, B. Lipids in complementary foods. Pediatrics 2000, 106, 1294. [Google Scholar] [PubMed]
- Sheppard, K.W.; Cheatham, C.L. Omega-6/omega-3 fatty acid intake of children and older adults in the U.S.: Dietary intake in comparison to current dietary recommendations and the Healthy Eating Index. Lipids Health Dis. 2018, 17, 43. [Google Scholar] [CrossRef] [PubMed]
- Huffman, S.L.; Harika, R.K.; Eilander, A.; Osendarp, S.J. Essential fats: How do they affect growth and development of infants and young children in developing countries? A literature review. Matern. Child Nutr. 2011, 7, 44–65. [Google Scholar] [CrossRef]
- Sioen, I.; Van Lieshout, L.; Eilander, A.; Fleith, M.; Lohner, S.; Szommer, A.; Petisca, C.; Eussen, S.; Forsyth, S.; Calder, P.; et al. Systematic Review on N-3 and N-6 Polyunsaturated Fatty Acid Intake in European Countries in Light of the Current Recommendations—Focus on Specific Population Groups. Ann. Nutr. Metab. 2017, 70, 39–50. [Google Scholar] [CrossRef] [PubMed]
- Rippin, H.L.; Hutchinson, J.; Jewell, J.; Breda, J.J.; Cade, J.E. Child and adolescent nutrient intakes from current national dietary surveys of European populations. Nutr. Res. Rev. 2018, 32, 38–69. [Google Scholar] [CrossRef]
- Harika, R.K.; Cosgrove, M.C.; Osendarp, S.J.M.; Verhoef, P.; Zock, P.L. Fatty acid intakes of children and adolescents are not in line with the dietary intake recommendations for future cardiovascular health: A systematic review of dietary intake data from thirty countries. Br. J. Nutr. 2011, 106, 307–316. [Google Scholar] [CrossRef]
- Nasreddine, L.M.; Kassis, A.N.; Ayoub, J.J.; Naja, F.A.; Hwalla, N.C. Nutritional status and dietary intakes of children amid the nutrition transition: The case of the Eastern Mediterranean Region. Nutr. Res. 2018, 57, 12–27. [Google Scholar] [CrossRef]
- Food and Agriculture Organization (FAO); World Health Organization (WHO). Fats and Fatty Acids in Human Nutrition: Report of an Expert Consultation. FAO Food and Nutrition Paper No. 91. 2010. Available online: http://www.fao.org/docrep/013/i1953e/i1953e00.pdf (accessed on 6 April 2021).
- European Food Safety Authority (EFSA) Panel on Dietetic Products, Nutrition, and Allergies. Scientific Opinion on Dietary Reference Values for fats, including saturated fatty acids, polyunsaturated fatty acids, monounsaturated fatty acids, trans fatty acids, and cholesterol. EFSA J. 2010, 8, 1461. [Google Scholar]
- European Food Safety Authority (EFSA) Panel on Dietetic Products, Nutrition, and Allergies. EFSA Scientific Opinion on nutrient requirements and dietary intakes of infants and young children in the European Union. EFSA J. 2013, 11, 3408. [Google Scholar]
- European Food Safety Authority (EFSA) Panel on Dietetic Products, Nutrition, and Allergies. Scientific Opinion on Dietary Reference Values for energy. EFSA J. 2013, 11, 3005. [Google Scholar] [CrossRef]
- World Health Organization. Draft Guidelines on Saturated Fatty Acid and Trans-Fatty Acid Intake for Adults and Children. 2018. Available online: https://cdn.who.int/media/docs/default-source/nutritionlibrary/cfs-vgfsyn/draft-who-sfa-tfa-guidelines-public-consultation.pdf?sfvrsn=dc29c6af_5 (accessed on 21 April 2021).
- Koletzko, B. Human Milk Lipids. Ann. Nutr. Metab. 2016, 69 (Suppl. 2), 27–40. [Google Scholar] [CrossRef] [PubMed]
- World Health Organization. Complementary Feeding: Report of the Global Consultation, and Summary of Guiding Principles for Complementary Feeding of the Breastfed Child. 2002. Available online: https://apps.who.int/iris/bitstream/handle/10665/42739/924154614X.pdf?sequence=1&isAllowed=y (accessed on 23 June 2021).
- Scientific Advisory Committee on Nutrition. Saturated Fats and Health 2019. Available online: https://assets.publishing.service.gov.uk/government/uploads/system/uploads/attachment_data/file/814995/SACN_report_on_saturated_fat_and_health.pdf (accessed on 21 April 2021).
- De la Hunty, A. The COMA report on nutritional aspects of cardiovascular disease: The scientific evidence. Br. Food J. 1995, 97, 30–32. [Google Scholar] [CrossRef]
- Crawford, M.A.; Wang, Y.; Forsyth, S.; Brenna, J.T. The European Food Safety Authority recommendation for polyunsaturated fatty acid composition of infant formula overrules breast milk, puts infants at risk, and should be revised. Prostaglandins Leukot. Essent. Fat. Acids 2015, 102, 1–3. [Google Scholar] [CrossRef] [PubMed]
- Lauritzen, L.; Fewtrell, M.; Agostoni, C. Dietary arachidonic acid in perinatal nutrition: A commentary. Pediatr. Res. 2014, 77, 263–269. [Google Scholar] [CrossRef] [PubMed]
- Koletzko, B.; Bergmann, K.; Brenna, J.T.; Calder, P.C.; Campoy, C.; Clandinin, M.T.; Colombo, J.; Daly, M.; Decsi, T.; Demmelmair, H.; et al. Should formula for infants provide arachidonic acid along with DHA? A position paper of the European Academy of Paediatrics and the Child Health Foundation. Am. J. Clin. Nutr. 2019, 111, 10–16. [Google Scholar] [CrossRef]
- Butte, N.F.; Fox, M.K.; Briefel, R.R.; Siega-Riz, A.M.; Dwyer, J.; Deming, D.M.; Reidy, K.C. Nutrient Intakes of US Infants, Toddlers, and Preschoolers Meet or Exceed Dietary Reference Intakes. J. Am. Diet. Assoc. 2010, 110, S27–S37. [Google Scholar] [CrossRef]
- Murakami, K.; Sasaki, S. A low–glycemic index and –glycemic load diet is associated with not only higher intakes of micronutrients but also higher intakes of saturated fat and sodium in Japanese children and adolescents: The National Health and Nutrition Survey. Nutr. Res. 2018, 49, 37–47. [Google Scholar] [CrossRef] [PubMed]
- Ocké, M.C.; van Rossum, C.T.M.; Fransen, H.P.; Buurma-Rethans, E.J.M.; de Boer, E.J.; Brants, H.A.M.; Niekerk, E.M.; van der Laan, J.D.; Drijvers, J.J.M.M.; Ghameshlou, Z. Dutch National Food Consumption Survey—Young Children 2005/2006. 2014. Available online: https://rivm.openrepository.com/bitstream/handle/10029/256153/350070001.pdf?sequence=3&isAllowed=y (accessed on 12 May 2021).
- Meyer, B.J.; Mann, N.J.; Lewis, J.L.; Milligan, G.C.; Sinclair, A.J.; Howe, P.R.C. Dietary intakes and food sources of omega-6 and omega-3 polyunsaturated fatty acids. Lipids 2003, 38, 391–398. [Google Scholar] [CrossRef] [PubMed]
- Bailey, R.L.; Catellier, D.J.; Jun, S.; Dwyer, J.T.; Jacquier, E.F.; Anater, A.S.; Eldridge, A. Total Usual Nutrient Intakes of US Children (Under 48 Months): Findings from the Feeding Infants and Toddlers Study (FITS) 2016. J. Nutr. 2018, 148, 1557S–1566S. [Google Scholar] [CrossRef] [PubMed]
- Ministry of Health Law, The National Health and Nutrition Survey (NHNS) Japan. 2018. Available online: https://www.nibiohn.go.jp/eiken/english/research/project_nhns.html (accessed on 26 May 2021).
- Van Rossum, C.T.M.; National Institute for Public Health and the Environment. The Diet of the Dutch. Results of the Dutch National Food Consumption Survey 2012–2016. Available online: https://www.rivm.nl/bibliotheek/rapporten/2020-0083.pdf (accessed on 22 June 2021).
- Meyer, B.J.; Kolanu, N. Australian children are not consuming enough long-chain omega-3 polyunsaturated fatty acids for optimal health. Nutrition 2011, 27, 1136–1140. [Google Scholar] [CrossRef] [PubMed]
- Rahmawaty, S.; Charlton, K.; Lyons-Wall, P.; Meyer, B.J. Dietary Intake and Food Sources of EPA, DPA and DHA in Australian Children. Lipids 2013, 48, 869–877. [Google Scholar] [CrossRef] [PubMed]
- Rangan, A.; Allman-Farinelli, M.; Donohoe, E.; Gill, T. Misreporting of energy intake in the 2007 Australian Children’s Survey: Differences in the reporting of food types between plausible, under- and over-reporters of energy intake. J. Hum. Nutr. Diet. 2014, 27, 450–458. [Google Scholar] [CrossRef] [PubMed]
- Thompson, M.; Hein, N.; Hanson, C.; Smith, L.M.; Anderson-Berry, A.; Richter, C.K.; Bisselou, K.S.; Appiah, A.K.; Kris-Etherton, P.; Skulas-Ray, A.C.; et al. Omega-3 Fatty Acid Intake by Age, Gender, and Pregnancy Status in the United States: National Health and Nutrition Examination Survey 2003–2014. Nutrients 2019, 11, 177. [Google Scholar] [CrossRef] [PubMed]
- Sioen, I.; Huybrechts, I.; Verbeke, W.; Van Camp, J.; De Henauw, S. n-6 and n-3 PUFA intakes of pre-school children in Flanders, Belgium. Br. J. Nutr. 2007, 98, 819–825. [Google Scholar] [CrossRef] [PubMed]
- O’Connor, A.; Buffini, M.; Nugent, A.; Kehoe, L.; Flynn, A.; Walton, J.; Kearney, J.; McNulty, B. Dietary fat intakes in Irish children: Changes between 2005 and 2019. Public Health Nutr. 2021, 24, 802–812. [Google Scholar] [CrossRef]
- De Ridder, K.; Bel, S.; Brocatus, L.; Lebacq, T.; Ost, C.; Teppers, E. Les Commanditaires de L’Enquête de Consommation Alimentaire. Résumé des Résultats 2014–2015. 2016. Available online: https://fcs.wiv-isp.be/nl/Gedeelde%20%20documenten/FRANS/Resume_FR_finaal_web (accessed on 27 May 2021).
- Prentice, A.M.; Paul, A.A. Fat and energy needs of children in developing countries. Am. J. Clin. Nutr. 2000, 72, 1253s–1265s. [Google Scholar] [CrossRef] [PubMed]
- Dannhauser, A.; Bester, C.; Joubert, G.; Badenhorst, P.; Slabber, M.; Badenhorst, A.; Du Toit, E.; Barnard, H.; Botha, P.; Nogabe, L. Nutritional status of preschool children in informal settlement areas near Bloemfontein, South Africa. Public Health Nutr. 2000, 3, 303–312. [Google Scholar] [CrossRef][Green Version]
- Steyn, N.P.; Nel, J.H.; Malczyk, S.; Drummond, L.; Senekal, M. Provincial Dietary Intake Study (PDIS): Energy and Macronutrient Intakes of Children in a Representative/Random Sample of 1–l10-Year-Old Children in Two Economically Active and Urbanized Provinces in South Africa. Int. J. Environ. Res. Public Health 2020, 17, 1717. [Google Scholar] [CrossRef]
- Barr, S.I.; Vatanparast, H.; Smith, J. Breakfast in Canada: Prevalence of Consumption, Contribution to Nutrient and Food Group Intakes, and Variability across Tertiles of Daily Diet Quality. A Study from the International Breakfast Research Initiative. Nutrients 2018, 10, 985. [Google Scholar] [CrossRef] [PubMed]
- Health Canada. Do Canadian Adults Meet Their Nutrient Requirements Through Food Intake Alone? 2012. Available online: https://www.canada.ca/en/health-canada/services/food-nutrition/food-nutrition-surveillance/health-nutrition-surveys/canadian-community-health-survey-cchs/canadian-adults-meet-their-nutrient-requirements-through-food-intake-alone-health-canada-2012.html (accessed on 15 June 2021).
- Statistics Canada. Table 13-10-0769-01 Percentage of Total Energy Intake from Fat, by Dietary Reference Intake Age-Sex Group, Household Population Aged 1 and over, Canadian Community Health Survey (CCHS)—Nutrition, Canada and Provinces. Available online: https://www150.statcan.gc.ca/t1/tbl1/en/tv.action?pid=1310076901 (accessed on 20 May 2021).
- Innis, S.M.; Vaghri, Z.; King, D.J. n-6 Docosapentaenoic acid is not a predictor of low docosahexaenoic acid status in Canadian preschool children. Am. J. Clin. Nutr. 2004, 80, 768–773. [Google Scholar] [CrossRef]
- Lien, V.W.; Clandinin, M.T. Dietary assessment of arachidonic acid and docosahexaenoic acid intake in 4–7-year-old children. J. Am. Coll. Nutr. 2009, 28, 7–15. [Google Scholar] [CrossRef]
- Madden, S.M.M.; Garrioch, C.F.; Holub, B.J. Direct Diet Quantification Indicates Low Intakes of (n-3) Fatty Acids in Children 4 to 8 Years Old. J. Nutr. 2009, 139, 528–532. [Google Scholar] [CrossRef] [PubMed]
- Wiedeman, A.M.; Dyer, R.A.; McCarthy, D.; Yurko-Mauro, K.; Innis, S.M.; Devlin, A.M. Biomarkers of Docosahexaenoic Acid but Not Arachidonic Acid Reflect Dietary Intakes in Toddlers at Ages 1 and 2 Years Who Are Not Meeting Dietary Recommendations. J. Nutr. 2019, 150, 518–525. [Google Scholar] [CrossRef] [PubMed]
- Jiménez-Aguilar, A.; Castell, D.G.; Flores, M.; Mundo-Rosas, V.; Hernández-Cordero, S.; García-Feregrino, R. Dietary intake and adequacy in Mexican preschool children: National Health and Nutrition Survey 2012. Nutr. Hosp. 2018, 35, 1186–1194. [Google Scholar] [CrossRef]
- Ramírez-Silva, I.; Villalpando, S.; Moreno-Saracho, J.E.; Bernal-Medina, D. Fatty acids intake in the Mexican population. Results of the National Nutrition Survey 2006. Nutr. Metab. 2011, 8, 33. [Google Scholar] [CrossRef] [PubMed]
- Ahluwalia, N.; Herrick, K.A.; Rossen, L.M.; Rhodes, D.; Kit, B.; Moshfegh, A.; Dodd, K.W. Usual nutrient intakes of US infants and toddlers generally meet or exceed Dietary Reference Intakes: Findings from NHANES 2009–2012. Am. J. Clin. Nutr. 2016, 104, 1167–1174. [Google Scholar] [CrossRef] [PubMed]
- Keim, S.A.; Branum, A.M. Dietary intake of polyunsaturated fatty acids and fish among US children 12–60 months of age. Matern. Child Nutr. 2013, 11, 987–998. [Google Scholar] [CrossRef] [PubMed]
- Lázaro Cuesta, L.; Rearte, A.; Rodríguez, S.; Niglia, M.; Scipioni, H.; Rodriguez, D.; Salinas, R.; Sosa, C.; Rasse, S. Anthropometric and biochemical assessment of nutritional status and dietary intake in school children aged 6–14 years, Province of Buenos Aires, Argentina. Arch. Argent. Pediatr. 2018, 116, e34–e46. [Google Scholar] [PubMed]
- Bueno, M.B.; Fisberg, R.M.; Maximino, P.; Rodrigues, G.D.P.; Fisberg, M. Nutritional risk among Brazilian children 2 to 6 years old: A multicenter study. Nutrition 2013, 29, 405–410. [Google Scholar] [CrossRef]
- Rebolledo, N.; Reyes, M.; Corvalán, C.; Popkin, B.M.; Taillie, L.S. Dietary Intake by Food Source and Eating Location in Low- and Middle-Income Chilean Preschool Children and Adolescents from Southeast Santiago. Nutrients 2019, 11, 1695. [Google Scholar] [CrossRef]
- Yakes, E.A.; Arsenault, J.E.; Islam, M.M.; Ahmed, T.; German, J.B.; Drake, C.; Hossain, M.B.; Lewis, B.L.; Rahman, A.S.; Jamil, K.M.; et al. Dietary Intake of Polyunsaturated Fatty Acids Among Breast-feeding and Non-breast-feeding 24- to 48-month-old Children in Bangladesh. J. Pediatr. Gastroenterol. Nutr. 2011, 52, 351–359. [Google Scholar] [CrossRef]
- Barbarich, B.N.; Willows, N.D.; Wang, L.; Clandinin, M.T. Polyunsaturated fatty acids and anthropometric indices of children in rural China. Eur. J. Clin. Nutr. 2006, 60, 1100–1107. [Google Scholar] [CrossRef][Green Version]
- Neufingerl, N.; Djuwita, R.; Otten-Hofman, A.; Nurdiani, R.; Garczarek, U.; Sulaeman, A.; Zock, P.L.; Eilander, A. Intake of essential fatty acids in Indonesian children: Secondary analysis of data from a nationally representative survey. Br. J. Nutr. 2016, 115, 687–693. [Google Scholar] [CrossRef]
- Ando, E.; Morisaki, N.; Asakura, K.; Ogawa, K.; Sasaki, S.; Horikawa, R.; Fujiwara, T. Association between dietary intake and serum biomarkers of long-chain PUFA in Japanese preschool children. Public Health Nutr. 2020, 24, 593–603. [Google Scholar] [CrossRef]
- Murakami, K.; Okubo, H.; Livingstone, M.B.E.; Fujiwara, A.; Asakura, K.; Uechi, K.; Sugimoto, M.; Wang, H.-C.; Masayasu, S.; Sasaki, S. Adequacy of Usual Intake of Japanese Children Aged 3–5 Years: A Nationwide Study. Nutrients 2018, 10, 1150. [Google Scholar] [CrossRef]
- Tsuboyama-Kasaoka, N.; Takizawa, A.; Tsubota-Utsugi, M.; Nakade, M.; Imai, E.; Kondo, A.; Yoshida, K.; Okuda, N.; Nishi, N.; Takimoto, H. Dietary Intake of Nutrients with Adequate Intake Values in the Dietary Reference Intakes for Japanese. J. Nutr. Sci. Vitaminol. 2013, 59, 584–595. [Google Scholar] [CrossRef] [PubMed][Green Version]
- Mohd Shariff, Z.; Lin, K.G.; Sariman, S.; Lee, H.S.; Siew, C.Y.; Mohd Yusof, B.N.; Mun, C.Y.; Mohamad, M. The relationship between household income and dietary intakes of 1–10 year old urban Malaysian. Nutr. Res. Pract. 2015, 9, 278–287. [Google Scholar] [CrossRef]
- Angeles-Agdeppa, I.; Dinney, L.; Capanzana, M.V. Usual Energy and Nutrient Intakes and Food Sources of Filipino Children Aged 6–12 Years from the 2013 National Nutrition Survey. Nestle Nutr. Inst. Work. Ser. 2019, 91, 111–122. [Google Scholar] [CrossRef]
- Denney, L.; Angeles-Agdeppa, I.; Capanzana, M.V.; Toledo, M.B.; Donohue, J.; Carriquiry, A. Nutrient Intakes and Food Sources of Filipino Infants, Toddlers and Young Children are Inadequate: Findings from the National Nutrition Survey 2013. Nutrients 2018, 10, 1730. [Google Scholar] [CrossRef] [PubMed]
- Allan, C.; Kader, U.H.A.; Ang, J.Y.Y.; Muhardi, L.; Nambiar-Mann, S. Relative validity of a semi-quantitative food frequency questionnaire for Singaporean toddlers aged 15–36 months. BMC Nutr. 2018, 4, 42. [Google Scholar] [CrossRef]
- Lim, H.X.; Toh, J.Y.; Tan, K.H.; Chong, Y.-S.; Yap, F.; Godfrey, K.M.; Lee, Y.S.; Chong, M.F.-F. Validation of a semi-quantitative FFQ for 18-month-old toddlers: The Growing Up in Singapore Towards Healthy Outcomes (GUSTO) study. Public Health Nutr. 2019, 22, 1990–2000. [Google Scholar] [CrossRef]
- Sugianto, R.; Chan, M.J.; Wong, S.F.; Shek, L.P.-C.; Tan, K.H.; Chong, Y.S.; Godfrey, K.M.; Tai, B.C.; Chong, M.F.-F. Evaluation of a Quantitative Food Frequency Questionnaire for 5-Year-Old Children in an Asian Population. J. Acad. Nutr. Diet. 2019, 120, 437–444. [Google Scholar] [CrossRef] [PubMed]
- Baek, Y.; Shim, J.E.; Song, S. Dietary intake of fat and fatty acids by 1–5-year-old children in Korea: A cross-sectional study based on data from the sixth Korea National Health and Nutrition Examination Survey. Nutr. Res. Pract. 2018, 12, 324–335. [Google Scholar] [CrossRef] [PubMed]
- Kim, Y.; Kim, H.; Kwon, O. Dietary intake of n-3 and n-6 polyunsaturated fatty acids in Korean toddlers 12–24 months of age with comparison to the dietary recommendations. Nutr. Res. Pract. 2019, 13, 344–351. [Google Scholar] [CrossRef]
- Tornaritis, M.J.; Philippou, E.; Hadjigeorgiou, C.; Kourides, Y.A.; Panayi, A.; Savva, S.C. A study of the dietary intake of Cypriot children and adolescents aged 6–18 years and the association of mother’s educational status and children’s weight status on adherence to nutritional recommendations. BMC Public Health 2014, 14, 13. [Google Scholar] [CrossRef]
- Korkalo, L.; Nissinen, K.; Skaffari, E.; Vepsäläinen, H.; Lehto, R.; Kaukonen, R.; Koivusilta, L.; Sajaniemi, N.; Roos, E.; Erkkola, M. The Contribution of Preschool Meals to the Diet of Finnish Preschoolers. Nutrients 2019, 11, 1531. [Google Scholar] [CrossRef]
- Kyttälä, P.; Erkkola, M.; Kronberg-Kippilä, C.; Tapanainen, H.; Veijola, R.; Simell, O.; Knip, M.; Virtanen, S. Food consumption and nutrient intake in Finnish 1–6-year-old children. Public Health Nutr. 2010, 13, 947–956. [Google Scholar] [CrossRef]
- Naveed, S.; Venäläinen, T.; Eloranta, A.-M.; Erkkilä, A.T.; Jalkanen, H.; Lindi, V.; Lakka, T.A.; Haapala, E.A. Associations of dietary carbohydrate and fatty acid intakes with cognition among children. Public Health Nutr. 2020, 23, 1657–1663. [Google Scholar] [CrossRef]
- Chouraqui, J.P.; Tavoularis, G.; Simeoni, U.; Ferry, C.; Turck, D. Food, water, energy, and macronutrient intake of non-breastfed infants and young children (0–3 years). Eur. J. Nutr. 2020, 59, 67–80. [Google Scholar] [CrossRef]
- Guesnet, P.; Tressou, J.; Buaud, B.; Simon, N.; Pasteau, S. Inadequate daily intakes of n-3 polyunsaturated fatty acids (PUFA) in the general French population of children (3–10 years) and adolescents (11–17 years): The INCA2 survey. Eur. J. Nutr. 2018, 58, 895–903. [Google Scholar] [CrossRef]
- Libuda, L.; Alexy, U.; Kersting, M. Time trends in dietary fat intake in a sample of German children and adolescents between 2000 and 2010: Not quantity, but quality is the issue. Br. J. Nutr. 2013, 111, 141–150. [Google Scholar] [CrossRef]
- Ståhl, A.; Vohmann, C.; Richter, A.; Heseker, H.; Mensink, G.B. Changes in food and nutrient intake of 6- to 17-year-old Germans between the 1980s and 2006. Public Health Nutr. 2009, 12, 1912–1923. [Google Scholar] [CrossRef][Green Version]
- Smpokos, E.A.; Linardakis, M.; Papadaki, A.; Theodorou, A.S.; Havenetidis, K.; Kafatos, A. Differences in energy and nutrient-intake among Greek children between 1992/93 and 2006/07. J. Hum. Nutr. Diet. 2014, 27, 230–238. [Google Scholar] [CrossRef]
- Walton, J.; Kehoe, L.; McNulty, B.; Nugent, A.; Flynn, A. Nutrient intakes and compliance with nutrient recommendations in children aged 1–4 years in Ireland. J. Hum. Nutr. Diet. 2017, 30, 665–676. [Google Scholar] [CrossRef]
- Sette, S.; Le Donne, C.; Piccinelli, R.; Arcella, D.; Turrini, A.; Leclercq, C. The third Italian National Food Consumption Survey, INRAN-SCAI 2005-06-part 1: Nutrient intakes in Italy. Nutr. Metab. Cardiovasc. Dis. 2011, 21, 922–932. [Google Scholar] [CrossRef]
- Goldbohm, R.A.; Rubingh, C.M.; Lanting, C.I.; Joosten, K.F.M. Food Consumption and Nutrient Intake by Children Aged 10 to 48 Months Attending Day Care in The Netherlands. Nutrients 2016, 8, 428. [Google Scholar] [CrossRef]
- Steenbergen, E.; Krijger, A.; Verkaik-Kloosterman, J.; Elstgeest, L.; ter Borg, S.; Joosten, K.; van Rossum, C. Evaluation of Nutrient Intake and Food Consumption among Dutch Toddlers. Nutrients 2021, 13, 1531. [Google Scholar] [CrossRef] [PubMed]
- Merkiel, S. Dietary intake in 6-year-old children from southern Poland: Part 1—Energy and macronutrient intakes. BMC Pediatr. 2014, 14, 197. [Google Scholar] [CrossRef]
- López-Sobaler, A.M.; Aparicio, A.; Rubio, J.; Marcos, V.; Sanchidrián, R.; Santos, S.; Pérez-Farinós, N.; Dal-Re, M.; Villar-Villalba, C.; Yusta-Boyo, M.J.; et al. Adequacy of usual macronutrient intake and macronutrient distribution in children and adolescents in Spain: A National Dietary Survey on the Child and Adolescent Population, ENALIA 2013–2014. Eur. J. Nutr. 2018, 58, 705–719. [Google Scholar] [CrossRef] [PubMed]
- Madrigal, C.; Soto-Méndez, M.J.; Leis, R.; Hernandez-Ruiz, Á.; Valero, T.; Lara Villoslada, F.; de Victoria, E.M.; Moreno, J.M.; Ortega, R.M.; Ruiz-Lopez, M.D.; et al. Dietary Intake, Nutritional Adequacy and Food Sources of Total Fat and Fatty Acids, and Relationships with Personal and Family Factors in Spanish Children Aged One to <10 Years: Results of the EsNuPI Study. Nutrients 2020, 12, 2467. [Google Scholar] [CrossRef] [PubMed]
- Madrigal, C.; Soto-Méndez, M.J.; Hernández-Ruiz, Á.; Valero, T.; Ávila, J.M.; Ruiz, E.; Lara Villoslada, F.; Leis, R.; de Victoria, e.M.; Moreno, J.M.; et al. Energy Intake, Macronutrient Profile and Food Sources of Spanish Children Aged One to <10 Years-Results from the EsNuPI Study. Nutrients 2020, 12, 893. [Google Scholar] [CrossRef] [PubMed]
- Enghardt Barbieri, H.; Pearson, M.; Becker, W.; Riksmaten–Barn 2003. Livsmedels-Ochnäringsintag Bland Barn i Sverige (Food and Nutrient Intake among Children in Sweden). 2003. Available online: https://www.livsmedelsverket.se/globalassets/matvanor-halsa-miljo/kostrad-matvanor/matvaneundersokningar/riksmaten-_-barn_2003_livsmedels_och_naringsintag_bland_barn_i_sverige1.pdf?AspxAutoDetectCookieSupport=1 (accessed on 13 April 2021).
- Gibson, S.; Sidnell, A. Nutrient adequacy and imbalance among young children aged 1–3 years in the UK. Nutr. Bull. 2014, 39, 172–180. [Google Scholar] [CrossRef]
- National Diet & Nutrition Survey. Results from Years 7 and 8 (Combined) of the Rolling Programme (2014/2015 to 2015/2016). 2018. Available online: https://www.gov.uk/government/statistics/ndns-results-from-years-7-and-8-combined (accessed on 26 May 2021).
- Ali, H.I.; Ng, S.W.; Zaghloul, S.; Harrison, G.G.; Qazaq, H.S.; El-Sadig, M.; Yeatts, K. High proportion of 6 to 18-year-old children and adolescents in the United Arab Emirates are not meeting dietary recommendations. Nutr. Res. 2013, 33, 447–456. [Google Scholar] [CrossRef] [PubMed]
- Lioret, S.; McNaughton, S.; Spence, A.; Crawford, D.; Campbell, K. Tracking of dietary intakes in early childhood: The Melbourne InFANT Program. Eur. J. Clin. Nutr. 2013, 67, 275–281. [Google Scholar] [CrossRef]
- Zhou, S.J.; Gibson, R.A.; Gibson, R.S.; Makrides, M. Nutrient intakes and status of preschool children in Adelaide, South Australia. Med. J. Aust. 2012, 196, 696–700. [Google Scholar] [CrossRef] [PubMed]
- Garriguet, D. Accounting for misreporting when comparing energy intake across time in Canada. Health Rep. 2018, 29, 3–12. [Google Scholar]
- Hamner, H.C.; Moore, L.V. Dietary quality among children from 6 months to 4 years, NHANES 2011–2016. Am. J. Clin. Nutr. 2019, 111, 61–69. [Google Scholar] [CrossRef] [PubMed]
- Murakami, K.; Livingstone, M.B.E. Prevalence and characteristics of misreporting of energy intake in US children and adolescents: National Health and Nutrition Examination Survey (NHANES) 2003–2012. Br. J. Nutr. 2015, 115, 294–304. [Google Scholar] [CrossRef] [PubMed]
- Kakutani, S.; Ishikura, Y.; Tateishi, N.; Horikawa, C.; Tokuda, H.; Kontani, M.; Kawashima, H.; Sakakibara, Y.; Kiso, Y.; Shibata, H.; et al. Supplementation of arachidonic acid-enriched oil increases arachidonic acid contents in plasma phospholipids, but does not increase their metabolites and clinical parameters in Japanese healthy elderly individuals: A randomized controlled study. Lipids Health Dis. 2011, 10, 241. [Google Scholar] [CrossRef] [PubMed]
- Kusumoto, A.; Ishikura, Y.; Kawashima, H.; Kiso, Y.; Takai, S.; Miyazaki, M. Effects of arachidonate-enriched triacylglycerol supplementation on serum fatty acids and platelet aggregation in healthy male subjects with a fish diet. Br. J. Nutr. 2007, 98, 626–635. [Google Scholar] [CrossRef] [PubMed]
- Commonwealth Scientific Industrial Research Organisation. 2007 Australia National Children’s Nutrition and Physical Activity Survey—Main Findings. 2007. Available online: https://www1.health.gov.au/internet/publications/publishing.nsf/Content/training-prg1~national-children-phy-activity-survey (accessed on 11 June 2021).
- World Health Organization. Global Strategy for Infant and Young Child Feeding; WHO: Geneva, Switzerland, 2003; ISBN 9241562218. [Google Scholar]
- World Bank. Population Ages 0–14, Total 2019. Available online: https://data.worldbank.org/indicator/SP.POP.0014.TO?most_recent_value_desc=true (accessed on 30 July 2021).
- Rupasinghe, W.S.W.A.; Perera, H.; Wickramaratne, N. A comprehensive review on dietary assessment methods in epidemiological studies. J. Pub. Health Nutri. 2020, 3, 204–211. [Google Scholar]
- Meyer, B.J. Australians are not Meeting the Recommended Intakes for Omega-3 Long Chain Polyunsaturated Fatty Acids: Results of an Analysis from the 2011–2012 National Nutrition and Physical Activity Survey. Nutrients 2016, 8, 111. [Google Scholar] [CrossRef]
- Samuel, T.M.; Zhou, Q.; Giuffrida, F.; Munblit, D.; Verhasselt, V.; Thakkar, S.K. Nutritional and Non-nutritional Composition of Human Milk Is Modulated by Maternal, Infant, and Methodological Factors. Front. Nutr. 2020, 7, 576133. [Google Scholar] [CrossRef]
- World Health Organization. Diet, Nutrition and the Prevention of Chronic Diseases. 2003. Available online: http://apps.who.int/iris/bitstream/handle/10665/42665/WHO_TRS_916.pdf?sequence=1 (accessed on 21 April 2021).
- Naude, C.E.; Visser, M.E.; Nguyen, K.A.; Durao, S.; Schoonees, A. Effects of total fat intake on bodyweight in children. Cochrane Database Syst. Rev. 2018, 2, CD012960. [Google Scholar] [CrossRef]
- Rolland-Cachera, M.F.; Maillot, M.; Deheeger, M.; Souberbielle, J.C.; Péneau, S.; Hercberg, S. Association of nutrition in early life with body fat and serum leptin at adult age. Int. J. Obes. 2012, 37, 1116–1122. [Google Scholar] [CrossRef]
- Stroobant, W.; Braun, K.V.; Jong, J.C.K.-D.; Moll, H.A.; Jaddoe, V.W.; Brouwer, I.A.; Franco, O.H.; Voortman, T. Intake of Different Types of Fatty Acids in Infancy Is Not Associated with Growth, Adiposity, or Cardiometabolic Health Up to 6 Years of Age. J. Nutr. 2017, 147, 413–420. [Google Scholar] [CrossRef] [PubMed]
- Dereń, K.; Weghuber, D.; Caroli, M.; Koletzko, B.; Thivel, D.; Frelut, M.-L.; Socha, P.; Grossman, Z.; Hadjipanayis, A.; Wyszyńska, J.; et al. Consumption of Sugar-Sweetened Beverages in Paediatric Age: A Position Paper of the European Academy of Paediatrics and the European Childhood Obesity Group. Ann. Nutr. Metab. 2019, 74, 296–302. [Google Scholar] [CrossRef] [PubMed]
- Te Morenga, L.; Mallard, S.; Mann, J. Dietary sugars and body weight: Systematic review and meta-analyses of randomised controlled trials and cohort studies. Br. Med. J. 2013, 346, e7492. [Google Scholar] [CrossRef] [PubMed]
- Vinke, P.; Blijleven, K.; Luitjens, M.; Corpeleijn, E. Young Children’s Sugar-Sweetened Beverage Consumption and 5-Year Change in BMI: Lessons Learned from the Timing of Consumption. Nutrients 2020, 12, 2486. [Google Scholar] [CrossRef] [PubMed]
- Micha, R.; Khatibzadeh, S.; Shi, P.; Fahimi, S.; Lim, S.; Andrews, K.G.; Engell, R.E.; Powles, J.; Ezzati, M.; Mozaffarian, D.; et al. Global, regional, and national consumption levels of dietary fats and oils in 1990 and 2010: A systematic analysis including 266 country-specific nutrition surveys. BMJ 2014, 348, g2272. [Google Scholar] [CrossRef]
- Te Morenga, L.; Montez, J.M. Health effects of saturated and trans-fatty acid intake in children and adolescents: Systematic review and meta-analysis. PLoS ONE 2017, 12, e0186672. [Google Scholar] [CrossRef]
- Berenson, G.S.; Wattigney, W.A.; Tracy, R.E.; Newman, W.P.; Srinivasan, S.R.; Webber, L.S.; Dalferes, E.R.; Strong, J.P. Atherosclerosis of the aorta and coronary arteries and cardiovascular risk factors in persons aged 6 to 30 years and studied at necropsy (the Bogalusa Heart Study). Am. J. Cardiol. 1992, 70, 851–858. [Google Scholar] [CrossRef]
- Srinivasan, S.R.; Myers, L.; Berenson, G.S. Changes in metabolic syndrome variables since childhood in prehypertensive and hypertensive subjects: The Bogalusa Heart Study. Hypertension 2006, 48, 33–39. [Google Scholar] [CrossRef] [PubMed]
- Thorning, T.K.; Raben, A.; Tholstrup, T.; Soedamah-Muthu, S.S.; Givens, I.; Astrup, A. Milk and dairy products: Good or bad for human health? An assessment of the totality of scientific evidence. Food Nutr. Res. 2016, 60, 32527. [Google Scholar] [CrossRef] [PubMed]
- Kolayli, S.; Tarhan, O.; Kara, M.; Aliyazicioglu, R.; Kucuk, M. An investigation of frequently consumed edible oils in Turkey in terms of omega fatty acids. Chem. Nat. Compd. 2011, 47, 347–351. [Google Scholar] [CrossRef]
- Carlson, S.E.; Schipper, L.; Brenna, J.T.; Agostini, C.; Calder, P.C.; Forsyth, S.; Legrand, P.; Abrahamse-Berkeveld, M.; van de Heijning, B.J.M.; van der Beek, E.M.; et al. Perspective: Moving Toward Desirable Linoleic Acid Content in Infant Formula. Adv. Nutr. 2021, nmab076. [Google Scholar] [CrossRef]
- European Food Safety Authority. ALA and LA and growth and development of children—Scientific substantiation of a health claim related to α-linolenic acid and linoleic acid and growth and development of children pursuant to Article 14 of Regulation (EC) No 1924/2006[1]—Scientific Opinion of the Panel on Dietetic Products, Nutrition and Allergies. EFSA J. 2008, 6, 783. [Google Scholar]
- Osendarp, S.J.M. The role of omega-3 fatty acids in child development. Oléagineux Corps Gras Lipides 2011, 18, 307–313. [Google Scholar] [CrossRef]
- Van der Wurff, I.S.M.; Meyer, B.J.; de Groot, R.H.M. Effect of Omega-3 Long Chain Polyunsaturated Fatty Acids (n-3 LCPUFA) Supplementation on Cognition in Children and Adolescents: A Systematic Literature Review with a Focus on n-3 LCPUFA Blood Values and Dose of DHA and EPA. Nutrients 2020, 12, 3115. [Google Scholar] [CrossRef]
- Vahdaninia, M.; MacKenzie, H.; Dean, T.; Helps, S. The effectiveness of ω-3 polyunsaturated fatty acid interventions during pregnancy on obesity measures in the offspring: An up-to-date systematic review and meta-analysis. Eur. J. Nutr. 2018, 58, 2597–2613. [Google Scholar] [CrossRef]
- Stratakis, N.; Gielen, M.; Chatzi, L.; Zeegers, M. Effect of maternal n-3 long-chain polyunsaturated fatty acid supplementation during pregnancy and/or lactation on adiposity in childhood: A systematic review and meta-analysis of randomized controlled trials. Eur. J. Clin. Nutr. 2014, 68, 1277–1287. [Google Scholar] [CrossRef]
- Cardel, M.; Lemas, D.J.; Jackson, K.H.; Friedman, J.E.; Fernández, J.R. Higher Intake of PUFAs Is Associated with Lower Total and Visceral Adiposity and Higher Lean Mass in a Racially Diverse Sample of Children. J. Nutr. 2015, 145, 2146–2152. [Google Scholar] [CrossRef]
| Ref. | Age Groups | Energy (kcal) | Total Fat | SFA | LA | ALA | DHA | EPA + DHA | MUFA | PUFA |
|---|---|---|---|---|---|---|---|---|---|---|
| FAO/WHO 2010 [17] | 1–2 y | 900 | Gradual reduction, depending on physical activity, to 35%E (AMDR) | No value for this age group | 1–2 y: 3–4.5%E (AI) | 6–24 months: 0.4–0.6%E (AI) | 6–24 months: 10–12 mg/kg (AI) | 6–24 months No DRV | 6–24 months No DRV | 6–24 months No AI; <15%E (U-AMDR) |
| FAO/WHO 2010 | 2–3 y | 1100 | 2–18 y: 25–35%E (AMDR) | 2–18 y: 8%E (U-AMDR) | >2 y: 2–3%E (AI) 2% (EAR) 2.5–9%E (AMDR) | >2 y: >0.5%E (L-AMDR) 0.5–2%E (AMDR) | No DRV | 2–4 y: 100–150 mg (AI) | 2–18 y: Total fat—SFA—PUFA—TFA (AMDR) | 2–18 y: No AI 11%E (U-AMDR) |
| FAO/WHO 2010 | 3–5 y | 1250 | 2–18 y: 25–35%E (AMDR) | 2–18 y: 8%E (U-AMDR) | >2 y: 2–3%E (AI) 2% (EAR) 2.5–9%E (AMDR) | >2 y: >0.5%E (L-AMDR) 0.5–2%E (AMDR) | No DRV | 2–4 y: 100–150 mg (AI) 4–6 y: 150–200 mg (AI) | 2–18 y: Total fat—SFA—PUFA—TFA (AMDR) | 2–18 y: No AI 11%E (U-AMDR) |
| FAO/WHO 2010 | 5–7 y | 1450 | 2–18 y: 25–35%E (AMDR) | 2–18 y: 8%E (U-AMDR) | >2 y: 2–3%E (AI) 2% (EAR) 2.5–9%E (AMDR) | >2 y: >0.5%E (L-AMDR) 0.5–2%E (AMDR) | No DRV | 4–6 y: 150–200 mg (AI) 6–10 y: 200–250 mg (AI) | 2–18 y: Total fat—SFA—PUFA—TFA (AMDR) | 2–18 y: No AI 11%E (U-AMDR) |
| EFSA 2010 [18] 2013 [19] | 1–2 y | 865.75 1 | 1–3.9 y: 35–40%E (RI) | “As low as possible” | 4%E (AI) | 0.5%E (AI) | 1–2 y: 100 mg (AI) | No DRV | No DRV | No DRV |
| EFSA 2010 2013 | 2–3 y | 1061 2 | 1–3.9 y: 35–40%E (RI) | “As low as possible” | 4%E (AI) | 0.5%E (AI) | No DRV | =and >2 y: 250 mg (AI) | No DRV | No DRV |
| EFSA 2010 2013 | 3–5 y | 1329.5 3 | 1–3.9 y: 35–40%E (RI) =and >4 y: 20–35%E (RI) | “As low as possible” | 4%E (AI) | 0.5%E (AI) | No DRV | =and >2 y: 250 mg (AI) | No DRV | No DRV |
| EFSA 2010 2013 | 5–7 y | 1560 4 | =and >4 y: 20–35%E (RI) | “As low as possible” | 4%E (AI) | 0.5%E (AI) | No DRV | =and >2 y: 250 mg (AI) | No DRV | No DRV |
| Fat or FA | Recommendation | 1–2 y | 2–3 y | 3–5 y | 5–7 y |
|---|---|---|---|---|---|
| Total fat | 1–2 y: Min. 35% (Min. FAO/WHO and Min. EFSA) 2–3 y: Min. 35%E (Max. FAO/WHO and Min. EFSA) 3–5 y: 25–35%E (FAO/WHO and mid-range of EFSA) 5–7 y: 25–35% (FAO/WHO and EFSA for upper end of the range) | 23/26 (88%) too low | 25/28 (89%) too low | 5.25 */33 (16%) too low 5.5/33 (17%) too high | 3/34 (9%) too low 6.5/34 (19%) too high |
| SFA | FAO/WHO 2010: Max. 8%E | No recommendation | 24/26 (92%) too high | 30.75/32 (96%) too high | 32.5/33 (98%) too high |
| SFA | FAO/WHO 2019: Max 10%E | No recommendation | 19/26 (73%) too high | 22/32 (69%) too high | 24/33 (73%) too high |
| LA | FAO/WHO: 1–2 y: Min 3%E >2 y: Min 2% | 4/17 (24%) too low | 0/18 0% | 0/22 0% | 0/18 0% |
| LA | EFSA: 4%E | 10/17 (59%) too low | 8/18 (44%) too low | 9/22 (41%) too low | 9/18 (50%) too low |
| ALA | 0.5%E | 8/19 (42%) too low | 10/20 (50%) too low | 10/24 (42%) too low | 8/19 (42)% too low |
| DHA or EPA + DHA | FAO/WHO: DHA 1–2 y: Min 100 mg EPA+DHA 2–3 y: Min 100 mg 3–5 y: Min 125 mg 5–7 y: Min. 175 mg | 12/13 (92%) too low | 7/10 (70%) too low | 9/14 (64%) too low | 11/11 (100%) too low |
| DHA or EPA + DHA | EFSA DHA 1–2 y: 100 mg EPA+DHA >2 y: 250 mg | 12/13 (92%) too low | 10/10 (100%) too low | 14/14 (100%) too low | 11/11 (100%) too low |
Publisher’s Note: MDPI stays neutral with regard to jurisdictional claims in published maps and institutional affiliations. |
© 2021 by the authors. Licensee MDPI, Basel, Switzerland. This article is an open access article distributed under the terms and conditions of the Creative Commons Attribution (CC BY) license (https://creativecommons.org/licenses/by/4.0/).
Share and Cite
Monnard, C.; Fleith, M. Total Fat and Fatty Acid Intake among 1–7-Year-Old Children from 33 Countries: Comparison with International Recommendations. Nutrients 2021, 13, 3547. https://doi.org/10.3390/nu13103547
Monnard C, Fleith M. Total Fat and Fatty Acid Intake among 1–7-Year-Old Children from 33 Countries: Comparison with International Recommendations. Nutrients. 2021; 13(10):3547. https://doi.org/10.3390/nu13103547
Chicago/Turabian StyleMonnard, Cathriona, and Mathilde Fleith. 2021. "Total Fat and Fatty Acid Intake among 1–7-Year-Old Children from 33 Countries: Comparison with International Recommendations" Nutrients 13, no. 10: 3547. https://doi.org/10.3390/nu13103547
APA StyleMonnard, C., & Fleith, M. (2021). Total Fat and Fatty Acid Intake among 1–7-Year-Old Children from 33 Countries: Comparison with International Recommendations. Nutrients, 13(10), 3547. https://doi.org/10.3390/nu13103547