
Total and Free Sugar Levels and Main Types of Sugars Used in 18,784 Local and Imported Pre-Packaged Foods and Beverages Sold in Hong Kong


Abstract
:1. Introduction
2. Materials and Methods
2.1. Data Source
2.2. Definition of Free Sugar
2.3. Data Processing
2.4. Product Categorization and Exclusion
2.5. Identification of Free Sugar Ingredients in Pre-Packaged Foods
2.6. Estimation of Free Sugar Content in Hong Kong Pre-Packaged Foods
2.7. Analysis of Naturally Occurring Lactose
2.8. Statistical Analysis
3. Results
3.1. Distribution of Steps in the Systematic Methodology
3.2. Use of Free Sugar Ingredients
3.3. Median Total Sugar and Free Sugar Content
3.4. Free Sugar as a Percentage of Total Sugar
4. Discussion
5. Conclusions
Supplementary Materials
Author Contributions
Funding
Institutional Review Board Statement
Informed Consent Statement
Data Availability Statement
Acknowledgments
Conflicts of Interest
Appendix A. Detailed Explanation and Worked Examples of Each Step
- Step 1: Assign products that contain 0 g total sugar as declared on the FoodSwitch HK database as free sugar value = 0 g/100 g.
- Step 2: Assign products that contain no or a negligible amount (<0.5 g per 100 g or 100 mL) of free sugar ingredient (FSI) as free sugar = 0 g/100 g.
- Step 3: Assign products that contain no or a negligible amount of intrinsic sugars as free sugar = 100% of total sugar.
- Step 4: Use of analytical data of lactose for products with dairy ingredients.
- Step 5: Calculate free sugar content for products with a known content of FSI or natural sugar-contributing ingredients.
- Step 6: Calculate based on comparison with an unsweetened variety.
- Step 8: Assign 50% of total sugar as free sugar.
Appendix B. HPLC Procedures
Appendix B.1. Sample Preparation
Appendix B.2. Conditions for Analysis
Appendix C
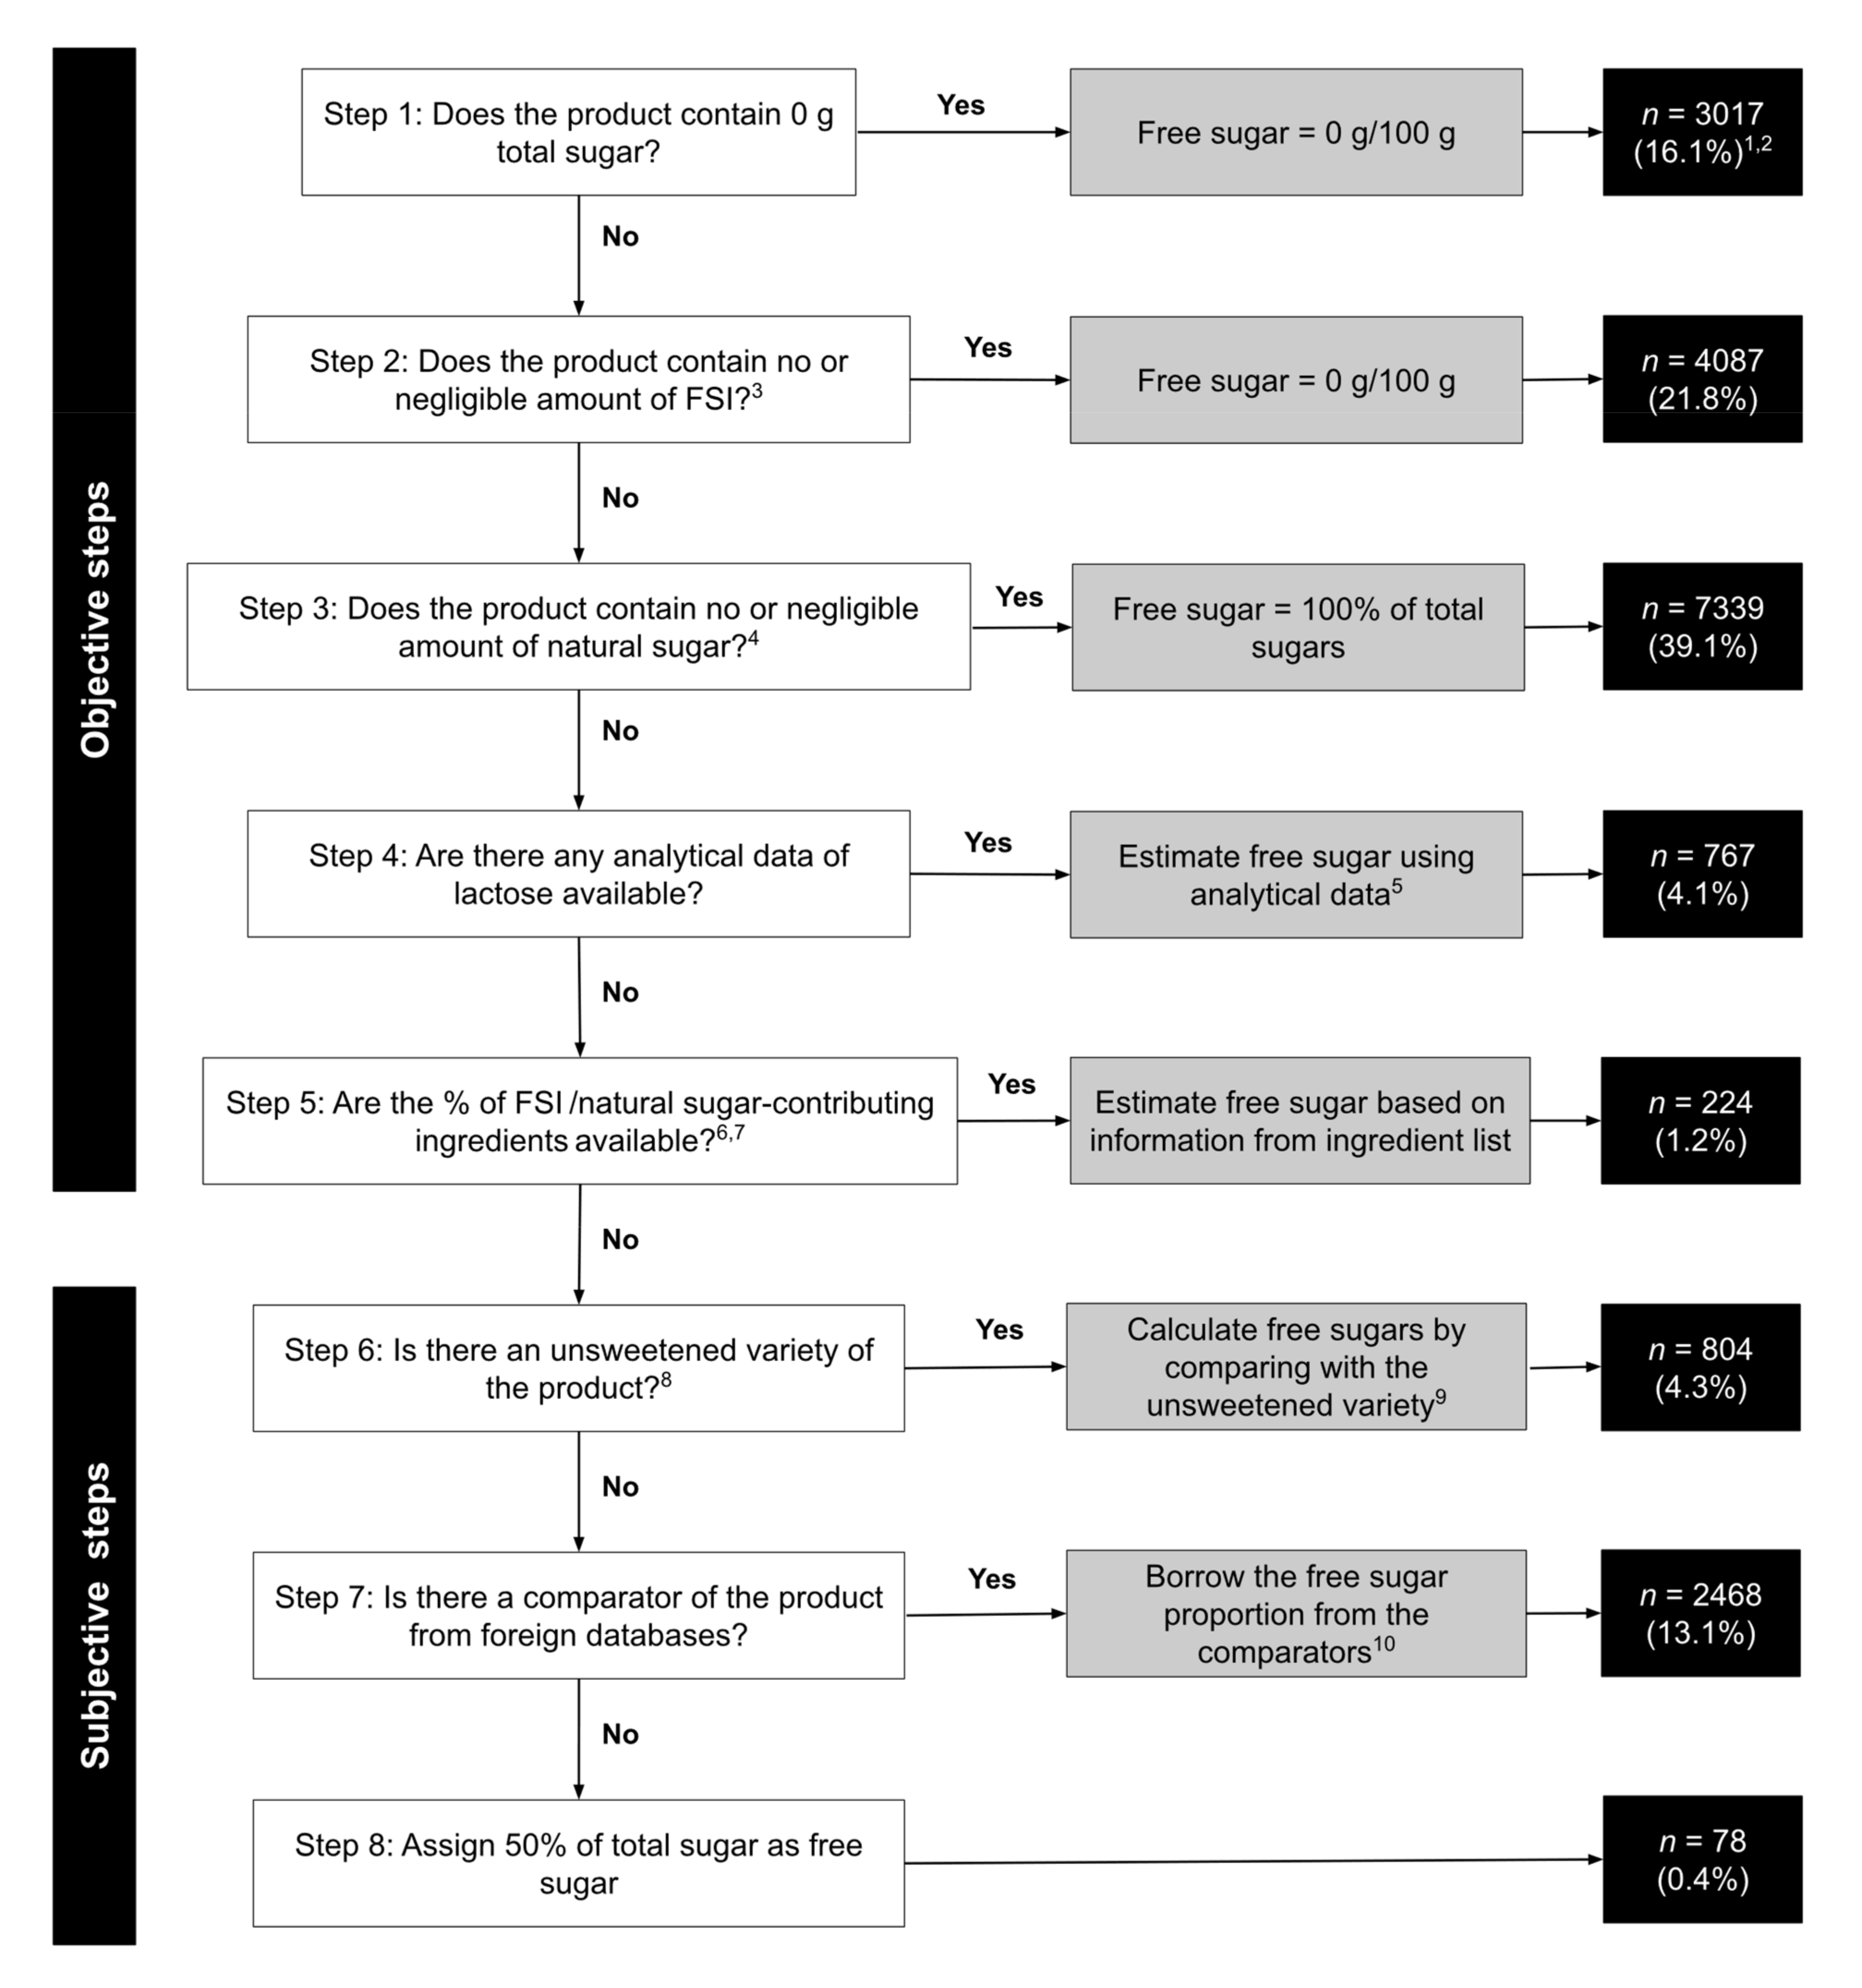
- Further Explanation of Figure 1
- 1.
- Number and proportion (%) of products calculated in each step. All products were calculated based on the total sugar content of their ‘ready for sale’ form as shown on their NIPs. The combined percentages of all steps were not equal to 100% due to rounding.
- 2.
- Step 1 included 345 items that claimed to have 0 g total sugars but were found to have at least one FSI in their ingredient lists.
- 3.
- Ingredient list of each product was searched for the identification of FSI. FSI was defined as all monosaccharides and disaccharides added to foods and beverages during processing, in addition to the naturally occurring sugars in honey, syrups, fruit juices, and fruit juice concentrates [7].
- 4.
- Include all products from the ‘100% free sugars groups’ (energy drinks, electrolyte drinks, soft drinks, fruit and vegetable juices, and cordials), in addition to those that were composed of no or minimal amounts of fruit and dairy products.
- 5.
- If the product contains lactose as the only naturally occurring sugar, the free sugar content was calculated as total sugar–lactose.
- 6.
- If the percentage of all FSI(s) in the product were explicitly stated in the ingredient list, free sugar was determined by , where FSIi is the th free sugar ingredient and j is the total number of FSI in the ingredient list.
- 7.
- If the proportion of all-natural sugar-contributing agents and their corresponding natural sugar concentrations were known, free sugar could be calculated by , where Natural sugar ingredienti is the ith ingredient that contributes naturally occurring sugars and j is the total number of natural sugar ingredients in the ingredient list.
- 8.
- Products that had been given a free sugar value of 0 g in Step 1 or 2.
- 9.
- Free sugar content was calculated by , where is the total sugar content (per 100 g) of the unsweetened counterpart of the product and is the total sugar content of the sweetened product.
- 10.
- The borrowed proportion was substituted into: total sugars of target product × borrowed proportion of free(added) sugar.
References
- Reedy, J.; Krebs-Smith, S.M. Dietary sources of energy, solid fats, and added sugars among children and adolescents in the United States. J. Am. Diet. Assoc. 2010, 110, 1477–1484. [Google Scholar] [CrossRef] [Green Version]
- Bray, G.A.; Nielsen, S.J.; Popkin, B.M. Consumption of high-fructose corn syrup in beverages may play a role in the epidemic of obesity. Am. J. Clin. Nutr. 2004, 79, 537–543. [Google Scholar] [CrossRef] [PubMed]
- Welsh, J.A.; Sharma, A.; Cunningham, S.A.; Vos, M.B. Consumption of added sugars and indicators of cardiovascular disease risk among US adolescents. Circulation 2011, 123, 249–257. [Google Scholar] [CrossRef] [PubMed] [Green Version]
- Yang, Q.; Zhang, Z.; Gregg, E.W.; Flanders, W.D.; Merritt, R.; Hu, F.B. Added sugar intake and cardiovascular diseases mortality among US adults. JAMA Intern. Med. 2014, 174, 516–524. [Google Scholar] [CrossRef] [PubMed] [Green Version]
- Malik, V.S.; Popkin, B.M.; Bray, G.A.; Després, J.-P.; Willett, W.C.; Hu, F.B. Sugar-Sweetened Beverages and Risk of Metabolic Syndrome and Type 2 Diabetes. Diabetes Care 2010, 33, 2477. [Google Scholar] [CrossRef] [Green Version]
- Bernabé, E.; Vehkalahti, M.M.; Sheiham, A.; Aromaa, A.; Suominen, A.L. Sugar-sweetened beverages and dental caries in adults: A 4-year prospective study. J. Dent. 2014, 42, 952–958. [Google Scholar] [CrossRef]
- World Health Organization. Guideline: Sugars Intake for Adults and Children; World Health Organization: Geneva, Switzerland, 2015. [Google Scholar]
- Fidler Mis, N.; Braegger, C.; Bronsky, J.; Campoy, C.; Domellöf, M.; Embleton, N.D.; Hojsak, I.; Hulst, J.; Indrio, F.; Lapillonne, A.; et al. Sugar in Infants, Children and Adolescents: A Position Paper of the European Society for Paediatric Gastroenterology, Hepatology and Nutrition Committee on Nutrition. J. Pediatr. Gastroenterol. Nutr. 2017, 65, 681–696. [Google Scholar] [CrossRef] [Green Version]
- Scientific Advisory Committee on Nutrition. Carbohydrates and Health; The Stationery Office: London, UK, 2015.
- Centre for Health Protection. Report of Population Health Survey 2014/15; Centre for Health Protection: Hong Kong, 2017.
- Department of Health. Oral Health Survey 2011; Department of Health: Hong Kong, 2011.
- Centre for Health Protection. Diabetes Mellitus. Available online: https://www.chp.gov.hk/en/healthtopics/content/25/59.html (accessed on 3 April 2021).
- Chinese Nutrition Society. Chinese Dietary Reference Intakes Summary: 2013; People’s Medical Publishing House: Beijing, China, 2013; p. 25. [Google Scholar]
- Centre for Food Safety. Reduction of Dietary Sodium and Sugar. Available online: https://www.cfs.gov.hk/english/programme/programme_rdss/programme_rdss.html (accessed on 23 July 2021).
- Centre for Food Safety. “Salt/Sugar” Label Scheme for Prepackaged Food Products. Available online: https://www.cfs.gov.hk/english/programme/programme_rdss/programme_Salt_Sugar_Label_Scheme.html (accessed on 23 July 2021).
- Food and Health Bureau. Reduction of Salt and Sugar in Food; Food and Health Bureau: Hong Kong, 2015.
- Centre for Food Safety. Information of products under the “Salt/Sugar” Label Scheme for Prepackaged Food Products. Available online: https://www.cfs.gov.hk/english/programme/programme_rdss/product_list.php?lang=en (accessed on 23 July 2021).
- U.S. Food & Drug Administration. Changes to the Nutrition Facts Label; U.S. Food & Drug Administration: Silver Spring, MD, USA, 2020.
- Centre for Food Safety. Nutrition Labelling. Available online: https://www.cfs.gov.hk/english/faq/faq_14.html (accessed on 3 April 2021).
- Acton, R.B.; Vanderlee, L.; Hobin, E.P.; Hammond, D. Added sugar in the packaged foods and beverages available at a major Canadian retailer in 2015: A descriptive analysis. CMAJ Open 2017, 5, E1–E6. [Google Scholar] [CrossRef] [Green Version]
- Scapin, T.; Fernandes, A.C.; dos Anjos, A.; Proença, R.P.d.C. Use of added sugars in packaged foods sold in Brazil. Public Health Nutr. 2018, 21, 3328–3334. [Google Scholar] [CrossRef]
- Bernstein, J.T.; Schermel, A.; Mills, C.M.; L’Abbé, M.R. Total and Free Sugar Content of Canadian Prepackaged Foods and Beverages. Nutrients 2016, 8, 582. [Google Scholar] [CrossRef] [Green Version]
- Clemens, R.A.; Jones, J.M.; Kern, M.; Lee, S.-Y.; Mayhew, E.J.; Slavin, J.L.; Zivanovic, S. Functionality of Sugars in Foods and Health. Compr. Rev. Food Sci. Food Saf. 2016, 15, 433–470. [Google Scholar] [CrossRef] [Green Version]
- Stanhope, K.L.; Havel, P.J. Endocrine and metabolic effects of consuming beverages sweetened with fructose, glucose, sucrose, or high-fructose corn syrup. Am. J. Clin. Nutr. 2008, 88, 1733S–1737S. [Google Scholar] [CrossRef] [PubMed] [Green Version]
- Cox, C.L.; Stanhope, K.L.; Schwarz, J.M.; Graham, J.L.; Hatcher, B.; Griffen, S.C.; Bremer, A.A.; Berglund, L.; McGahan, J.P.; Keim, N.L.; et al. Consumption of fructose- but not glucose-sweetened beverages for 10 weeks increases circulating concentrations of uric acid, retinol binding protein-4, and gamma-glutamyl transferase activity in overweight/obese humans. Nutr. Metab. 2012, 9, 68. [Google Scholar] [CrossRef] [PubMed] [Green Version]
- Louie, J.C.Y. Objective Biomarkers for Total Added Sugar Intake—Are We on a Wild Goose Chase? Adv. Nutr. 2020, 11, 1429–1436. [Google Scholar] [CrossRef]
- Yeung, C.H.C.; Louie, J.C.Y. Methodology for the assessment of added/free sugar intake in epidemiological studies. Curr. Opin. Clin. Nutr. Metab. Care 2019, 22, 271–277. [Google Scholar] [CrossRef] [PubMed]
- Louie, J.C.Y.; Moshtaghian, H.; Boylan, S.; Flood, V.M.; Rangan, A.M.; Barclay, A.W.; Brand-Miller, J.C.; Gill, T.P. A systematic methodology to estimate added sugar content of foods. Eur. J. Clin. Nutr. 2015, 69, 154–161. [Google Scholar] [CrossRef] [PubMed]
- Wong, A.S.C.; Coyle, D.H.; Wu, J.H.Y.; Louie, J.C.Y. Sodium concentration of pre-packaged foods sold in Hong Kong. Public Health Nutr. 2020, 23, 2804–2810. [Google Scholar] [CrossRef]
- Consumer Council. Grocery Market Study; Consumer Council: Hong Kong, 2013. [Google Scholar]
- Dunford, E.; Neal, B. FoodSwitch and use of crowdsourcing to inform nutrient databases. J. Food Compost. Anal. 2017, 64, 13–17. [Google Scholar] [CrossRef]
- Food and Environmental Hygiene Department. Food and Drugs (Composition and Labelling) Regulations; Cap. 132w; Food and Environmental Hygiene Department: Hong Kong, 2016.
- Ventura, E.E.; Davis, J.N.; Goran, M.I. Sugar content of popular sweetened beverages based on objective laboratory analysis: Focus on fructose content. Obesity 2011, 19, 868–874. [Google Scholar] [CrossRef] [PubMed]
- Montesano, D.; Cossignani, L.; Giua, L.; Urbani, E.; Simonetti, M.S.; Blasi, F. A Simple HPLC-ELSD Method for Sugar Analysis in Goji Berry. J. Chem. 2016, 2016, 6271808. [Google Scholar] [CrossRef] [Green Version]
- Zupanič, N.; Miklavec, K.; Kušar, A.; Žmitek, K.; Fidler Mis, N.; Pravst, I. Total and Free Sugar Content of Pre-Packaged Foods and Non-Alcoholic Beverages in Slovenia. Nutrients 2018, 10, 151. [Google Scholar] [CrossRef] [Green Version]
- Goldfein, K.R.; Slavin, J.L. Why Sugar Is Added to Food: Food Science 101. Compr. Rev. Food Sci. Food Saf. 2015, 14, 644–656. [Google Scholar] [CrossRef] [Green Version]
- Zupanič, N.; Hribar, M.; Fidler Mis, N.; Pravst, I. Free Sugar Content in Pre-Packaged Products: Does Voluntary Product Reformulation Work in Practice? Nutrients 2019, 11, 2577. [Google Scholar] [CrossRef] [Green Version]
- Muth, M.K.; Karns, S.A.; Mancino, L.; Todd, J.E. How Much Can Product Reformulation Improve Diet Quality in Households with Children and Adolescents? Nutrients 2019, 11, 618. [Google Scholar] [CrossRef] [PubMed] [Green Version]
- USDA Foreign Agricultural Service. Retail Food Sector Annual 2017; USDA Foreign Agricultural Service: Washington, DC, USA, 2018.
- Gressier, M.; Sassi, F.; Frost, G. Contribution of reformulation, product renewal, and changes in consumer behavior to the reduction of salt intakes in the UK population between 2008/2009 and 2016/2017. Am. J. Clin. Nutr. 2021, 114, 1092–1099. [Google Scholar] [CrossRef]
- Federico, B.; Costa, G.; Kunst, A.E. Educational inequalities in initiation, cessation, and prevalence of smoking among 3 Italian birth cohorts. Am. J. Public Health 2007, 97, 838–845. [Google Scholar] [CrossRef] [PubMed]
- Ng, S.W.; Slining, M.M.; Popkin, B.M. Use of caloric and noncaloric sweeteners in US consumer packaged foods, 2005–2009. J. Acad. Nutr. Diet. 2012, 112, 1828–1834. [Google Scholar] [CrossRef] [Green Version]
- US Environmental Protection Agency. Major Crops Grown in the United States; US Environmental Protection Agency: Washington, DC, USA, 2015.
- USDA Economic Research Service. Sugar & Sweeteners; USDA Economic Research Service: Washington, DC, USA, 2017.
- Matsuoka, M. Sugarcane cultivation and sugar industry in Japan. Sugar Tech 2006, 8, 3–9. [Google Scholar] [CrossRef]
- UK Department for International Trade. Autonomous Tariff Rate Quota (ATQ)—Raw Cane Sugar Consultation (2020); UK Department for International Trade: London, UK, 2020.
- Vartanian, L.R.; Schwartz, M.B.; Brownell, K.D. Effects of Soft Drink Consumption on Nutrition and Health: A Systematic Review and Meta-Analysis. Am. J. Public Health 2007, 97, 667–675. [Google Scholar] [CrossRef] [PubMed]
- Maersk, M.; Belza, A.; Stødkilde-Jørgensen, H.; Ringgaard, S.; Chabanova, E.; Thomsen, H.; Pedersen, S.B.; Astrup, A.; Richelsen, B. Sucrose-sweetened beverages increase fat storage in the liver, muscle, and visceral fat depot: A 6-mo randomized intervention study. Am. J. Clin. Nutr. 2011, 95, 283–289. [Google Scholar] [CrossRef]
- Stanhope, K.L.; Havel, P.J. Fructose consumption: Potential mechanisms for its effects to increase visceral adiposity and induce dyslipidemia and insulin resistance. Curr. Opin. Lipidol. 2008, 19, 16–24. [Google Scholar] [CrossRef] [Green Version]
- Meyers, A.M.; Mourra, D.; Beeler, J.A. High fructose corn syrup induces metabolic dysregulation and altered dopamine signaling in the absence of obesity. PLoS ONE 2017, 12, e0190206. [Google Scholar] [CrossRef]
- White, J.S.; Foreyt, J.P.; Melanson, K.J.; Angelopoulos, T.J. High-Fructose Corn Syrup: Controversies and Common Sense. Am. J. Lifestyle Med. 2010, 4, 515–520. [Google Scholar] [CrossRef]
- Rippe, J.M.; Angelopoulos, T.J. Sucrose, high-fructose corn syrup, and fructose, their metabolism and potential health effects: What do we really know? Adv. Nutr. 2013, 4, 236–245. [Google Scholar] [CrossRef]
- Melanson, K.J.; Zukley, L.; Lowndes, J.; Nguyen, V.; Angelopoulos, T.J.; Rippe, J.M. Effects of high-fructose corn syrup and sucrose consumption on circulating glucose, insulin, leptin, and ghrelin and on appetite in normal-weight women. Nutrition 2007, 23, 103–112. [Google Scholar] [CrossRef] [PubMed]
- Scientific Advisory Committee on Nutrition. Minutes of the 48th Meeting; Scientific Advisory Committee on Nutrition: London, UK, 2016. Available online: https://app.box.com/s/ivrivaemf7fgeo9a17xdmv167c4uvteu/file/106585193169 (accessed on 21 July 2021).
- Dietary Guidelines Advisory Committee. Scientific Report of the 2020 Dietary Guidelines Advisory Committee: Advisory Report to the Secretary of Agriculture and the Secretary of Health and Human Services; U.S. Department of Agriculture, Agricultural Research Service: Washington, DC, USA, 2020.
- Euromonitor International. Juice in Hong Kong, China; Euromonitor International: London, UK, 2020. [Google Scholar]
- Centre for Health Protection. Non-Communicable Diseases and Healthy Living; Centre for Health Protection: Hong Kong, 2021.
- Pepin, A.; Stanhope, K.L.; Imbeault, P. Are Fruit Juices Healthier Than Sugar-Sweetened Beverages? A Review. Nutrients 2019, 11, 1006. [Google Scholar] [CrossRef] [PubMed] [Green Version]
- Imamura, F.; O’Connor, L.; Ye, Z.; Mursu, J.; Hayashino, Y.; Bhupathiraju, S.N.; Forouhi, N.G. Consumption of sugar sweetened beverages, artificially sweetened beverages, and fruit juice and incidence of type 2 diabetes: Systematic review, meta-analysis, and estimation of population attributable fraction. BMJ 2015, 351, h3576. [Google Scholar] [CrossRef] [PubMed] [Green Version]
- World Health Organization. ‘Best Buys’ and Other Recommended Interventions for the Prevention and Control of Noncommunicable Diseases; World Health Organization: Geneva, Switzerland, 2017. [Google Scholar]
- Powell, L.M.; Chriqui, J.F.; Khan, T.; Wada, R.; Chaloupka, F.J. Assessing the potential effectiveness of food and beverage taxes and subsidies for improving public health: A systematic review of prices, demand and body weight outcomes. Obes. Rev. 2013, 14, 110–128. [Google Scholar] [CrossRef] [Green Version]
- Pell, D.; Mytton, O.; Penney, T.L.; Briggs, A.; Cummins, S.; Penn-Jones, C.; Rayner, M.; Rutter, H.; Scarborough, P.; Sharp, S.J.; et al. Changes in soft drinks purchased by British households associated with the UK soft drinks industry levy: Controlled interrupted time series analysis. BMJ 2021, 372, n254. [Google Scholar] [CrossRef]
- Colchero, M.A.; Popkin, B.M.; Rivera, J.A.; Ng, S.W. Beverage purchases from stores in Mexico under the excise tax on sugar sweetened beverages: Observational study. BMJ 2016, 352, h6704. [Google Scholar] [CrossRef] [Green Version]
- Nakamura, R.; Mirelman, A.J.; Cuadrado, C.; Silva-Illanes, N.; Dunstan, J.; Suhrcke, M. Evaluating the 2014 sugar-sweetened beverage tax in Chile: An observational study in urban areas. PLoS Med. 2018, 15, e1002596. [Google Scholar] [CrossRef]
- Du, M.; Tugendhaft, A.; Erzse, A.; Hofman, K. Sugar-Sweetened Beverage Taxes: Industry Response and Tactics. Yale J. Biol. Med. 2018, 91, 185–190. [Google Scholar] [PubMed]
- Hafner, E.; Hribar, M.; Hristov, H.; Kušar, A.; Žmitek, K.; Roe, M.; Pravst, I. Trends in the Use of Low and No-Calorie Sweeteners in Non-Alcoholic Beverages in Slovenia. Foods 2021, 10, 387. [Google Scholar] [CrossRef] [PubMed]
- De Samaniego-Vaesken, M.L.; González-Fernández, B.; Partearroyo, T.; Urrialde, R.; Varela-Moreiras, G. Updated Database and Trends of Declared Low- and No-Calorie Sweeteners from Foods and Beverages Marketed in Spain. Front. Nutr. 2021, 8, 670422. [Google Scholar] [CrossRef] [PubMed]
- O, B.Y.S.; Coyle, D.H.; Dunford, E.K.; Wu, J.H.Y.; Louie, J.C.Y. The Use of Non-Nutritive and Low-Calorie Sweeteners in 19,915 Local and Imported Pre-Packaged Foods in Hong Kong. Nutrients 2021, 13, 1861. [Google Scholar] [CrossRef] [PubMed]
- Bian, X.; Chi, L.; Gao, B.; Tu, P.; Ru, H.; Lu, K. The artificial sweetener acesulfame potassium affects the gut microbiome and body weight gain in CD-1 mice. PLoS ONE 2017, 12, e0178426. [Google Scholar] [CrossRef] [PubMed]
- Ahmad, S.Y.; Friel, J.; Mackay, D. The Effects of Non-Nutritive Artificial Sweeteners, Aspartame and Sucralose, on the Gut Microbiome in Healthy Adults: Secondary Outcomes of a Randomized Double-Blinded Crossover Clinical Trial. Nutrients 2020, 12, 3408. [Google Scholar] [CrossRef] [PubMed]
- Tierney, M.; Gallagher, A.M.; Giotis, E.S.; Pentieva, K. An Online Survey on Consumer Knowledge and Understanding of Added Sugars. Nutrients 2017, 9, 37. [Google Scholar] [CrossRef] [Green Version]
- Ahuja, J.K.C.; Li, Y.; Bahadur, R.; Nguyen, Q.; Haile, E.; Pehrsson, P.R. IngID: A framework for parsing and systematic reporting of ingredients used in commercially packaged foods. J. Food Compost. Anal. 2021, 100, 103920. [Google Scholar] [CrossRef]
- Government of Canada. Regulations Amending the Food and Drug Regulations—Nutrition Labelling, Other Labelling Provisions and Food Colours. Canada Gazette. Part 1 Volume 150 No. 25. Available online: https://gazette.gc.ca/rp-pr/p2/2016/2016-12-14/html/sor-dors305-eng.html (accessed on 14 December 2016).
- Lei, L.; Rangan, A.; Flood, V.M.; Louie, J.C. Dietary intake and food sources of added sugar in the Australian population. Br. J. Nutr. 2016, 115, 868–877. [Google Scholar] [CrossRef] [Green Version]
- Kibblewhite, R.; Nettleton, A.; McLean, R.; Haszard, J.; Fleming, E.; Kruimer, D.; Te Morenga, L. Estimating Free and Added Sugar Intakes in New Zealand. Nutrients 2017, 9, 1292. [Google Scholar] [CrossRef] [Green Version]
- Wanselius, J.; Axelsson, C.; Moraeus, L.; Berg, C.; Mattisson, I.; Larsson, C. Procedure to Estimate Added and Free Sugars in Food Items from the Swedish Food Composition Database Used in the National Dietary Survey Riksmaten Adolescents 2016–17. Nutrients 2019, 11, 1342. [Google Scholar] [CrossRef] [PubMed] [Green Version]
- Black, R. Begin to imagine: Thoughts and considerations following the 39th NNDC. J. Food Compost. Anal. 2017, 64, 143–144. [Google Scholar] [CrossRef]
- Harrington, R.A.; Adhikari, V.; Rayner, M.; Scarborough, P. Nutrient composition databases in the age of big data: FoodDB, a comprehensive, real-time database infrastructure. BMJ Open 2019, 9, e026652. [Google Scholar] [CrossRef] [PubMed]
- Gaines, A.; Shahid, M.; Huang, L.; Davies, T.; Taylor, F.; Wu, J.H.; Neal, B. Deconstructing the Supermarket: Systematic Ingredient Disaggregation and the Association between Ingredient Usage and Product Health Indicators for 24,229 Australian Foods and Beverages. Nutrients 2021, 13, 1882. [Google Scholar] [CrossRef] [PubMed]
- Coyle, D.H.; Shahid, M.; Dunford, E.K.; Ni Mhurchu, C.; Scapin, T.; Trieu, K.; Marklund, M.; Louie, J.C.Y.; Neal, B.; Wu, J.H.Y. The Contribution of Major Food Categories and Companies to Household Purchases of Added Sugar in Australia. J. Acad. Nutr. Diet. 2021, S2212–S2672. [Google Scholar] [CrossRef]
- Centre for Food Safety. Sugars Content of Some Non-Prepackaged Food in Hong Kong; No. 51; Centre for Food Safety: Hong Kong, 2014.
- Centre for Food Safety. Sugars Content of Prepackaged Non-Alcoholic Beverages in Hong Kong; Centre for Food Safety: Hong Kong, 2009.
- U.S. Food & Drug Administration. A Food Labeling Guide; U.S. Department of Health and Human Services: Washington, DC, USA, 2013.
- Nutrient Data Laboratory, Beltsville Human Nutrition Research Center, Agricultural Research Service, U.S. Department of Agriculture. USDA Database for the Added Sugars Content of Selected Foods; Release 1; USDA: Beltsville, MD, USA, 2006.
- Food Standards Australia New Zealand. AUSNUT2011–2013. 2020. Available online: https://www.foodstandards.gov.au/science/monitoringnutrients/ausnut/pages/default.aspx (accessed on 21 March 2021).

| Type of FSI | Examples of Common Terms a |
|---|---|
| Sucrose (sugar & syrup)b | Beet sugar, cane sugar, caster sugar, demerara sugar, granulated sugar muscovado sugar, sucrose, sugar, turbinado sugar, sugar cane juice, caramel, brown sugar syrup, cane sugar syrup |
| Glucose | Corn maltodextrin, D-glucose powder, dehydrated glucose syrup, dextrose, dextrose monohydrate, isomerized glucose syrup, rice syrup |
| Corn Syrup | Corn glucose syrup, corn syrup, fructose dextrose syrup, fructose glucose, high maltose corn syrup |
| Fruit juice | Fruit juice concentrate, fruit juice powder, concentrated fruit juice, fruit nectar, concentrated grape must, dried fruit juice |
| High-fructose corn syrup | Fructose corn syrup, high fructose corn syrup, high fructose glucose syrup, high fructose syrup, isomerized syrup |
| Molasses | Beet molasses, blackstrap molasses, cane molasses, black treacle |
| Honey | Honey, honey syrup, brown honey, oak honey, raw honey |
| Other syrups | Barley malt extract, cider syrup, coconut syrup, malt syrup, lactose solution, invert liquid sugar |
| Fructose | Crystalline fructose, fructose, fructose syrup, fruit sugar |
| Other sugars | Coconut sugar, dried barley malt extract, maltose, oak sugar, palm sugar, invert sugar |
| Maple syrup | Maple sugar, maple syrup |
| Agave | Agave nectar, agave powder, agave syrup |
| Type of FSI a | n | Prevalence (%) in Products that Contain FSI (n = 12,118) b | Prevalence (%) in All Products (n = 18,784) b |
|---|---|---|---|
| Sucrose (sugar & syrup) | 10,282 | 84.8 | 54.7 |
| Glucose | 3305 | 27.3 | 17.6 |
| Fruit juice | 2154 | 17.8 | 11.5 |
| Other sugars | 995 | 8.2 | 5.3 |
| Other syrups | 909 | 7.5 | 4.8 |
| Corn syrup | 857 | 7.1 | 4.6 |
| Honey | 727 | 6.0 | 3.9 |
| High-fructose corn syrup | 425 | 3.5 | 2.3 |
| Fructose | 311 | 2.6 | 1.7 |
| Molasses | 171 | 1.4 | 0.9 |
| Maple syrup | 53 | 0.4 | 0.3 |
| Agave | 39 | 0.3 | 0.2 |
| Major Food Groups a | Total n | n (%) Containing FSI(s) | Total Sugar Content (g/100 g or g/100 mL) | Free Sugar Content (g/100 g or g/100 mL) | Free Sugar as Percent of Total Sugar ± SD (%) b | ||||||||||
|---|---|---|---|---|---|---|---|---|---|---|---|---|---|---|---|
| Mean ± SD | Min | 25th | 50th | 75th | Max | Mean ± SD | Min | 25th | 50th | 75th | Max | ||||
| Bread and bakery products | 1719 | 1567 (91.2) | 22.7 ± 15.1 | 0.0 | 10.0 | 23.2 | 33.0 | 90.7 | 20.8 ± 15.0 | 0.0 | 7.0 | 21.6 | 31.1 | 90.7 | 80.6 ± 34.5 |
| Cereal and grain products | 2673 | 1152 (43.1) | 6.8 ± 10.5 | 0.0 | 0.5 | 2.8 | 7.0 | 86.5 | 4.5 ± 8.8 | 0.0 | 0.0 | 0.0 | 4.5 | 68.7 | 46.2 ± 47.5 |
| Confectionery | 1624 | 1519 (93.5) | 46.4 ± 26.0 | 0.0 | 29.0 | 48.3 | 61.1 | 100.0 | 43.1 ± 26.4 | 0.0 | 25.4 | 41.2 | 58.9 | 100.0 | 89.5 ± 19.6 |
| Convenience foods | 1074 | 851(79.2) | 4.7 ± 6.9 | 0.0 | 1.1 | 2.3 | 4.9 | 57.3 | 3.2 ± 6.0 | 0.0 | 0.0 | 0.8 | 2.9 | 45.2 | 50.8 ± 42.3 |
| Dairy | 1573 | 919 (58.4) | 9.8 ± 10.8 | 0.0 | 2.8 | 6.9 | 13.4 | 96.6 | 6.1 ± 9.4 | 0.0 | 0.0 | 3.5 | 9.0 | 96.6 | 45.9 ± 39.5 |
| Edible oils and oil emulsions | 458 | 6 (1.3) | 0.2 ± 1.3 | 0.0 | 0.0 | 0.0 | 0.0 | 26.1 | 0.6 ± 1.1 | 0.0 | 0.0 | 0.0 | 0.0 | 23.2 | 1.8 ± 11.9 |
| Eggs | 71 | 3 (4.2) | 0.6 ± 2.8 | 0.0 | 0.0 | 0.0 | 0.3 | 20.9 | 0.5 ± 2.8 | 0.0 | 0.0 | 0.0 | 0.0 | 20.9 | 11.5 ± 32.6 |
| Fish and fish products | 605 | 278 (46.0) | 2.1 ± 3.9 | 0.0 | 0.0 | 0.6 | 3.2 | 60.2 | 1.9 ± 3.9 | 0.0 | 0.0 | 0.0 | 2.8 | 60.2 | 73.9 ± 44.0 |
| Fruits and vegetables | 2406 | 893 (37.1) | 15.8 ± 21.8 | 0.0 | 1.0 | 4.7 | 20.4 | 89.4 | 8.2± 16.9 | 0.0 | 0.0 | 0.0 | 5.3 | 86.0 | 33.3 ± 43.7 |
| Meat and meat products | 660 | 487 (73.8) | 2.6 ± 5.5 | 0.0 | 0.3 | 1.1 | 2.2 | 49.6 | 2.4 ± 5.5 | 0.0 | 0.0 | 0.9 | 2.1 | 49.6 | 80.2 ± 39.7 |
| Non-alcoholic beverages | 2246 | 1498 (66.7) | 12.5 ± 17.7 | 0.0 | 1.0 | 8.1 | 11.5 | 100.0 | 11.9 ± 17.3 | 0.0 | 0.0 | 8.0 | 11.4 | 100.0 | 89.9 ± 28.2 |
| Sauce, dressings, spreads and dips | 2207 | 1695 (76.8) | 12.4 ± 14.2 | 0.0 | 2.6 | 5.7 | 18.0 | 80.7 | 10.9 ± 14.1 | 0.0 | 0.0 | 4.8 | 16.7 | 80.7 | 71.9 ± 39.9 |
| Snack foods | 981 | 780 (79.5) | 10.3 ± 13.8 | 0.0 | 1.8 | 3.8 | 11.4 | 68.6 | 8.8 ± 12.9 | 0.0 | 0.3 | 3.4 | 9.7 | 66.0 | 82.5 ± 37.0 |
| Sugars, honey and related products | 487 | 470 (96.5) | 77.7 ± 21.9 | 0.0 | 72.0 | 80.0 | 96.0 | 100.0 | 77.4± 22.5 | 0.0 | 72.0 | 80.0 | 96.0 | 100.0 | 98.7 ± 11.2 |
| Total | 18,784 | 12,118 (64.5) | 15.8 ± 22.0 | 0.0 | 1.2 | 5.7 | 21.4 | 100.0 | 13.3 ± 21.2 | 0.0 | 0.0 | 3.2 | 17.2 | 100.0 | 65.8 ± 43.4 |
Publisher’s Note: MDPI stays neutral with regard to jurisdictional claims in published maps and institutional affiliations. |
© 2021 by the authors. Licensee MDPI, Basel, Switzerland. This article is an open access article distributed under the terms and conditions of the Creative Commons Attribution (CC BY) license (https://creativecommons.org/licenses/by/4.0/).
Share and Cite
Chan, L.Y.; Coyle, D.H.; Wu, J.H.Y.; Louie, J.C.Y. Total and Free Sugar Levels and Main Types of Sugars Used in 18,784 Local and Imported Pre-Packaged Foods and Beverages Sold in Hong Kong. Nutrients 2021, 13, 3404. https://doi.org/10.3390/nu13103404
Chan LY, Coyle DH, Wu JHY, Louie JCY. Total and Free Sugar Levels and Main Types of Sugars Used in 18,784 Local and Imported Pre-Packaged Foods and Beverages Sold in Hong Kong. Nutrients. 2021; 13(10):3404. https://doi.org/10.3390/nu13103404
Chicago/Turabian StyleChan, Lok Yin, Daisy H. Coyle, Jason H. Y. Wu, and Jimmy Chun Yu Louie. 2021. "Total and Free Sugar Levels and Main Types of Sugars Used in 18,784 Local and Imported Pre-Packaged Foods and Beverages Sold in Hong Kong" Nutrients 13, no. 10: 3404. https://doi.org/10.3390/nu13103404
APA StyleChan, L. Y., Coyle, D. H., Wu, J. H. Y., & Louie, J. C. Y. (2021). Total and Free Sugar Levels and Main Types of Sugars Used in 18,784 Local and Imported Pre-Packaged Foods and Beverages Sold in Hong Kong. Nutrients, 13(10), 3404. https://doi.org/10.3390/nu13103404