Abstract
Bitter taste receptors (T2Rs) are G-protein-coupled receptors (GPCRs) expressed on the tongue but also in various locations throughout the body, including on motile cilia within the upper and lower airways. Within the nasal airway, T2Rs detect secreted bacterial ligands and initiate bactericidal nitric oxide (NO) responses, which also increase ciliary beat frequency (CBF) and mucociliary clearance of pathogens. Various neuropeptides, including neuropeptide tyrosine (neuropeptide Y or NPY), control physiological processes in the airway including cytokine release, fluid secretion, and ciliary beating. NPY levels and/or density of NPYergic neurons may be increased in some sinonasal diseases. We hypothesized that NPY modulates cilia-localized T2R responses in nasal epithelia. Using primary sinonasal epithelial cells cultured at air–liquid interface (ALI), we demonstrate that NPY reduces CBF through NPY2R activation of protein kinase C (PKC) and attenuates responses to T2R14 agonist apigenin. We find that NPY does not alter T2R-induced calcium elevation but does reduce T2R-stimulated NO production via a PKC-dependent process. This study extends our understanding of how T2R responses are modulated within the inflammatory environment of sinonasal diseases, which may improve our ability to effectively treat these disorders.
1. Introduction
The nasal cavity is the first line of respiratory defense, with host–pathogen interactions occurring constantly. In most individuals, the sinonasal cavity remains free of infection due to exquisite epithelial innate defenses [1,2,3], including mucociliary clearance. Mucociliary clearance is complemented by the production of antimicrobial peptides (defensins, cathelicidin) and radicals (nitric oxide (NO), reactive oxygen species derived from hydrogen peroxide (H2O2)) [4]. Failure of these defenses can contribute to airway diseases such as chronic rhinosinusitis (CRS), which is a complex syndrome of sinonasal infection and/or inflammation affecting >35 million Americans [5,6,7,8,9,10,11] and accounting for one out of five adult antibiotic prescriptions [7,8,9,10].
Antibiotic-resistant organisms are increasingly found in patients with CRS and other airway diseases [12,13,14,15,16,17,18,19,20]. An attractive alternative therapeutic approach to antibiotics is to stimulate receptors that control endogenous immune responses, thus enhancing innate defenses without increasing pressures for single-agent resistance. One pathway that emerged over the last decade is the bitter taste receptor (T2R) pathway. Initially identified on the tongue, T2Rs are G-protein-coupled receptors (GPCRs) also expressed in other organs, including the bronchial and nasal motile cilia [4,21,22,23,24]. Several nasal cilia T2Rs detect bacterial products and activate local and rapid calcium-dependent nitric oxide (NO) synthase (NOS) activity, specifically via the eNOS isoform localized to the cilia and/or cilia base [25,26,27,28]. The NO produced increases mucociliary clearance and kills bacteria [22,29,30].
Isoforms T2R38 [22,31,32,33,34], T2R4 [35], and T2R14 [35] respond to acyl-homoserine lactone (AHL) quorum-sensing molecules produced by Gram-negative bacteria, including Pseudomonas aeruginosa. T2R4 and T2R14 also recognize quinolone quorum-sensing molecules’ Pseudomonas quinolone signal (PQS) and heptyl-hydroxy quinolone (HHQ), respectively [24,36]. T2R responses can also be evoked by other bacteria such as Bacillus species [37]. This supports T2Rs as a novel class of immune pattern recognition receptors, similar to toll-like receptors (TLRs).
The importance of T2Rs in nasal defense is supported by observations that patients who are homozygous for the AVI TAS2R38 polymorphism, which renders T2R38 non-functional, have increased frequency of Gram-negative bacterial infections [22], higher levels of sinonasal bacteria [38,39,40], higher frequency of chronic rhinosinusitis [41,42,43,44], and worse outcomes after sinus surgery [45]. However, while T2Rs activate NO production in nasal cells, other receptors may inhibit it. It is important to understand how T2R responses are modulated within the inflammatory milieu of CRS and other airway diseases.
The focus of the current study was to determine how neuropeptide tyrosine (neuropeptide Y or NPY) might modulate T2R responses. Local sympathetic and parasympathetic neurons innervate nasal tissue [46,47] and release a variety of neuropeptides such as substance P (SubP), vasoactive intestinal peptide (VIP), and NPY, to control cell physiological processes such as fluid secretion, ciliary beating, and cytokine release. Parasympathetic neurons containing VIP and NPY [48,49,50,51,52,53,54,55,56,57] innervate the sinonasal cavity, including near submucosal glands of the turbinates [58,59,60] and at the pedicle of polyps [61,62]. Nasal NPYergic nerves may be increased in diseases such as allergic rhinitis [63,64] or irritative toxic rhinitis [65]. Activated macrophages can also produce NPY [66,67,68], possibly because NPY has antimicrobial effects [69,70,71] and/or regulates macrophage phagocytosis [72,73,74]. These neuropeptides activate GPCRs on epithelial and immune cells that regulate second messengers such as calcium, cAMP, and kinases. SubP and VIP stimulate nasal submucosal gland fluid secretion [75,76], and VIP increases nasal ciliary beating [77].
VIP and SubP receptors can activate cAMP and Ca2+ responses, respectively. VIP can increase ciliary beat frequency through cAMP [77]. NPY, however, decreases cilia beating through activation of NPYR2 receptors (our study [78] and others [79,80,81]). NPY also decreases fluid secretion from nasal submucosal gland cells via NPY1R receptor activation [75]. These negative effects of NPY are partly mediated by protein kinase C (PKC) activation [79,80,81,82]. Protein kinase C can phosphorylate eNOS at T495 [83,84,85] to reduce eNOS activity. Because T2Rs activate immune responses through eNOS, and NPY might inhibit eNOS function through activation of protein kinase C, we hypothesized that NPY may have negative effects on cilia-localized T2R responses. The increase in nasal NPYergic nerves during respiratory diseases described above may have a role in increasing susceptibility to infection by dampening T2R responses. The goal of this study was to better elucidate whether interactions occur between T2R and NPY signaling in nasal epithelial cells in vitro.
2. Materials and Methods
2.1. Reagents
Fluo-4-AM, DAF-FM-DA, DAF-2, anti-T2R38 (rabbit polyclonal; ab130503), and anti-beta-tubulin IV (mouse monoclonal; ab11315) were from Invitrogen (Grand Island, NY, USA). Anti-T2R14 (PA5-39710; rabbit polyclonal) was from Thermo Fisher Scientific (Waltham, MA, USA) and anti-eNOS (rabbit polyclonal; NB-300-605) was from Novus (Littleton, CO, USA). T2R14 antagonist 2-(4-fluorophenyl)-6- methoxychroman-4-one (4′- fluoro-6-methoxyflavanone) was purchased from VitaScreen, LLC (Champaign, IL, USA). Flavones, phorbol 12- myristate 13-acetate (PMA), ionomycin, L- and D-NG-nitroarginine methyl ester (L-NAME and D-NAME), U73122, and U73343 were from Cayman (Ann Arbor, MI, USA). Calphostin C, BIIE-0246, Gö6983, [Leu31,Pro34]-NPY, and NPY-(16–36) were from Tocris (Minneapolis, MN, USA). All other reagents were obtained from Sigma-Aldrich (St. Louis, MO, USA). Flavone stock solutions were made at 100 mM in DMSO. Final solutions used in experiments were made immediately before use and contained ≤0.1% DMSO.
2.2. Sinonasal Epithelial Air–Liquid Interface (ALI) Cultures
Patients undergoing sinonasal surgery were recruited from the University of Pennsylvania, Department of Otorhinolaryngology (IRB approval #800614). Patients were excluded if they had used anti-biologics (e.g., Xolair), oral corticosteroids, or antibiotics, within one month of surgery or had a history of immunodeficiency or systemic diseases (e.g., cystic fibrosis). All patients provided written informed consent in accordance with the code of federal regulation Title 45 CFR 46.116 of the United States Department of Health and Human Services. Experimental protocols were conducted in agreement with the research guidelines for use of residual clinical material outlined by the University of Pennsylvania.
Air–liquid interface (ALI) cultures were generated as previously described [24,86,87]. Briefly, enzymatically dissociated human sinonasal epithelial cells were then grown to confluence in proliferation medium (DMEM/Ham’s F-12 plus BEBM; Lonza, Walkersville, MD, USA) for one week. Following dissociation, cells were seeded onto a Transwell cell culture insert (0.4 µm pore size, transparent, 0.33 cm2 surface area; Corning, Corning, NY, USA) coated with fibronectin (Sigma), type I bovine collagen (Corning; Corning, NY, USA), and bovine serum albumin (Sigma) and in LHC basal medium (Invitrogen, Waltham, MA, USA). A One 10 cm culture dish (80–90% confluence) was used for two ALI plates (24-well format, each plate containing 12 transwells). After confluence, media was aspirated from the upper compartment. The basolateral medium was switched to differentiation medium (1:1 DMEM:BEBM) containing hydrocortisone (0.5 ng/mL), insulin (5 ng/mL), triiodothyronine (6.5 ng/mL), BPE (0.13 mg/mL), hEGF (0.5 ng/mL), epinephrine (5 g/mL), and transferrin (0.5 g/mL) from Lonza SingleQuot supplements plus 100 µg/mL streptomycin (ThermoFisher Scientific, Waltham, MA, USA), 0.1 nM retinoic acid (Sigma-Aldrich, St. Louis, MO, USA), 100 U/mL penicillin (ThermoFisher Scientific, Waltham, MA, USA), and 2% NuSerum (Corning, Corning, NY, USA).
2.3. Measurement of Ciliary Beat Frequency
Cultures were washed with PBS to remove media and maintained at ~28–30 °C. Dulbecco’s phosphate-buffered saline (PBS) (1.8 mM calcium) on the apical side and HEPES-buffered Hank’s balanced salt solution supplemented with 1× MEM vitamins and amino acids (ThermoFisher Scientific, Waltham, MA, USA) on the basolateral side. The Sisson–Ammons Video Analysis system (141) was used to measure whole-field ciliary beat frequency (CBF) as previously described [24,86,87]. A Leica (Wetzlar, Germany) DM-IL microscope (20× objective (0.8 NA)) with Leica IMC Hoffman modulation contrast was used for obtaining images at 100 frames/second. Each experiment was normalized to the baseline ciliary beat frequency at time = 0, as done previously [22,86,87]. Thus, the relative change in CBF was being reported.
2.4. Calcium and NO Imaging
Calcium and NO were imaged using primary sinonasal ALIs and Fluo-4 AM and DAF-FM, respectively. For calcium imaging, ALI cultures were loaded with 5 μM Fluo-4 AM apically for 90 min, washed, then incubated in the dark for 20 min. For NO imaging, cultures were loaded with 10 μM DAF-FM diacetate and 5 μM carboxy-PTIO apically for 90 min, washed, then incubated in the dark for 15 min. Imaging was performed using an Olympus IX-83 microscope (10 × 0.4 NA Plan Apo objective, Olympus Life Sciences, Tokyo, Japan) with a fluorescence xenon lamp (Sutter Lambda LS, Sutter Instruments, Novato, CA, USA), excitation and emission filter wheels (Sutter Instruments), and a 16-bit Hamamatsu Orca Flash 4.0 sCMOS camera. MetaFluor (Molecular Devices, Sunnyvale, CA, USA) was used to acquire images. A 470/40 nm excitation filter, 495 long-pass dichroic, and 525/40 nm emission filter were used (Chroma 49002-ET, Chroma Technologies, Rockingham, VT, USA). Each fluo-4 experiment was normalized to the baseline fluorescence at time = 0, as done previously [22,86,87] and is standard in the field with Fluo-4. Thus, normalized fluorescence was indicated by F/Fo. DAF-FM fluorescence is shown as raw increase after subtraction of baseline (time = 0), with care to keep loading and imaging parameters identical between all experiments.
For DAF-2 fluorescence measurement of the airway surface, liquid NO (1 µg/mL in PBS, 30 µL over 0.33 cm2) containing cell-impermeant NO-sensitive DAF-2 was used as described [22]. Solution was collected after 30 min, 25 µL was transferred to a glass-bottomed, black 96-well plate (CellVis, Mountain View, CA, USA), and fluorescence was read (485 nm excitation, 535 nm emission) in a fluorescence plate reader (Spark 10M, Tecan Männedorf, Switzerland).
2.5. Immunofluorescence
ALI cultures were fixed for 20 min in 4% formaldehyde at room temperature, followed by permeabilization and blocking for 1 h using PBS containing 5% normal donkey serum, 1% bovine serum albumin (BSA), 0.2% saponin, and 0.3% Triton X-100 at 4 °C. Primary antibody incubations (1:100 for anti-T2R antibodies, 1:250 for tubulin and eNOS antibodies) were performed at 4 °C overnight. Secondary antibody incubations with Alexa Fluor-labeled donkey anti-mouse or rabbit (1:1000) were performed at 4 °C for 2 h. Following primary and secondary antibody incubations, Transwell filters were cut from the plastic mounting ring with a razor blade and mounted onto glass slides with DAPI-containing Fluoroshield (Abcam, Cambridge, MA, USA). Zenon antibody labeling kits (Invitrogen/Molecular Probes/Thermo Scientific, Waltham, MA, USA) were used for direct labeling of primary antibodies. This was necessary to co-localize T2R38 and T2R14 as both antibodies were rabbit antibodies. Zenon labeling kits were used per the manufacturers’ instructions. An Olympus Fluoview confocal system with IX-81 microscope and 60× (1.4 NA) objective was used to take images of ALIs. The 60× (1.4 NA oil) objective on an inverted Olympus IX-83 microscope with spinning disk (DSU) running Metamorph (Molecular Devices, San Jose, CA, USA) was used for imaging isolated ciliated cells. Analysis of images was performed using Fluoview software, Metamorph, and/or FIJI [88].
2.6. Statistical Analyses
Analyses were performed using Prism (GraphPad, San Diego, CA, USA) with p < 0.05 considered to be statistically significant. One-way analysis of variance (ANOVA) was performed with appropriate post-tests. For comparisons to a control group, one-way ANOVA with Dunnett’s posttest was used. Bonferroni posttest was used for preselected pair-wise comparisons. Tukey–Kramer posttest was used for comparisons of all samples within a data set. All additional data analyses were performed in Excel. All figures are displayed with mean ± SD; one asterisk (*) indicates p < 0.05. Two asterisks (**) indicate p < 0.01.
3. Results
3.1. NPY Reduces CBF through NPY2R Activation of PKC
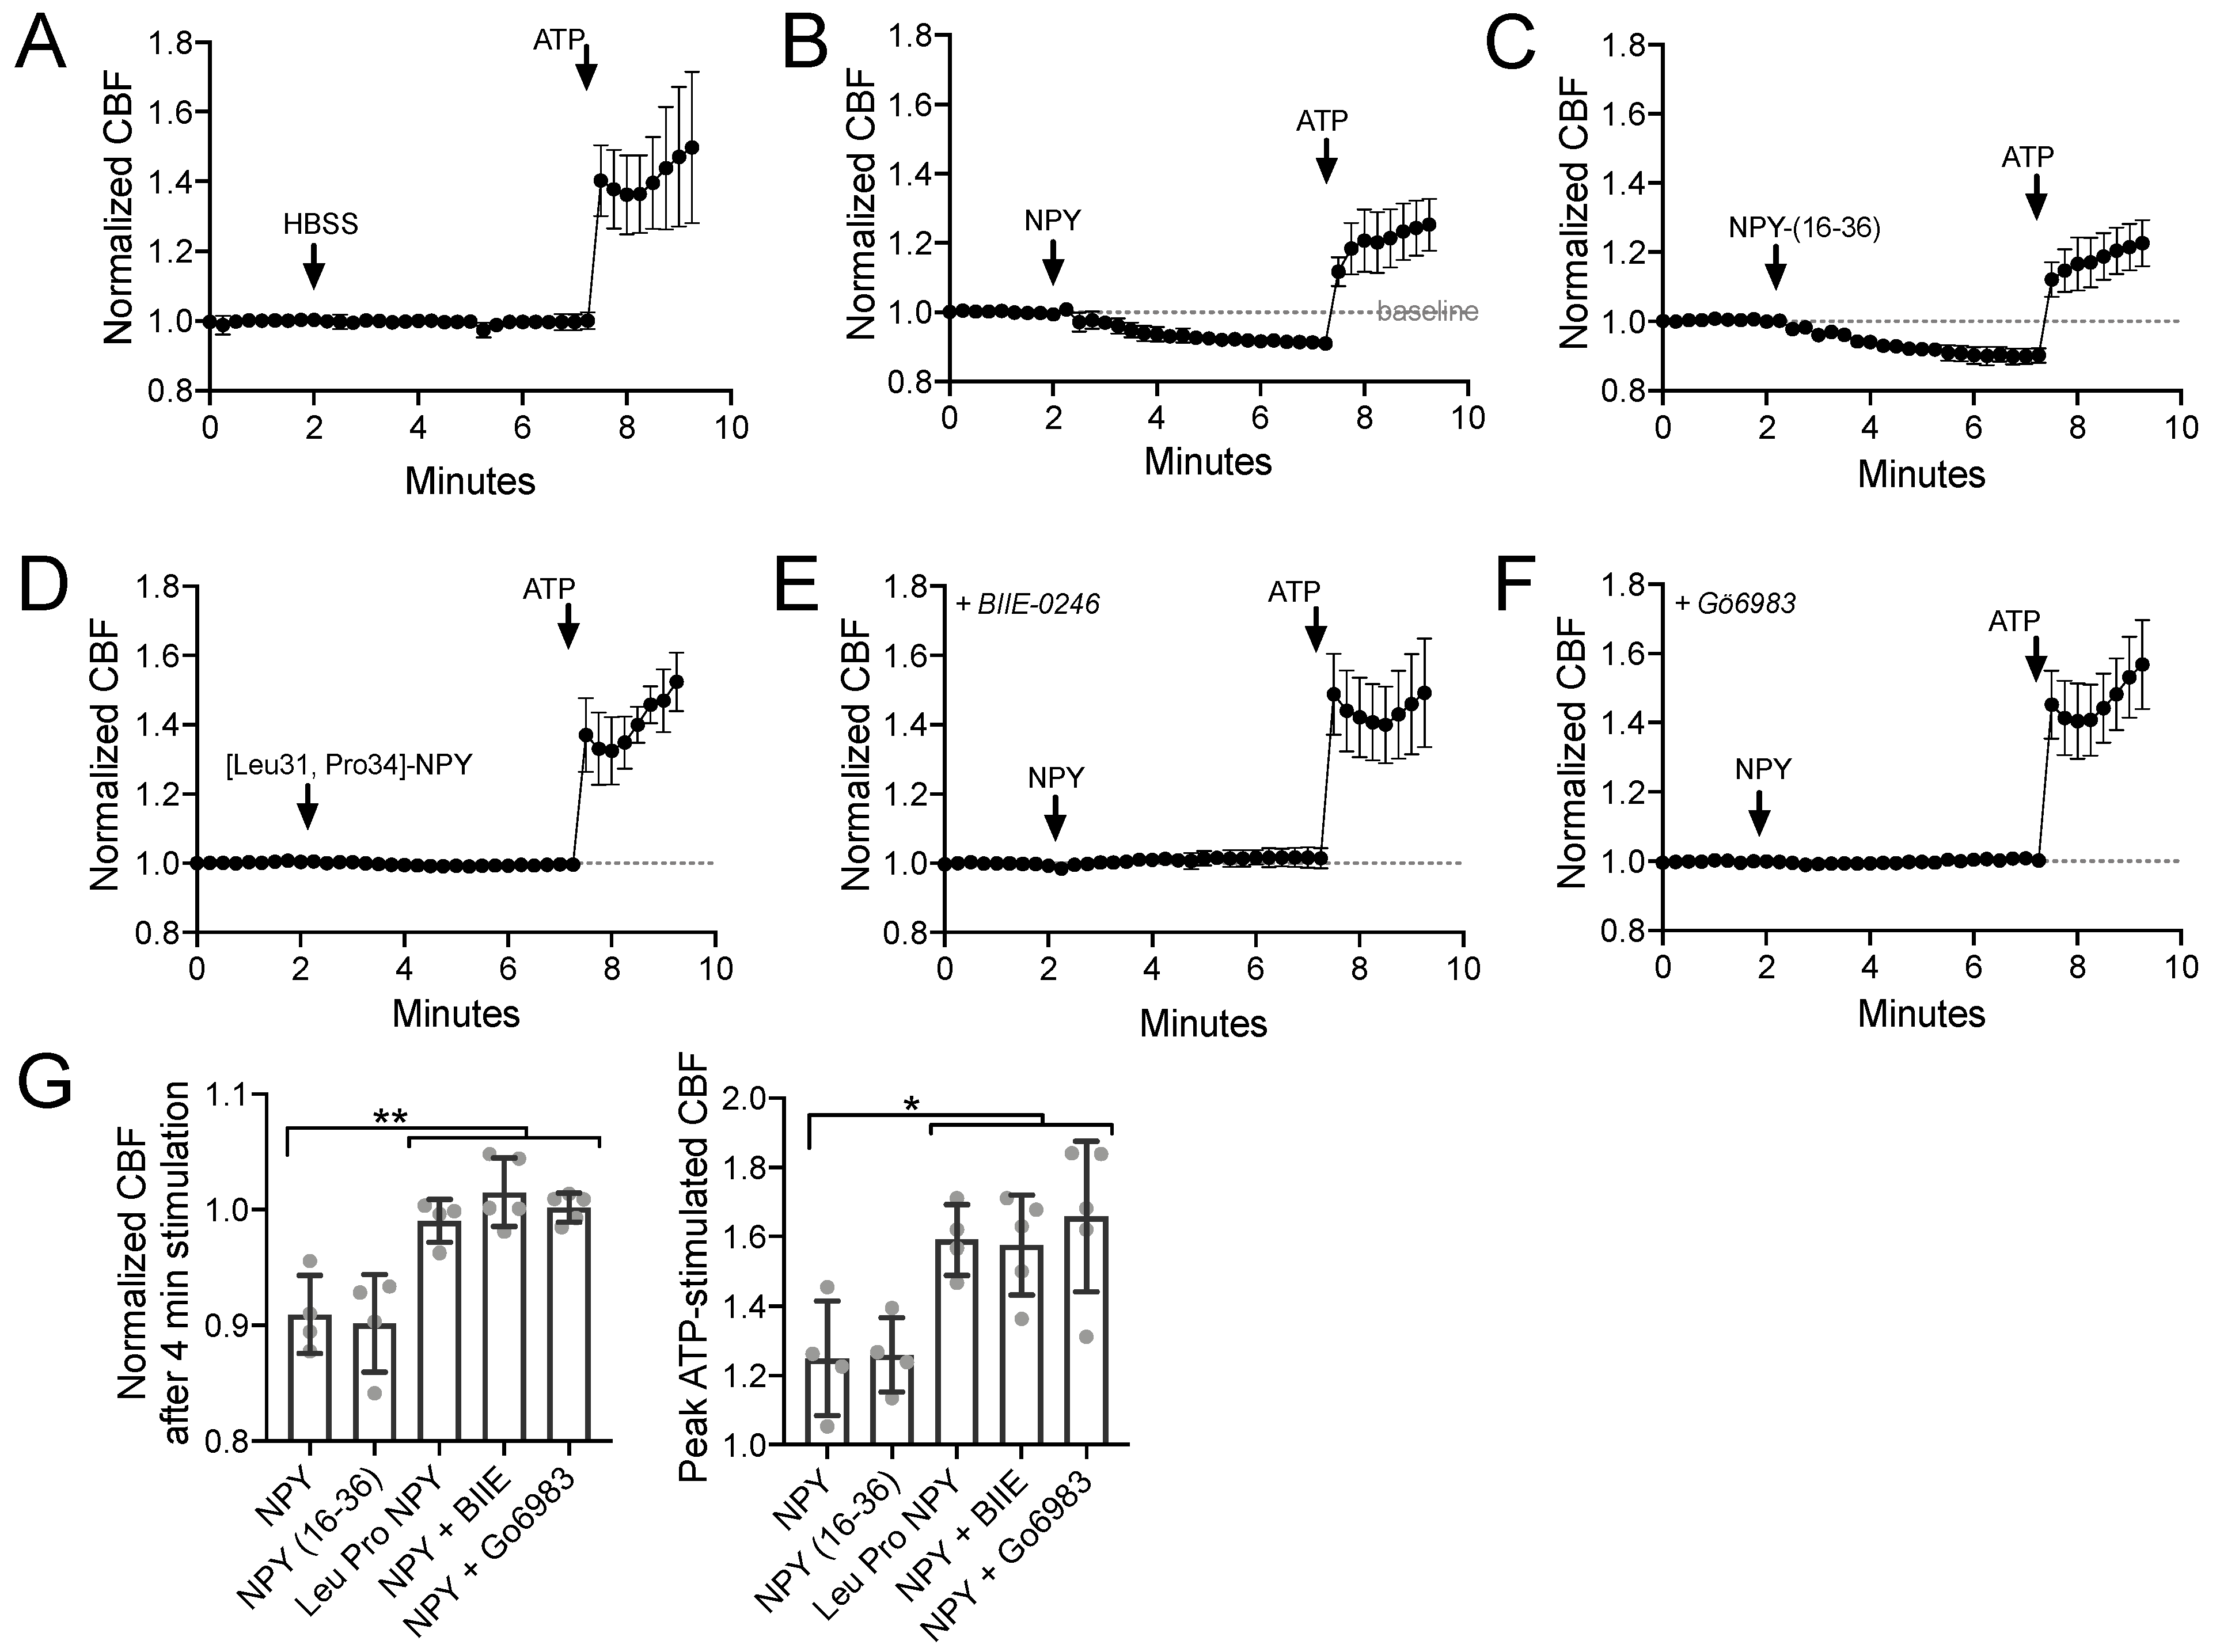
Using primary sinonasal epithelial cells grown at an air–liquid interface (ALI), we observed that NPY (1 µM) reduced the baseline sinonasal ciliary beat frequency (CBF) (Figure 1A,B) in a manner that was mimicked by NPY2R agonist NPY-(16–36) (1 µM) but not NPY1R agonist [Leu31,Pro34]-NPY (1 µM) (Figure 1C,D). A high concentration of NPY (1 µM) was used in many experiments here as a saturating concentration to test effects of maximal stimulation of NPYRs. The effects of NPY were blocked by NPY2R antagonist BIIE-0246 (1 µM) or PKC inhibitor Gö6983 (1 µM) (Figure 1E,F). Results are summarized in Figure 1G. This confirms our previous observations that NPYR2 activation reduces CBF via PKC activation [78]. PKC is one of the major negative regulators of CBF [89].
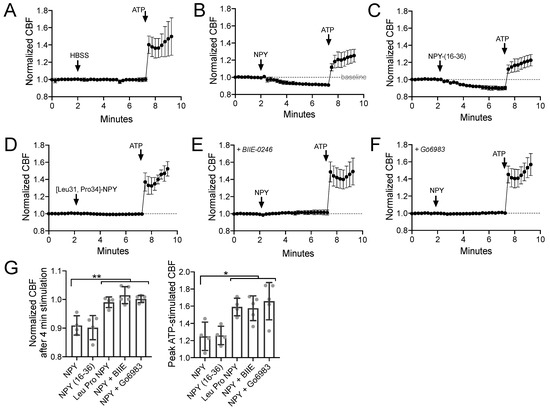
Figure 1.
Neuropeptide Y (NPY) reduces baseline and adenosine trisphosphate (ATP)-stimulated ciliary beat frequency (CBF) through NPY receptor 2 (NPY2R) activation of protein kinase C (PKC). (A–F) Average traces of n = 4 experiments per condition, each experiment from a separate air liquid interface (ALI) culture from a separate chronic rhinosinusitis (CRS) patient. 100 µM ATP used as a control. (G) Bar graph showing raw data points from independent experiments and mean ± SD. Significance by one-way analysis of variance (ANOVA) with Dunnett’s posttest comparing all values to NPY alone; * p < 0.05 and ** p < 0.01. Other abbreviations: HBSS, Hank’s balanced slat solution; NPY-(16–36), NPY2R agonist; [Leu31, Pro34]-NPY, NPY1R agonist; BIIE-0246, NPY2R antagonist; Gö6983, PKC inhibitor.
3.2. T2R38, T2R14, and eNOS Have Different Patterns of Cilia Localization
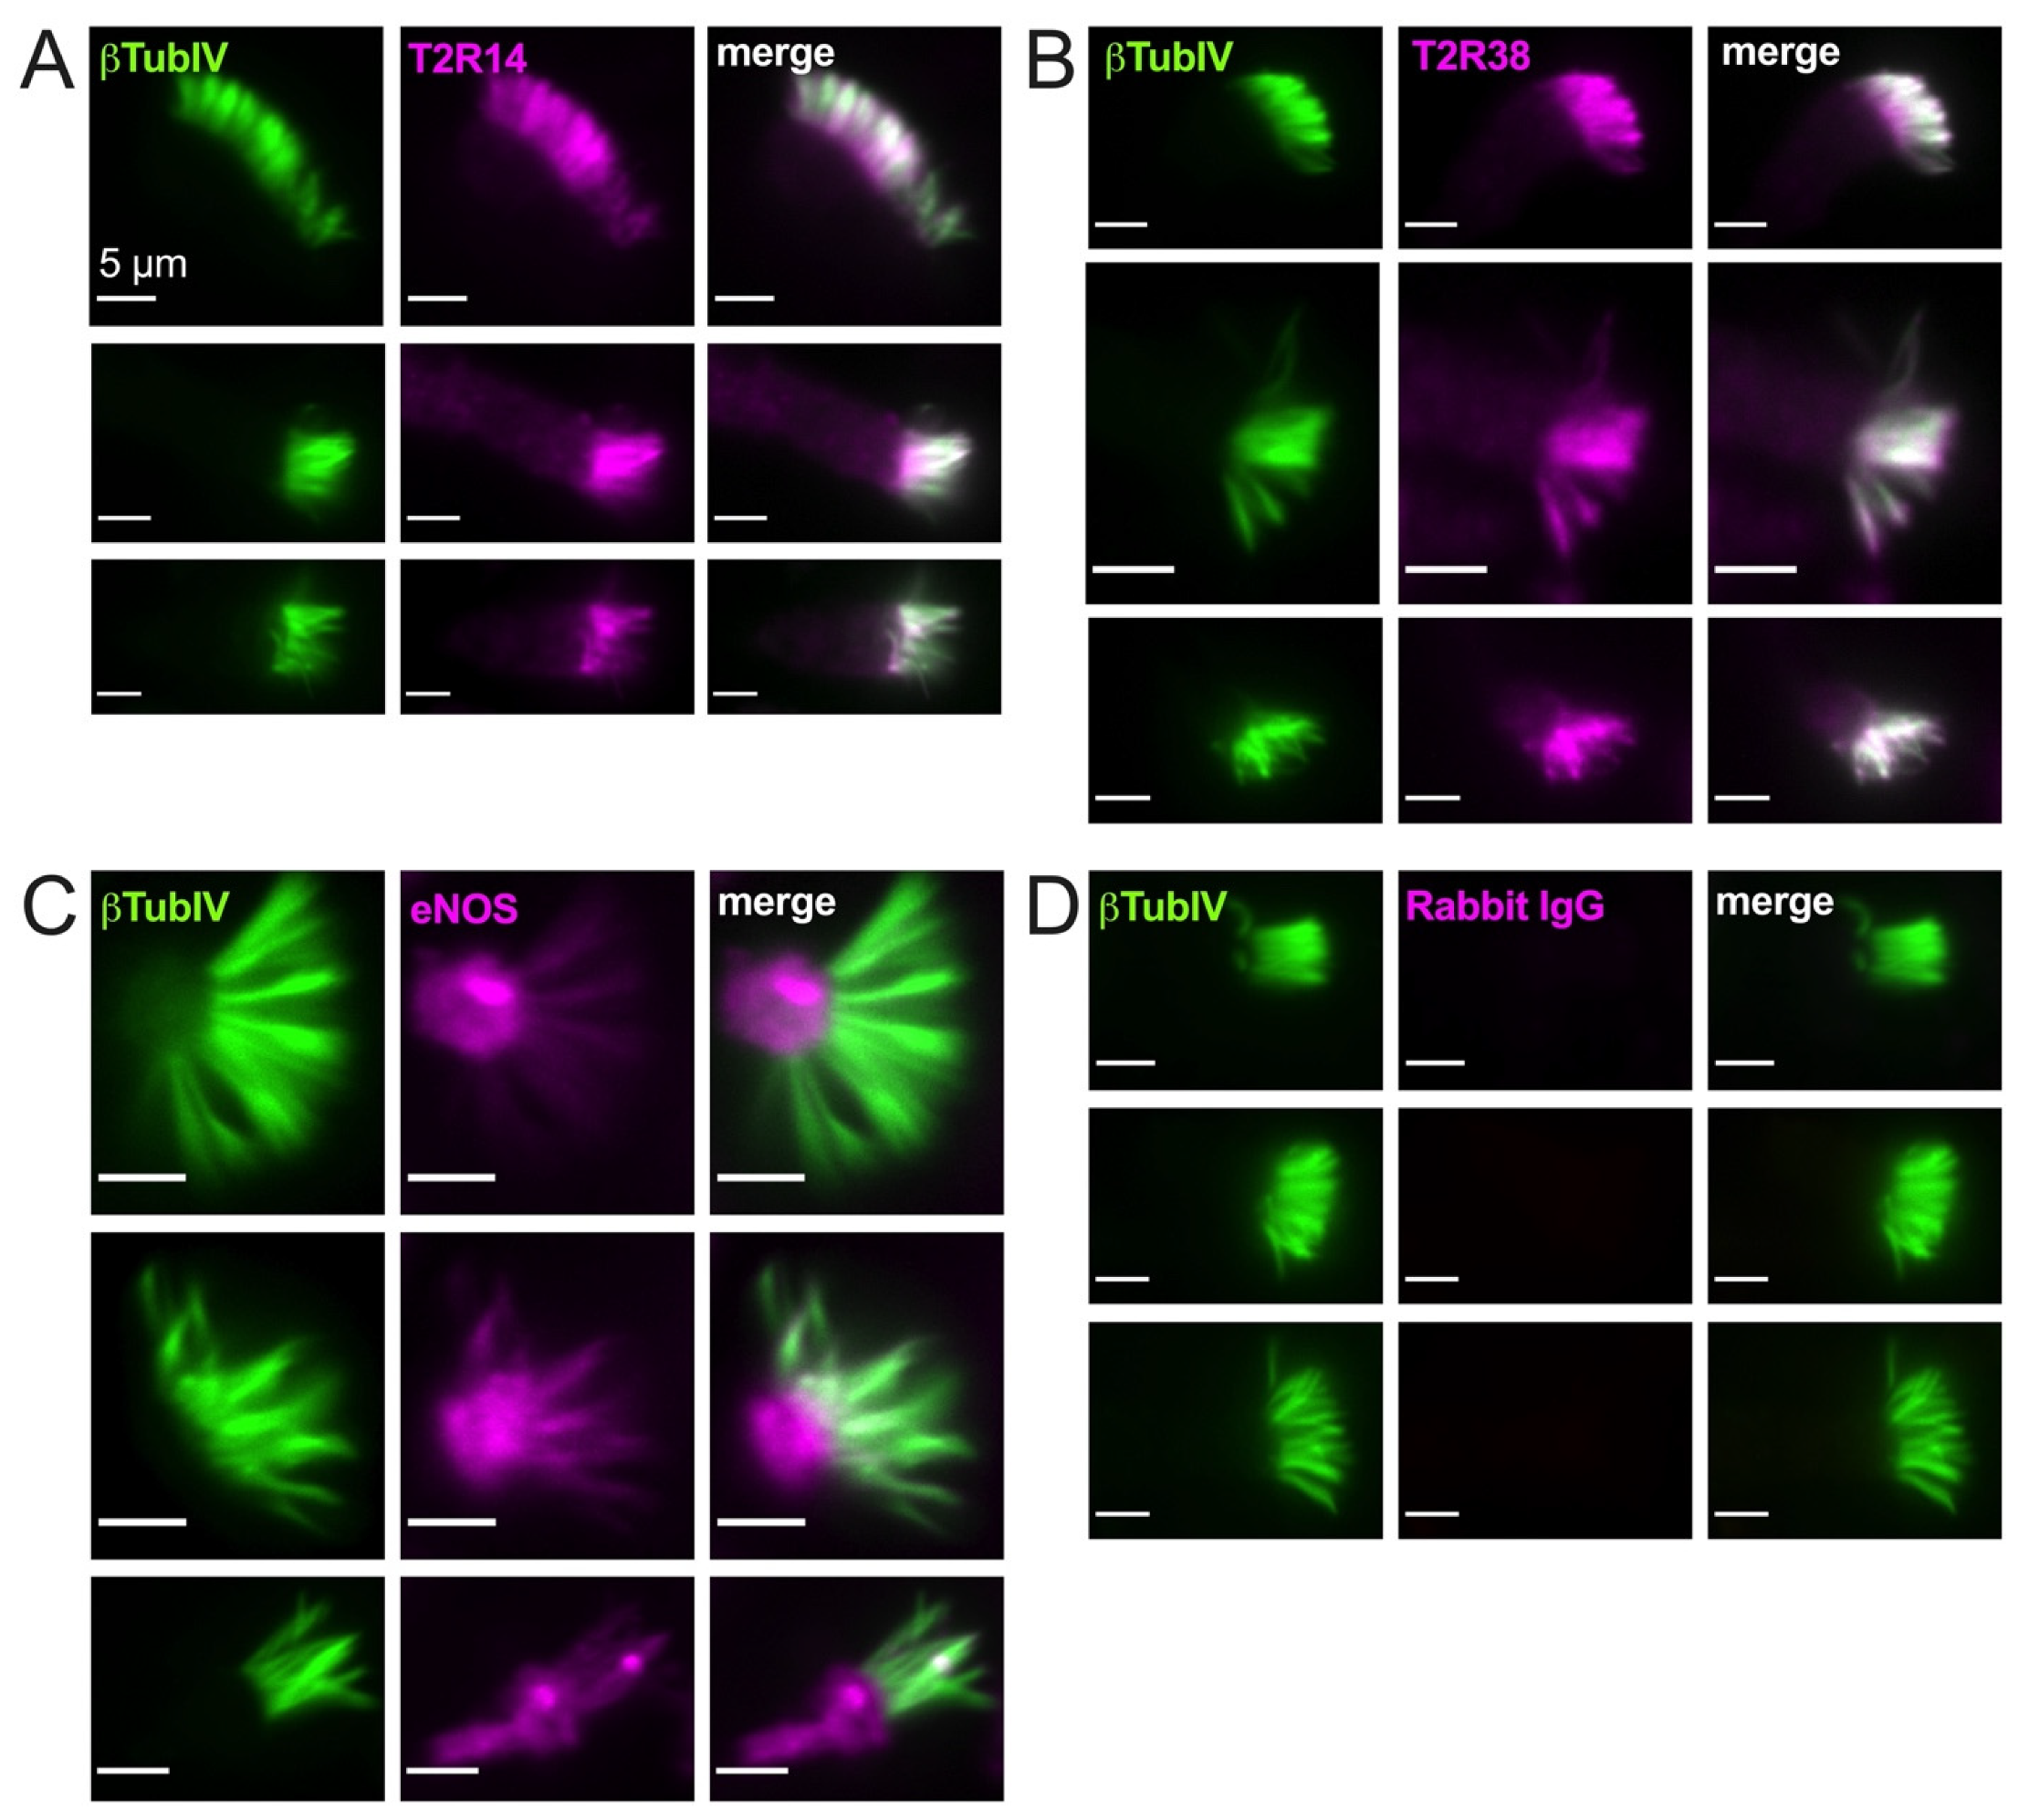
As described above, PKC also negatively regulates eNOS, likely the major NOS isoform in healthy airway ciliated cells [90]. In isolated ciliated cells brushed from the middle turbinate tissue, we observed cilia localization of both T2R14 and T2R38 (Figure 2A,B) and some ciliary but mostly sub-ciliary apical localization of eNOS (Figure 2C,D). This confirms previous observations that eNOS is localized to the base of airway cilia [25,28].
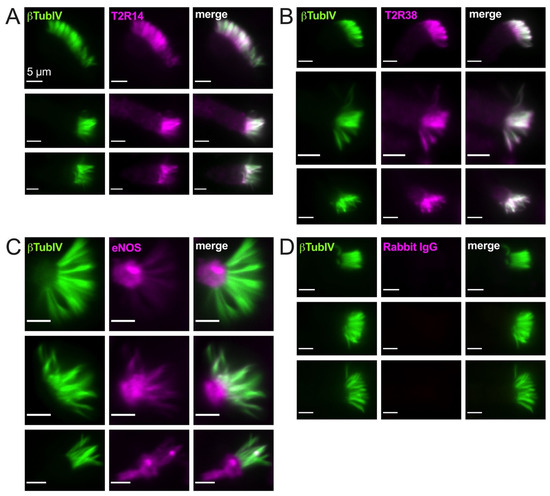
Figure 2.
Bitter taste receptors T2R38 and T2R14 are localized to motile cilia while endothelial nitric oxide synthase (eNOS) is primarily localized at the base of cilia. Isolated ciliated cells brushed from middle turbinate tissue were stuck to glass using CellTak and fixed as described in the text and stained for β tubulin IV (βTubIV) and T2R14 (A), T2R38 (B), eNOS (C), or rabbit IgG ((D) isotype control for nonspecific antibody binding). All images were taken at identical microscope settings (exposure, LED power, binning, etc.) with 60× 1.4 NA oil objective.
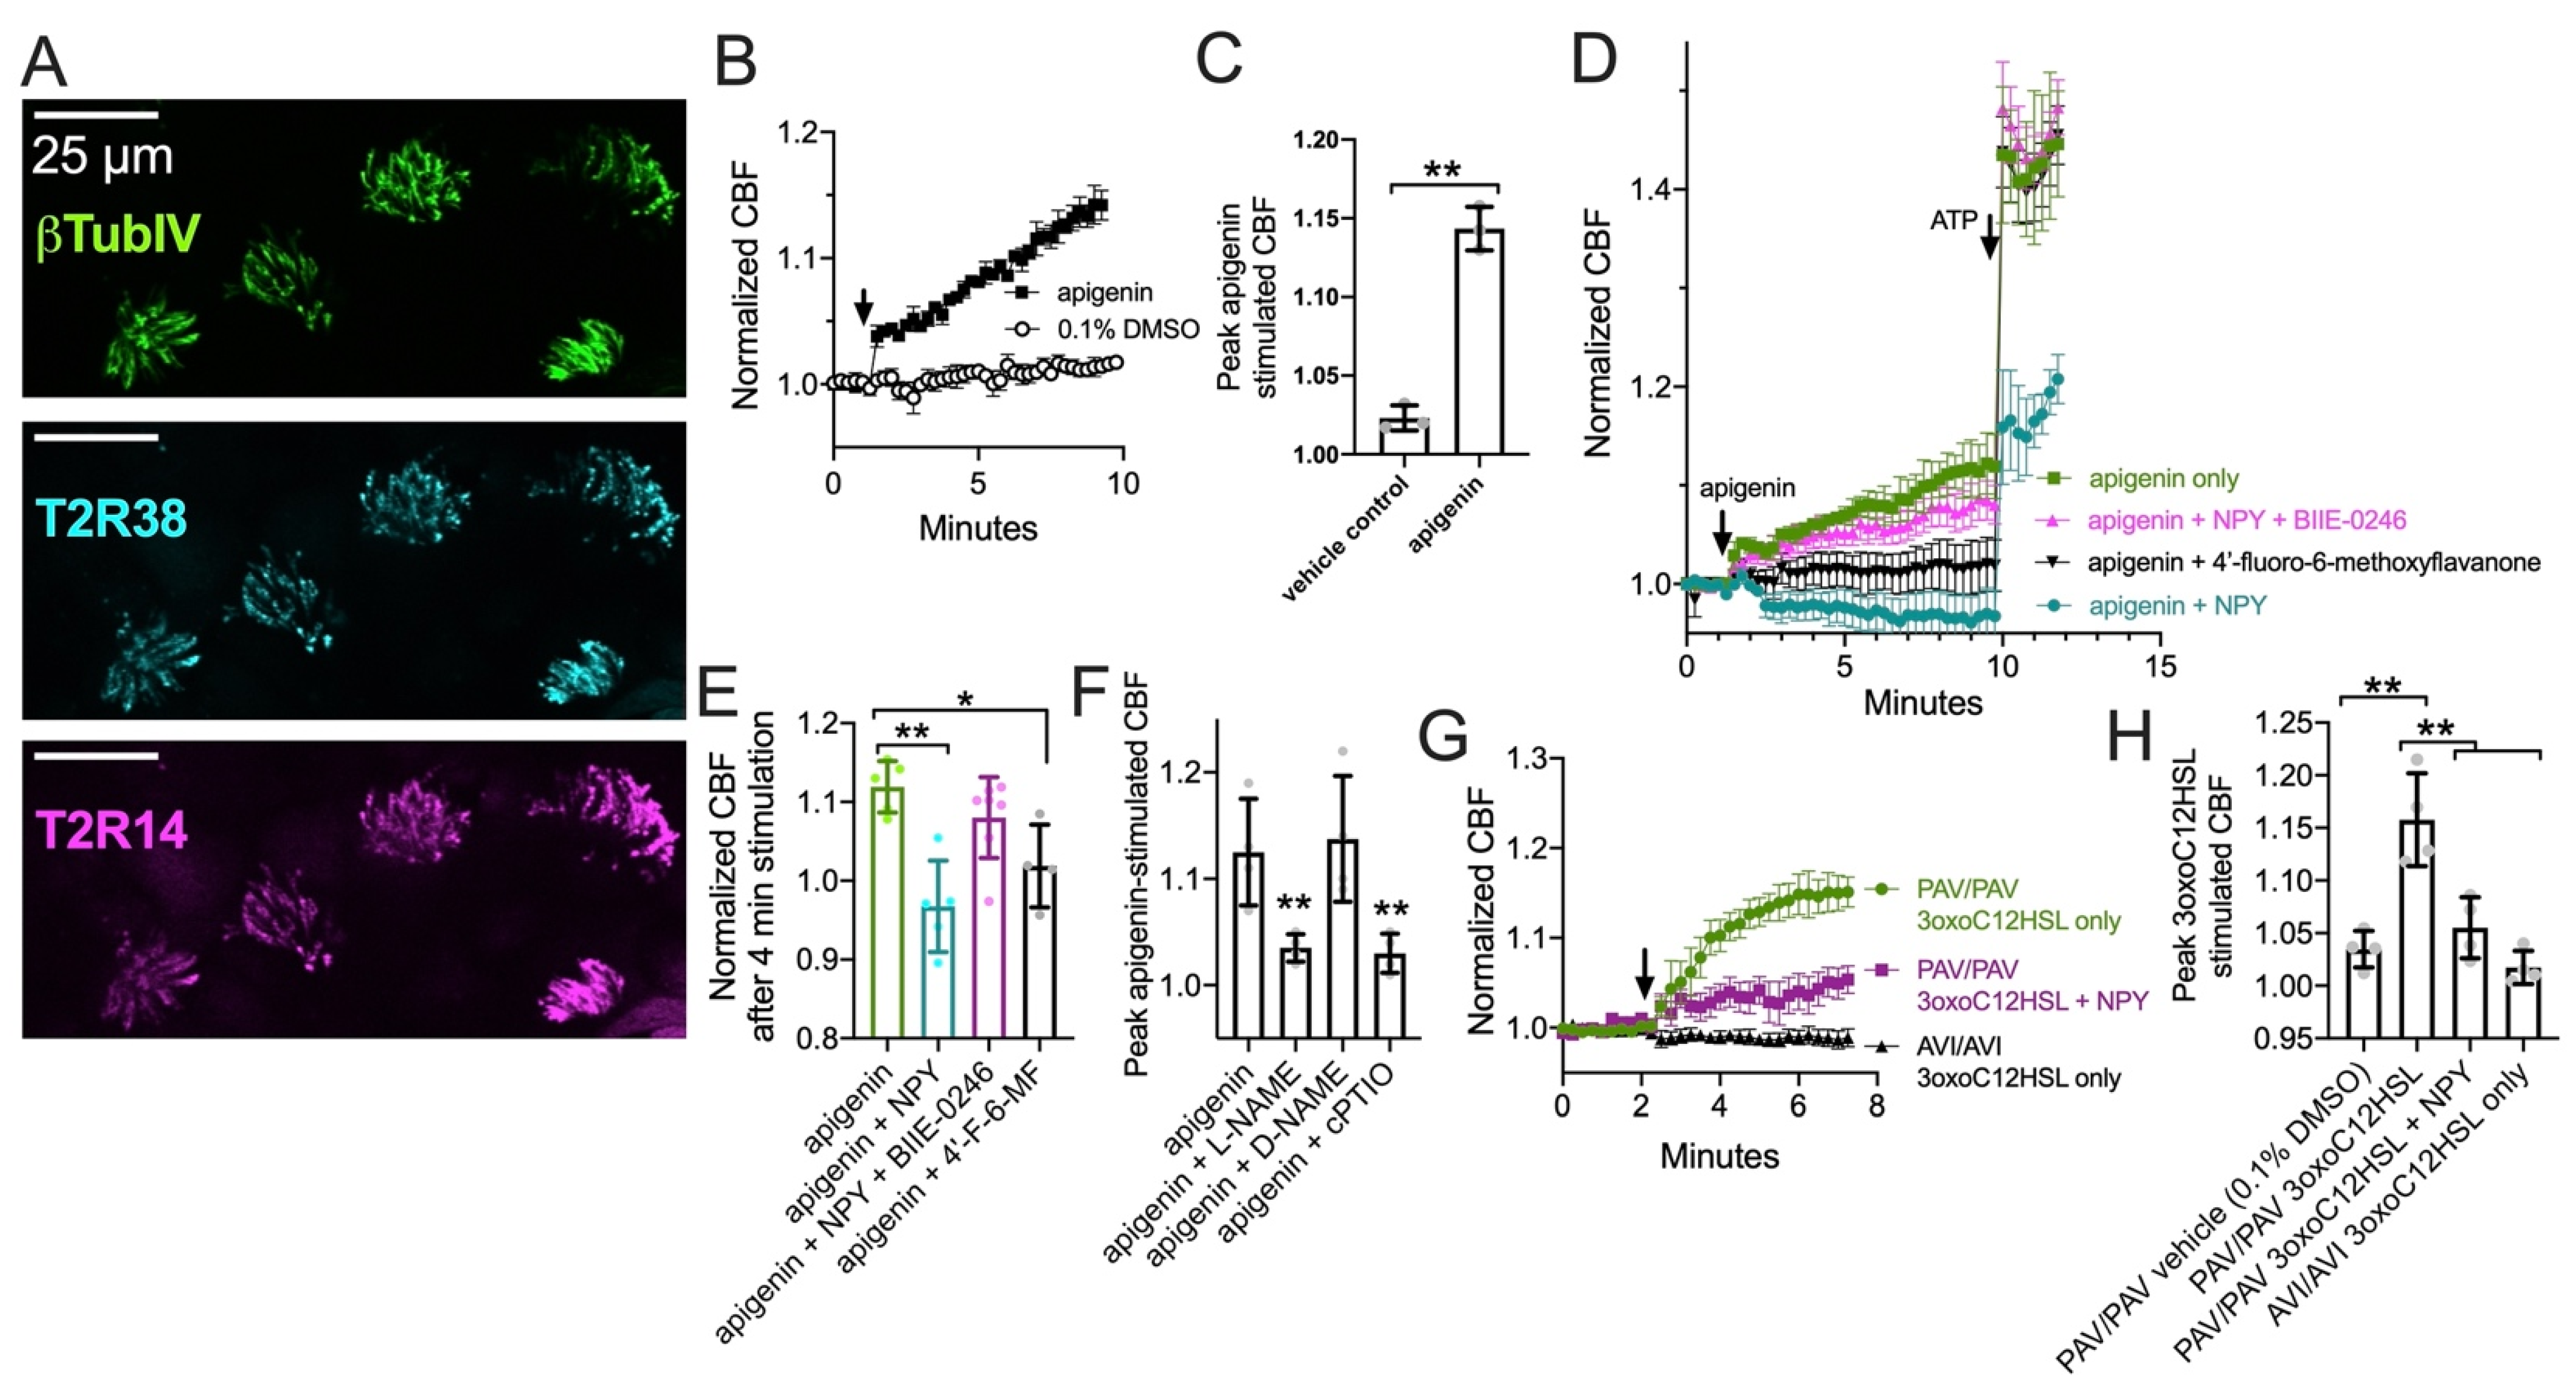
3.3. NPY Attenuates CBF Response to T2R14 Agonists via NPY2R Receptors
We tested T2R ciliary beat responses in nasal ALI cultures, which also express cilia-localized T2R14 and T2R38 (Figure 3A and [23,24]). The flavone apigenin is a T2R14 and T2R39 agonist that increases nasal epithelial cell CBF in a manner dependent on NO [23]. Apigenin (100 µM) increased CBF ~15% after 8 min, while vehicle control (0.1% DMSO) had minimal effect (Figure 3B,C). CBF increases in response to 100 µM apigenin were blocked by T2R14 and T2R39 antagonist [91] 4′-fluoro-6-methoxyflavanone (50 µM; Figure 3D,E). CBF responses to apigenin were inhibited with co-stimulation with 1 µM NPY (Figure 3D,E). This did not occur in the presence of 1 µM BIIE-0246 (Figure 3D,E). Together, these data suggest NPY negatively regulates T2R-mediated CBF responses, which are NO dependent as they are blocked by NOS inhibitor L-NAME (10 µM; 30 min pre-treatment) or NO scavenger cPTIO (10 µM; Figure 3F and [23,24]).
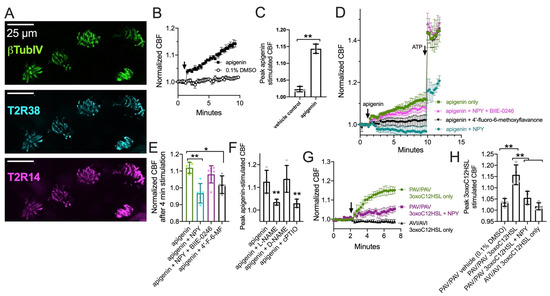
Figure 3.
Neuropeptide Y (NPY) reduces ciliary beat frequency (CBF) increases in response to T2R14 agonist apigenin via NPY2R receptors. (A) Image of T2R14 and T2R38 in cilia from a primary nasal epithelial air-liquid interface (ALI) culture. (B) Ciliary response during stimulation with 100 µM apigenin or 0.1% dimethylsulfoxide (DMSO; vehicle control). (C) Bar graph (mean ± SD and individual data points; n = 3 independent experiments using cells from separate patients) of peak CBF after 8 min stimulation with apigenin or DMSO as in (B). (D) Ciliary responses during apigenin and subsequent ATP stimulation in the presence or absence of NPY, BIIE 0246 (NPY2R antagonist), and/or 4′-fluoro-6-methoxyflavanone (4′-F-6MF; T2R14 antagonist). Traces are average of 4–6 independent experiment using ALIs from different individual patients. (E) Individual data points and mean ± SD from experiments as in (D) showing CBF after 4 min stimulation with apigenin. (F) Peak apigenin-simulated CBF (mean ± SD and individual data points) from experiments as in (D) but with cultures treated with 10 µM L-NAME (NOS inhibitor), D-NAME (inactive analogue), or cPTIO (NO scavenger). (G) Ciliary responses during stimulation with 3oxoC12HSL (100 µM) in PAV/PAV (homozygous functional T2R38) or AVI/AVI (homozygous non-functional T2R38) genotyped cultures as well as subsequent ATP stimulation in the presence or absence of 10 nM NPY (lower concentration than used in (D–F). (H) Peak 3oxoC12HSL-simulated CBF (mean ± SD and individual data points) from experiments as in (G). Significance in (C) by Student’s t-test. Significance in (E,F) by one way ANOVA with Dunnett’s posttest comparing all values to apigenin only. Significance in (H) by one way ANOVA with Bonferroni posttest. * p < 0.05 and ** p < 0.01.
We also observed that Pseudomonas aeruginosa quorum-sensing molecule 3-oxo-dodecanoylhomoserine lactone (3oxoC12HSL; 100 µM), also a T2R agonist [22,92], increased CBF in a T2R38-dependent manner as previously reported [22]. CBF increased in cultures homozygous for the functional (PAV) TAS2R38 allele [93], while CBF did not increase in cultures homozygous for the non-functional (AVI) TAS2R38 allele (Figure 3G,H). We tested co-stimulation with a lower concentration of NPY (10 nM) than that used above. We found that NPY reduced the CBF response to 3oxoC12HSL in PAV/PAV cultures (Figure 3G,H). Thus, NPY can inhibit T2R-activated CBF increases.
3.4. NPY Does Not Alter T2R-Induced Calcium Elevation but Does Reduce T2R-Stimulated NO Production
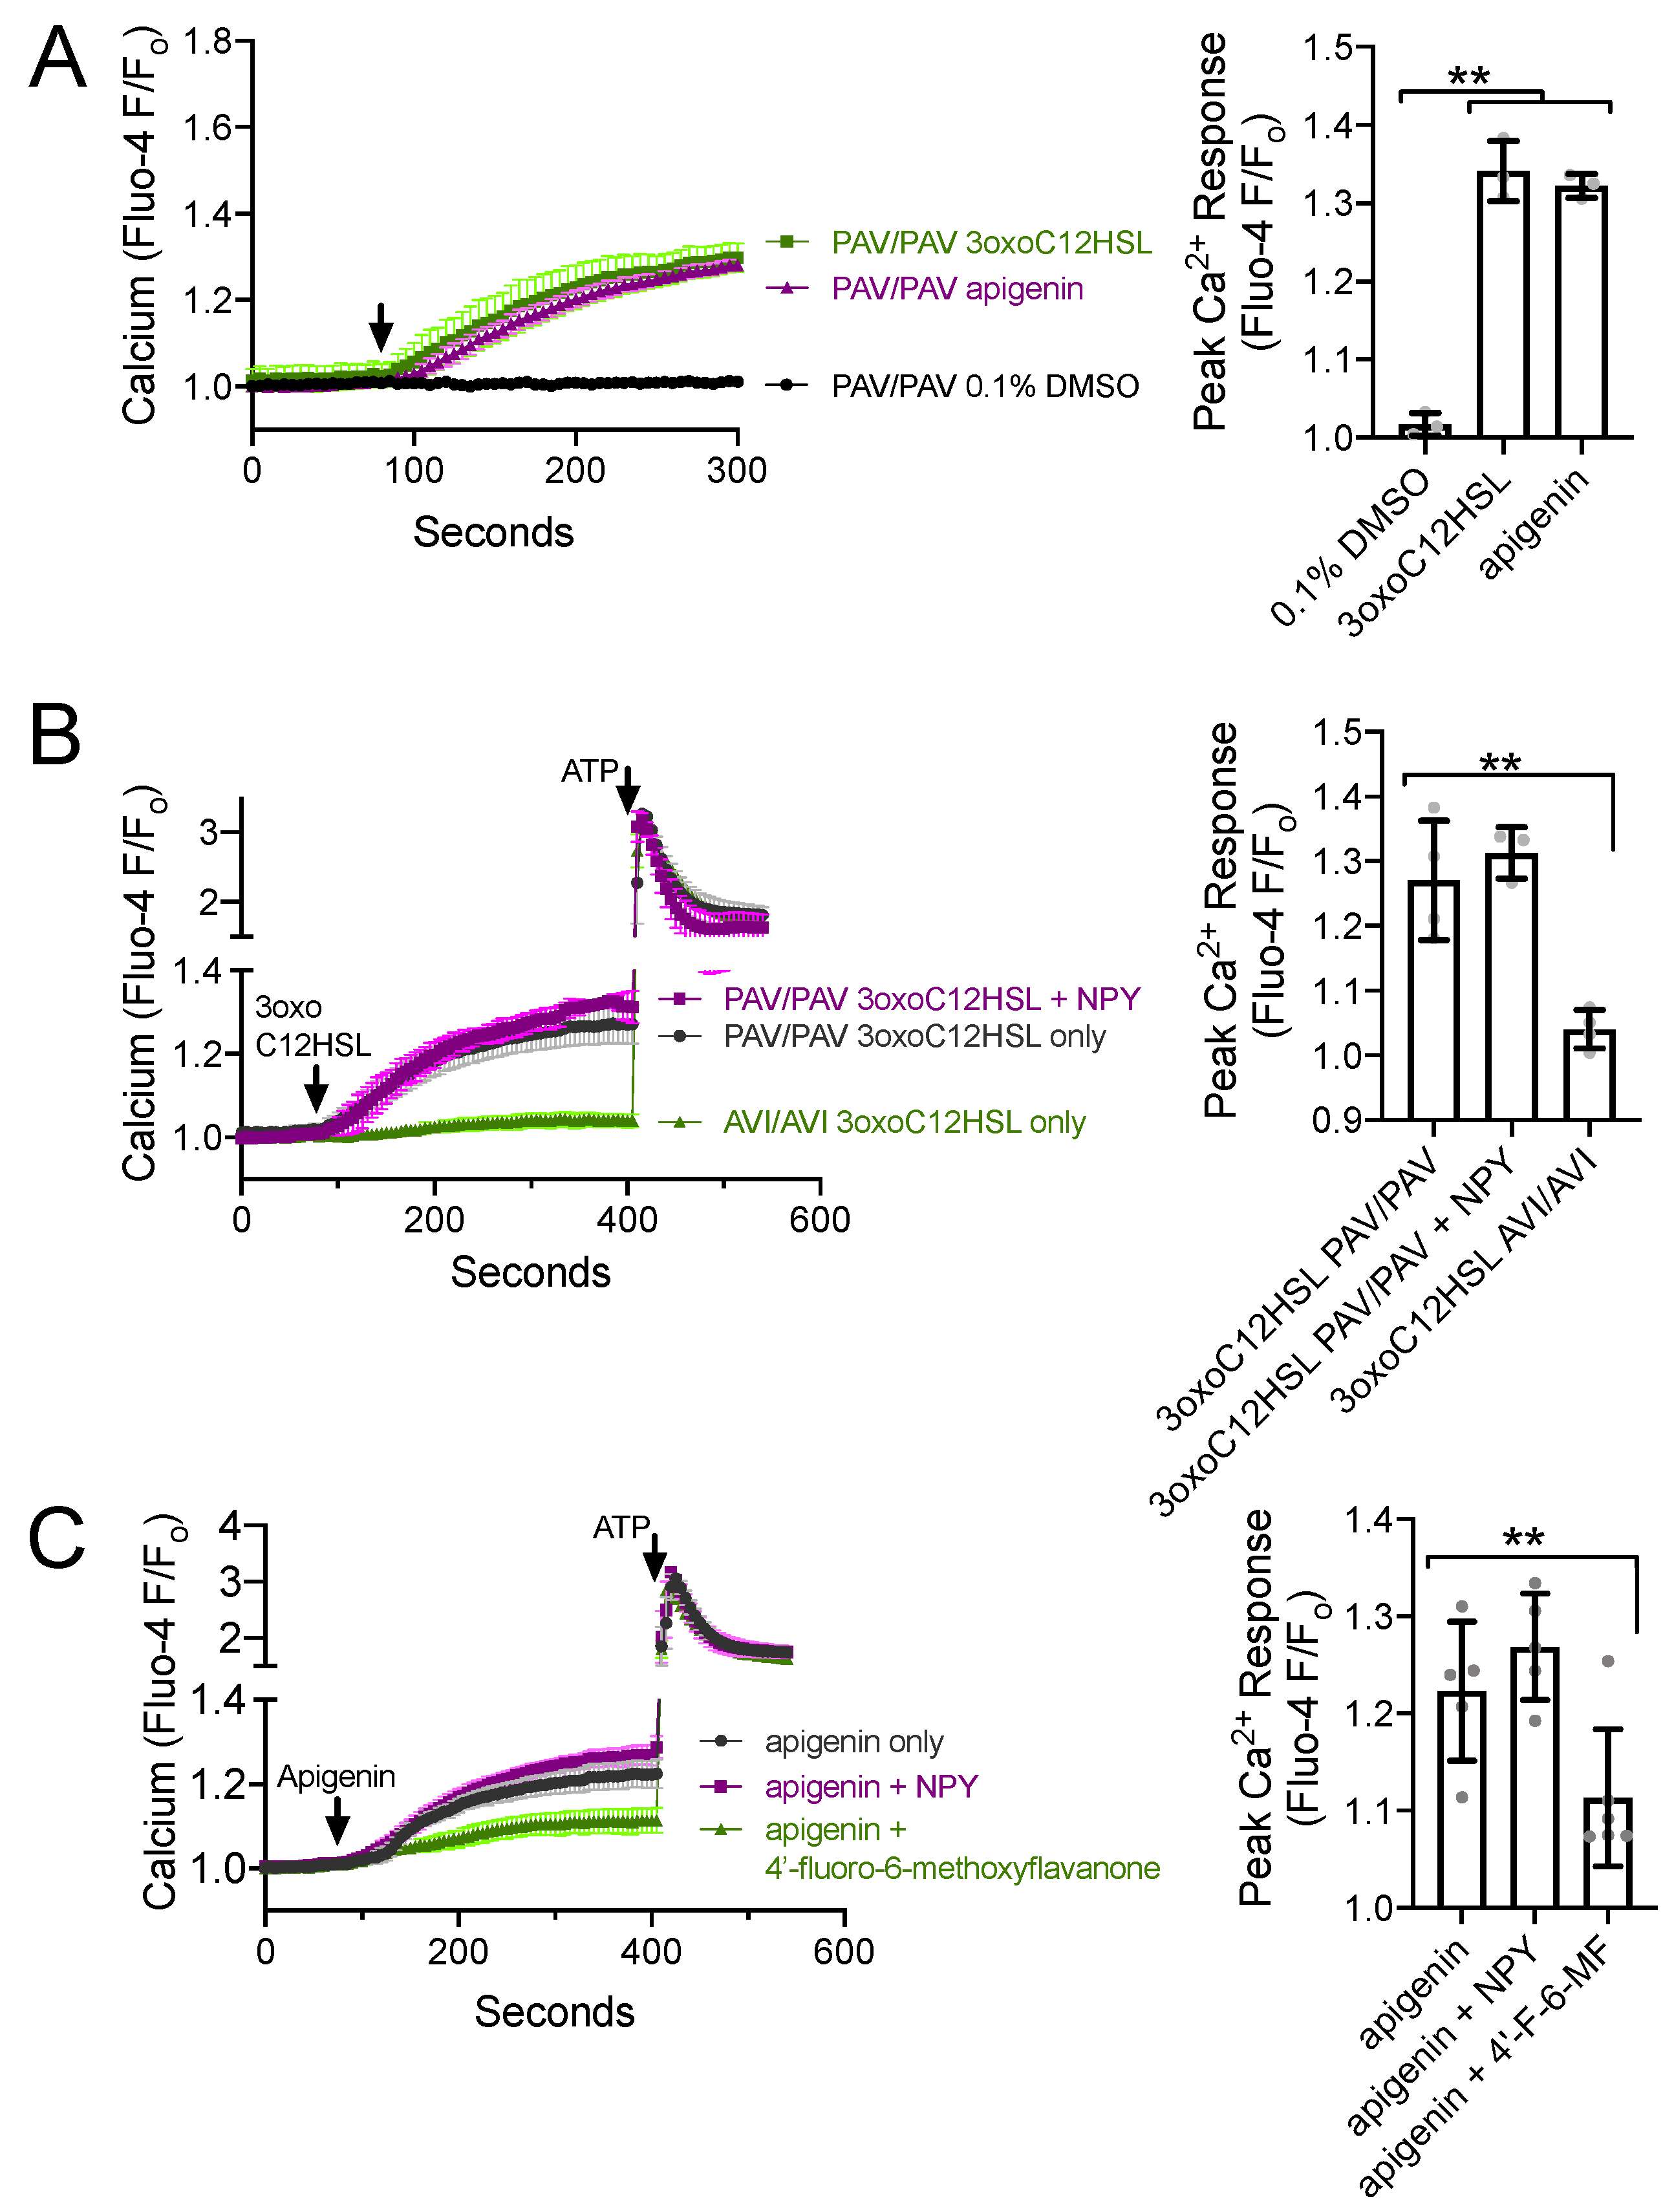
Because T2R-stimulated NO production via eNOS is driven by calcium signaling [22,23,24], one potential explanation for the above observations is that NPY reduces the T2R-stimulated calcium response. To test this, we imaged T2R-induced calcium responses in ALIs loaded with fluorescent calcium-sensitive dye Fluo-4. Both P. aeruginosa [22] and apigenin [23] activate calcium responses in primary sinonasal cells grown at ALI. We confirmed that 100 µM 3oxoC12HSL and 100 µM apigenin activated calcium responses in ALIs derived from patients homozygous for functional (PAV) T2R38, while the 0.1% DMSO vehicle control solution had no effect on calcium (Figure 4A). As previously reported [22], we found that 3oxoC12HSL activated calcium responses in PAV/PAV ALIs but not in ALIs derived from patients homozygous for non-functional (AVI) T2R38 (Figure 4B). The calcium response in PAV/PAV ALIs was not reduced in the presence of 1 µM NPY (Figure 4B), which is likely a saturating, supraphysiological, maximally activating concentration of NPY. Likewise, the calcium response to T2R14 agonist apigenin (100 µM) was not reduced by 1 µM NPY but was reduced by T2R14 antagonist 4′-fluoro-6-methoxyflavanone (50 µM; Figure 4C). Thus, the reduced CBF response during NPY co-stimulation was not likely due to reduced calcium signaling.
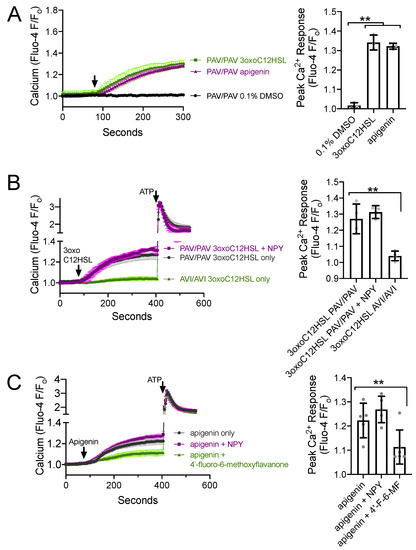
Figure 4.
NPY does not alter T2R-induced calcium elevations. (A) Average calcium traces (left) and bar graph (right) showing mean ± SD of experiments in TAS2R38 genotyped PAV/PAV (homozygous functional) ALIs stimulated with 100 µM 3oxoC12HSL, 100 µM apigenin, or 0.1% DMSO (vehicle control). Traces shown are mean from n = 3 experiments (each using a different ALI from a different patient). Significance on in bar graph determined by one-way ANOVA with Dunnett’s posttest comparing all values to 0.1% DMSO control; ** p < 0.01. (B) Average calcium traces (left) and bar graph (right) showing mean ± SD of experiments in TAS2R38 genotyped PAV/PAV (homozygous functional) and AVI/AVI (homozygous nonfunctional) ALIs stimulated with 3oxoC12HSL ± NPY and subsequently with purinergic agonist ATP (100 µM). Traces shown are mean from n = 3–4 experiments (each using a different ALI from a different patient). Significance in bar graph determined by one-way ANOVA with Dunnett’s posttest comparing all values to 3oxoC12HSL in PAV/PAV cultures (first bar); ** p < 0.01. (C) Average calcium traces (left) and bar graph (right) showing mean ± SD of experiments in ALIs stimulated with T2R14 agonist apigenin ± NPY or 4′-fluoro-6-methoxyflavanone (T2R14 antagonist). Significance in bar graph determined by one-way ANOVA with Dunnett’s posttest comparing all values to apigenin only (first bar); ** p < 0.01. TAS2R38 PAV/AVI cultures were used here as TAS2R38 does not affect responses to apigenin (previously shown in [23]).
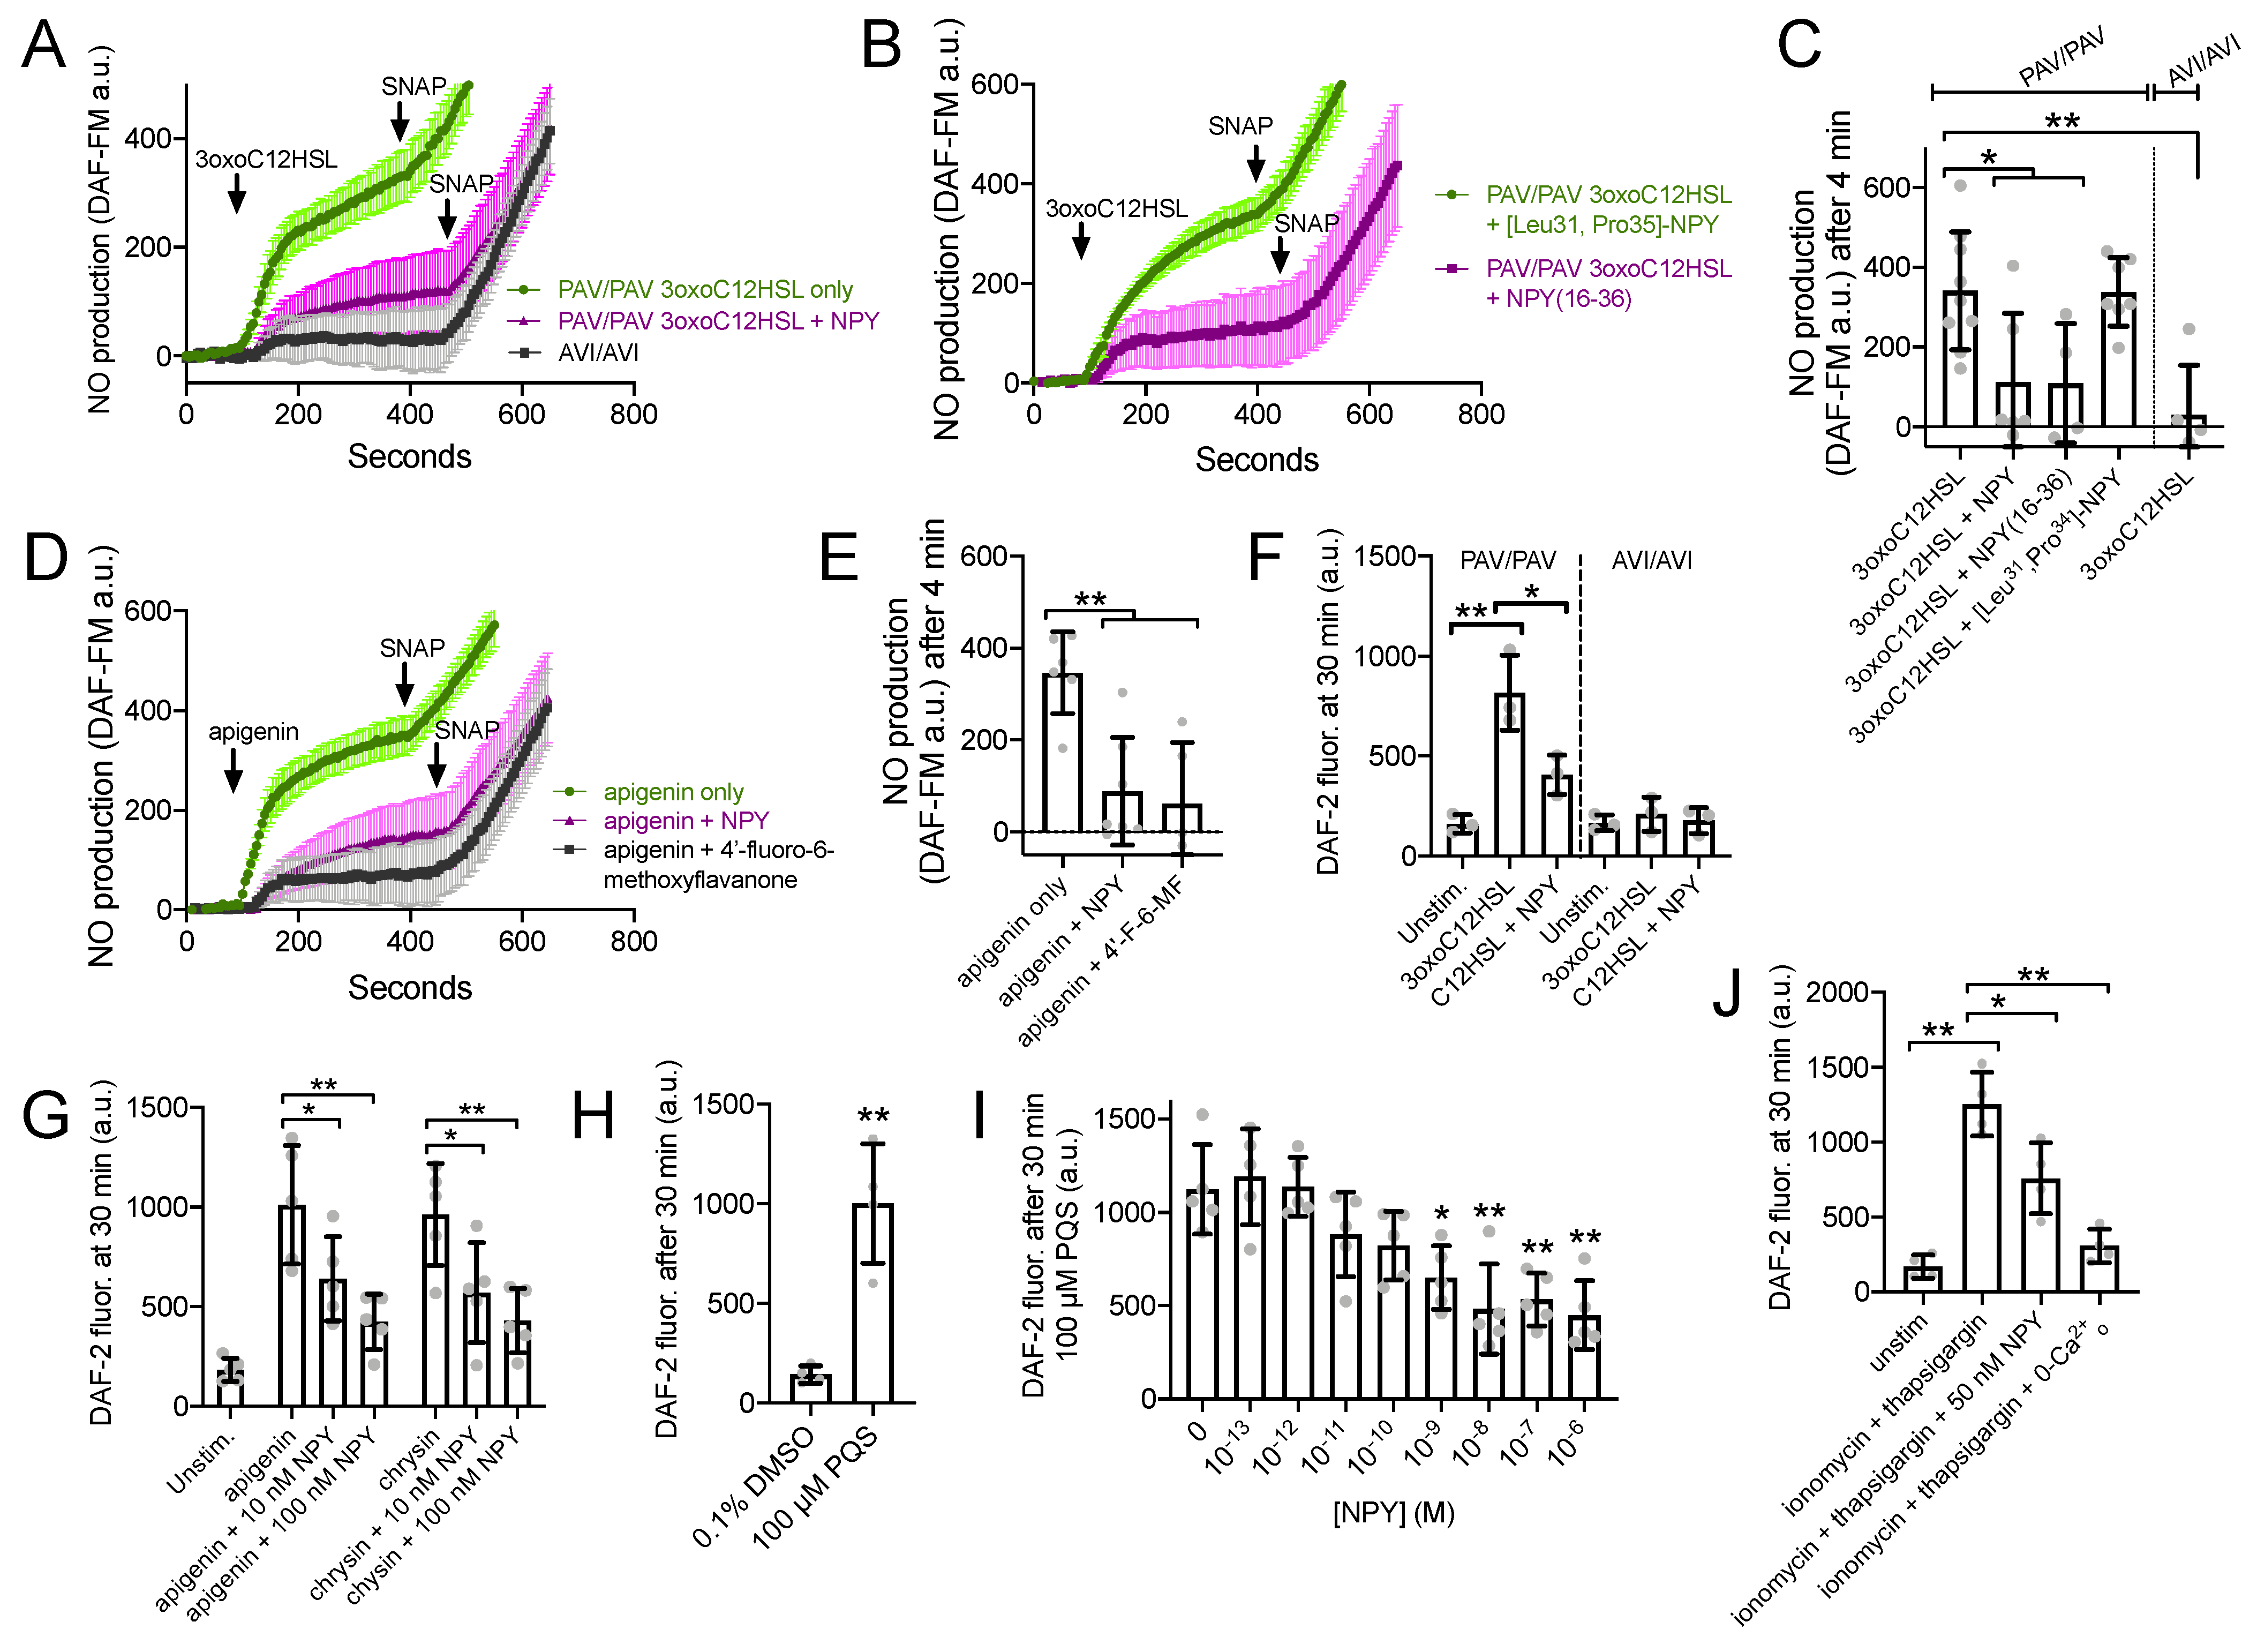
To directly measure T2R-induced NO production, we imaged cultures loaded with the NO-sensitive dye DAF-FM. DAF-FM fluorescence increased in response to 100 µM 3oxoC12HSL in ALIs from PAV/PAV but not in AVI/AVI patients (Figure 5A,C). Non-specific NO donor SNAP (10 µM) was added as a control at the end of each experiment. NO production in PAV/PAV ALIs was reduced during co-stimulation with 1 µM NPY (Figure 5A,C). NPY2R agonist NPY-(16–36) also reduced 3oxoC12HSL NO production in PAV/PAV ALIs, while NPY1R agonist [Leu31, Pro35]-NPY had no effect (Figure 5B,C). Similarly, apigenin-induced DAF-FM/NO responses were reduced with NPY or T2R14 antagonist 4′-fluoro-6-methoxyflavanone (Figure 5D,E).
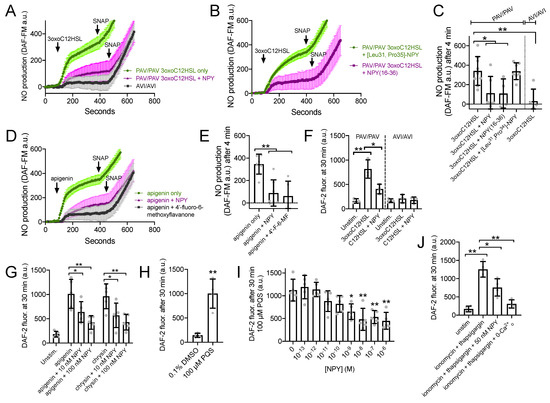
Figure 5.
NPY reduces T2R-stimulated NO production. (A,B) DAF-FM traces (average of 6–9 experiments using ALIs from 2–3 different patients) showing NO production in response to 100 µM 3oxoC12HSL ± 1 µM NPY, 1 µM [Leu31,Pro35]-NPY (NPY1R agonist) or 1 µM NPY(16–36) (NPY2R agonist). 10 µM SNAP (nonspecific NO donor) used at the end of each experiment as a positive control. (C) Bar graph (mean ± SD) showing 3oxoC12HSL DAF-FM responses from experiments as in (A). Significance by one-way ANOVA with Dunnett’s posttest comparing all values to 3oxoC12HSL alone in PAV/PAV cultures (first bar); * p < 0.05 and ** p < 0.01. (D) Experiments as in (A,B) but with T2R14 agonist apigenin ±1 µM NPY or 50 µM 4′-fluoro-6-methoxyflavanone. (E) Bar graph (mean ± SD) showing apigenin DAF-FM responses from experiments in (D). Significance by one way ANOVA with Dunnett’s posttest comparing all values to apigenin only (first bar). (F) Bar graph (mean ± SD) of DAF-2 fluorescence in apical surface liquid of ALI culture stimulated as indicated by 100 µM 3oxoC12HSL ± 100 nM NPY in PAV/PAV or AVI/AVI cultures as indicated. Note lower concentration of NPY was used here vs. 1 µM in (B–E). Significance by one-way ANOVA with Dunnett’s posttest comparing all values to unstimulated PAV/PAV cultures (first bar); * p < 0.05 and ** p < 0.01. (G) Bar graph (mean ± SD) of data from experiments as in (F) but performed with T2R14 agonists apigenin and chrysin (100 µM each) ± 10 nM or 100 nM NPY (lower, more physiological concentrations). Significance by one-way ANOVA with Bonferroni posttest; * p < 0.05 and ** p < 0.01. (H) Pseudomonas quinolone signal (PQS; 100 µM) stimulation resulted in increased apical DAF-2 fluorescence over vehicle control (0.1% DMSO; n = 4 experiments per condition using ALIs from separate patients). Significance by Student’s t-test; ** p < 0.01. Bar graph shows mean ± SD. (I) Experiments were performed as in (H) with 100 µM PQS ± a dose response of NPY (n = 5 experiments per condition, each using an ALI from a different patient). Significance by one way ANOVA with Dunnett’s posttest comparing all values to PQS with no NPY (0 NPY; first bar); * p < 0.05, ** p < 0.01. (J) Experiments as in (F,G) but with ionomycin and thaspigargin and 50 nM NPY. Last bar shows inhibition of the ionomycin and thapsigargin response in extracellular calcium-free media (0-Ca2+o), with no added calcium plus 2 mM EGTA to chelate trace calcium. Significance by one-way ANOVA with Bonferroni posttest; * p < 0.05 and ** p < 0.01. Bar graph shows mean ± SD.
We tested NO release into the airway surface liquid by overlaying ALIs with impermeant dye DAF-2 as previously done [22]. DAF-2 fluorescence increased, signaling NO production, in the presence of 100 µM 3oxoC12HSL in TAS2R38 PAV/PAV (functional T2R38) cultures, and this was reduced by 100 nM NPY (Figure 5F). No increase in DAF-2 fluorescence was observed with TAS2R38 AVI/AVI (non-functional T2R38) cultures, showing this response was dependent on T2R38 (Figure 5F). T2R14 agonists apigenin and chrysin also increased DAF-2 fluorescence, and this was likewise reduced by 10–100 nM NPY (Figure 5G). T2R4 agonist Pseudomonas quinolone signal (PQS; [24]) also increased apical DAF-2 fluorescence over vehicle (0.1% DMSO; Figure 5H). A dose response of NPY co-stimulation in this assay (from 10−13 to 10−6 M or 0.1 pM to 1 µM), revealed statistically significant inhibition of DAF-2 fluorescence increase with as low as 1 nM NPY.
We also found that 50 nM of NPY was sufficient to reduce the NO produced during application of calcium ionophore ionomycin combined with calcium ATPase inhibitor thapsigargin (1 µg/mL each; Figure 5J). Because these compounds will elevate calcium independent of GPCR signaling, the inhibition of NO production here supports that the inhibitory effect of NPY was likely downstream of calcium.
3.5. NPY Effects on T2R-Mediated NO and CBF Responses Are Dependent on PKC
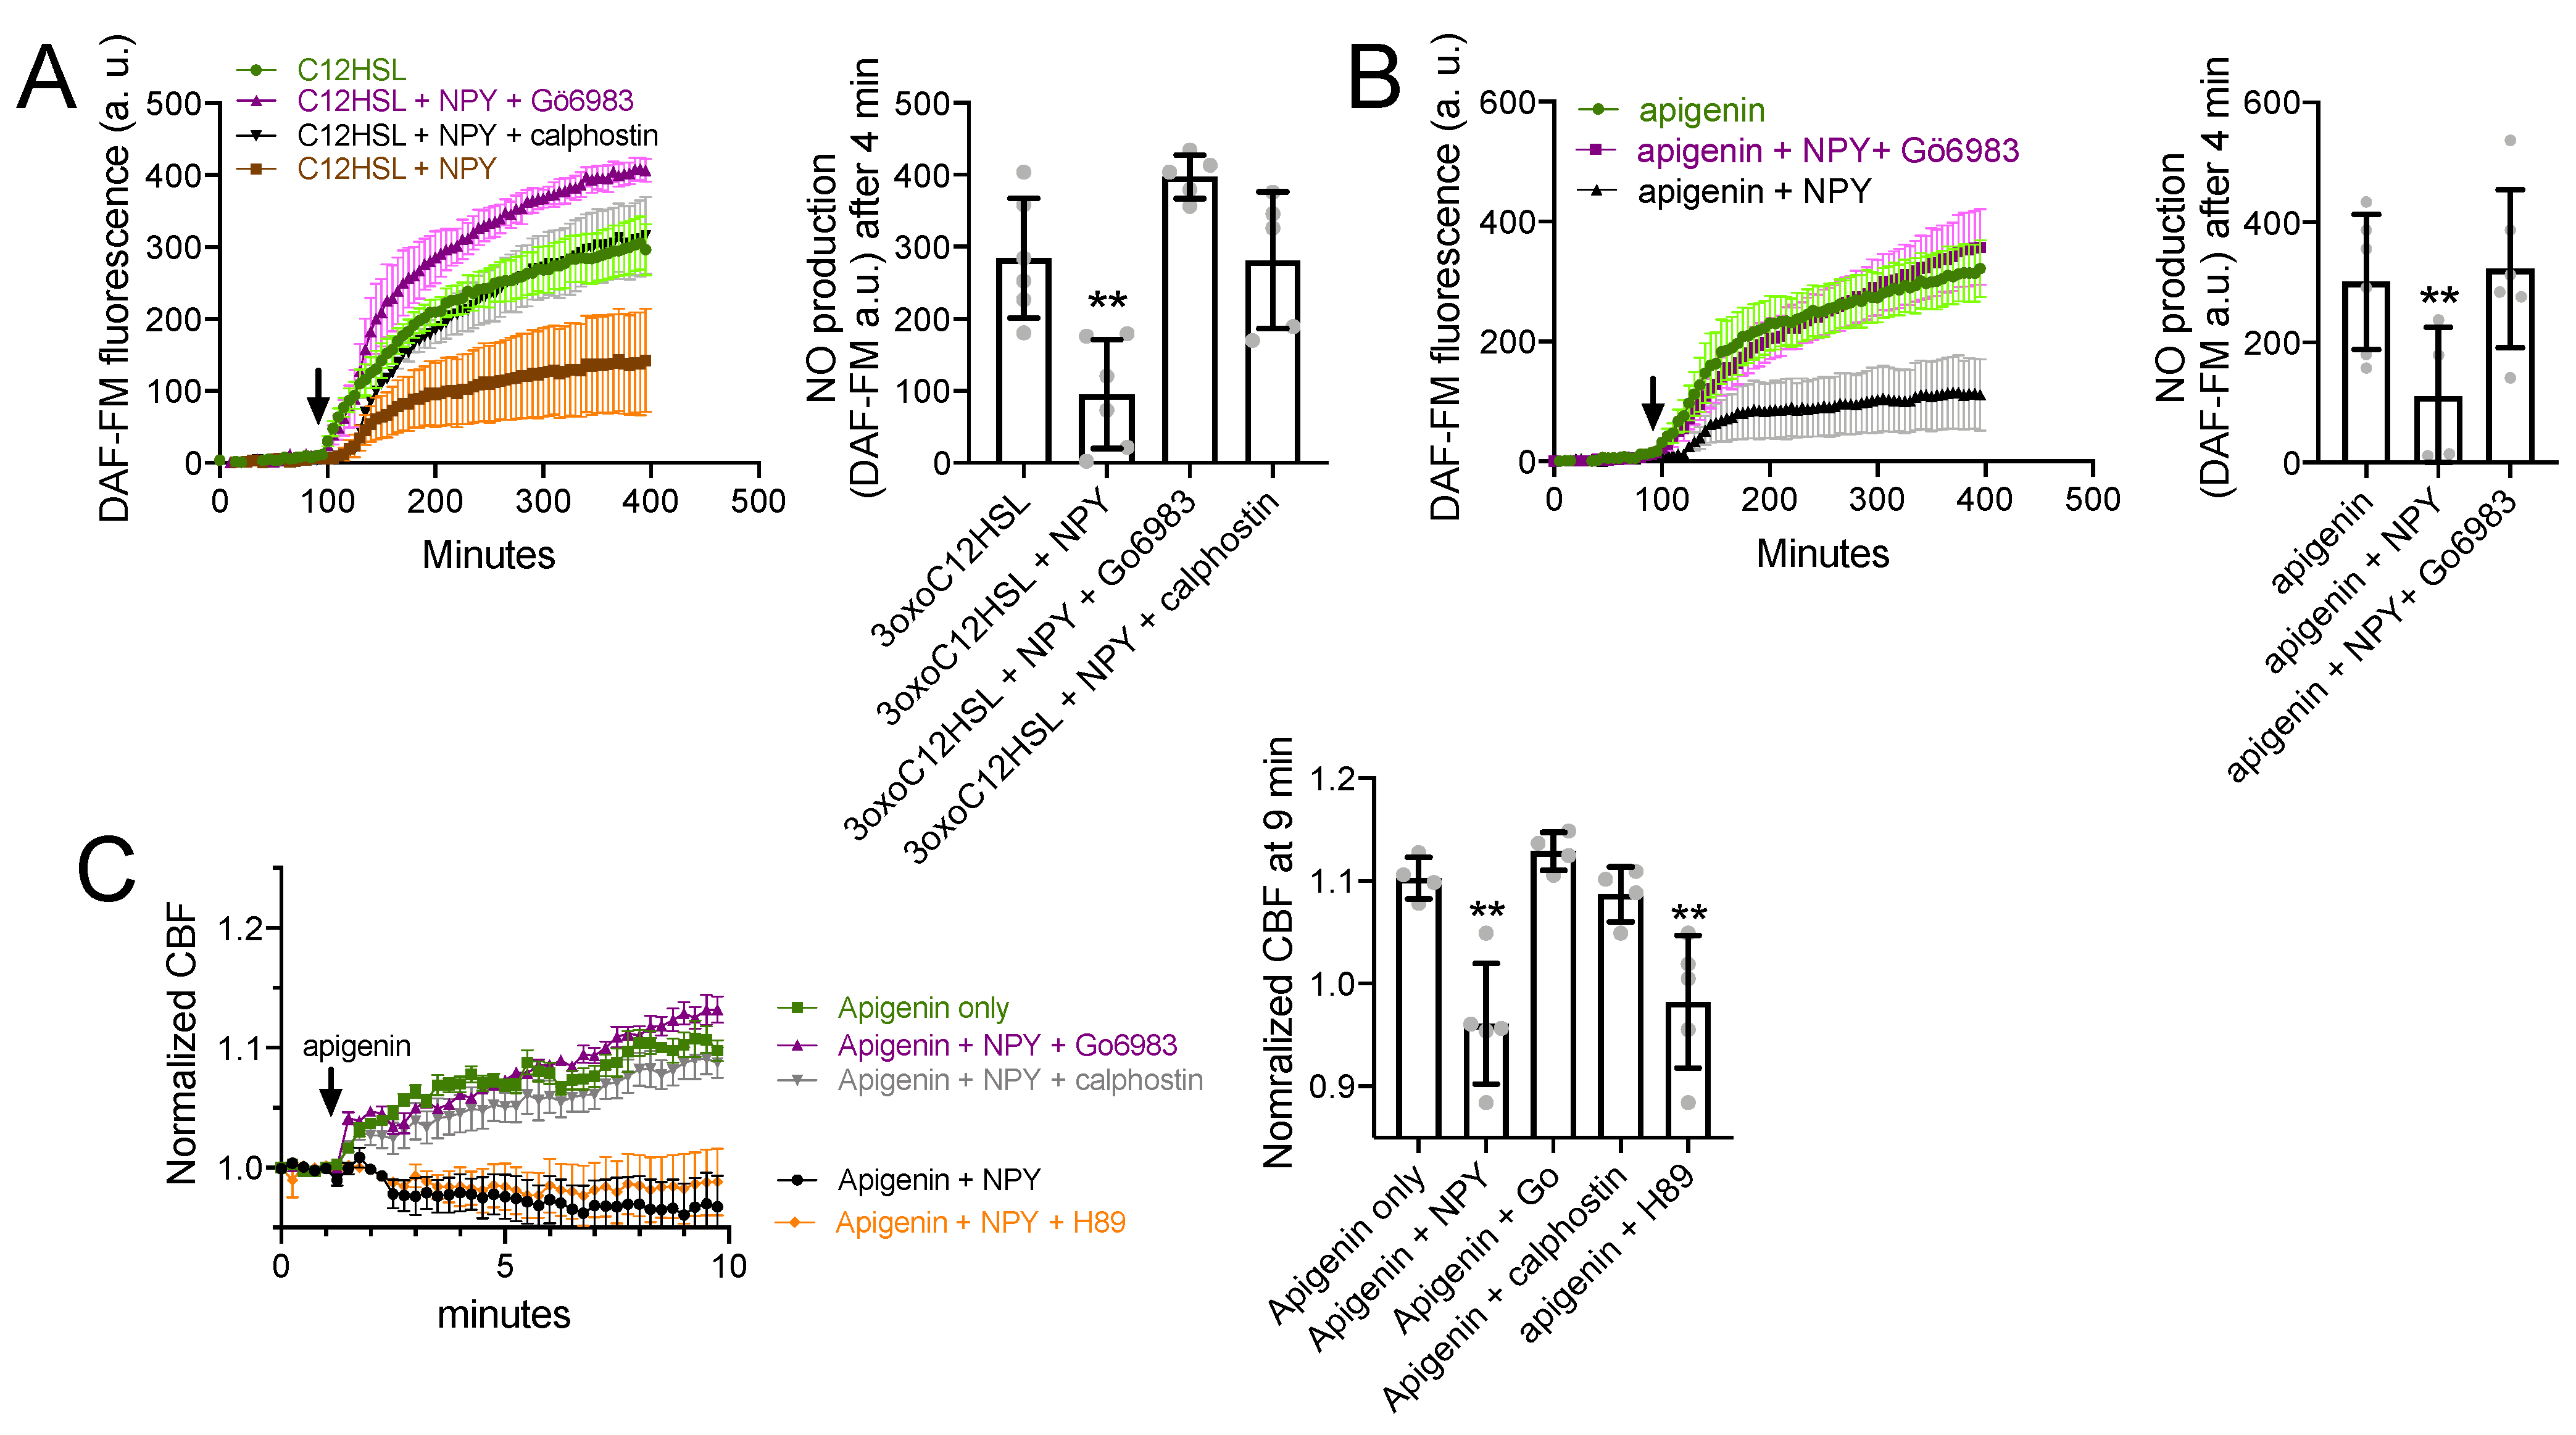
Data above show that NPY stimulation reduces T2R-mediated NO responses without a change in upstream calcium signaling. To find whether this was due to protein kinase C activation, We imaged DAF-FM-loaded PAV/PAV ALIs stimulated with 3oxoC12HSL (100 µM). Stimulated NO production was reduced in the presence of 1 µM NPY but was not reduced in the presence of NPY plus either of two PKC inhibitors, 1 µM Gö6983 or 1 µM calphostin C (Figure 6A). Apigenin (100 µM)-induced NO production was likewise inhibited by 1 µM NPY but restored in the presence of 1 µM Gö6983 (Figure 6B). Apigenin-induced CBF increase was likewise reduced by 1 µM NPY but unaffected in the presence of 1 µM Go6983 or calphostin C (Figure 6C).
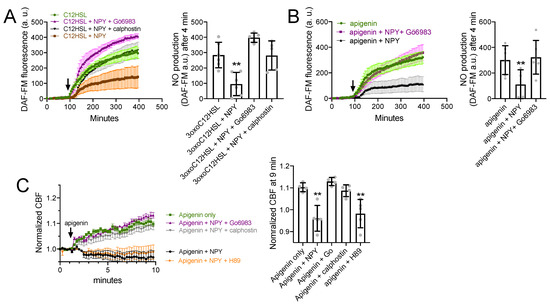
Figure 6.
NPY effects on T2R NO and CBF responses are dependent on PKC. (A) DAF-FM responses (n = 5 experiments per condition, each experiment using an ALI from a different TAS2R38 PAV/PAV patient) showing responses to 100 µM 3oxoC12HSL ± 1 µM NPY ± PKC inhibitors 1 µM Gö6983 or 1 µM calphostin C. Significance in bar graph determined by one-way ANOVA with Dunnett’s posttest comparing all values to 3oxoC12HSL alone (first bar); ** p < 0.01. (B) Experiments as in A but in TAS2R38 PAV/AVI cultures stimulated with apigenin (100 µM) ± 1 µM NPY ± 1 µM Gö6983. Significance in bar graph determined by one-way ANOVA with Dunnett’s posttest comparing all values to apigenin alone (first bar); ** p < 0.01. (C) CBF responses to 100 µM apigenin ± 1 µM NPY ± 1 µM Gö6983, calphostin C, or H89 (PKA inhibitor used as a control). Significance in bar graph determined by one-way ANOVA with Dunnett’s posttest comparing all values to apigenin alone (first bar); ** p < 0.01. All bar graphs are mean ± SD.
4. Discussion
We show an inhibitory effect of NPY on T2R-mediated NO production and CBF responses. This likely occurs through activation of NPY2R receptors and subsequent PKC activation. We previously showed that activation of PKC downstream of fungal aflatoxins can reduce T2R-mediated NO production [78]. We hypothesize this is because of eNOS T495 phosphorylation by PKC, which impairs calcium-bound calmodulin binding to eNOS [94]. NO increases cilia beating and mucociliary clearance through activation of guanylyl cyclase and protein kinase G [89]. Thus, elevated NPY in CRS or asthma may impact cilia function, perhaps contributing to susceptibility to infection by reducing mucociliary clearance. While T2R-induced changes in CBF are somewhat small (10–20%), the relationship between CBF and mucociliary clearance rate (as measured in fluorescent particle transport assays) is not linear. We previously showed that these T2R-induced 10–20% changes in CBF equate to ~50–80% increases in mucociliary transport [22,29]. Thus, the blunting of T2R responses by NPY likely has even greater effects on mucociliary clearance than the changes in CBF observed here.
We observe effects of NPY on T2R-induced NO responses as low as 1 nM. The pKd of recombinant NPY2R vs I125-NPY was reported to be ~10.17 (~0.068 nM) [95] and EC50 of ~0.3 nM in a heterologous expression system [96]. The apparent EC50 for NPY is likely higher than the binding of NPY to its receptor due to downstream nonlinearity. Thus, while many experiments in this study and other studies (e.g., [97,98]) test high saturating concentrations of NPY (e.g., 100 nM–1 µM) to maximally activate receptors, we also see that lower, likely more physiological concentrations are also sufficient to reduce T2R responses. Thus, while in vivo and other further experimentation is needed to understand the potential role of this mechanism in sinonasal disease, our data suggest that the inhibition of T2Rs reported here may be activated by physiologically relevant levels of NPY that activate NPY2R. This is particularly true in cells in the nose in close proximity to NPYergic fibers. Local release of neurotransmitters in the airway could generate high nM to µM concentrations within close proximity to the neuron, albeit likely for short periods of time [99].
Notably, we show that NPY blunts responses to P. aeruginosa 3oxoC12HSL and PQS, detected largely by T2R38 [22] and T2R4 [24], respectively. We also show blunted responses to apigenin, which we previously concluded was mediated by T2R14 [23]. However, apigenin and other types of flavones also activate T2R39 [100,101,102]. The 4′- fluoro-6-methoxyflavanone antagonist used here also blocks T2R39 [91]. We have not detected T2R39 in differentiated nasal cilia [23,24], but it is expressed in bronchial cilia [21]. We thus cannot fully rule out a potential role for T2R39 in the apigenin response. Nonetheless, this does not change any of the conclusions of this paper. NPY still blunts the T2R-mediated response to apigenin, whether through T2R14 alone or a combination of T2R14 and T2R39. We did not test agonists for T2R16, which is also in nasal cilia. As we have shown that all of these T2Rs signal identically [4,24], we believe it is likely that T2R16 responses are likewise reduced by NPY.
Beyond ciliary beating, NO is also important to airway immunity because it directly kills or inactivates pathogens. NO damages the DNA and cell walls of bacteria [103,104,105,106,107]. Replication of many respiratory viruses is also NO sensitive, including influenza, parainfluenza, rhinovirus [108], and SARS-COV1 and 2 [109,110,111,112]. Reduced NO output by the nasal epithelium with NPY elevations may contribute to susceptibility to both bacterial and viral infection. Plant flavonoids such as the flavones apigenin and chrysin are attractive molecules to target nasal T2Rs because they also have intrinsic antibacterial properties [23,113]. However, there ability to activate T2R14 may be limited in patients with elevated NPY levels.
As noted above, NPY may be elevated in asthma, which does carry a greater risk of respiratory infection [114,115,116]. As T2Rs are also expressed in bronchial cilia [21], impairment of T2R function by NPY in asthma may also contribute to innate immune dysfunction in this disease. Future studies of bronchial epithelial cells are needed to clarify the role of NO in the bronchial epithelial T2R CBF response. PKC inhibitors have been suggested as therapeutic modalities for several types of chronic inflammatory diseases [117] and might be useful in chronic inflammatory airway diseases where NPY is elevated.
In mice, NPY may be critical in type 2 inflammatory responses in the airways [118,119,120]. However, while some studies have demonstrated elevated human sinonasal NPY expression in different types of sinonasal diseases [62,63,64,65,121,122], a greater study of changes in NPY levels and localization in the nose in specific CRS patient subsets is needed to better understand whether and how NPY fits into the context of CRS pathophysiology. In particular, future measurement of NPY levels, localization of NPY production, and elucidation of potential changes in normal vs. diseased inflamed sinonasal tissue are all needed. While sensory neurons and macrophages are a potential source of NPY production, other immune cells such as neutrophils or eosinophils might also produce NPY and alter epithelial responses to bitter bacterial or fungal molecules. The T2R-to-eNOS signaling pathway also functions in macrophages, where it regulates phagocytosis [123], and macrophage-produced NPY may feed back onto this pathway in an autocrine signaling loop. An overall better understanding of neuropeptides in both upper and lower airway inflammation is needed to understand whether targeting these pathways can reduce inflammation and/or boost innate immunity.
We previously showed that NPY is a negative regulator of nasal turbinate submucosal gland secretion via the activation of NPY1R receptors [75]. Nasal and bronchial submucosal glands are important for the secretion of not only fluid for airway surface liquid and mucus but also antimicrobial peptides [76,124]. Reducing both glandular antimicrobial peptide secretion and antimicrobial NO production suggests that NPY has multiple negative effects on sinonasal innate immunity. However, future studies are needed to clarify what relevance the in vitro observations here have to in vivo sinonasal pathophysiology. It may be that the function of NPY as a “brake” on ciliated cell NO production and CBF is somehow beneficial. Regardless, the studies here demonstrate that NPY is a potent regulator of epithelial T2R NO, warranting further investigation into the role of NPY in sinonasal innate immunity.
NPYRs can also be activated by pancreatic polypeptide (PP) and peptide YY (PYY). While PYY is generally thought to be only produced by PP cells (also known as gamma or F cells) in pancreatic islets, some PYY is found in gastrointestinal epithelial neurons [60]. To our knowledge, studies of PP and PYY expression in the nasal cavity are extremely limited [125]. Future studies must explore these other NPY family polypeptides. Future studies are also needed to determine whether and how other neuropeptides sch as substance P and VIP may also affect T2R signaling in nasal epithelial ciliated cells.
Author Contributions
R.M.C.: conceptualization, methodology, investigation, data acquisition, formal analysis, and writing; N.D.A. and J.N.P.: resources and critical review; R.J.L.: conceptualization, methodology, investigation, data acquisition, formal analysis, writing, and funding acquisition. All authors have read and agreed to the published version of the manuscript.
Funding
The study was supported by R01DC016309 to R.J.L.
Institutional Review Board Statement
The study was conducted in accordance with code of federal regulation Title 45 CFR 46.116 by the U.S. Department of Health and Human Services and was approved by the University of Pennsylvania Institutional Review Board (protocol #800614).
Informed Consent Statement
Informed consent was obtained from all subjects involved in the study.
Data Availability Statement
All data supporting the results are contained within the article figures. Raw numerical values used to generate the bar graphs or traces are available upon request to corresponding author.
Acknowledgments
We thank M. Victoria (University of Pennsylvania) for technical assistance and support during the study.
Conflicts of Interest
The authors declare no conflict of interest.
References
- Parker, D.; Prince, A. Innate Immunity in the Respiratory Epithelium. Am. J. Respir. Cell Mol. Biol. 2011, 45, 189–201. [Google Scholar] [CrossRef] [Green Version]
- Cohen, N.A. Sinonasal Mucociliary Clearance in Health and Disease. Ann. Otol. Rhinol. Laryngol. 2006, 196, 20–26. [Google Scholar] [CrossRef]
- Waterer, G.W. Airway Defense Mechanisms. Clin. Chest Med. 2012, 33, 199–209. [Google Scholar] [CrossRef]
- Carey, R.M.; Lee, R.J. Taste Receptors in Upper Airway Innate Immunity. Nutrients 2019, 11, 2017. [Google Scholar] [CrossRef] [Green Version]
- Bhattacharyya, N. Incremental Health Care Utilization and Expenditures for Chronic Rhinosinusitis in the United States. Ann. Otol. Rhinol. Laryngol. 2011, 120, 423–427. [Google Scholar] [CrossRef]
- Bhattacharyya, N.; Grebner, J.; Martinson, N.G. Recurrent Acute Rhinosinusitis: Epidemiology and Health Care Cost Burden. Otolaryngol. Head Neck Surg. 2012, 146, 307–312. [Google Scholar] [CrossRef]
- Blackwell, D.L.; Collins, J.G.; Coles, R. Summary Health Statistics for U.S. Adults: National Health Interview Survey, 1997. Vital Health Stat. 2002, 205, 1–109. [Google Scholar]
- Ly, N.; McCaig, L.F. National Hospital Ambulatory Medical Care Survey: 2000 Outpatient Department Summary. Adv. Data Vital Health Stat. 2002, 327, 1–27. [Google Scholar]
- Ray, N.F.; Baraniuk, J.N.; Thamer, M.; Rinehart, C.S.; Gergen, P.J.; Kaliner, M.; Josephs, S.; Pung, Y.H. Healthcare Expenditures for Sinusitis in 1996: Contributions of Asthma, Rhinitis, and Other Airway Disorders. J. Allergy Clin. Immunol. 1999, 103, 408–414. [Google Scholar] [CrossRef]
- Cherry, D.K.; Woodwell, D.A. National Ambulatory Medical Care Survey: 2000 summary. Adv. Data Vital Health Stat. 2002, 328, 1–32. [Google Scholar]
- Fokkens, W.J.; Lund, V.J.; Mullol, J.; Bachert, C.; Alobid, I.; Baroody, F.; Cohen, N.; Cervin, A.; Douglas, R.; Gevaert, P.; et al. European Position Paper on Rhinosinusitis and Nasal Polyps 2012. Rhinol. Suppl. 2012, 23, 3. [Google Scholar]
- Bhattacharyya, N.; Kepnes, L.J. Assessment of Trends in Antimicrobial Resistance in Chronic Rhinosinusitis. Ann. Otol. Rhinol. Laryngol. 2008, 117, 448–452. [Google Scholar] [CrossRef] [PubMed]
- Genoway, K.A.; Philpott, C.M.; Javer, A.R. Pathogen Yield and Antimicrobial Resistance Patterns of Chronic Rhinosinusitis Patients Presenting to a Tertiary Rhinology Centre. J. Otolaryngol. Head Neck Surg. 2011, 40, 232–237. [Google Scholar] [PubMed]
- Kingdom, T.T.; Swain, R.E., Jr. The Microbiology and Antimicrobial Resistance Patterns in Chronic Rhinosinusitis. Am. J. Otolaryngol. 2004, 25, 323–328. [Google Scholar] [CrossRef] [PubMed]
- Casey, G. Antibiotics and the Rise of Superbugs. Kai Tiaki Nurs. N. Z. 2012, 18, 20–24. [Google Scholar]
- Hawser, S. Surveillance Programmes and Antibiotic Resistance: Worldwide and Regional Monitoring of Antibiotic Resistance Trends. Handb. Exp. Pharmacol. 2012, 211, 31–43. [Google Scholar] [CrossRef]
- Foucault, C.; Brouqui, P. How to Fight Antimicrobial Resistance. FEMS Immunol. Med. Microbiol. 2007, 49, 173–183. [Google Scholar] [CrossRef]
- Alanis, A.J. Resistance to Antibiotics: Are We in the Post-Antibiotic Era? Arch. Med. Res. 2005, 36, 697–705. [Google Scholar] [CrossRef]
- Domin, M.A. Highly Virulent Pathogens-A Post Antibiotic Era? Br. J. Theatre Nurs. 1998, 8, 14–18. [Google Scholar] [CrossRef]
- Falagas, M.E.; Bliziotis, I.A. Pandrug-Resistant Gram-Negative Bacteria: The Dawn of the Post-Antibiotic Era? Int. J. Antimicrob. Agents 2007, 29, 630–636. [Google Scholar] [CrossRef]
- Shah, A.S.; Ben-Shahar, Y.; Moninger, T.O.; Kline, J.N.; Welsh, M.J. Motile Cilia of Human Airway Epithelia Are Chemosensory. Science 2009, 325, 1131–1134. [Google Scholar] [CrossRef] [Green Version]
- Lee, R.J.; Xiong, G.; Kofonow, J.M.; Chen, B.; Lysenko, A.; Jiang, P.; Abraham, V.; Doghramji, L.; Adappa, N.D.; Palmer, J.N.; et al. T2R38 Taste Receptor Polymorphisms Underlie Susceptibility to Upper Respiratory Infection. J. Clin. Investig. 2012, 122, 4145–4159. [Google Scholar] [CrossRef] [Green Version]
- Hariri, B.M.; McMahon, D.B.; Chen, B.; Freund, J.R.; Mansfield, C.J.; Doghramji, L.J.; Adappa, N.D.; Palmer, J.N.; Kennedy, D.W.; Reed, D.R.; et al. Flavones Modulate Respiratory Epithelial Innate Immunity: Anti-Inflammatory Effects and Activation of the T2R14 Receptor. J. Biol. Chem. 2017, 292, 8484–8497. [Google Scholar] [CrossRef] [Green Version]
- Freund, J.R.; Mansfield, C.J.; Doghramji, L.J.; Adappa, N.D.; Palmer, J.N.; Kennedy, D.W.; Reed, D.R.; Jiang, P.; Lee, R.J. Activation of Airway Epithelial Bitter Taste Receptors by Pseudomonas aeruginosa Quinolones Modulates Calcium, Cyclic-AMP, and Nitric Oxide Signaling. J. Biol. Chem. 2018, 293, 9824–9840. [Google Scholar] [CrossRef] [Green Version]
- Stout, S.L.; Wyatt, T.A.; Adams, J.J.; Sisson, J.H. Nitric Oxide-Dependent Cilia Regulatory Enzyme Localization in Bovine Bronchial Epithelial Cells. J. Histochem. Cytochem. 2007, 55, 433–442. [Google Scholar] [CrossRef] [Green Version]
- Sisson, J.H.; Pavlik, J.A.; Wyatt, T.A. Alcohol Stimulates Ciliary Motility of Isolated Airway Axonemes through a Nitric Oxide, Cyclase, and Cyclic Nucleotide-Dependent Kinase Mechanism. Alcohol. Clin. Exp. Res. 2009, 33, 610–616. [Google Scholar] [CrossRef] [Green Version]
- Sisson, J.H.; May, K.; Wyatt, T.A. Nitric Oxide-Dependent Ethanol Stimulation of Ciliary Motility Is Linked to cAMP-Dependent Protein Kinase (PKA) Activation in Bovine Bronchial Epithelium. Alcohol. Clin. Exp. Res. 1999, 23, 1528–1533. [Google Scholar] [CrossRef]
- Simet, S.M.; Pavlik, J.A.; Sisson, J.H. Proteomic Analysis of Bovine Axonemes Exposed to Acute Alcohol: Role of Endothelial Nitric Oxide Synthase and Heat Shock Protein 90 in Cilia Stimulation. Alcohol. Clin. Exp. Res. 2013, 37, 609–615. [Google Scholar] [CrossRef] [Green Version]
- Lee, R.J.; Chen, B.; Redding, K.M.; Margolskee, R.F.; Cohen, N.A. Mouse Nasal Epithelial Innate Immune Responses to Pseudomonas aeruginosa Quorum-Sensing Molecules Require Taste Signaling Components. Innate Immun. 2014, 20, 606–617. [Google Scholar] [CrossRef] [Green Version]
- Lee, R.J.; Cohen, N.A. The Emerging Role of the Bitter Taste Receptor T2R38 in Upper Respiratory Infection and Chronic Rhinosinusitis. Am. J. Rhinol. Allergy 2013, 27, 283–286. [Google Scholar] [CrossRef]
- Gaida, M.M.; Dapunt, U.; Hänsch, G.M. Sensing Developing Biofilms: The Bitter Receptor T2R38 on Myeloid Cells. Pathog. Dis. 2016, 74. [Google Scholar] [CrossRef] [Green Version]
- Tran, H.T.T.; Herz, C.; Ruf, P.; Stetter, R.; Lamy, E. Human T2R38 Bitter Taste Receptor Expression in Resting and Activated Lymphocytes. Front. Immunol. 2018, 9. [Google Scholar] [CrossRef]
- Maurer, S.; Wabnitz, G.H.; Kahle, N.A.; Stegmaier, S.; Prior, B.; Giese, T.; Gaida, M.M.; Samstag, Y.; Hänsch, G.M. Tasting Pseudomonas aeruginosa Biofilms: Human Neutrophils Express the Bitter Receptor T2R38 as Sensor for the Quorum Sensing Molecule N-(3-Oxododecanoyl)-l-Homoserine Lactone. Front. Immunol. 2015, 6, 369. [Google Scholar] [CrossRef] [Green Version]
- Sandau, M.M.; Goodman, J.R.; Thomas, A.; Rucker, J.B.; Rawson, N.E. A Functional Comparison of the Domestic Cat Bitter Receptors Tas2r38 and Tas2r43 with Their Human Orthologs. BMC Neurosci. 2015, 16, 33. [Google Scholar] [CrossRef] [Green Version]
- Lossow, K.; Hübner, S.; Roudnitzky, N.; Slack, J.P.; Pollastro, F.; Behrens, M.; Meyerhof, W. Comprehensive Analysis of Mouse Bitter Taste Receptors Reveals Different Molecular Receptive Ranges for Orthologous Receptors in Mice and Humans. J. Biol. Chem. 2016, 291, 15358–15377. [Google Scholar] [CrossRef] [Green Version]
- Freund, J.; Lee, R.J. Taste Receptors in the Upper Airway. World J. Otorhinolaryngol.-Head Neck Surg. 2018, 4, 67–76. [Google Scholar] [CrossRef]
- Carey, R.M.; Workman, A.D.; Yan, C.; Chen, B.; Adappa, N.D.; Palmer, J.N.; Kennedy, D.W.; Lee, R.; Cohen, N.A. Sinonasal T2R-Mediated Nitric Oxide Production in Response to Bacillus Cereus. Am. J. Rhinol. Allergy 2017, 31, 211–215. [Google Scholar] [CrossRef] [Green Version]
- Adappa, N.D.; Truesdale, C.M.; Ba, A.D.W.; Rn, L.D.; Mansfield, C.; Kennedy, D.W.; Palmer, J.N.; Cowart, B.J.; Cohen, N.A. Correlation of T2R38 Taste Phenotype and In Vitro Biofilm Formation from Nonpolypoid Chronic Rhinosinusitis Patients. Int. Forum Allergy Rhinol. 2016, 6, 783–791. [Google Scholar] [CrossRef]
- Rom, D.; Christensen, J.; Alvarado, R.; Sacks, R.; Harvey, R. The Impact of Bitter Taste Receptor Genetics on Culturable Bacteria in Chronic Rhinosinusitis. Rhinol. J. 2017, 55, 90–94. [Google Scholar] [CrossRef]
- Cantone, E.; Negri, R.; Roscetto, E.; Grassia, R.; Catania, M.R.; Capasso, P.; Maffei, M.; Soriano, A.A.; Leone, C.A.; Iengo, M.; et al. In Vivo Biofilm Formation, Gram-Negative Infections and TAS2R38 Polymorphisms in CRSw NP Patients. Laryngoscope 2018, 128, 339–345. [Google Scholar] [CrossRef]
- Adappa, N.D.; Zhang, Z.; Palmer, J.N.; Kennedy, D.W.; Rn, L.D.; Lysenko, A.; Reed, D.; Scott, T.; Zhao, N.; Owens, D.; et al. The Bitter Taste Receptor T2R38 Is an Independent Risk Factor for Chronic Rhinosinusitis Requiring Sinus Surgery. Int. Forum Allergy Rhinol. 2013, 4, 3–7. [Google Scholar] [CrossRef] [PubMed] [Green Version]
- Adappa, N.D.; Bs, T.J.H.; Palmer, J.N.; Kennedy, D.W.; Rn, L.D.; Lysenko, A.; Reed, D.R.; Lee, R.J.; Cohen, N.A. Genetics of the Taste Receptor T2R38 Correlates with Chronic Rhinosinusitis Necessitating Surgical Intervention. Int. Forum Allergy Rhinol. 2013, 3, 184–187. [Google Scholar] [CrossRef] [PubMed]
- Msc, L.M.E.; Filali-Mouhim, A.; Boisvert, P.; Boulet, L.-P.; Bossé, Y.; Desrosiers, M. Genetic Variations in Taste Receptors Are Associated with Chronic Rhinosinusitis: A Replication Study. Int. Forum Allergy Rhinol. 2014, 4, 200–206. [Google Scholar] [CrossRef]
- Dżaman, K.; Zagor, M.; Sarnowska, E.; Krzeski, A.; Kantor, I. The Correlation of TAS2R38 Gene Variants with Higher Risk for Chronic Rhinosinusitis in Polish Patients. Otolaryngol. Polska 2016, 70, 13–18. [Google Scholar] [CrossRef]
- Adappa, N.D.; Ba, D.F.; Palmer, J.N.; Kennedy, D.W.; Rn, L.D.; Bs, S.A.M.; Owens, D.; Bs, C.M.; Lysenko, A.; Lee, R.; et al. TAS2R38genotype Predicts Surgical Outcome in Nonpolypoid Chronic Rhinosinusitis. Int. Forum Allergy Rhinol. 2015, 6, 25–33. [Google Scholar] [CrossRef] [PubMed] [Green Version]
- Wine, J.J. Parasympathetic Control of Airway Submucosal Glands: Central Reflexes and the Airway Intrinsic Nervous System. Auton. Neurosci. 2007, 133, 35–54. [Google Scholar] [CrossRef] [PubMed] [Green Version]
- Lacroix, J.S.; Anggard, A.; Hokfelt, T.; O’Hare, M.M.; Fahrenkrug, J.; Lundberg, J.M. Neuropeptide Y: Presence in Sympathet-Ic and Parasympathetic Innervation of the Nasal Mucosa. Cell Tissue Res. 1990, 259, 119–128. [Google Scholar] [CrossRef]
- Sheppard, M.N.; Polak, J.M.; Allen, J.M.; Bloom, S.R. Neuropeptide Tyrosine (NPY): A Newly Discovered Peptide Is Present in the Mammalian Respiratory Tract. Thorax 1984, 39, 326–330. [Google Scholar] [CrossRef] [PubMed] [Green Version]
- Chanez, P.; Springall, D.; Vignola, A.M.; Moradoghi-Hattvani, A.; Polak, J.M.; Godard, P.; Bousquet, J. Bronchial Mucosal Immunoreactivity of Sensory Neuropeptides in Severe Airway Diseases. Am. J. Respir. Crit. Care Med. 1998, 158, 985–990. [Google Scholar] [CrossRef]
- Tanaka, Y.; Yoshida, Y.; Hirano, M. Precise Localization of VIP-, NPY-, and TH-Immunoreactivities of Cat Laryngeal Glands. Brain Res. Bull. 1995, 36, 219–224. [Google Scholar] [CrossRef]
- Bowden, J.J.; Gibbins, I.L. Vasoactive Intestinal Peptide and Neuropeptide Y Coexist in Non-Noradrenergic Sympathetic Neu-Rons to Guinea Pig Trachea. J. Auton. Nerv. Syst. 1992, 38, 1–19. [Google Scholar] [CrossRef]
- Baraniuk, J.N.; Kaliner, M.A. Neuropeptides and Nasal Secretion. J. Allergy Clin. Immunol. 1990, 86, 620–627. [Google Scholar] [CrossRef]
- Baraniuk, J.N.; Lundgren, J.; Okayama, M.; Mullol, J.; Merida, M.; Shelhamer, J.H.; Kaliner, M.A. Vasoactive Intestinal Peptide in Human Nasal Mucosa. J. Clin. Investig. 1990, 86, 825–831. [Google Scholar] [CrossRef] [PubMed] [Green Version]
- Dey, R.D.; Shannon, W.A., Jr.; Said, S.I. Localization of VIP-Immunoreactive Nerves in Airways and Pulmonary Vessels of Dogs, Cats, and Human Subjects. Cell Tissue Res. 1981, 220, 231–238. [Google Scholar] [CrossRef] [PubMed]
- Mendonca, J.C.; Dolci, J.E. Neuropeptide Immunofluorescence in Human Nasal Mucosa: Assessment of the Technique for Vas-Oactive Intestinal Peptide (VIP). Braz. J. Otorhinolaryngol. 2005, 71, 123–131. [Google Scholar] [CrossRef] [Green Version]
- Uddman, R.; Sundler, F. Neuropeptides in the Airways: A Review. Am. Rev. Respir. Dis. 1987, 136, 3–8. [Google Scholar] [CrossRef]
- Uddman, R.; Alumets, J.; Densert, O.; Hakanson, R.; Sundler, F. Occurrence and Distribution of VIP Nerves in the Nasal Mu-Cosa and Tracheobronchial Wall. Acta Otolaryngol. 1978, 86, 443–448. [Google Scholar] [CrossRef]
- Luts, A.; Uddman, R.; Alm, R.; Basterra, J.; Sundler, F. Peptide-Containing Nerve Fibers in Human Airways: Distribution and Coexistence Pattern. Int. Arch. Allergy Immunol. 1993, 101, 52–60. [Google Scholar] [CrossRef]
- Uddman, R.; Sundler, F.; Emson, P. Occurrence and Distribution of Neuropeptide-Y-Immunoreactive Nerves in the Respiratory Tract and Middle Ear. Cell Tissue Res. 1984, 237, 321–327. [Google Scholar] [CrossRef]
- Groneberg, D.A.; Folkerts, G.; Peiser, C.; Chung, K.F.; Fischer, A. Neuropeptide Y (NPY). Pulm. Pharmacol. Ther. 2004, 17, 173–180. [Google Scholar] [CrossRef]
- Lin, J.K.; Wang, H.-W.; Su, W.Y. Noradrenergic Innervation of Nasal Polyps and Polypoid Mucosae. Auris Nasus Larynx 1996, 23, 121–126. [Google Scholar] [CrossRef]
- Fang, S.-Y.; Shen, C.-L.; Ohyama, M. Presence of Neuropeptides in Human Nasal Polyps. Acta Oto-Laryngol. 1994, 114, 324–328. [Google Scholar] [CrossRef]
- Heppt, W.; Dinh, Q.T.; Cryer, A.; Zweng, M.; Noga, O.; Peiser, C.; Melvan, M.; Witt, C.; Fischer, A.; Groneberg, D.A. Pheno-Typic Alteration of Neuropeptide-Containing Nerve Fibres in Seasonal Intermittent Allergic Rhinitis. Clin. Exp. Allergy 2004, 34, 1105–1110. [Google Scholar] [CrossRef]
- Fischer, A.; Wussow, A.; Cryer, A.; Schmeck, B.; Noga, O.; Zweng, M.; Peiser, C.; Dinh, Q.T.; Heppt, W.; Groneberg, D. Neuronal Plasticity in Persistent Perennial Allergic Rhinitis. J. Occup. Environ. Med. 2005, 47, 20–25. [Google Scholar] [CrossRef]
- Groneberg, D.A.; Heppt, W.; Cryer, A.; Wussow, A.; Peiser, C.; Zweng, M.; Dinh, Q.T.; Witt, C.; Fischer, A. Toxic Rhinitis-Induced Changes of Human Nasal Mucosa Innervation. Toxicol. Pathol. 2003, 31, 326–331. [Google Scholar] [CrossRef] [Green Version]
- Schwarz, H.; Villiger, P.M.; von Kempis, J.; Lotz, M. Neuropeptide Y Is an Inducible Gene in the Human Immune System. J. Neuroimmunol. 1994, 51, 53–61. [Google Scholar] [CrossRef]
- Fujiwara, S.; Hoshizaki, M.; Ichida, Y.; Lex, D.; Kuroda, E.; Ishii, K.J.; Magi, S.; Okada, M.; Takao, H.; Gandou, M.; et al. Pulmonary Phagocyte-Derived NPY Controls the Pathology of Severe Influenza Virus Infection. Nat. Microbiol. 2018, 4, 258–268. [Google Scholar] [CrossRef] [PubMed]
- Singer, K.; Morris, D.; Oatmen, K.E.; Wang, T.; Del Proposto, J.; Mergian, T.; Cho, K.W.; Lumeng, C.N. Neuropeptide Y Is Produced by Adipose Tissue Macrophages and Regulates Obesity-Induced Inflammation. PLoS ONE 2013, 8, e57929. [Google Scholar] [CrossRef]
- Shimizu, M.; Shigeri, Y.; Tatsu, Y.; Yoshikawa, S.; Yumoto, N. Enhancement of Antimicrobial Activity of Neuropeptide Y by N-Terminal Truncation. Antimicrob. Agents Chemother. 1998, 42, 2745–2746. [Google Scholar] [CrossRef] [PubMed] [Green Version]
- Hansen, C.J.; Burnell, K.K.; Brogden, K.A. Antimicrobial Activity of Substance P and Neuropeptide Y against Laboratory Strains of Bacteria and Oral Microorganisms. J. Neuroimmunol. 2006, 177, 215–218. [Google Scholar] [CrossRef] [PubMed]
- Augustyniak, D.; Nowak, J.; Lundy, F.T. Direct and Indirect Antimicrobial Activities of Neuropeptides and their Therapeutic Potential. Curr. Protein Pept. Sci. 2012, 13, 723–738. [Google Scholar] [CrossRef] [Green Version]
- Dimitrijević, M.; Stanojević, S. The Intriguing Mission of Neuropeptide Y in the Immune System. Amino Acids 2011, 45, 41–53. [Google Scholar] [CrossRef]
- Bedoui, S.; von Hörsten, S.; Gebhardt, T. A Role for Neuropeptide Y (NPY) in Phagocytosis: Implications for Innate and Adaptive Immunity. Peptides 2007, 28, 373–376. [Google Scholar] [CrossRef]
- Ahmed, A.A.; Wahbi, A.-H.; Nordlind, K. Neuropeptides Modulate a Murine Monocyte/Macrophage Cell Line Capacity for Phagocytosis and Killing Ofleishmania Majorparasites. Immunopharmacol. Immunotoxicol. 2001, 23, 397–409. [Google Scholar] [CrossRef]
- McMahon, D.B.; Carey, R.M.; Kohanski, M.A.; Tong, C.C.; Papagiannopoulos, P.; Adappa, N.D.; Palmer, J.N.; Lee, R.J. Neuropeptide Regulation of Secretion and Inflammation in Human Airway Gland Serous Cells. Eur. Respir. J. 2020, 55, 1901386. [Google Scholar] [CrossRef]
- Widdicombe, J.H.; Wine, J.J. Airway Gland Structure and Function. Physiol. Rev. 2015, 95, 1241–1319. [Google Scholar] [CrossRef] [Green Version]
- Lee, R.J.; Chen, B.; Doghramji, L.; Adappa, N.D.; Palmer, J.N.; Kennedy, D.W.; Cohen, N.A. Vasoactive Intestinal Peptide Regulates Sinonasal Mucociliary Clearance and Synergizes with Histamine in Stimulating Sinona-Sal Fluid Secretion. FASEB J. 2013, 27, 5094–5103. [Google Scholar] [CrossRef]
- Lee, R.; Workman, A.D.; Carey, R.M.; Chen, B.; Rosen, P.L.; Doghramji, L.; Adappa, N.D.; Palmer, J.N.; Kennedy, D.W.; Cohen, N.A. Fungal Aflatoxins Reduce Respiratory Mucosal Ciliary Function. Sci. Rep. 2016, 6, 33221. [Google Scholar] [CrossRef]
- Wong, L.B.; Park, C.L.; Yeates, D.B. Neuropeptide Y Inhibits Ciliary Beat Frequency in Human Ciliated Cells via nPKC, Independently of PKA. Am. J. Physiol. Content 1998, 275, 440–448. [Google Scholar] [CrossRef] [PubMed]
- Cervin, A.; Lindberg, S.; Mercke, U. The Effect of Neuropeptide Y on Mucociliary Activity in the Rabbit Maxillary Sinus. Acta Oto-Laryngol. 1991, 111, 960–966. [Google Scholar] [CrossRef] [PubMed]
- Cervin, A. Neuropeptide Y 16–36 Inhibits Mucociliary Activity but Does Not Affect Blood Flow in the Rabbit Maxillary Sinus In Vivo. Regul. Pept. 1992, 39, 237–246. [Google Scholar] [CrossRef]
- Lindberg, S.; Hybbinette, J.-C.; Mercke, U. Effects of Neuropeptides on Mucociliary Activity. Ann. Otol. Rhinol. Laryngol. 1986, 95, 94–100. [Google Scholar] [CrossRef]
- Fleming, I.; Fisslthaler, B.; Dimmeler, S.; Kemp, B.E.; Busse, R. Phosphorylation of Thr 495 Regulates Ca2+ /Calmodulin-Dependent Endothelial Nitric Oxide Synthase Activity. Circ. Res. 2001, 88, 68–75. [Google Scholar] [CrossRef] [Green Version]
- Michell, B.J.; Chen, Z.-P.; Tiganis, T.; Stapleton, D.; Katsis, F.; Power, D.A.; Sim, A.T.; Kemp, B.E. Coordinated Control of Endothelial Nitric-oxide Synthase Phosphorylation by Protein Kinase C and the cAMP-dependent Protein Kinase. J. Biol. Chem. 2001, 276, 17625–17628. [Google Scholar] [CrossRef] [PubMed] [Green Version]
- Chen, F.; Kumar, S.; Yu, Y.; Aggarwal, S.; Gross, C.; Wang, Y.; Chakraborty, T.; Verin, A.D.; Catravas, J.D.; Lucas, R.; et al. PKC-Dependent Phosphorylation of eNOS at T495 Regulates eNOS Coupling and Endothelial Barrier Function in Response to G+ -Toxins. PLoS ONE 2014, 9, e99823. [Google Scholar] [CrossRef] [Green Version]
- Carey, R.M.; Freund, J.; Hariri, B.M.; Adappa, N.D.; Palmer, J.N.; Lee, R.J. Polarization of Protease-Activated Receptor 2 (PAR-2) Signaling Is Altered during Airway Epithelial Remodeling and Deciliation. J. Biol. Chem. 2020, 295, 6721–6740. [Google Scholar] [CrossRef] [Green Version]
- McMahon, D.B.; Workman, A.D.; Kohanski, M.A.; Carey, R.M.; Freund, J.R.; Hariri, B.M.; Chen, B.; Doghramji, L.J.; Adappa, N.D.; Palmer, J.N.; et al. Protease-Activated Receptor 2 Activates Airway Apical Membrane Chloride Permeability and Increases Ciliary Beating. FASEB J. 2017, 32, 155–167. [Google Scholar] [CrossRef] [PubMed] [Green Version]
- Schindelin, J.; Arganda-Carreras, I.; Frise, E.; Kaynig, V.; Longair, M.; Pietzsch, T.; Preibisch, S.; Rueden, C.; Saalfeld, S.; Schmid, B.; et al. Fiji: An Open-Source Platform for Biological-Image Analysis. Nat. Chem. Biol. 2012, 9, 676–682. [Google Scholar] [CrossRef] [PubMed] [Green Version]
- Salathe, M. Regulation of Mammalian Ciliary Beating. Annu. Rev. Physiol. 2007, 69, 401–422. [Google Scholar] [CrossRef]
- German, Z.; Chambliss, K.L.; Pace, M.C.; Arnet, U.A.; Lowenstein, C.J.; Shaul, P.W. Molecular Basis of Cell-Specific Endotheli-Al Nitric-Oxide Synthase Expression in Airway Epithelium. J. Biol. Chem. 2000, 275, 8183–8189. [Google Scholar] [CrossRef] [Green Version]
- Roland, W.S.U.; Gouka, R.J.; Gruppen, H.; Driesse, M.; Van Buren, L.; Smit, G.; Vincken, J.-P. 6-Methoxyflavanones as Bitter Taste Receptor Blockers for hTAS2R39. PLoS ONE 2014, 9, e94451. [Google Scholar] [CrossRef]
- Jaggupilli, A.; Singh, N.; De Jesus, V.C.; Duan, K.; Chelikani, P. Characterization of the Binding Sites for Bacterial Acyl Homoserine Lactones (AHLs) on Human Bitter Taste Receptors (T2Rs). ACS Infect. Dis. 2018, 4, 1146–1156. [Google Scholar] [CrossRef]
- Bufe, B.; Breslin, P.A.; Kuhn, C.; Reed, D.R.; Tharp, C.D.; Slack, J.P.; Kim, U.-K.; Drayna, D.; Meyerhof, W.; Bufe, B.; et al. The Molecular Basis of Individual Differences in Phenylthiocarbamide and Propylthiouracil Bitterness Perception. Curr. Biol. 2005, 15, 322–327. [Google Scholar] [CrossRef] [Green Version]
- Förstermann, U.; Sessa, W. Nitric Oxide Synthases: Regulation and Function. Eur. Heart J. 2011, 33, 829–837. [Google Scholar] [CrossRef] [PubMed] [Green Version]
- Gerald, C.; Walker, M.W.; Vaysse, P.J.-J.; He, C.; Branchek, T.A.; Weinshank, R.L. Expression Cloning and Pharmacological Characterization of a Human Hippocampal Neuropeptide Y/Peptide YY Y2 Receptor Subtype. J. Biol. Chem. 1995, 270, 26758–26761. [Google Scholar] [CrossRef] [PubMed] [Green Version]
- Laugwitz, J.M.; Haeri, H.H.; Kaiser, A.; Krug, U.; Hinderberger, D.; Beck-Sickinger, A.G.; Schmidt, P. Probing the Y2 Receptor on Transmembrane, Intra- and Extra-Cellular Sites for EPR Measurements. Molecules 2020, 25, 4143. [Google Scholar] [CrossRef]
- Piccone, M.; Littzi, J.; Krupin, T.; Stone, R.A.; Davis, M.; Wax, M.B. Effects of Neuropeptide Y on the Isolated Rabbit Iris Dilator Muscle. Investig. Ophthalmol. Vis. Sci. 1988, 29, 330–332. [Google Scholar]
- Molosh, A.; Sajdyk, T.J.; Truitt, W.A.; Zhu, W.; Oxford, G.S.; Shekhar, A. NPY Y1 Receptors Differentially Modulate GABAA and NMDA Receptors via Divergent Signal-Transduction Pathways to Reduce Excitability of Amygdala Neurons. Neuropsychopharmacol. 2013, 38, 1352–1364. [Google Scholar] [CrossRef] [PubMed] [Green Version]
- Pack, R.J.; Richardson, P.S.; Smith, I.C.; Webb, S.R. The Functional Significance of the Sympathetic Innervation of Mucous Glands in the Bronchi of Man. J. Physiol. 1988, 403, 211–219. [Google Scholar] [CrossRef]
- Roland, W.S.; Vincken, J.-P.; Gouka, R.J.; Van Buren, L.; Gruppen, H.; Smit, G. Soy Isoflavones and Other Isoflavonoids Activate the Human Bitter Taste Receptors hTAS2R14 and hTAS2R39. J. Agric. Food Chem. 2011, 59, 11764–11771. [Google Scholar] [CrossRef]
- Roland, W.S.U.; Van Buren, L.; Gruppen, H.; Driesse, M.; Gouka, R.J.; Smit, G.; Vincken, J.-P. Bitter Taste Receptor Activation by Flavonoids and Isoflavonoids: Modeled Structural Requirements for Activation of hTAS2R14 and hTAS2R39. J. Agric. Food Chem. 2013, 61, 10454–10466. [Google Scholar] [CrossRef]
- Meyerhof, W.; Batram, C.; Kuhn, C.; Brockhoff, A.; Chudoba, E.; Bufe, B.; Appendino, G.B.; Behrens, M. The Molecular Receptive Ranges of Human TAS2R Bitter Taste Receptors. Chem. Senses 2009, 35, 157–170. [Google Scholar] [CrossRef]
- Ba, A.D.W.; Carey, R.M.; Kohanski, M.A.; Kennedy, D.W.; Palmer, J.N.; Adappa, N.D.; Cohen, N.A. Relative Susceptibility of Airway Organisms to Antimicrobial Effects of Nitric Oxide. Int. Forum Allergy Rhinol. 2017, 7, 770–776. [Google Scholar] [CrossRef]
- Yu, K.; Mitchell, C.; Xing, Y.; Magliozzo, R.; Bloom, B.; Chan, J. Toxicity of Nitrogen Oxides and Related Oxidants on Mycobacteria: M. tuberculosis is Resistant to Peroxynitrite Anion. Tuber. Lung Dis. 1999, 79, 191–198. [Google Scholar] [CrossRef]
- Marcinkiewicz, J. Nitric Oxide and Antimicrobial Activity of Reactive Oxygen Intermediates. Immunopharmacology 1997, 37, 35–41. [Google Scholar] [CrossRef]
- Fang, F.C. Perspectives Series: Host/Pathogen Interactions. Mechanisms of Nitric Oxide-Related Antimicrobial Activity. J. Clin. Investig. 1997, 99, 2818–2825. [Google Scholar] [CrossRef] [PubMed] [Green Version]
- Wiegand, S.B.; Traeger, L.; Nguyen, H.K.; Rouillard, K.R.; Fischbach, A.; Zadek, F.; Ichinose, F.; Schoenfisch, M.H.; Carroll, R.W.; Bloch, D.B.; et al. Antimicrobial Effects of Nitric Oxide in Murine Models of Klebsiella Pneumonia. Redox Biol. 2020, 39, 101826. [Google Scholar] [CrossRef] [PubMed]
- Wink, D.A.; Hines, H.B.; Cheng, R.; Switzer, C.H.; Flores-Santana, W.; Vitek, M.P.; Ridnour, L.A.; Colton, C.A. Nitric Oxide and Redox Mechanisms in the Immune Response. J. Leukoc. Biol. 2011, 89, 873–891. [Google Scholar] [CrossRef] [PubMed] [Green Version]
- Åkerström, S.; Mousavi-Jazi, M.; Klingström, J.; Leijon, M.; Lundkvist, A.; Mirazimi, A. Nitric Oxide Inhibits the Replication Cycle of Severe Acute Respiratory Syndrome Coronavirus. J. Virol. 2005, 79, 1966–1969. [Google Scholar] [CrossRef] [Green Version]
- Åkerström, S.; Gunalan, V.; Keng, C.T.; Tan, Y.-J.; Mirazimi, A. Dual Effect of Nitric Oxide on SARS-CoV Replication: Viral RNA Production and Palmitoylation of the S Protein Are Affected. Virology 2009, 395, 1–9. [Google Scholar] [CrossRef] [Green Version]
- Akaberi, D.; Krambrich, J.; Ling, J.; Luni, C.; Hedenstierna, G.; Järhult, J.D.; Lennerstrand, J.; Lundkvist, A. Mitigation of the Replication of SARS-CoV-2 by Nitric Oxide In Vitro. Redox Biol. 2020, 37, 101734. [Google Scholar] [CrossRef] [PubMed]
- Hedenstierna, G.; Chen, L.; Hedenstierna, M.; Lieberman, R.; Fine, D.H. Nitric Oxide Dosed in Short Bursts at High Concentrations May Protect against COVID 19. Nitric Oxide 2020, 103, 1–3. [Google Scholar] [CrossRef]
- Hariri, B.M.; Payne, S.J.; Chen, B.; Mansfield, C.; Doghramji, L.J.; Adappa, N.D.; Palmer, J.N.; Kennedy, D.W.; Niv, M.Y.; Lee, R.J. In vitro Effects of Anthocyanidins on Sinonasal Epithelial Nitric Oxide Production and Bacterial Physiology. Am. J. Rhinol. Allergy 2016, 30, 261–268. [Google Scholar] [CrossRef] [PubMed] [Green Version]
- Earl, C.S.; An, S.-Q.; Ryan, R.P. The Changing Face of Asthma and Its Relation with Microbes. Trends Microbiol. 2015, 23, 408–418. [Google Scholar] [CrossRef] [Green Version]
- Busse, W.W.; Lemanske, R.F.; Gern, J.E. Role of Viral Respiratory Infections in Asthma and Asthma Exacerbations. Lancet 2010, 376, 826–834. [Google Scholar] [CrossRef]
- Busse, W.W.; Gern, J.E. Asthma and Infections: Is the Risk More Profound Than Previously Thought? J. Allergy Clin. Immunol. 2014, 134, 260–261. [Google Scholar] [CrossRef]
- Leppänen, T.; Tuominen, R.K.; Moilanen, E. Protein Kinase C and its Inhibitors in the Regulation of Inflammation: Inducible Nitric Oxide Synthase as an Example. Basic Clin. Pharmacol. Toxicol. 2013, 114, 37–43. [Google Scholar] [CrossRef]
- Oda, N.; Miyahara, N.; Taniguchi, A.; Morichika, D.; Senoo, S.; Fujii, U.; Itano, J.; Gion, Y.; Kiura, K.; Kanehiro, A.; et al. Requirement for Neuropeptide Y in the Development of Type 2 Responses and Allergen-Induced Airway Hyperresponsiveness and Inflammation. Am. J. Physiol. Cell. Mol. Physiol. 2019, 316, 407–417. [Google Scholar] [CrossRef] [PubMed] [Green Version]
- Makinde, T.O.; Steininger, R.; Agrawal, D.K. NPY and NPY Receptors in Airway Structural and Inflammatory Cells in Allergic Asthma. Exp. Mol. Pathol. 2012, 94, 45–50. [Google Scholar] [CrossRef] [Green Version]
- Lu, Y.; Ho, R.C.-M. An Association between Neuropeptide Y Levels and Leukocyte Subsets in Stress-Exacerbated Asthmatic Mice. Neuropeptides 2015, 57, 53–58. [Google Scholar] [CrossRef] [PubMed]
- Heppt, W.; Peiser, C.; Cryer, A.; Dinh, Q.T.; Zweng, M.; Witt, C.; Fischer, A.; Groneberg, D.A. Innervation of Human Nasal Mucosa in Environmentally Triggered Hyperreflectoric Rhinitis. J. Occup. Environ. Med. 2002, 44, 924–929. [Google Scholar] [CrossRef]
- Fang, S.Y.; Shen, C.L. Neuropeptidergic Innervation of Human Nasal Mucosa in Various Pathological Conditions. Proc. Natl. Sci. Counc. Repub. China Part B Life Sci. 1997, 21, 8–12. [Google Scholar]
- Gopallawa, I.; Freund, J.; Lee, R.J. Bitter Taste Receptors Stimulate Phagocytosis in Human Macrophages through Calcium, Nitric Oxide, and Cyclic-GMP Signaling. Experientia 2020, 78, 271–286. [Google Scholar] [CrossRef] [PubMed]
- Lee, R.J.; Foskett, J.K. Ca2+ Signaling and Fluid Secretion by Secretory Cells of the Airway Epithelium. Cell Calcium 2014, 55, 325–336. [Google Scholar] [CrossRef] [PubMed]
- Uddman, R.; Håkanson, R.; Sundler, F. Immunoreactive Avian Pancreatic Polypeptide Occurs in Nerves of the Mammalian Nasal Mucosa and Eustachian Tube. ORL 1980, 42, 242–248. [Google Scholar] [CrossRef] [PubMed]
Publisher’s Note: MDPI stays neutral with regard to jurisdictional claims in published maps and institutional affiliations. |
© 2021 by the authors. Licensee MDPI, Basel, Switzerland. This article is an open access article distributed under the terms and conditions of the Creative Commons Attribution (CC BY) license (https://creativecommons.org/licenses/by/4.0/).