Dietary Patterns, Blood Pressure and the Glycemic and Lipidemic Profile of Two Teenage, European Populations

 , and
, and
Abstract
1. Introduction
2. Materials and Methods
2.1. The TEENAGE Study Cohort
2.2. The STANISLAS Family Study Cohort
2.3. Statistical Analysis
3. Results
3.1. Descriptive Characteristics
3.2. Extraction of Dietary Patterns
3.3. Multiple Linear Regressions in the TEENAGE Study
3.4. Linear Mixed Models in the STANISLAS Family Study
4. Discussion
5. Conclusions
Author Contributions
Funding
Institutional Review Board Statement
Informed Consent Statement
Data Availability Statement
Acknowledgments
Conflicts of Interest
References
- American Heart Association; Gidding, S.S.; Dennison, B.A.; Birch, L.L.; Daniels, S.R.; Gilman, M.W.; Lichtenstein, A.H.; Rattay, S.R.; Steinberg, J.; Stettler, N.; et al. Dietary Recommendations for Children and Adolescents: A Guide for Practitioners. Pediatrics 2006, 117, 544–559. [Google Scholar] [CrossRef]
- World Health Organization. Guideline: Implementing Effective Actions for Improving Adolescent Nutrition. 2018. Available online: https://apps.who.int/iris/bitstream/handle/10665/260297/9789241513708-eng.pdf?sequence=1 (accessed on 22 December 2020).
- National Heath System. Healthy Eating for Teens-Eat Well. 2018. Available online: https://www.nhs.uk/live-well/eat-well/healthy-eating-for-teens/ (accessed on 22 December 2020).
- British Nutrition Foundation Teenagers. 2018. Available online: https://www.nutrition.org.uk/healthyliving/lifestages/teenagers.html?start=2 (accessed on 22 December 2020).
- DiGirolamo, A.M.; Ochaeta, L.; Mejia Flores, R.M. Early Childhood Nutrition and Cognitive Functioning in Childhood and Adolescence. Food Nutr. Bull. 2020, 41, S31–S40. [Google Scholar] [CrossRef]
- Cohen, J.F.W.; Gorski, M.T.; Gruber, S.A.; Kurdziel, L.B.F.; Rimm, E.B. The effect of healthy dietary consumption on executive cognitive functioning in children and adolescents: A systematic review. Br. J. Nutr. 2016, 116, 989–1000. [Google Scholar] [CrossRef]
- Nyaradi, A.; Foster, J.K.; Hickling, S.; Li, J.; Ambrosini, G.L.; Jacques, A.; Oddy, W.H. Prospective associations between dietary patterns and cognitive performance during adolescence. J. Child. Psychol. Psychiatry 2014, 55, 1017–1024. [Google Scholar] [CrossRef]
- O’Neil, A.; Quirk, S.E.; Housden, S.; Brennan, S.L.; Williams, L.J.; Pasco, J.A.; Berk, M.; Jacka, F.N. Relationship between diet and mental health in children and adolescents: A systematic review. Am. J. Public Health 2014, 104, e31–e42. [Google Scholar] [CrossRef]
- World Health Organization. Adolescent Obesity and Related Behaviours: Trends and Inequalities in the WHO European Region, 2002–2014. 2017. Available online: http://www.euro.who.int/__data/assets/pdf_file/0019/339211/WHO_ObesityReport_2017_v3.pdf (accessed on 1 November 2020).
- World Health Organization. Adolescents’ Dietary Habits. 2016. Available online: https://www.euro.who.int/__data/assets/pdf_file/0006/303477/HBSCNo.7_factsheet_Diet.pdf%3Fua%3D1 (accessed on 7 November 2020).
- World Health Organization. United Nations Agency Briefs: Responding to the Challenge of Non-communicable Diseases. 2019. Available online: https://apps.who.int/iris/bitstream/handle/10665/327396/WHO-UNIATF-19.98-eng.pdf?ua=1 (accessed on 24 December 2020).
- Suchindran, C.; North, K.E.; Popkin, B.M.; Gordon-Larsen, P. The association of adolescent obesity with risk of severe obesity in adulthood. JAMA 2010, 304, 2042–2047. [Google Scholar] [CrossRef]
- Biro, F.M.; Wien, M. Childhood obesity and adult morbidities. Am. J. Clin. Nutr. 2010, 91, 1499S–1505S. [Google Scholar] [CrossRef]
- Engeland, A.; Bjørge, T.; Tverdal, A.; Søgaard, A.J. Obesity in adolescence and adulthood and the risk of adult mortality. Epidemiology 2004, 15, 79–85. [Google Scholar] [CrossRef] [PubMed]
- Mirmiran, P.; Ziadlou, M.; Karimi, S.; Hosseini-Esfahani, F.; Azizi, F. The association of dietary patterns and adherence to WHO healthy diet with metabolic syndrome in children and adolescents: Tehran lipid and glucose study. BMC Public Health 2019, 19, 1457. [Google Scholar] [CrossRef] [PubMed]
- Pulgaron, E.R.; Delamater, A.M. Oesity and type 2 diabetes in children: Epidemiology and treatment. Curr. Diab. Rep. 2014, 14, 508. [Google Scholar] [CrossRef] [PubMed]
- Barr, M.M.; Aslibekyan, S.; Ashraf, A.P. Glycemic control and lipid outcomes in children and adolescents with type 2 diabetes. PLoS ONE 2019, 14, e0219144. [Google Scholar] [CrossRef] [PubMed]
- Lampropoulou, M.; Chaini, M.; Rigopoulos, N.; Evangeliou, A.; Papadopoulou-Legbelou, K.; Koutelidakis, A.E. Association between serum lipid levels in Greek children with dyslipidemia and mediterranean diet adherence, dietary habits, lifestyle and family socioeconomic factors. Nutrients 2020, 12, 1600. [Google Scholar] [CrossRef]
- Ferreira de Moraes, A.C.; Lacerda, M.B.; Moreno, L.A.; Horta, B.L.; Carvalho, H.B. Prevalence of high blood pressure in 122,053 adolescents: A systematic review and meta-regression. Medicine 2014, 93, e232. [Google Scholar] [CrossRef] [PubMed]
- Ntalla, I.; Giannakopoulou, M.; Vlachou, P.; Giannitsopoulou, K.; Gkesou, V.; Makridi, C.; Marougka, M.; Mikou, G.; Ntaoutidou, K.; Proutzou, E.; et al. Body composition and eating behaviours in relation to dieting involvement in a sample of urban Greek adolescents from the TEENAGE (TEENs of Attica: Genes & Environment) study. Public Health Nutr. 2014, 17, 561–568. [Google Scholar] [CrossRef] [PubMed]
- Ntalla, I.; Panoutsopoulou, K.; Vlachou, P.; Southam, L.; Rayner, N.W.; Zeggini, E.; Dedoussis, G.V. Replication of established common genetic variants for adult BMI and childhood obesity in Greek Adolescents: The TEENAGE Study. Ann. Hum. Genet. 2013, 77, 268–274. [Google Scholar] [CrossRef] [PubMed]
- World Medical Association. World Medical Association Declaration of Helsinki. Ethical principles for medical research involving human subjects. Bull. World Health Organ. 2001, 79, 373–374. Available online: https://apps.who.int/iris/bitstream/handle/10665/268312/PMC2566407.pdf?sequence=1&isAllowed=y (accessed on 22 December 2020).
- Nutritionist Pro Software. Available online: https://www.nutritionistpro.com/ (accessed on 23 December 2020).
- Schofield, W.N. Predicting basal metabolic rate, new standards and review of previous work. Hum. Nutr. Clin. Nutr. 1985, 39, 5–41. [Google Scholar]
- Food and Agriculture Organization of the United Nations; World Health Organization; United Nations. University Human Energy Requirements: Report of a Joint FAO/WHO/UNU Expert Consultation; FAO: Rome, Italy, 2004. [Google Scholar]
- Goldberg, G.R.; Black, A.E.; Jebb, S.A.; Murgatroyd, P.R.; Cpward, W.A.; Prentice, A.M. Critical evaluation of energy intake data using fundamental principles of energy physiology: 1. Derivation of cut-off limits to identify under-recording. Eur. J. Clin. Nutr. 1991, 45, 569–581. [Google Scholar]
- Sichert-Hellert, W.; Kersting, M.; Schoch, G. Underreporting of energy intake in 1 to 18 year old German children and adolescents. Z. Ernahr. 1998, 37, 242–251. [Google Scholar] [CrossRef]
- Siest, G.; Visvikis, S.; Herbeth, B.; Gueguen, R.; Vincent-Viry, M.; Sass, C.; Beaud, B.; Lecomte, E.; Steinmetz, J.; Locuty, J.; et al. Objectives, Design and Recruitment of a Familial and Longitudinal Cohort for Studying Gene-Environment Interactions in the Field of Cardiovascular Risk: The Stanislas Cohort. Clin. Chem. Lab. Med. 1998, 36, 35–42. [Google Scholar] [CrossRef]
- Billon, S.; Lluch, A.; Gueguen, R.; Berthier, A.M.; Siest, G.; Herbeth, B. Family resemblance in breakfast energy intake: The Stanislas Family Study. Eur. J. Clin. Nutr. 2002, 56, 1011–1019. [Google Scholar] [CrossRef][Green Version]
- Visvikis-Siest, S.; Siest, G. The STANISLAS Cohort: A 10-year follow-up of supposed healthy families. Gene-environment interactions, reference values and evaluation of biomarkers in prevention of cardiovascular diseases. Clin. Chem. Lab. Med. 2008, 46, 733–747. [Google Scholar] [CrossRef] [PubMed]
- Musse, N.; Michaud, C.; Musse, J.P.; Nicolas, J.P. Gestion informatisee de l’enquete alimentaire. In Proceedings of the XIIeme Congres International de Medecine Sociale, Montreal, QC, Canada, 1989; p. 53. [Google Scholar]
- Krishnaveni, R.; Gowda, V.M.N. Assessing the validity of Friedewald’s formula and Anandraja’s formula for serum LDL–cholesterol calculation. J. Clin. Diagn. Res. 2015, 9, BC01–BC04. [Google Scholar] [CrossRef] [PubMed]
- IBM Support. SPSS Statistics 23.0 Now Available for Download. www.Ibm.com. Available online: https://www.ibm.com/support/pages/spss-statistics-230-now-available-download (accessed on 23 November 2020).
- Jolliffe, I.T.; Cadima, J. Principal component analysis: A review and recent developments. Philos. Trans. A Math. Phys. Eng. Sci. 2016, 374, 20150202. [Google Scholar] [CrossRef] [PubMed]
- Schwedhelm, C.; Iqbal, K.; Knuppel, S.; Schwingshackl, L.; Boeing, H. Contribution to the understanding of how principal component analysis-derived dietary patterns emerge from habitual data on food consumption. Am. J. Clin. Nutr. 2018, 107, 227–235. [Google Scholar] [CrossRef]
- Smith, A.D.A.C.; Emmett, P.M.; Newby, P.; Northstone, K. Dietary patterns obtained through principal components analysis: The effect of input variable quantification. Br. J. Nutr. 2013, 109, 1881–1891. [Google Scholar] [CrossRef]
- Knafl, G.J.; Dixon, J.K.; O’Malley, J.P.; Grey, M.; Deatrick, J.A.; Gallo, A.M.; Knafl, K.A. Analysis of cross-sectional univariate measurements for family dyads using linear mixed modeling. J. Fam. Nurs. 2009, 15, 130–151. [Google Scholar] [CrossRef]
- Van Dongen, H.P.A.; Olofsen, E.; Dinges, D.F.; Maislin, G. Mixed-model regression analysis and dealing with interindividual differences. Methods Enzymol. 2004, 384, 139–171. [Google Scholar] [CrossRef]
- European Food Safety Authority (EFSA); EFSA Panel on Dietetic Products; Nutrition and Allergies (NDA). Scientific Opinion on Dietary Reference Values for energy. EFSA J. 2013, 11, 3005. [Google Scholar] [CrossRef]
- Cordain, L.; Eaton, S.B.; Sebastian, A.; Mann, N.; Lindeberg, S.; Watkins, B.A.; O’Keefe, J.H.; Brand-Miller, J. Origins and evolution of the Western diet: Health implications for the 21st century. Am. J. Clin. Nutr. 2005, 81, 341–354. [Google Scholar] [CrossRef]
- Bellisle, F.; Hebel, P.; Salmon-Legagneur, A.; Vieux, F. Breakfast consumption in french children, adolescents, and adults: A nationally representative cross-sectional survey examined in the context of the international Breakfast Research Initiative. Nutrients 2018, 10, 1056. [Google Scholar] [CrossRef] [PubMed]
- Manzel, A.; Muller, D.N.; Hafler, D.A.; Erdman, S.E.; Linker, R.A.; Kleinewietfeld, M. Role of “Western Diet” in Inflammatory Autoimmune Diseases. Curr. Allergy Asthma Rep. 2014, 14, 404. [Google Scholar] [CrossRef] [PubMed]
- Saneei, P.; Hashemipour, M.; Kelishadi, R.; Esmaillzadeh, A. The dietary approaches to stop hypertension (DASH) diet affects inflammation in childhood metabolic syndrome: A randomized cross-over clinical trial. Ann. Nutr. Metab. 2014, 64, 20–27. [Google Scholar] [CrossRef] [PubMed]
- Chiavaroli, L.; Viguiliouk, E.; Nish, S.K.; Blanco Mejia, S.; Rahelic, D.; Kahleova, H.; Salas-Salvado, J.; Kendall, C.W.C.; Sievenpiper, J.L. DASH dietary pattern and cardiometabolic outcomes: An umbrella review of systematic reviews and meta-analyses. Nutrients 2019, 11, 338. [Google Scholar] [CrossRef]
- Mazidi, M.; Kengne, A.P.; Mikhailidis, D.P.; Cicero, A.; Banach, M. Effects of selected dietary constituents on high-sensitivity C-reactive protein levels in U.S. adults. Ann. Med. 2018, 50, 1–6. [Google Scholar] [CrossRef]
- O’Connor, L.; Imamura, F.; Brage, S.; Griffin, S.J.; Wareham, N.J.; Forouhi, N.G. Intakes and sources of dietary sugars and their association with metabolic and inflammatory markers. Clin. Nutr. 2018, 37, 1313–1322. [Google Scholar] [CrossRef]
- Lazarou, C.; Philippou, E. C-reactiive protein and diet quality in Children. In Diet Quality: An Evidence-Based Approach; Preedy, V.R., Hunter, L.A., Patel, V.B., Eds.; Humana Press: London, UK, 2013; pp. 75–100. [Google Scholar]
- Karampola, M.; Argiriou, A.; Hitoglou-Makedou, A. Study on dietary constituents, hs-CRP serum levels and investigation of correlation between them in excess weight adolescents. Hippokratia 2019, 23, 3–8. [Google Scholar]
- Qureshi, M.M.; Singer, M.R.; Moore, L.L. A cross-sectional study of food group intake and C-reactive protein among children. Nutr. Meta (Lond.) 2009, 6, 40. [Google Scholar] [CrossRef]
- Gutiérrez-Pliego, L.E.; Camarillo-Romero, E.S.; Montenegro-Morales, L.P.; Garduño-García, J.D.J. Dietary patterns associated with body mass index (BMI) and lifestyle in Mexican adolescents. BMC Public Health 2016, 16, 850. [Google Scholar] [CrossRef]
- Santos, N.H.; Fiaccone, R.L.; Barreto, M.L.; Silva, L.A.D.; Silva, R.D.C.R. Association between eating patterns and body mass index in a sample of children and adolescents in Northeastern Brazil. Cad. Saúde Pública 2014, 30, 2235–2245. [Google Scholar] [CrossRef]
- Ambrosini, G.L.; Huang, R.C.; Mori, T.A.; Hands, B.P.; O’Sullivan, T.A.; de Klerk, N.; Beilin, L.J.; Oddy, W.H. Dietary patterns and markers for the metabolic syndrome in Australian adolescents. Nutr. Metab. Cardiovasc. Dis. 2010, 20, 274–283. [Google Scholar] [CrossRef] [PubMed]
- Rocha, N.P.; Cupertino, L.M.; Longo, G.Z.; Ribeiro, A.Q.; Novaes, J.F. Association between dietary pattern and cardiometabolic risk in children and adolescents: A systematic review. J. Pediatr. 2017, 93, 214–222. [Google Scholar] [CrossRef] [PubMed]
- Joung, H.; Hong, S.; Song, Y.; Ahn, B.C.; Park, M.J. Dietary patterns and metabolic syndrome risk factors among adolescents. Korean J. Pediatr. 2012, 55, 128–135. [Google Scholar] [CrossRef] [PubMed]
- National Heart, Lung, and Blood Institute. DASH Eating Plan. 2009. Available online: http://www.nhlbi.nih.gov/health/resources/heart/hbp-dash-introduction-html (accessed on 22 December 2020).
- Castro-Barquero, S.; Ruiz-León, A.M.; Pérez-Sierra, M.; Estruch, R.; Casas, R. Dietary strategies for metabolic syndrome: A comprehensive review. Nutrients 2020, 12, 2983. [Google Scholar] [CrossRef] [PubMed]
- Barnes, T.L.; Crandell, J.L.; Bell, R.A.; Mayer-Davis, E.J.; Dabelea, D.; Liese, A.D. Change in DASH diet score and cardiovascular risk factors in youth with type 1 and type 2 diabetes mellitus: The SEARCH for Diabetes in Youth Study. Nutr. Diabetes 2013, 3, e91. [Google Scholar] [CrossRef] [PubMed]
- Rahimi, H.; Yuzbashian, E.; Zareie, R.; Asghari, G.; Djazayery, A.; Movahedi, A.; Mirmiran, P. Dietary approaches to stop hypertension (DASH) score and obesity phenotypes in children and adolescents. Nutr. J. 2020, 19, 112. [Google Scholar] [CrossRef] [PubMed]
- Wells, J.; Swaminathan, A.; Paseka, J.; Hanson, C. Efficacy and safety of a ketogenic diet in children and adolescents with refractory epilepsy—A review. Nutrients 2020, 12, 1809. [Google Scholar] [CrossRef] [PubMed]
- Payne, N.E.; Cross, H.; Sander, J.W.; Sisodiya, S.M. The ketogenic and related diets in adolescents and adults—A review. Epilepsia 2011, 52, 1941–1948. [Google Scholar] [CrossRef]
- Partsalaki, I.; Karvela, A.; Spiliotis, B.E. Metabolic impact of a ketogenic diet compared to a hypocaloric diet in obese children and adolescents. J. Pediatr. Endocr. Met. 2012, 25, 697–704. [Google Scholar] [CrossRef]
- González-Gil, E.M.; Martínez-Olivan, B.; Widhalm, K.; Lambrinou, C.P.; De Henauw, S.; Gottrand, F.; Kafatos, A.; Beghin, L.; Molnar, D.; Kersting, M.; et al. Healthy eating determinants and dietary patterns in European adolescents: The HELENA study. Child Adolesc. Obes. 2019, 2, 18–39. [Google Scholar] [CrossRef]
- McNaughton, S.A.; Ball, K.; Mishra, G.D.; Crawford, D.A. Dietary patterns of adolescents and risk of obesity and hypertension. J. Nutr. 2008, 138, 364–370. [Google Scholar] [CrossRef] [PubMed]
- Hebestreit, A.; Intemann, T.; Siani, A.; De Henauw, S.; Eibenm, G.; Kourides, Y.; Kovacs, E.; Moreno, L.A.; Veidebaum, T. Dietary patterns of european children and their parents in association with family food environment: Results from the I. family study. Nutrients 2017, 9, 126. [Google Scholar] [CrossRef] [PubMed]
- Moreno, L.A.; Rodriguez, G.; Fieta, J.; Bueno-Lozano, M.; Lázaro, A.; Bueno, G. critical reviews in food science and nutrition. Crit. Rev. Food. Sci. Nutr. 2010, 50, 106–112. [Google Scholar] [CrossRef] [PubMed]
- Richter, A.; Heidemann, C.; Schulze, M.B.; Roosen, J.; Thiele, S.; Mensink, G.B.M. Dietary patterns of adolescents in Germany—Associations with nutrient intake and other health related lifestyle characteristics. BMC Pediatr. 2012, 12, 35. [Google Scholar] [CrossRef]
- Ntalla, I.; Yannaoulia, M.; Dedoussis, G.V. An overweight preventive score associates with obesity and glycemic traits. Metabolism 2016, 65, 81–88. [Google Scholar] [CrossRef]


| TEENAGE Study | |||||||
|---|---|---|---|---|---|---|---|
| All | Boys | Girls | p-Value * | ||||
| n | Median (IQR) | n | Median (IQR) | n | Median (IQR) | ||
| Age (years) | 766 | 13.30 (1.31) | 349 | 13.36 (1.38) | 417 | 13.26 (1.25) | <0.001 |
| Weight (kg) | 766 | 55.00 (14.00) | 349 | 56.00 (16.00) | 417 | 54.00 (13.00) | 0.001 |
| Body Mass Index (BMI) (kg/m2) | 766 | 20.88 (4.38) | 349 | 20.85 (4.45) | 417 | 20.93 (4.37) | 0.517 |
| Waist-to-hip ratio (WHR) | 763 | 0.76 (0) | 349 | 0.79 (0) | 414 | 0.73 (0) | <0001 |
| Systolic Blood Pressure (SBP) (mmHg) | 743 | 119.00 (16) | 335 | 120.67 (11.93) ** | 408 | 118.00 (15) | 0.001 |
| Diastolic Blood Pressure (DBP) (mmHg) | 743 | 70.00 (12) | 335 | 71.00 (12) | 408 | 70.00 (12) | 0.825 |
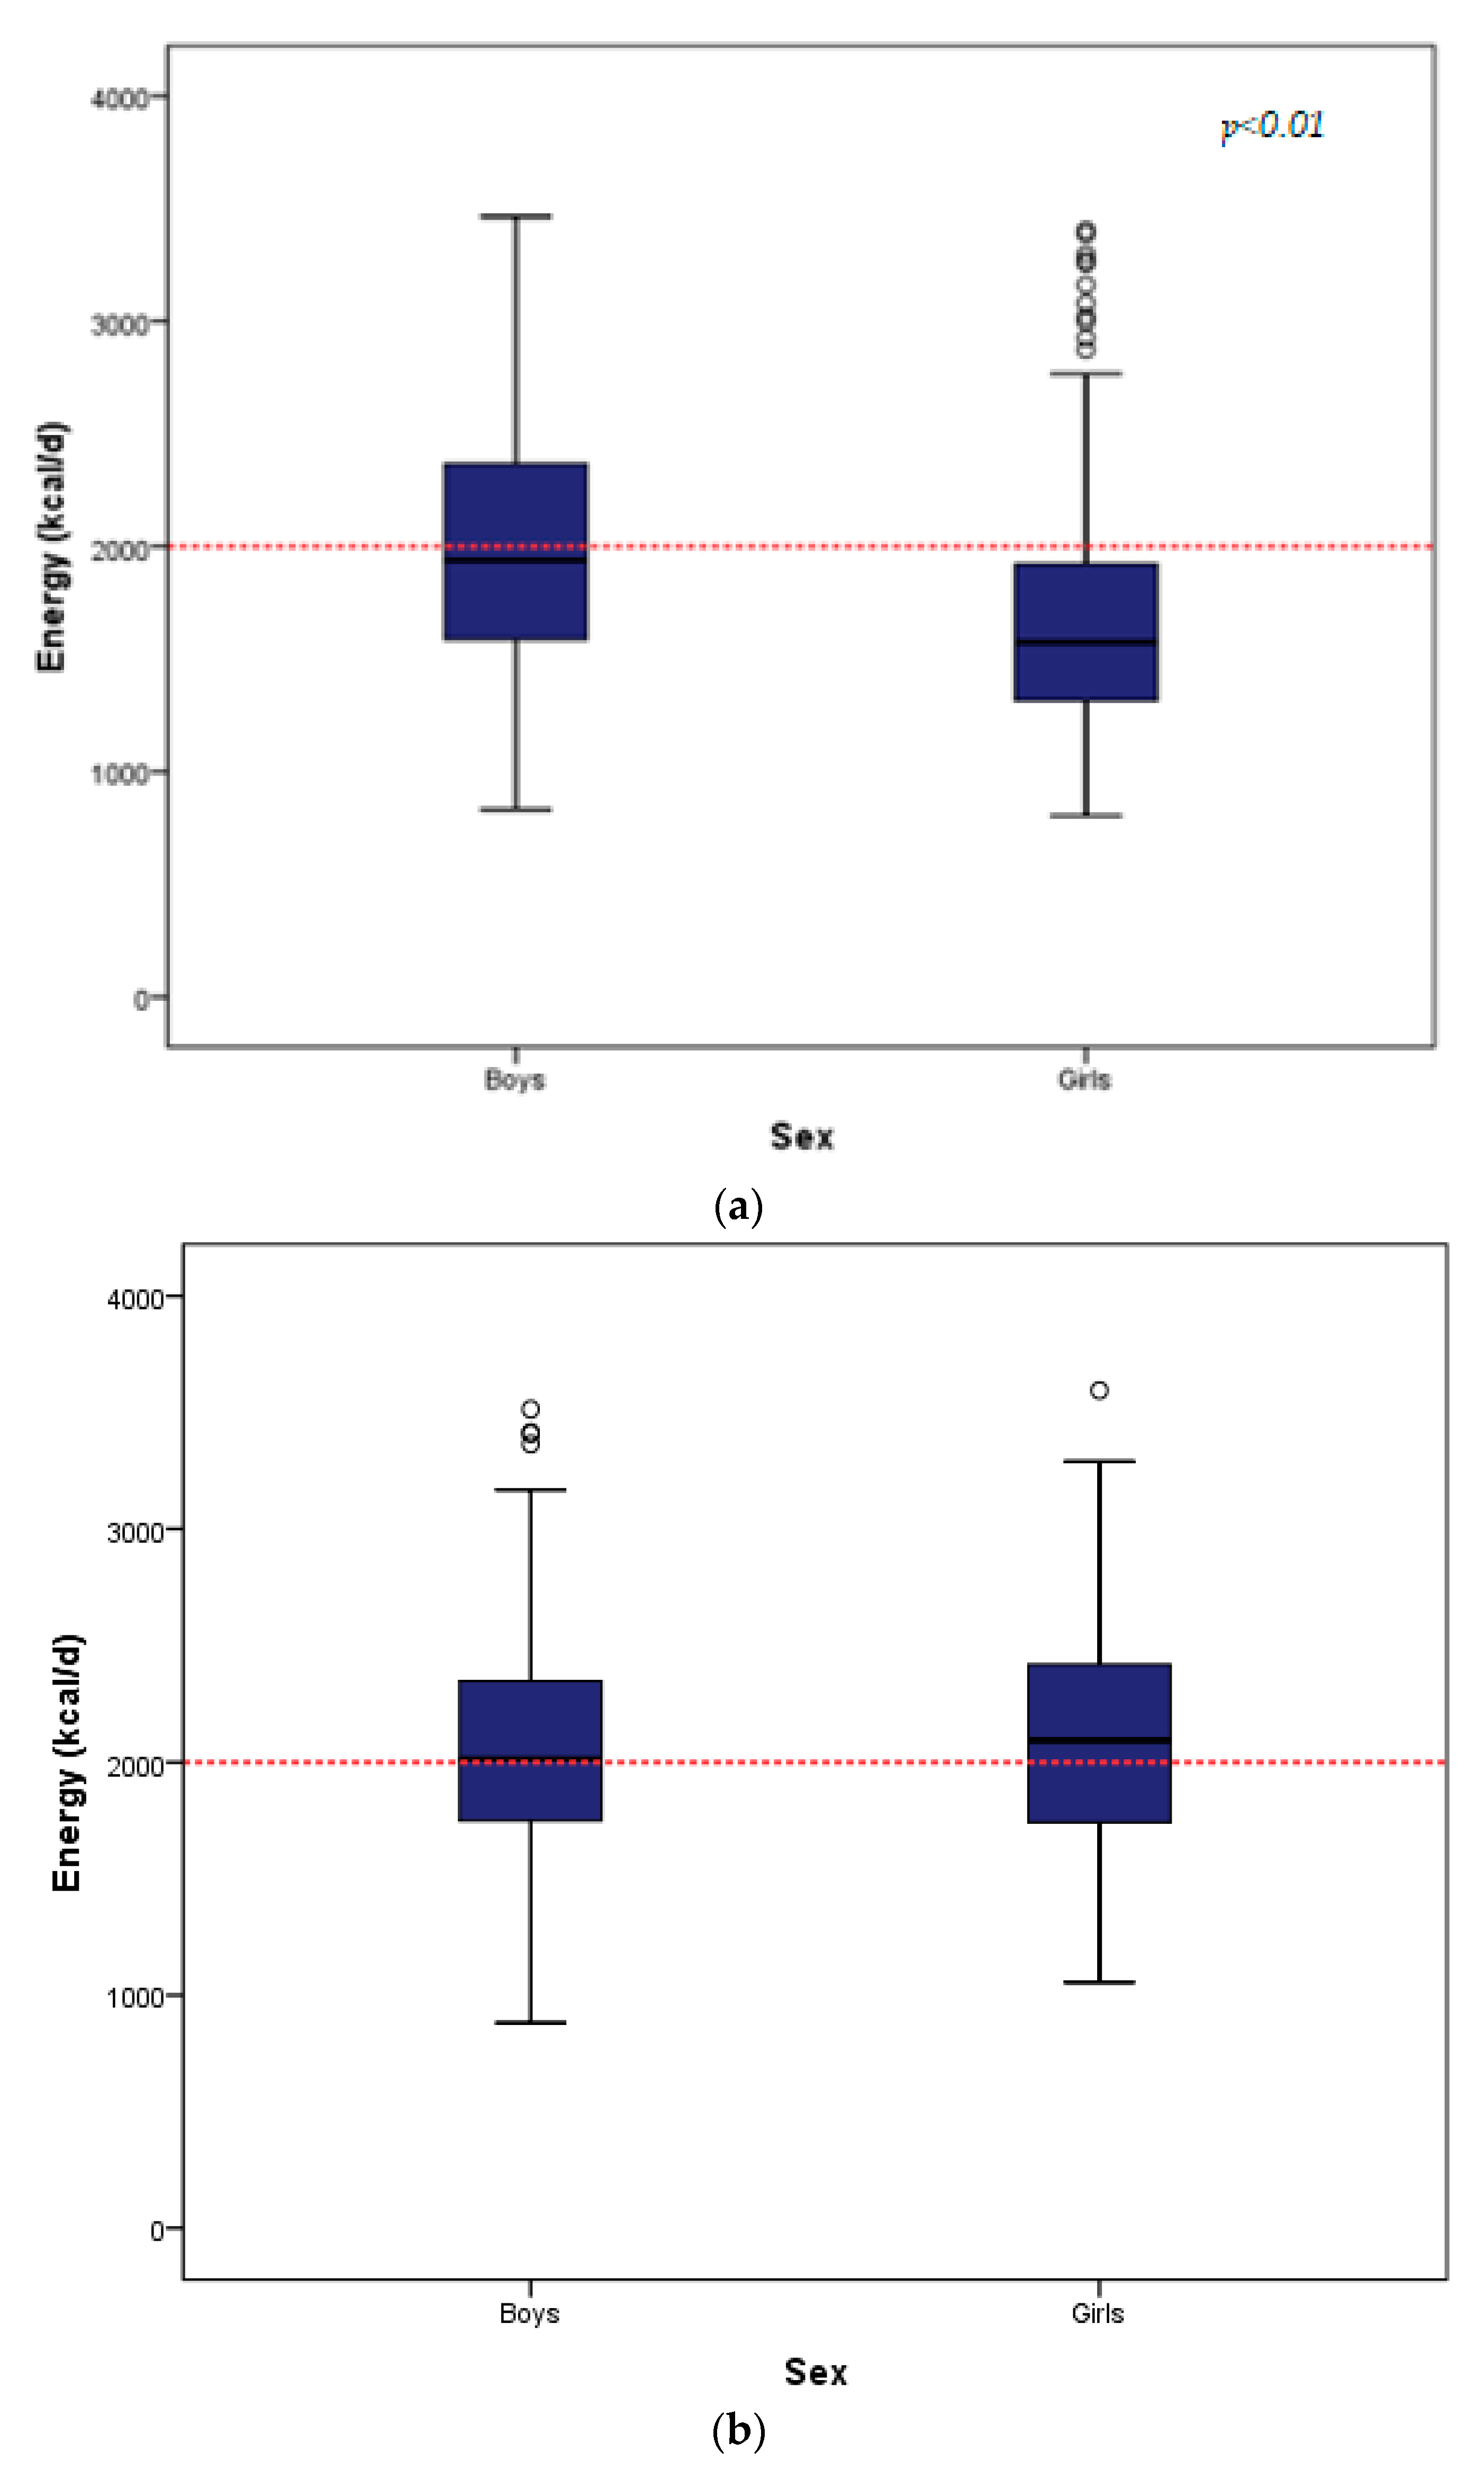
| Energy Intake (kcal/day) | 766 | 1741.00 (760) | 349 | 1939.00 (779) | 417 | 1574.00 (609) | <0.001 |
| Glucose (mg/dL), | 611 | 80.00 (12) | 283 | 81.00 (11) | 328 | 79.00 (12) | <0.001 |
| HOMA-IR | 539 | 2.28 (2) | 255 | 2.12 (2) | 284 | 2.37 (2) | <0.001 |
| Insulin (mg/dL) | 539 | 11.00 (7) | 255 | 10.00 (7) | 284 | 12.00 (8) | <0.001 |
| Total Cholesterol (mg/dL) | 611 | 157.00 (33) | 283 | 156.49 (25.18) ** | 328 | 157.50 (31) | 0.210 |
| Low density lipoprotein Cholesterol (LDL-C) (mg/dL) | 611 | 54.00 (16) | 283 | 90.57 (21.78) ** | 328 | 88.40 (26) | 0.651 |
| High Density Lipoprotein Cholestrol (HDL- C) (mg/dL) | 611 | 89.20 (27) | 283 | 53.00 (16) | 328 | 56.00 (17) | 0.001 |
| Triglycerides (mg/dL) | 611 | 56.00 (24) | 283 | 55.00 (25) | 328 | 57.00 (24) | 0.090 |
| C-reactive protein (CRP) (mg/dL) | 540 | 0.30 (1) | 254 | 0.45 (1) | 286 | 0.20 (0) | <0.001 |
| STANISLAS Family Study | |||||||
|---|---|---|---|---|---|---|---|
| All | Boys | Girls | p-Value * | ||||
| n | Median (IQR) | n | Median (IQR) | n | Median (IQR) | ||
| Age (years) | 287 | 13.08 (2.92) | 137 | 13.08 (2.92) | 150 | 13.08 (2.85) | 0.416 |
| Weight (kg) | 263 | 46.59 (18.10) | 129 | 47.20 (21.90) | 134 | 46.05 (14.84) | 0.136 |
| Body Mass Index (BMI) (kg/m2) | 263 | 18.44 (3.61) | 129 | 18.30 (3.20) | 134 | 18.52 (4.18) | 0.853 |
| WHR | 221 | 0.77 (0.04) ** | 110 | 0.81 (0.03) ** | 111 | 0.75 (0.06) | <0.001 |
| Systolic Blood Pressure (SBP) (mmHg) | 263 | 112.00 (14.50) | 129 | 115.60 (11.53) ** | 134 | 110.46 (8.76) ** | <0.001 |
| Diastolic Blood Pressure (DBP) (mmHg) | 263 | 57.00 (15.50) | 129 | 56.69 (16.00) ** | 134 | 57.02 (10.23) ** | 0.829 |
| Energy Intake (kcal/d) | 287 | 2056.03 (662.24) | 137 | 2070.99 (495.20) ** | 150 | 2094.92 (681.16) | 0.469 |
| Glucose (mg/dL), | 263 | 88.28 (6.12) ** | 129 | 89.18 (6.48) ** | 134 | 87.38 (5.76) ** | 0.018 *** |
| Total Cholesterol, (mg/dL) | 263 | 179.15 (40.93) | 129 | 173.36 (30.89) ** | 134 | 183.01 (36.29) | 0.002 |
| Low density lipoprotein cholesterol (LDL-C) (mg/dL) | 263 | 116.99 (33.98) | 129 | 113.13 (28.19) ** | 134 | 120.85 (32.05) | 0.030 |
| High density lipoprotein cholesterol (HDL-C)(mg/dL) | 263 | 54.05 (20.08) | 129 | 54.44 (15.44) ** | 134 | 156.37 (16.99) | 0.222 |
| Triglycerides (mg/dL) | 263 | 51.33 (33.63) | 129 | 52.21 (38.05) | 134 | 46.56 (30.09) | 0.930 |
| C-reactive protein (CRP) (mg/L) | 243 | 0.30 (0.53) | 118 | 0.32 (0.54) | 125 | 0.26 (0.55) | 0.765 |
| Component | |||||
|---|---|---|---|---|---|
| Food Groups | 1 | 2 | 3 | 4 | 5 |
| Cheese | 0.897 | - | - | - | - |
| Dairy | 0.863 | - | - | - | - |
| Processed Meat | 0.635 | - | - | - | - |
| Legumes | - | 0.739 | - | - | - |
| Olives, Olive Oil, Nuts | - | 0.668 | - | - | - |
| Red Meat | - | - | 0.712 | −0.429 | - |
| Potatoes | - | - | 0.661 | - | - |
| Fish | - | −0.358 | −0.480 | - | - |
| Chicken | - | - | - | 0.649 | - |
| Sweets | - | - | - | 0.518 | - |
| Fruit and Juices | - | - | - | −0.368 | - |
| Non-refined cereals | - | - | - | - | 0.674 |
| Vegetables | - | - | - | - | 0.342 |
| Eggs | - | - | - | - | 0.303 |
| Refined Cereals | 0.512 | - | - | - | −0.595 |
| Total Variance Explained (%) | 15.61 | 10.32 | 8.33 | 7.60 | 7.47 |
| Component | |||||
|---|---|---|---|---|---|
| Food Groups | 1 | 2 | 3 | 4 | 5 |
| Cheese | 0.664 | - | - | - | - |
| Breads and Flours | 0.605 | - | - | - | - |
| Processed Meat | 0.523 | - | - | - | - |
| Vegetables | 0.483 | - | - | - | - |
| Eggs | - | 0.630 | - | - | - |
| Salty Snacks | - | −0.580 | - | - | - |
| Vegetable Fat | - | 0.576 | - | - | - |
| Red Meat | - | - | 0.703 | - | - |
| Animal Fat | - | - | 0.610 | - | - |
| Milk and Yogurt | - | - | 0.473 | −0.338 | - |
| Fish | - | - | - | 0.666 | - |
| Seafood | - | - | - | 0.628 | - |
| Poultry | - | - | - | −0.380 | - |
| Soft Drinks | - | - | - | - | 0.777 |
| Sugars, Sweets and Cereal Bars | - | - | - | - | 0.746 |
| Total Variance Explained (%) | 10.58 | 10.44 | 9.26 | 8.19 | 8.19 |
| Model 1 | Model 2 | Model 3 | Model 4 | |||||||||
|---|---|---|---|---|---|---|---|---|---|---|---|---|
| β | SE | p | β | SE | p | β | SE | p | β | SE | p | |
| LogBMI | ||||||||||||
| Western Breakfast | −0.004 | 0.003 | 0.150 | −0.003 | 0.003 | 0.308 | - | - | - | - | - | - |
| Legumes and Good Fat | −0.006 | 0.003 | 0.017 | −0.004 | 0.003 | 0.194 | - | - | - | - | - | - |
| Homemade Meal | −0.005 | 0.003 | 0.042 | −0.003 | 0.003 | 0.242 | - | - | - | - | - | - |
| Chicken and Sugars | −0.005 | 0.003 | 0.069 | −0.004 | 0.003 | 0.128 | - | - | - | - | - | - |
| Eggs and Fibers | 0.004 | 0.003 | 0.111 | 0.004 | 0.003 | 0.115 | - | - | - | - | - | - |
| LogWHR | ||||||||||||
| Western Breakfast | 0.013 | 0.012 | 0.270 | 0.016 | 0.13 | 0.247 | 0.017 | 0.013 | 0.198 | 0.017 | 0.014 | 0.250 |
| Legumes and Good Fat | −0.006 | 0.011 | 0.622 | −0.008 | 0.013 | 0.527 | −0.007 | 0.013 | 0.608 | −0.007 | 0.013 | 0.597 |
| Homemade Meal | −0.009 | 0.011 | 0.445 | −0.008 | 0.013 | 0.517 | −0.007 | 0.013 | 0.599 | −0.008 | 0.013 | 0.562 |
| Chicken and Sugars | −0.003 | 0.011 | 0.760 | −0.005 | 0.013 | 0.696 | −0.003 | 0.013 | 0.828 | −0.003 | 0.013 | 0.800 |
| Eggs and Fibers | −0.011 | 0.011 | 0.320 | −0.0013 | 0.013 | 0.339 | −0.015 | 0.013 | 0.268 | −0.015 | 0.013 | 0.267 |
| LogSBP | ||||||||||||
| Western Breakfast | −0.003 | 0.002 | 0.085 | −0.002 | 0.002 | 0.174 | −0.002 | 0.002 | 0.295 | −0.001 | 0.002 | 0.646 |
| Legumes and Good Fat | 0.000 | 0.002 | 0.838 | 0.001 | 0.002 | 0.729 | 0.001 | 0.002 | 0.499 | 0.001 | 0.002 | 0.472 |
| Homemade Meal | 0.000 | 0.002 | 0.937 | 0.000 | 0.002 | 0.819 | 0.001 | 0.002 | 0.579 | 0.001 | 0.002 | 0.481 |
| Chicken and Sugars | 0.002 | 0.002 | 0.169 | 0.002 | 0.002 | 0.246 | 0.003 | 0.002 | 0.090 | 0.003 | 0.002 | 0.071 |
| Eggs and Fibers | 2.294 × 10⁻⁵ | 0.002 | 0.988 | −0.001 | 0.002 | 0.680 | −0.001 | 0.002 | 0.409 | −0.001 | 0.002 | 0.411 |
| LogDBP | ||||||||||||
| Western Breakfast | −0.003 | 0.002 | 0.224 | −0.003 | 0.002 | 0.256 | −0.002 | 0.002 | 0.361 | 0.000 | 0.003 | 0.894 |
| Legumes and Good Fat | −0.002 | 0.002 | 0.482 | −0.001 | 0.002 | 0.786 | 0.000 | 0.002 | 0.948 | −3.047 × 10⁻⁵ | 0.002 | 0.990 |
| Homemade Meal | 0.001 | 0.002 | 0.551 | 0.003 | 0.002 | 0.155 | 0.004 | 0.002 | 0.097 | 0.004 | 0.002 | 0.063 |
| Chicken and Sugars | 0.001 | 0.002 | 0.609 | 0.001 | 0.002 | 0.528 | 0.002 | 0.002 | 0.333 | 0.003 | 0.002 | 0.271 |
| Eggs and Fibers | 0.001 | 0.002 | 0.802 | 0.000 | 0.002 | 0.878 | 0.000 | 0.002 | 0.914 | 0.000 | 0.002 | 0.919 |
| LogGlucose | ||||||||||||
| Western Breakfast | −0.003 | 0.007 | 0.655 | −0.003 | 0.007 | 0.632 | −0.003 | 0.007 | 0.631 | −0.004 | 0.008 | 0.615 |
| Legumes and Good Fat | 0.010 | 0.006 | 0.120 | 0.011 | 0.007 | 0.111 | 0.011 | 0.007 | 0.110 | 0.011 | 0.007 | 0.111 |
| Homemade Meal | −0.002 | 0.006 | 0.740 | −0.004 | 0.007 | 0.531 | −0.004 | 0.007 | 0.531 | −0.004 | 0.007 | 0.532 |
| Chicken and Sugars | 0.015 | 0.006 | 0.017 | 0.013 | 0.007 | 0.051 | 0.013 | 0.007 | 0.051 | 0.013 | 0.007 | 0.051 |
| Eggs and Fibers | 0.003 | 0.006 | 0.588 | 0.003 | 0.007 | 0.659 | 0.003 | 0.007 | 0.659 | 0.003 | 0.007 | 0.660 |
| LogInsulin | ||||||||||||
| Western Breakfast | −0.015 | 0.010 | 0.119 | −0.015 | 0.010 | 0.139 | −0.009 | 0.010 | 0.356 | −0.007 | 0.010 | 0.521 |
| Legumes and Good Fat | −0.020 | 0.009 | 0.030 | −0.019 | 0.010 | 0.066 | −0.017 | 0.009 | 0.066 | −0.017 | 0.009 | 0.064 |
| Homemade Meal | 0.011 | 0.010 | 0.247 | 0.011 | 0.010 | 0.250 | 0.013 | 0.009 | 0.167 | 0.014 | 0.009 | 0.142 |
| Chicken and Sugars | 0.012 | 0.009 | 0.191 | 0.013 | 0.010 | 0.173 | 0.018 | 0.009 | 0.049 | 0.018 | 0.009 | 0.041 |
| Eggs and Fibers | −0.015 | 0.009 | 0.113 | −0.011 | 0.010 | 0.281 | −0.014 | 0.010 | 0.133 | −0.014 | 0.010 | 0.132 |
| LogHOMA-IR | ||||||||||||
| Western Breakfast | −0.016 | 0.011 | 0.158 | −0.016 | 0.012 | 0.180 | −0.035 | 0.011 | 0.422 | −0.004 | 0.012 | 0.728 |
| Legumes and Good Fat | −0.020 | 0.010 | 0.054 | −0.020 | 0.011 | 0.074 | −0.019 | 0.011 | 0.075 | −0.019 | 0.011 | 0.072 |
| Homemade Meal | 0.014 | 0.011 | 0.205 | 0.013 | 0.011 | 0.231 | 0.015 | 0.010 | 0.157 | 0.016 | 0.010 | 0.124 |
| Chicken and Sugars | 0.010 | 0.010 | 0.349 | 0.010 | 0.011 | 0.345 | 0.015 | 0.010 | 0.139 | 0.016 | 0.010 | 0.114 |
| Eggs and Fibers | −0.018 | 0.010 | 0.089 | −0.017 | 0.012 | 0.157 | −0.020 | 0.011 | 0.067 | −0.020 | 0.011 | 0.066 |
| LogTotalCholesterol | ||||||||||||
| Western Breakfast | −0.005 | 0.003 | 0.066 | −0.006 | 0.003 | 0.060 | −0.006 | 0.003 | 0.054 | −0.003 | 0.003 | 0.422 |
| Legumes and Good Fat | 0.001 | 0.003 | 0.721 | 0.001 | 0.003 | 0.863 | 0.000 | 0.003 | 0.883 | 0.000 | 0.003 | 0.908 |
| Homemade Meal | 0.002 | 0.003 | 0.402 | 0.002 | 0.003 | 0.538 | 0.002 | 0.003 | 0.549 | 0.003 | 0.003 | 0.353 |
| Chicken and Sugars | 0.000 | 0.003 | 0.917 | 2.502 × 10⁻⁵ | 0.003 | 0.993 | −5.600 × 10⁻⁵ | 0.003 | 0.985 | 0.000 | 0.003 | 0.868 |
| Eggs and Fibers | 0.003 | 0.003 | 0.269 | 0.002 | 0.003 | 0.521 | 0.002 | 0.003 | 0.511 | 0.002 | 0.003 | 0.511 |
| LogHDL-C | ||||||||||||
| Western Breakfast | −0.002 | 0.004 | 0.553 | −0.002 | 0.004 | 0.692 | −0.004 | 0.004 | 0.313 | −0.002 | 0.005 | 0.643 |
| Legumes and Good Fat | 0.006 | 0.004 | 0.160 | 0.005 | 0.004 | 0.210 | 0.004 | 0.004 | 0.343 | 0.004 | 0.004 | 0.351 |
| Homemade Meal | 0.001 | 0.004 | 0.832 | 0.001 | 0.004 | 0.900 | 0.000 | 0.004 | 0.919 | 0.000 | 0.004 | 0.958 |
| Chicken and Sugars | 0.009 | 0.004 | 0.022 | 0.007 | 0.004 | 0.080 | 0.006 | 0.004 | 0.153 | 0.006 | 0.004 | 0.128 |
| Eggs and Fibers | −0.001 | 0.004 | 0.885 | −0.002 | 0.004 | 0.600 | −0.001 | 0.004 | 0.761 | −0.001 | 0.004 | 0.759 |
| LogLDL-C | ||||||||||||
| Western Breakfast | −0.008 | 0.005 | 0.099 | −0.009 | 0.005 | 0.053 | −0.009 | 0.005 | 0.073 | −0.004 | 0.005 | 0.460 |
| Legumes and Good Fat | −0.001 | 0.004 | 0.761 | −0.003 | 0.005 | 0.547 | −0.002 | 0.005 | 0.610 | −0.003 | 0.005 | 0.586 |
| Homemade Meal | 0.003 | 0.004 | 0.566 | 0.001 | 0.005 | 0.800 | 0.001 | 0.005 | 0.753 | 0.003 | 0.005 | 0.537 |
| Chicken and Sugars | −0.005 | 0.004 | 0.246 | −0.005 | 0.005 | 0.278 | −0.004 | 0.005 | 0.324 | −0.004 | 0.004 | 0.411 |
| Eggs and Fibers | 0.005 | 0.004 | 0.233 | 0.004 | 0.005 | 0.389 | 0.004 | 0.005 | 0.423 | 0.004 | 0.005 | 0.423 |
| LogTriglycerides | ||||||||||||
| Western Breakfast | −0.003 | 0.006 | 0.632 | 0.002 | 0.007 | 0.747 | 0.001 | 0.006 | 0.831 | 0.004 | 0.007 | 0.573 |
| Legumes and Good Fat | 0.006 | 0.006 | 0.307 | 0.008 | 0.006 | 0.208 | 0.010 | 0.006 | 0.101 | 0.010 | 0.006 | 0.103 |
| Homemade Meal | −0.005 | 0.006 | 0.441 | −0.004 | 0.006 | 0.550 | −0.002 | 0.006 | 0.686 | −0.002 | 0.006 | 0.745 |
| Chicken and Sugars | −0.006 | 0.006 | 0.329 | −0.004 | 0.006 | 0.491 | −0.002 | 0.006 | 0.728 | −0.002 | 0.006 | 0.764 |
| Eggs and Fibers | −0.002 | 0.006 | 0.776 | −0.005 | 0.007 | 0.418 | −0.007 | 0.006 | 0.288 | −0.007 | 0.006 | 0.287 |
| LogCRP | ||||||||||||
| Western Breakfast | 0.002 | 0.020 | 0.939 | 0.006 | 0.021 | 0.775 | 0.018 | 0.020 | 0.383 | 0.021 | 0.022 | 0.349 |
| Legumes and Good Fat | 0.006 | 0.019 | 0.759 | 0.019 | 0.021 | 0.369 | 0.022 | 0.020 | 0.275 | 0.022 | 0.020 | 0.276 |
| Homemade Meal | 0.015 | 0.020 | 0.444 | 0.005 | 0.021 | 0.795 | 0.007 | 0.019 | 0.714 | 0.007 | 0.020 | 0.714 |
| Chicken and Sugars | −0.051 | 0.019 | 0.006 | −0.057 | 0.020 | 0.004 | −0.050 | 0.019 | 0.008 | −0.051 | 0.019 | 0.008 |
| Eggs and Fibers | 0.016 | 0.019 | 0.418 | 0.029 | 0.021 | 0.175 | 0.023 | 0.020 | 0.266 | 0.023 | 0.020 | 0.266 |
| Model 1 | Model 2 | Model 3 | Model 4 | |||||||||
|---|---|---|---|---|---|---|---|---|---|---|---|---|
| Estimate | SE | p | Estimate | SE | p | Estimate | SE | p | Estimate | SE | p | |
| LogBMI | ||||||||||||
| Western Breakfast | 0.000 | 0.003 | 0.878 | 0.000 | 0.005 | 0.459 | - | - | - | - | - | - |
| Prudent Snacking | 0.000 | 0.003 | 0.950 | 0.001 | 0.003 | 0.738 | - | - | - | - | - | - |
| High Protein and Animal Fat | 0.011 | 0.003 | 0.002 | 0.009 | 0.003 | 0.018 | - | - | - | - | - | - |
| Fish and Seafood | −0.002 | 0.003 | 0.430 | −0.001 | 0.003 | 0.700 | - | - | - | - | - | - |
| Sugary Snacks | −0.001 | 0.003 | 0.701 | −0.002 | 0.003 | 0.437 | - | - | - | - | - | - |
| LogWHR | ||||||||||||
| Western Breakfast | −0.000 | 0.001 | 0.800 | −0.000 | 0.001 | 0.539 | −0.000 | 0.001 | 0.540 | −0.000 | 0.001 | 0.840 |
| Prudent Snacking | 3.965729 × 10⁻⁵ | 0.001 | 0.976 | 0.000 | 0.001 | 0.809 | 0.000 | 0.001 | 0.797 | 0.000 | 0.001 | 0.722 |
| High protein and animal Fat | 0.000 | 0.001 | 0.723 | 0.000 | 0.001 | 0.616 | 0.000 | 0.001 | 0.757 | 0.001 | 0.001 | 0.486 |
| Fish and Seafood | 0.001 | 0.001 | 0.134 | 0.002 | 0.001 | 0.146 | 0.002 | 0.001 | 0.126 | 0.002 | 0.001 | 0.130 |
| Sugary Snacks | −0.001 | 0.001 | 0.392 | −0.001 | 0.001 | 0.363 | −0.001 | 0.001 | 0.409 | −0.000 | 0.001 | 0.691 |
| LogSBP | ||||||||||||
| Western Breakfast | −2.288744 × 10⁻⁵ | 0.002 | 0.991 | 0.000 | 0.002 | 0.892 | 0.000 | 0.002 | 0.837 | −0.000 | 0.002 | 0.792 |
| Prudent Snacking | 0.003 | 0.002 | 0.114 | 0.003 | 0.002 | 0.181 | 0.002 | 0.002 | 0.189 | 0.002 | 0.002 | 0.215 |
| High protein and Animal Fat | 0.000 | 0.002 | 0.733 | 0.000 | 0.002 | 0.822 | −0.000 | 0.002 | 0.802 | −0.001 | 0.002 | 0.504 |
| Fish and Seafood | −0.000 | 0.002 | 0.751 | −0.000 | 0.002 | 0.766 | −0.000 | 0.002 | 0.801 | −0.000 | 0.002 | 0.794 |
| Sugary Snacks | 0.000 | 0.002 | 0.640 | 0.000 | 0.002 | 0.787 | 0.000 | 0.002 | 0.673 | −0.000 | 0.002 | 0.894 |
| LogDBP | ||||||||||||
| Western Breakfast | −0.000 | 0.004 | 0.948 | 0.003 | 0.004 | 0.510 | 0.003 | 0.004 | 0.483 | 0.003 | 0.005 | 0.464 |
| Prudent Snacking | 0.002 | 0.004 | 0.593 | 0.001 | 0.004 | 0.833 | 0.000 | 0.004 | 0.841 | 0.000 | 0.004 | 0.845 |
| High Protein and Animal Fat | −0.008 | 0.004 | 0.089 | −0.008 | 0.005 | 0.099 | −0.010 | 0.005 | 0.045 | −0.012 | 0.005 | 0.028 |
| Fish and Seafood | 0.009 | 0.004 | 0.039 | 0.008 | 0.004 | 0.077 | 0.008 | 0.004 | 0.069 | 0.008 | 0.004 | 0.070 |
| Sugary Snacks | −0.000 | 0.004 | 0.936 | −0.002 | 0.005 | 0.651 | −0.001 | 0.005 | 0.718 | −0.002 | 0.006 | 0.632 |
| LogGlucose | ||||||||||||
| Western Breakfast | 0.000 | 0.001 | 0.604 | 0.001 | 0.002 | 0.448 | 0.001 | 0.002 | 0.462 | 0.000 | 0.002 | 0.868 |
| Prudent Snacking | −0.000 | 0.001 | 0.917 | −0.000 | 0.002 | 0.793 | −0.000 | 0.002 | 0.805 | −0.000 | 0.002 | 0.727 |
| High Protein and Animal Fat | −0.001 | 0.002 | 0.428 | −0.001 | 0.002 | 0.632 | −0.000 | 0.002 | 0.708 | −0.002 | 0.002 | 0.365 |
| Fish and Seafood | −0.002 | 0.001 | 0.202 | −0.001 | 0.001 | 0.331 | −0.001 | 0.001 | 0.323 | −0.001 | 0.001 | 0.323 |
| Sugary Snacks | 0.001 | 0.001 | 0.568 | 0.000 | 0.002 | 0.906 | 0.000 | 0.002 | 0.928 | −0.001 | 0.002 | 0.502 |
| LogTotalCholesterol | ||||||||||||
| Western Breakfast | −0.001 | 0.004 | 0.728 | −0.002 | 0.004 | 0.644 | −0.002 | 0.004 | 0.66 | −0.002 | 0.005 | 0.703 |
| Prudent Snacking | 0.002 | 0.004 | 0.599 | 0.004 | 0.004 | 0.347 | 0.004 | 0.004 | 0.369 | 0.004 | 0.004 | 0.358 |
| High Protein and Animal Fat | −0.003 | 0.005 | 0.490 | −0.006 | 0.005 | 0.236 | −0.007 | 0.005 | 0.157 | −0.008 | 0.005 | 0.151 |
| Fish and Seafood | 0.005 | 0.004 | 0.224 | 0.006 | 0.004 | 0.173 | 0.006 | 0.004 | 0.171 | 0.006 | 0.004 | 0.172 |
| Sugary Snacks | −0.001 | 0.004 | 0.712 | 6.925668 × 10⁻⁷ | 0.005 | 1.000 | 0.000 | 0.005 | 0.940 | 0.001 | 0.006 | 0.833 |
| LogHDL-C | ||||||||||||
| Western Breakfast | 0.006 | 0.006 | 0.303 | 0.005 | 0.007 | 0.426 | 0.005 | 0.007 | 0.443 | 0.011 | 0.007 | 0.139 |
| Prudent Snacking | −0.005 | 0.006 | 0.419 | −0.004 | 0.007 | 0.547 | −0.003 | 0.007 | 0.584 | −0.003 | 0.007 | 0.657 |
| High Protein and Animal Fat | −0.003 | 0.007 | 0.621 | −0.002 | 0.008 | 0.762 | 0.000 | 0.008 | 0.983 | 0.004 | 0.008 | 0.622 |
| Fish and Seafood | 0.004 | 0.006 | 0.462 | 0.002 | 0.006 | 0.710 | 0.002 | 0.006 | 0.728 | 0.002 | 0.006 | 0.746 |
| Sugary Snacks | −0.007 | 0.006 | 0.237 | −0.014 | 0.007 | 0.065 | −0.014 | 0.007 | 0.049 | −0.013 | 0.008 | 0.114 |
| LogLDL-C | ||||||||||||
| Western Breakfast | −0.006 | 0.006 | 0.333 | −0.007 | 0.006 | 0.275 | −0.007 | 0.006 | 0.292 | −0.060 | 0.053 | 0.254 |
| Prudent Snacking | 0.004 | 0.006 | 0.493 | 0.007 | 0.006 | 0.293 | 0.006 | 0.006 | 0.332 | 0.041 | 0.047 | 0.391 |
| High Protein and Animal Fat | −0.005 | 0.007 | 0.472 | −0.010 | 0.007 | 0.168 | −0.013 | 0.007 | 0.073 | −0.112 | 0.057 | 0.050 |
| Fish and Seafood | 0.004 | 0.006 | 0.475 | 0.007 | 0.006 | 0.292 | 0.006 | 0.006 | 0.288 | 0.035 | 0.045 | 0.435 |
| Sugary Snacks | −0.001 | 0.006 | 0.810 | 0.005 | 0.007 | 0.492 | 0.005 | 0.007 | 0.410 | 0.042 | 0.059 | 0.473 |
| LogTriglycerides | ||||||||||||
| Western Breakfast | 0.011 | 0.012 | 0.338 | 0.009 | 0.013 | 0.467 | 0.010 | 0.013 | 0.444 | −0.001 | 0.014 | 0.911 |
| Prudent Snacking | 0.003 | 0.012 | 0.237 | 0.000 | 0.013 | 0.990 | −6.768397 × 10⁻⁵ | 0.013 | 0.996 | −0.001 | 0.013 | 0.893 |
| High Protein and Animal Fat | 0.054 | 0.013 | <0.001 | 0.049 | 0.014 | 0.001 | 0.045 | 0.014 | 0.002 | 0.041 | 0.015 | 0.009 |
| Fish and Seafood | 0.014 | 0.012 | 0.252 | 0.019 | 0.012 | 0.133 | 0.020 | 0.012 | 0.114 | 0.021 | 0.012 | 0.093 |
| Sugary Snacks | 0.009 | 0.012 | 0.428 | 0.010 | 0.013 | 0.462 | 0.011 | 0.013 | 0.399 | −0.002 | 0.016 | 0.855 |
| LogCRP | ||||||||||||
| Western Breakfast | −0.045 | 0.029 | 0.125 | −0.053 | 0.031 | 0.085 | −0.050 | 0.030 | 0.096 | −0.076 | 0.033 | 0.024 |
| Prudent Snacking | 0.031 | 0.028 | 0.274 | 0.037 | 0.030 | 0.217 | 0.037 | 0.029 | 0.201 | 0.036 | 0.029 | 0.222 |
| High Protein and Animal Fat | 0.009 | 0.031 | 0.757 | −0.005 | 0.033 | 0.873 | −0.019 | 0.032 | 0.558 | −0.033 | 0.034 | 0.334 |
| Fish and Seafood | 0.018 | 0.029 | 0.516 | 0.009 | 0.030 | 0.745 | 0.010 | 0.029 | 0.733 | 0.008 | 0.030 | 0.774 |
| Sugary Snacks | 0.010 | 0.031 | 0.743 | 0.011 | 0.032 | 0.729 | 0.016 | 0.032 | 0.603 | 0.004 | 0.036 | 0.905 |
Publisher’s Note: MDPI stays neutral with regard to jurisdictional claims in published maps and institutional affiliations. |
© 2021 by the authors. Licensee MDPI, Basel, Switzerland. This article is an open access article distributed under the terms and conditions of the Creative Commons Attribution (CC BY) license (http://creativecommons.org/licenses/by/4.0/).
Share and Cite
Kafyra, M.; Kalafati, I.P.; Kumar, S.; Kontoe, M.S.; Masson, C.; Siest, S.; Dedoussis, G.V. Dietary Patterns, Blood Pressure and the Glycemic and Lipidemic Profile of Two Teenage, European Populations. Nutrients 2021, 13, 198. https://doi.org/10.3390/nu13010198
Kafyra M, Kalafati IP, Kumar S, Kontoe MS, Masson C, Siest S, Dedoussis GV. Dietary Patterns, Blood Pressure and the Glycemic and Lipidemic Profile of Two Teenage, European Populations. Nutrients. 2021; 13(1):198. https://doi.org/10.3390/nu13010198
Chicago/Turabian StyleKafyra, Maria, Ioanna Panagiota Kalafati, Satish Kumar, Maria Spyridoula Kontoe, Christine Masson, Sophie Siest, and George V. Dedoussis. 2021. "Dietary Patterns, Blood Pressure and the Glycemic and Lipidemic Profile of Two Teenage, European Populations" Nutrients 13, no. 1: 198. https://doi.org/10.3390/nu13010198
APA StyleKafyra, M., Kalafati, I. P., Kumar, S., Kontoe, M. S., Masson, C., Siest, S., & Dedoussis, G. V. (2021). Dietary Patterns, Blood Pressure and the Glycemic and Lipidemic Profile of Two Teenage, European Populations. Nutrients, 13(1), 198. https://doi.org/10.3390/nu13010198