Can Monitoring Make It Happen? An Assessment of How Reporting, Monitoring, and Evaluation Can Support Local Wellness Policy Implementation in US Schools

 , and
, and
Abstract
1. Introduction
2. Materials and Methods
2.1. Data and Design
2.2. Measures
2.2.1. SNMCS Outcome Measures
2.2.2. Local Wellness Policy Measures
2.2.3. Contextual Characteristics
2.3. Study Sample
2.4. Quantitative Data Analysis
2.5. Qualitative Data Analysis
3. Results
3.1. Characteristics of SFA and District Sample, and Characteristics of Superintendent Sample
3.2. Prevalence of SFA-Reported Activities to Report, Monitor and Evaluate Wellness Policies
3.3. Policy Association with District/SFA Reporting, Monitoring and Evaluation Activities
3.4. Qualitative Results: Perspectives from Superintendents about Reporting, Monitoring, and Evaluation
3.4.1. Theme 1: Determining Causality Is a Challenge
“…what’s the benefit of this policy and practice? We’ve had conversation about that and we really haven’t collected data. We feel like every time we are trying to decide whether that made a difference academically, we look back and go ‘yeah but we made these other 18 different changes.’ So we haven’t really found a way to assess whether or not an improvement… other than maybe physical health, but not from an academic standpoint.”—Superintendent from Texas
“I think it’s really hard to put it as causation but when you start to look at rising test scores and there are a lot of things, I think it’s one of the things affecting that. It’s one factor. We can’t say ‘this caused that,’ but we can say we know we’re improving and as we’ve been working on implementing a wellness policy.”—Superintendent from Alabama
“Our district participates every other year in the Youth Risk Behavior Survey, YRBS, so we have that data and we put that into our strategic plan as one of our key indicators.”—Superintendent from North Dakota
“We’re beginning to collect qualitative data [referring to a mindfulness initiative] that it is having significant causative impact on student’s focus, conduct, building culture in classrooms.”—Superintendent from Pennsylvania
3.4.2. Theme 2: The Need for Tools and Resources
“If there was a tool we could use that had been vetted, that would help us evaluate our wellness program, that would be easy to administer to principals and teachers and provide reasonable data to help us gauge over the course of 5 years to say….we’re making a difference, we’re not making a difference….and where can we make changes.”—Superintendent from Arizona
3.4.3. Theme 3: How Leadership Facilitates Change
“I see my role as being able to show people the gap between what our policy says and our actual practice. Helping us find ways to close that. So, celebrating what we are doing well but also finding the one or two priority areas we need to work on further.”—Superintendent, focus group
4. Discussion
Limitations and Areas for Future Research
5. Conclusions
Author Contributions
Funding
Institutional Review Board Statement
Informed Consent Statement
Data Availability Statement
Acknowledgments
Conflicts of Interest
References
- Greenhalgh, T.; Robert, G.; MacFarlane, F.; Bate, P.; Kyriakidou, O. Diffusion of innovations in service organizations: Systematic review and recommendations. Milbank Q. 2004, 82, 581–629. [Google Scholar] [CrossRef]
- National Center for Education Statistics, Digest of Education Statistics. 2018. Available online: https://nces.ed.gov/programs/digest/d18/ch_2.asp (accessed on 17 November 2020).
- Education Commission of the States. 50-State Comparison: Instructional Time Policies. 2020. Available online: https://www.ecs.org/50-state-comparison-instructional-time-policies/ (accessed on 16 November 2020).
- Institute of Medicine. Bridging the Evidence Gap in Obesity Prevention: A Framework to Inform Decision Making; The National Academies Press: Washington, DC, USA, 2010. [Google Scholar]
- Frieden, T.R. A framework for public health action: The health impact pyramid. Am. J. Public Health 2010, 100, 590–595. [Google Scholar] [CrossRef]
- Powell, B.J.; Waltz, T.J.; Chinman, M.J.; Damschroder, L.J.; Smith, J.L.; Matthieu, M.M.; Proctor, E.K.; Kirchner, J.E. A refined compilation of implementation strategies: Results from the Expert Recommendations for Implementing Change (ERIC) project. Implement. Sci. 2015, 10, 21. [Google Scholar] [CrossRef] [PubMed]
- Institute of Medicine. School Meals: Building Blocks for Healthy Children; The National Academies Press: Washington, DC, USA, 2010. [Google Scholar]
- Institute of Medicine. Educating the Student Body: Taking Physical Activity and Physical Education to School; The National Academies Press: Washington, DC, USA, 2013. [Google Scholar]
- U.S. Department of Agriculture, Food and Nutrition Service. National School Lunch—Participation and Meals Served. 2020. Available online: https://www.fns.usda.gov/pd/child-nutrition-tables (accessed on 12 November 2020).
- U.S. Department of Agriculture, Food and Nutrition Service. The School Breakfast Program: Fact Sheet. 2017. Available online: https://fns-prod.azureedge.net/sites/default/files/sbp/SBPfactsheet.pdf (accessed on 29 November 2018).
- Child Nutrition and WIC Reauthorization Act of 2004. 42 U.S.C. 1751 §204; 2004. Available online: https://www.gpo.gov/fdsys/pkg/PLAW-108publ265/pdf/PLAW-108publ265.pdf (accessed on 1 December 2020).
- Healthy, Hunger-Free Kids Act of 2010. 42 U.S.C. 1779; 2010. Available online: https://www.gpo.gov/fdsys/pkg/PLAW-111publ296/pdf/PLAW-111publ296.pdf (accessed on 1 December 2020).
- United States Department of Agriculture, Food and Nutrition Service. Local School Wellness Policy Implementation under the Healthy, Hunger-Free Kids Act of 2010. Final rule. Fed. Regist. 2016, 81, 50151–50170. [Google Scholar]
- U.S. Department of Agriculture. Nutrition standards in the National School Lunch and School Breakfast Programs; Final rule. Fed. Regist. 2012, 77, 4088–4167. [Google Scholar]
- U.S. Department of Agriculture. National School Lunch Program and School Breakfast Program: Nutrition standards for all foods sold in school as required by the Healthy, Hunger-Free Kids Act of 2010. Fed. Regist. 2016, 81, 50131–50151. [Google Scholar]
- Allen, J.D.; Shelton, R.C.; Emmons, K.M.; Linnan, L.A. Fidelity and its relationship to implementation effectiveness, adaptation, and dissemination. In Dissemination and Implementation Research in Health, 2nd ed.; Brownson, R.C., Colditz, G.A., Proctor, E.K., Eds.; Oxford Press: New York, NY, USA, 2018; pp. 267–284. [Google Scholar]
- Scott, K.; Lewis, C.C. Using measurement-based care to enhance any treatment. Cog. Behav. Pract. 2015, 22, 49–59. [Google Scholar] [CrossRef]
- Horner, R.H.; Sugai, G. School-wide PBIS: An example of applied behavior analysis implemented at a scale of social importance. Behav. Anal. Pract. 2015, 8, 80–85. [Google Scholar] [CrossRef]
- Biglan, A.; Flay, B.; Embry, D.; Sandler, I. The critical role of nurturing environments in promoting human well-being. Am. Psych. 2012, 67, 257–271. [Google Scholar] [CrossRef]
- Herman, K.C.; Riley-Tillman, T.C.; Reinke, W.M. The role of assessment in a prevention science framework. School Psych. Rev. 2012, 41, 306–314. [Google Scholar] [CrossRef]
- Piekarz-Porter, E.; Schermbeck, R.M.; Leider, J.; Young, S.K.; Chriqui, J.F. Working on Wellness: How Aligned Are District Wellness Policies with the Soon-To-Be Implemented Federal Wellness Policy Requirements? 2017. Available online: http://www.go.uic.edu/NWPSproducts (accessed on 1 November 2017).
- Piekarz, E.; Schermbeck, R.; Young, S.; Leider, J.; Ziemann, M.; Chriqui, J. School District Wellness Policies: Evaluating Progress and Potential for Improving Children’s Health Eight Years after the Federal Mandate. School Years 2006–2007 through 2013–2014. 2016. Available online: http://www.ihrp.uic.edu/files/District-Monograph-1Jul16-norw.pdf (accessed on 1 November 2017).
- Schwartz, M.B.; Henderson, K.E.; Falbe, J.; Novak, S.A.; Wharton, C.M.; Long, M.W.; O’Connell, M.L.; Fiore, S.S. Strength and comprehensiveness of district school wellness policies predict policy implementation at the school level. J. Sch. Health 2012, 82, 262–267. [Google Scholar] [CrossRef] [PubMed]
- Hoffman, P.K.; Davey, C.S.; Larson, N.; Grannon, K.Y.; Hanson, C.; Nanney, M.S. School district wellness policy quality and weight-related outcomes among high school students in Minnesota. Health Educ. Res. 2016, 31, 234–246. [Google Scholar] [CrossRef] [PubMed]
- U.S. Department of Agriculture, Food and Nutrition Service, Office of Policy Support. School Nutrition and Meal Cost Study: Study Design, Sampling, and Data Collection; U.S. Department of Agriculture: Alexandria, VA, USA, 2019. Available online: https://fns-prod.azureedge.net/sites/default/files/resource-files/SNMCS-Methods-Report.pdf (accessed on 1 December 2020).
- Palinkas, L.A.; Rhoades Cooper, B. Mixed methods evaluation in dissemination and implementation science. In Dissemination and Implementation Research in Health, 2nd ed.; Brownson, R.C., Colditz, G.A., Proctor, E.K., Eds.; Oxford Press: New York, NY, USA, 2018; pp. 335–353. [Google Scholar]
- U.S. Department of Agriculture, Food and Nutrition Service, Office of Policy Support. School Nutrition and Meal Cost Study, Final Report Volume 1: School Meal Program Operations and School Nutrition Environments; U.S. Department of Agriculture: Alexandria, VA, USA, 2019. Available online: https://www.fns.usda.gov/school-nutrition-and-mealcost-study (accessed on 1 November 2020).
- National Wellness Policy Study. Research Products: National Wellness Policy Study. Available online: https://go.uic.edu/NWPSproducts (accessed on 1 November 2020).
- Asada, Y.; Hughes, A.; Read, M.; Schwartz, M.; Schermbeck, R.; Turner, L.; Chriqui, J.F. “On a positive path”: School superintendents’ perceptions of and experiences with local school wellness policy implementation and evaluation. Health Prom. Pract. 2020. [Google Scholar] [CrossRef] [PubMed]
- Asada, Y.; Turner, L.; Schwartz, M.; Chriqui, J.F. “Bridging, brokering, and buffering:” A theoretical exploration of school leaders’ engagement with local school wellness policy implementation. Implement. Sci. Comm. 2020, 1, 1–11. [Google Scholar] [CrossRef] [PubMed]
- Schwartz, M.B.; Lund, A.E.; Grow, H.M.; McDonnell, E.; Probart, C.; Samuelson, A.; Lytle, L. A Comprehensive Coding System to Measure the Quality of School Wellness Policies. J. Am. Diet. Assoc. 2009, 109, 1256–1262. [Google Scholar] [CrossRef] [PubMed]
- State Law and School District Wellness Policy Coding Tool; Institute for Health Research and Policy, University of Illinois Chicago: Chicago, IL, USA, 2016; Available online: https://www.ihrp.uic.edu/files/NWPS_District_Codebook_SY2014-15.pdf (accessed on 10 November 2020).
- U.S. Department of Education, National Center for Education Statistics. Local Education Agency Universe Survey, 2011–2012. Common Core of Data (CCD). Available online: https://nces.ed.gov/ccd/pubagency.asp (accessed on 1 November 2020).
- National Center for Education Statistics. Local Education Agency Universe Survey, 2013–2014 V.1a. Common Core of Data (CCD). Available online: https://nces.ed.gov/ccd/pubagency.asp (accessed on 1 November 2020).
- U.S. Department of Agriculture, Food and Nutrition Service. School Food Authority (SFA) Verification Collection Report. Available online: https://www.fns.usda.gov.sites/default/files/FNS-742.pdf (accessed on 17 November 2020).
- U.S. Census Bureau. Small Area Income and Poverty Estimates: School District Estimates for 2011. Available online: https://www.census.gov/data/datasets/2011/demo/saipe/2011-school-districts.html (accessed on 17 September 2020).
- O’Malley, P.M.; Johnston, L.D.; Delva, J.; Bachman, J.G.; Schulenberg, J.E. Variation in Obesity Among American Secondary School Students by School and School Characteristics. Am. J. Prev. Med. 2007, 33, S187–S194. [Google Scholar] [CrossRef] [PubMed]
- U.S. Census Bureau. Census Regions and Divisions of the United States. Available online: http://www2.Census.Gov/Geo/Pdfs/Maps-Data/Maps/Reference/Us_regdiv.pdf (accessed on 17 November 2020).
- Hager, E.R.; Song, H.J.; Lane, H.G.; Guo, H.H.; Jaspers, L.H.; Lopes, M.A. Pilot-testing an intervention to enhance wellness policy implementation in schools: Wellness Champions for Change. J. Nutr. Educ. Behav. 2018, 50, 765–775. [Google Scholar] [CrossRef]
- Eggert, E.; Overby, H.; McCormack, L.; Meendering, J. Use of a model wellness policy may not increase the strength and comprehensiveness of written school wellness policies. J. Sch. Health 2018, 88, 516–523. [Google Scholar] [CrossRef]
- Smith, E.M.; Capogrossi, K.L.; Estabrooks, P.A. School wellness policies: Effects of using standard templates. Am. J. Prev. Med. 2012, 43, 304–308. [Google Scholar] [CrossRef]
- Meendering, J.; Skinner, M.M.; McCormack, L.A. Model school-district wellness policies warrant improvements in comprehensiveness and strength. J. Sch. Health 2021, 91, 77–83. [Google Scholar] [CrossRef]
- Schwartz, M.; Piekarz, E.; Read, M.; Chriqui, J. Wellness School Assessment Tool Version 3.0: An updated quantitative measure of written school wellness policies. Prev. Chron. Dis. 2020, 17, E52. [Google Scholar] [CrossRef] [PubMed]
- Chambers, D.A. Advancing the science of implementation: A workshop summary. Admin. Policy Ment. Health. 2008, 35, 3–10. [Google Scholar] [CrossRef] [PubMed]
- Agron, P.; Berends, V.; Ellis, K.; Gonzalez, M. School wellness policies: Perceptions, barriers, and needs among school leaders and wellness advocates. J. Sch. Health 2010, 80, 527–535. [Google Scholar] [CrossRef] [PubMed]
- Phulkerd, S.; Lawrence, M.; Vandevijvere, S.; Sacks, G.; Worsley, A.; Tangcharoensathien, V. A review of methods and tools to assess the implementation of government policies to create healthy food environments for preventing obesity and diet-related non-communicable diseases. Implement. Sci. 2016, 4, 15. [Google Scholar] [CrossRef]
- Lane, H.G.; Calvert, H.G.; Deitch, R.; Harris, R.; Babatunde, O.T.; Turner, L.; Hager, E.R.; Pitts, S.J. A systematic review of existing observational tools to measure the food and physical activity environment in schools. Health Place. 2020, 66, 102388. [Google Scholar] [CrossRef]
- Centers for Disease Control and Prevention. School Health Index: An Online Self-Assessment and Planning Tool for Schools. 2017. Available online: https://www.cdc.gov/healthyschools/shi/index.htm (accessed on 10 November 2020).
- Administrative Reviews in the School Nutrition Programs, Final Rule. 81 FR 50170. 2016. Available online: https://www.federalregister.gov/documents/2016/07/29/2016-17231/administrative-reviews-in-the-schoolnutrition-programs (accessed on 5 November 2020).

| Variable | SFAs % | Superintendents n (%) |
|---|---|---|
| District Race/Ethnicity of Students | ||
| Predominantly (≥66%) White | 65.4 | 25 (64%) |
| Majority (≥50%) Black | 7.1 | 4 (10%) |
| Majority (≥50%) Hispanic | 8.3 | 3 (8%) |
| Other Majority or Diverse | 19.2 | 7 (18%) |
| District Locale | ||
| Urban | 12.8 | 3 (8%) |
| Suburban | 21.5 | 21 (54%) |
| Township | 20.5 | 6 (15%) |
| Rural | 45.3 | 9 (23%) |
| District-Level Eligibility for Free/Reduced-Priced Meals | ||
| ≤33% of students | 19 (49%) | |
| >33% to 66% of students | 8 (21%) | |
| ≥67% of students | 7 (18%) | |
| District Child Poverty Rate | ||
| <20% | 60.6% | |
| 20% or greater | 39.5% | |
| SFA Size | ||
| Small (<1000 students) | 45.4 | 8 (21%) |
| Medium (1000 to 5000 students) | 40.0 | 20 (51%) |
| Large (>5000 students) | 14.6 | 11 (28%) |
| Region | ||
| West | 16.1 | 6 (15%) |
| Northeast | 18.1 | 15 (38%) |
| South | 25.5 | 7 (18%) |
| Midwest | 40.3 | 11 (28%) |
| SFA Activity | SFA Activity Status (% of SFAs) | |||
|---|---|---|---|---|
| Fully Implemented | Partially Implemented | Still Being Planned | Not Addressed | |
| Reporting: Plan for informing the public about the wellness policy content and implementation | 36.4 | 26.0 | 30.2 | 7.4 |
| Monitoring: Plan for describing the progress made towards attaining the goals of the policy | 33.5 | 27.7 | 30.0 | 8.8 |
| Evaluation: Plan for measuring implementation of the policy, including the extent in compliance with the policy | 34.0 | 30.0 | 28.3 | 7.6 |
| Adjusted Prevalence (% SFAs) | Adjusted Odds Ratio (95% CI) | |
|---|---|---|
| Model 1: Reporting | ||
| Outcome: Plan for informing the public about the wellness policy content and implementation | ||
| Policy Predictor: Reporting to Public via Website (R1) | ||
| No Policy | 33.58 | Referent |
| Any Policy | 65.41 | 4.20 (1.40, 12.61) * |
| Model 2: Reporting | ||
| Outcome: Plan for informing the public about the wellness policy content and implementation | ||
| Policy Predictor: Reporting to Public, Non-Website (R2) | ||
| No Policy | 32.89 | Referent |
| Recommended | 42.81 | 1.57 (0.34, 7.20) |
| Required | 55.44 | 2.69 (1.25, 5.76) * |
| Model 3: Monitoring | ||
| Outcome: Plan for describing the progress made towards attaining the goals of the policy | ||
| Policy Predictor: Reporting on meeting LWP goals and progress (R16) | ||
| No Policy | 29.02 | Referent |
| Recommended | 26.85 | 0.89 (0.11, 7.37) |
| Required | 44.84 | 2.09 (1.09, 4.01) * |
| Model 4: Evaluation | ||
| Outcome: Plan for measuring implementation of the policy, including the extent in compliance with the policy | ||
| Policy Predictor: Plan for evaluating the LWP (E5) | ||
| No Policy | 24.02 | Referent |
| Recommended | 30.56 | 1.42 (0.73, 2.75) |
| Required | 57.45 | 4.72 (1.98, 11.21) *** |
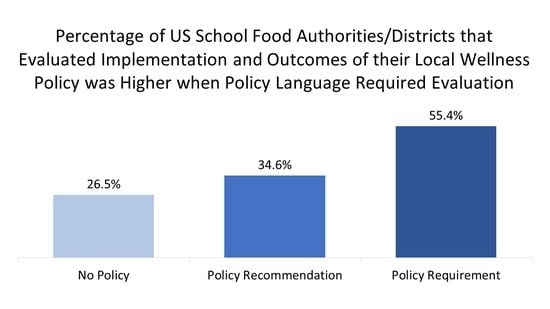
| Model 5: Evaluation | ||
| Outcome: Has district ever evaluated the effects of the wellness policy | ||
| Policy Predictor: Plan for evaluating the LWP (E5) | ||
| No Policy | 26.47 | Referent |
| Recommended | 34.59 | 1.51 (0.68, 3.34) |
| Required | 55.41 | 3.80 (1.48, 9.77) ** |
Publisher’s Note: MDPI stays neutral with regard to jurisdictional claims in published maps and institutional affiliations. |
© 2021 by the authors. Licensee MDPI, Basel, Switzerland. This article is an open access article distributed under the terms and conditions of the Creative Commons Attribution (CC BY) license (http://creativecommons.org/licenses/by/4.0/).
Share and Cite
Turner, L.; Asada, Y.; Leider, J.; Piekarz-Porter, E.; Schwartz, M.; Chriqui, J.F. Can Monitoring Make It Happen? An Assessment of How Reporting, Monitoring, and Evaluation Can Support Local Wellness Policy Implementation in US Schools. Nutrients 2021, 13, 193. https://doi.org/10.3390/nu13010193
Turner L, Asada Y, Leider J, Piekarz-Porter E, Schwartz M, Chriqui JF. Can Monitoring Make It Happen? An Assessment of How Reporting, Monitoring, and Evaluation Can Support Local Wellness Policy Implementation in US Schools. Nutrients. 2021; 13(1):193. https://doi.org/10.3390/nu13010193
Chicago/Turabian StyleTurner, Lindsey, Yuka Asada, Julien Leider, Elizabeth Piekarz-Porter, Marlene Schwartz, and Jamie F. Chriqui. 2021. "Can Monitoring Make It Happen? An Assessment of How Reporting, Monitoring, and Evaluation Can Support Local Wellness Policy Implementation in US Schools" Nutrients 13, no. 1: 193. https://doi.org/10.3390/nu13010193
APA StyleTurner, L., Asada, Y., Leider, J., Piekarz-Porter, E., Schwartz, M., & Chriqui, J. F. (2021). Can Monitoring Make It Happen? An Assessment of How Reporting, Monitoring, and Evaluation Can Support Local Wellness Policy Implementation in US Schools. Nutrients, 13(1), 193. https://doi.org/10.3390/nu13010193