Effects of Breastfeeding on Maternal Body Composition in Moroccan Lactating Women during Twelve Months after Birth Using Stable Isotopic Dilution Technique

 , ,
, , 
Abstract
1. Introduction
2. Materials and Methods
2.1. Study Design and Subject
2.2. Socioeconomic Assessment
2.3. Sample Size
2.4. Anthropometric Measurements
2.5. Principle, Preparation and Administration of Deuterium Oxide Doses
2.6. Classification of Breastfeeding
2.7. Body Composition of Mothers
2.8. Statistical Analysis
3. Results
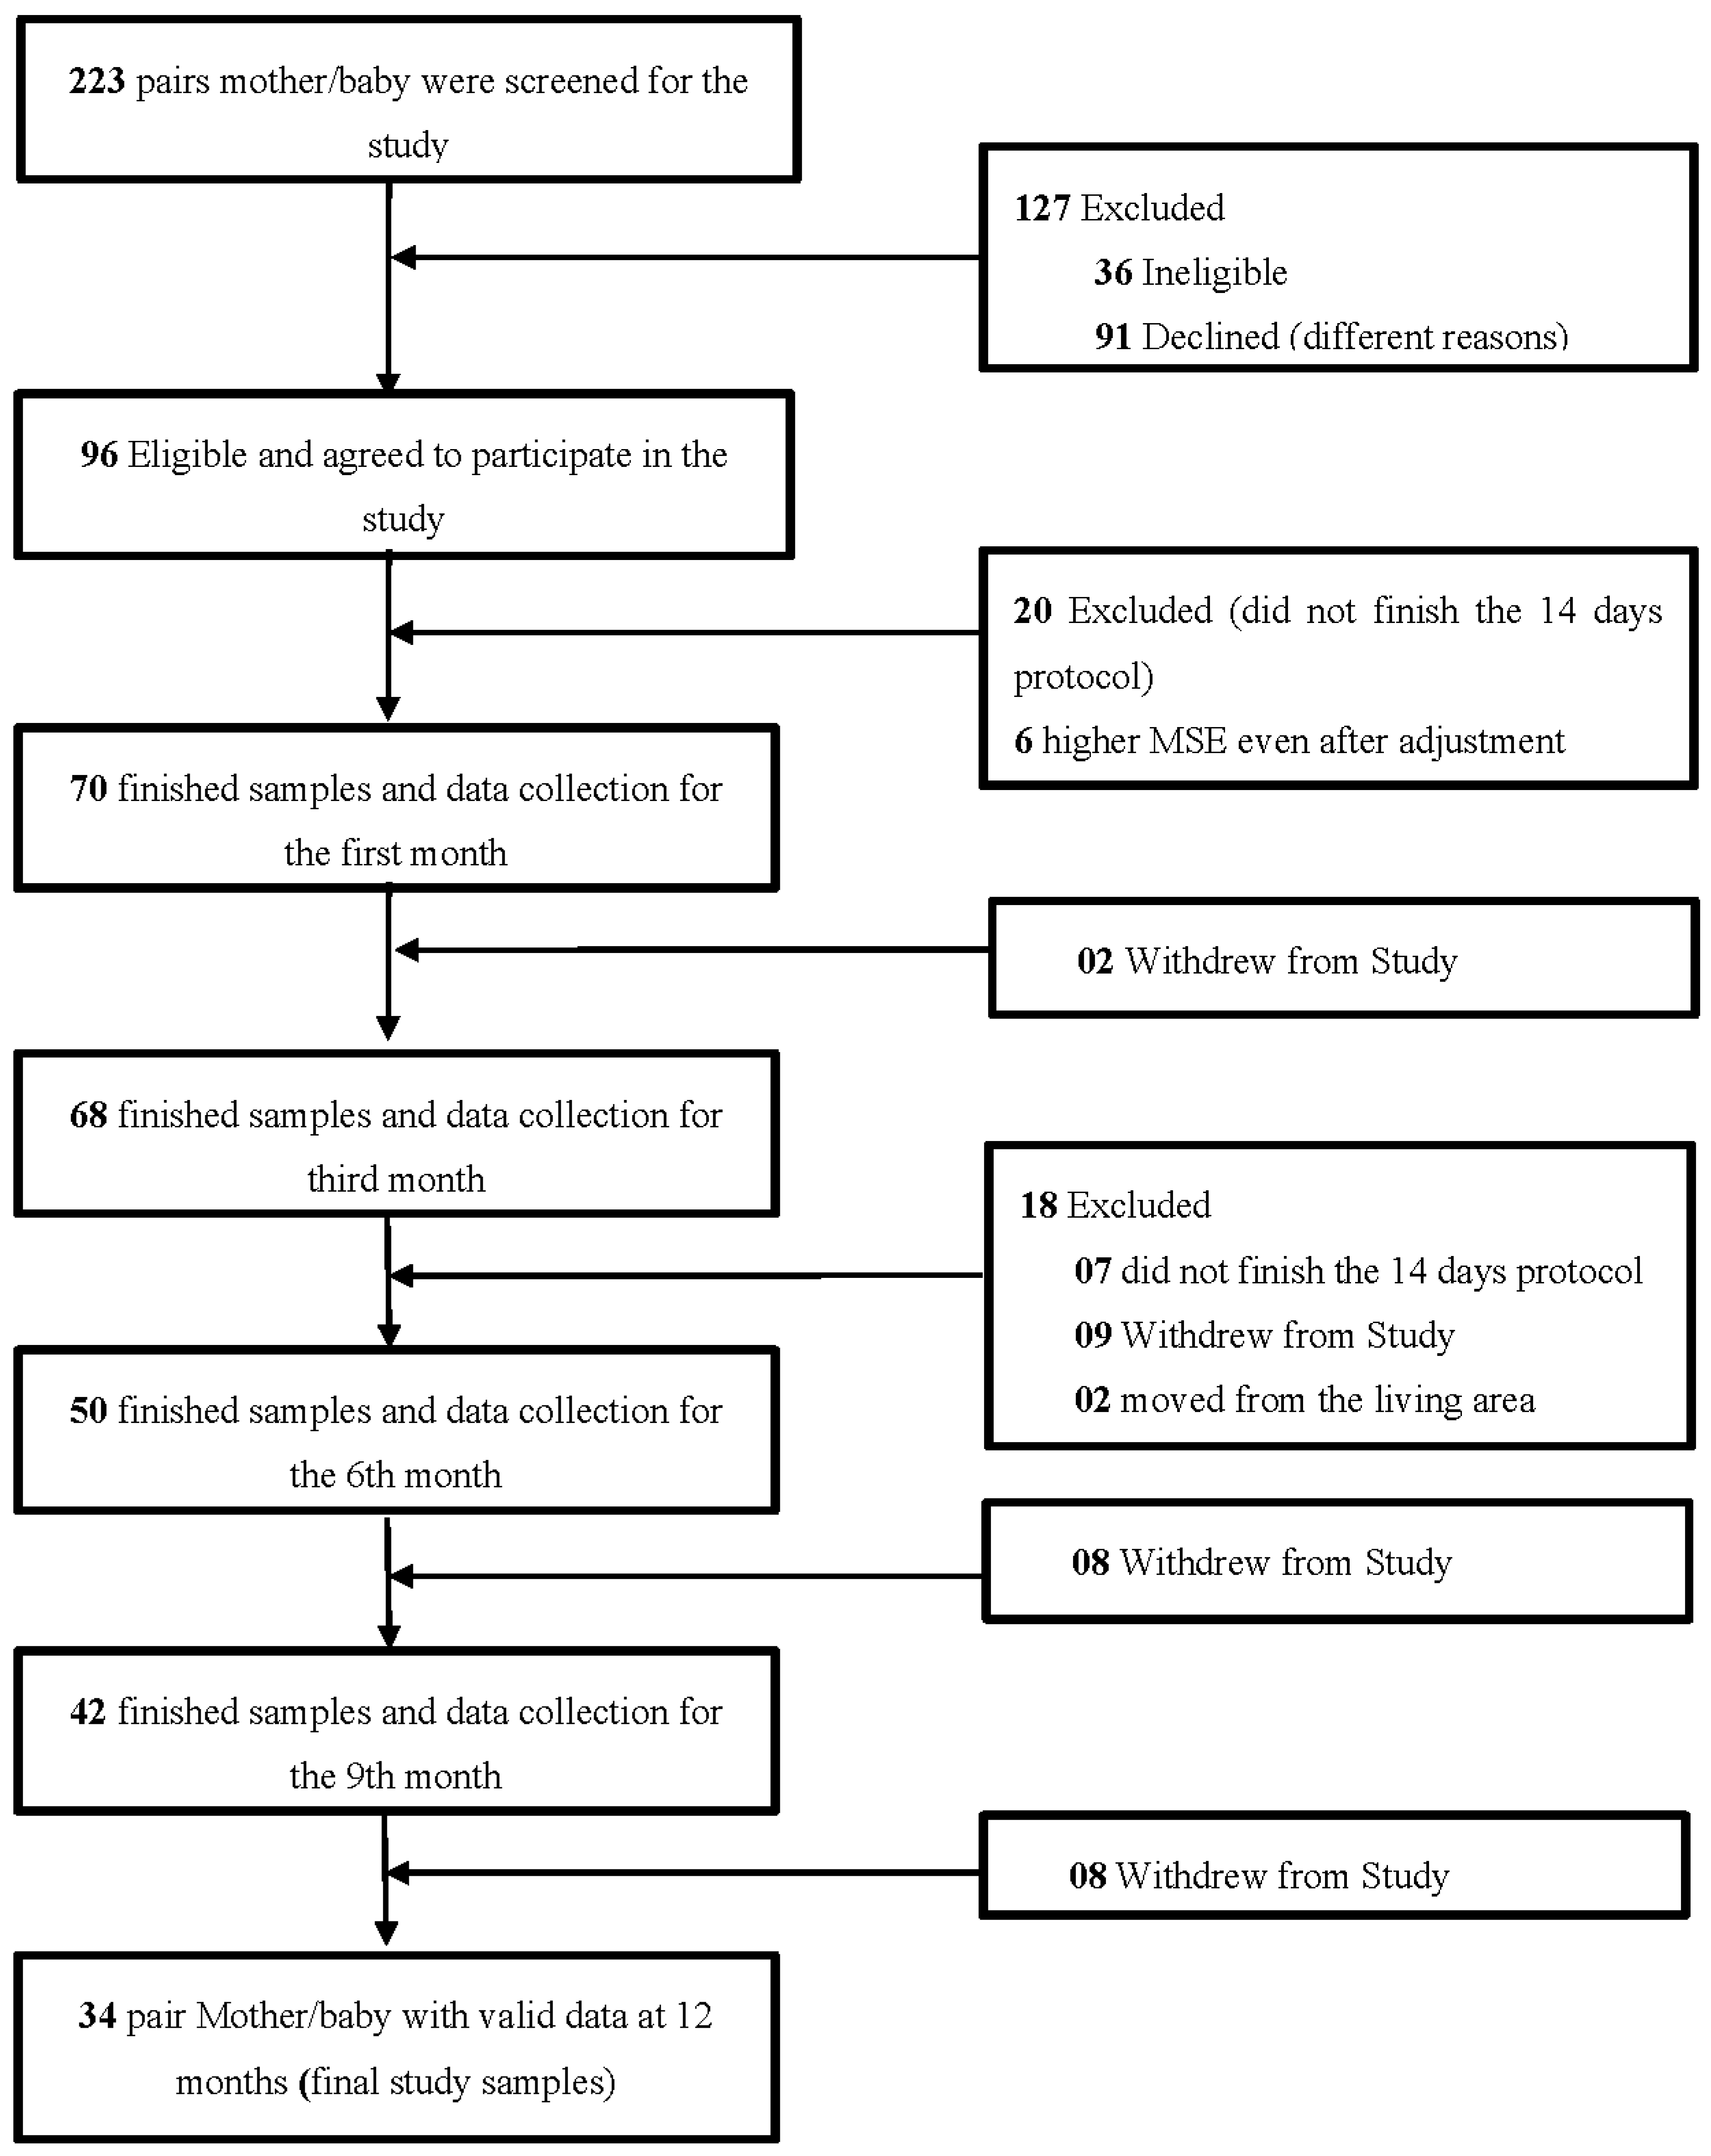
3.1. Subjects
3.2. Anthropometric Characteristics of Infants during the Study
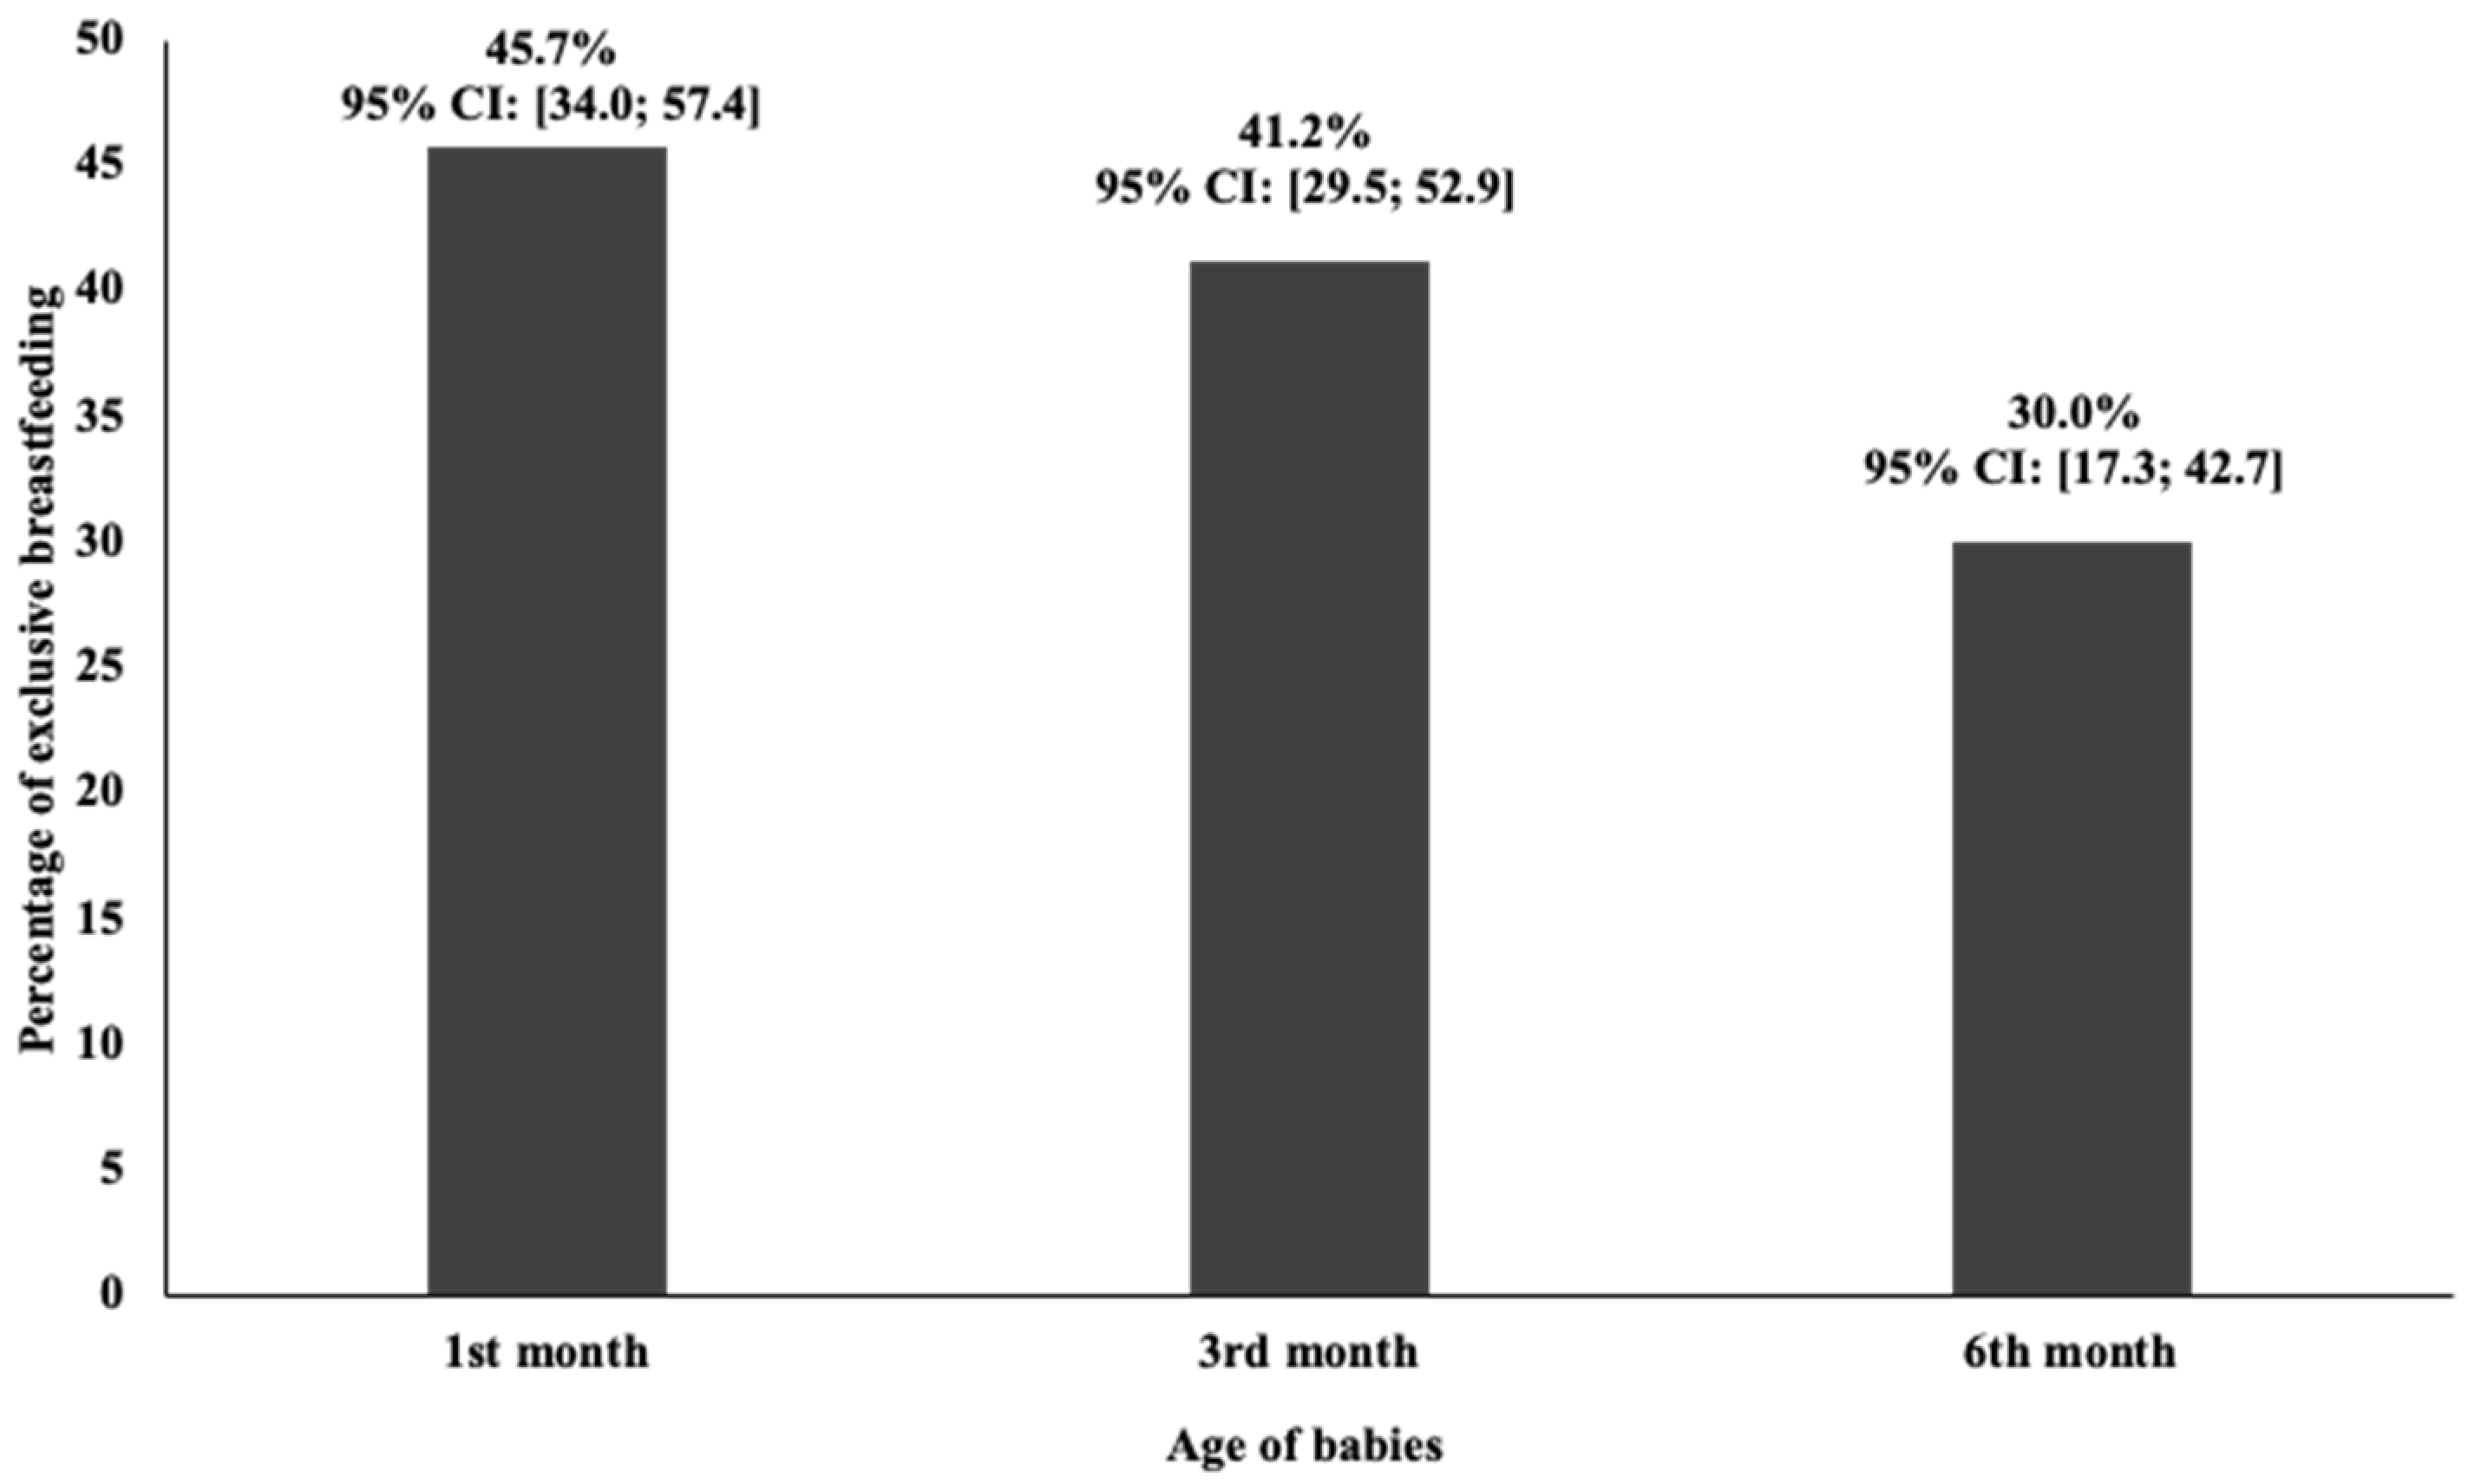
3.3. Breast Milk and Other Fluids Intake
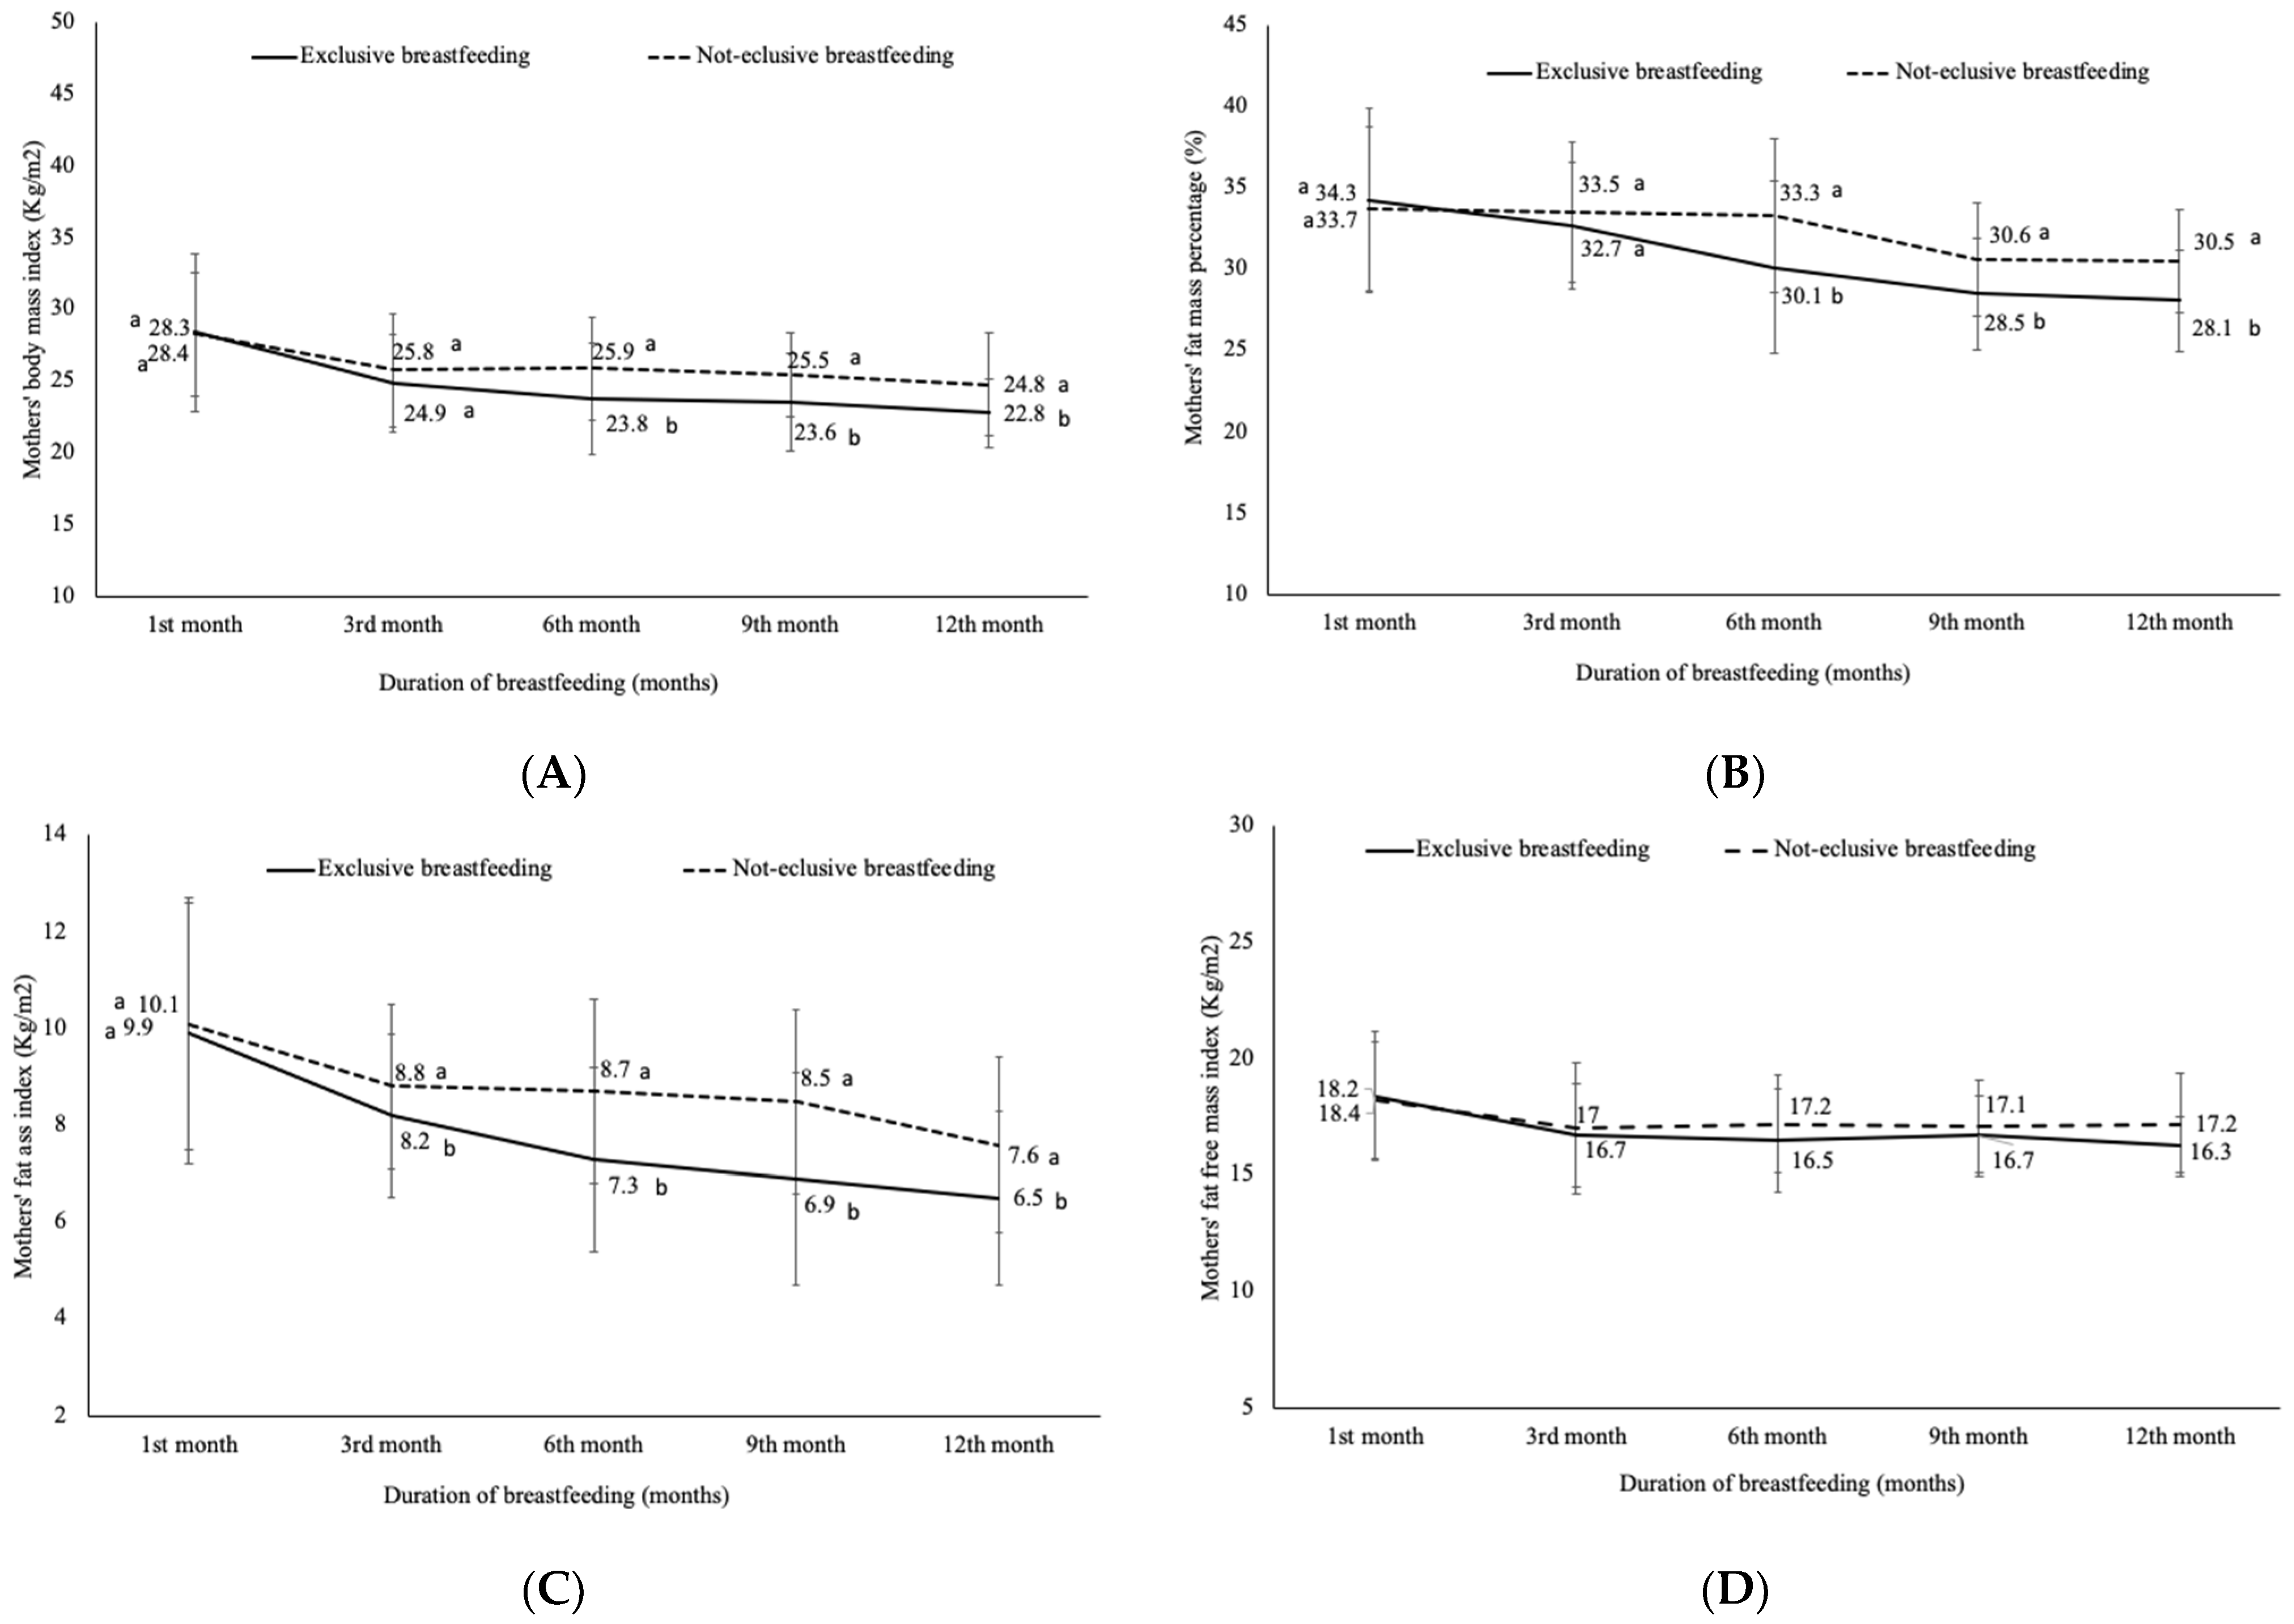
3.4. Assessment of the Body Composition of Mothers
4. Discussion
5. Conclusions
Author Contributions
Funding
Informed Consent Statement
Acknowledgments
Conflicts of Interest
References
- World Health Organization. WHO: Genève, Switzerland, 2003. Available online: http://www.who.int/nutrition/publications/gs_infant_feeding_text_eng.pdf (accessed on 3 December 2019).
- Institute of Medicine Nutrition during Lactation; The National Academies Press: Washington, DC, USA, 1991.
- Williamson, D.F.; Madans, J.; Pamuk, E.; Flegal, K.M.; Kendrick, J.S.; Serdula, M.K. A prospective study of childbearing and 10-year weight gain in US white women 25 to 45 years of age. Int. J. Obes. Relat. Metab. Disord. J. Int. Assoc. Study Obes. 1994, 18, 561–569. [Google Scholar]
- Gunderson, E.P.; Abrams, B. Epidemiology of Gestational Weight Gain and Body Weight Changes after Pregnancy. Epidemiol. Rev. 1999, 21, 261–275. [Google Scholar] [CrossRef]
- Crowell, D. Weight change in the postpartum period a review of the literature. J. Nurse-Midwifery 1995, 40, 418–423. [Google Scholar] [CrossRef]
- Gore, S.A.; Brown, D.M.; West, D.S. The role of postpartum weight retention in obesity among women: A review of the evidence. Ann. Behav. Med. 2003, 26, 149–159. [Google Scholar] [CrossRef]
- James, W.P.T.; Ralph, A. New understanding in obesity research. Proc. Nutr. Soc. 1999, 58, 385–393. [Google Scholar] [CrossRef]
- Mattei, J.; Sotres-Alvarez, D.; Daviglus, M.L.; Gallo, L.C.; Gellman, M.; Hu, F.B.; Tucker, K.L.; Willett, W.C.; Siega-Riz, A.M.; Van Horn, L.; et al. Diet Quality and Its Association with Cardiometabolic Risk Factors Vary by Hispanic and Latino Ethnic Background in the Hispanic Community Health Study/Study of Latinos. J. Nutr. 2016, 146, 2035–2044. [Google Scholar] [CrossRef]
- Larciprete, G.; Valensise, H.; Vasapollo, B.; Di Pierro, G.; Menghini, S.; Magnani, F.; De Lorenzo, A.; Arduini, D. Maternal body composition at term gestation and birth weight: Is there a link? Acta Diabetol. 2003, 40, s222–s224. [Google Scholar] [CrossRef] [PubMed]
- Mardones, F.; Salazar, G.; Rosso, P.; Villarroel, L. Maternal Body Composition near Term and Birth Weight. Obstet. Gynecol. 1998, 91, 873–877. [Google Scholar] [CrossRef]
- Okorodudu, D.; Jumean, M.F.; Montori, V.M.; Romero-Corral, A.; Somers, V.K.; Erwin, P.J.; Lopez-Jimenez, F. Diagnostic performance of body mass index to identify obesity as defined by body adiposity: A systematic review and meta-analysis. Int. J. Obes. 2010, 34, 791–799. [Google Scholar] [CrossRef]
- Kyle, U.G.; Schutz, Y.; Dupertuis, Y.M.; Pichard, C. Body composition interpretation: Contributions of the fat-free mass index and the body fat mass index. Nutrition 2003, 19, 597–604. [Google Scholar] [CrossRef]
- Kyle, U.G.; Morabia, A.; Schutz, Y.; Pichard, C. Sedentarism affects body fat mass index and fat-free mass index in adults aged 18 to 98 years. Nutrition 2004, 20, 255–260. [Google Scholar] [CrossRef] [PubMed]
- Schutz, Y.; Kyle, U.U.G.; Pichard, C. Fat-free mass index and fat mass index percentiles in Caucasians aged 18–98 y. Int. J. Obes. 2002, 26, 953–960. [Google Scholar] [CrossRef] [PubMed]
- Alpízar, M.; Frydman, T.D.; Reséndiz-Rojas, J.D.J.; Trejo-Rangel, M.A.; De Aldecoa-Castillo, J.M. Fat Mass Index (FMI) as a Trustworthy Overweight and Obesity Marker in Mexican Pediatric Population. Children 2020, 7, 19. [Google Scholar] [CrossRef] [PubMed]
- Peltz, G.; Aguirre, M.T.; Sanderson, M.; Fadden, M.K. The role of fat mass index in determining obesity. Am. J. Hum. Biol. 2010, 22, 639–647. [Google Scholar] [CrossRef] [PubMed]
- Ministère de la Santé Marocain. Enquête Nationale sur la Population et la Santé de la Famille. 2011. Available online: http://www.sante.gov.ma/Publications/Etudes_enquete/Documents/Rapport%20synthese_ENPSF-2011.pdf (accessed on 26 March 2020).
- Ministère de la Santé Marocain. Enquête Nationale sur la Population et la Santé de la Famille (ENPSF 2018). 2018. 2ème Édition. Available online: https://www.sante.gov.ma/Publications/Etudes_enquete/Pages/default.aspx (accessed on 26 March 2020).
- Direction de la Population. Programme National de la Nutrition, Ministère de la Santé. 2019. Available online: https://www.sante.gov.ma/Publications/Guides-Manuels/Pages/default.aspx (accessed on 14 February 2020).
- Barkat, A.; Lyaghfouri, A.; Mdaghri Alaoui, A.; Lamdouar Bouazzaoui, N. Une Réflexion sur l’allaitement Maternel au Maroc. Le Guide de la Médecine et de la Santé au Maroc. 2004. Available online: http://www.albacharia.ma/xmlui/bitstream/handle/123456789/31839/1777Une_reflexion_sur_l_allaitement_maternel_au_Maroc_%282004%29.html?sequence=1 (accessed on 3 March 2020).
- International Atomic Energy Agency. Stable Isotope Technique to Assess Intake of Human Milk in Breastfed Infants, Human Health. 2010. Available online: https://www-pub.iaea.org/MTCD/Publications/PDF/Pub1429_web.pdf (accessed on 7 October 2020).
- Coward, W.A.; Cole, T.J.; Sawyer, M.B.; Prentice, A.M. Breast-milk intake measurement in mixed-fed infants by administration of deuterium oxide to their mothers. Hum. Nutr. Clin. Nutr. 1982, 36, 141–148. [Google Scholar] [PubMed]
- Haisma, H.; Coward, W.A.; Albernaz, E.; Visser, G.H.; Wells, J.C.K.; Wright, A.; Victora, C.G. Breast milk and energy intake in exclusively, predominantly, and partially breast-fed infants. Eur. J. Clin. Nutr. 2003, 57, 1633–1642. [Google Scholar] [CrossRef] [PubMed]
- Neville, C.E.; McKinley, M.C.; Holmes, V.A.; Spence, D.W.; Woodside, J.V. The relationship between breastfeeding and postpartum weight change—a systematic review and critical evaluation. Int. J. Obes. 2013, 38, 577–590. [Google Scholar] [CrossRef]
- Medoua, G.N.; Nana, E.C.S.; Ndzana, A.C.A.; Makamto, C.S.; Etame, L.S.; Rikong, H.A.; Oyono, J.L.E. Breastfeeding practices of Cameroonian mothers determined by dietary recall since birth and the dose-to-the-mother deuterium-oxide turnover technique. Matern. Child Nutr. 2011, 8, 330–339. [Google Scholar] [CrossRef]
- World Health Organization. Multicenter Growth Reference study Group: WHO Child Growth Standards: Length/height-for-Age, Weight-for-Age, Weight-for-Length, Weight-for-Height and Body Mass Index-for-Age: Methods and Development; World Health Organization: Geneva, Switzerland, 2006. [Google Scholar]
- Liu, Z.; Diana, A.; Slater, C.; Preston, T.; Gibson, R.S.; Houghton, L.; Duffull, S.B. Development of a nonlinear hierarchical model to describe the disposition of deuterium in mother–infant pairs to assess exclusive breastfeeding practice. J. Pharmacokinet. Pharmacodyn. 2019, 46, 1–13. [Google Scholar] [CrossRef]
- Slater, C.; Kaestel, P.; Houghton, L. Assessing Breastfeeding Practices Objectively Using Stable Isotope Techniques. Ann. Nutr. Metab. 2019, 75, 109–113. [Google Scholar] [CrossRef]
- Deurenberg, P.; Yap, M.; Van Staveren, W.A. Body mass index and percent body fat: A meta analysis among different ethnic groups. Int. J. Obes. 1998, 22, 1164–1171. [Google Scholar] [CrossRef] [PubMed]
- World Health Organization. Who Technical Report Series 854. Physical Status: The Use and interpretation of anthropometry. In Report of a WHO Consultation; World Health Organization: Geneva, Switzerland, 1995. [Google Scholar]
- De Lorenzo, A.; Deurenberg, P.; Pietrantuono, M.; Di Daniele, N.; Cervelli, V.; Andreoli, A. How fat is obese? Acta Diabetol. 2003, 40, s254–s257. [Google Scholar] [CrossRef] [PubMed]
- Liu, P.; Ma, F.; Lou, H.; Liu, Y. The utility of fat mass index vs. body mass index and percentage of body fat in the screening of metabolic syndrome. BMC Public Heal. 2013, 13, 629. [Google Scholar] [CrossRef] [PubMed]
- International Atomic Energy Agency. Guidance Notes on Evaluation of Data in the Excel Spreadsheet to Calculate Human Milk Intake by Breastfed Infants. IAEA Austria. 2014. Available online: https://humanhealth.iaea.org/HHW/Nutrition/MilkIntake/Draft_Guidance_notes_on_evaluation_of_data_in_the_Excel_spreadsheet_06_Feb_2015_English_docx.pdf (accessed on 27 October 2020).
- Moore, S.E.; Prentice, A.M.; Coward, W.A.; Wright, A.; Frongillo, A.E.; Fulford, A.J.; Mander, A.P.; Persson, L.Å.; El Arifeen, S.; Kabir, I. Use of stable-isotope techniques to validate infant feeding practices reported by Bangladeshi women receiving breastfeeding counseling. Am. J. Clin. Nutr. 2007, 85, 1075–1082. [Google Scholar] [CrossRef]
- Reilly, J.J.; Ashworth, S.; Wells, J.C.K. Metabolisable energy consumption in the exclusively breast-fed infant aged 3–6 months from the developed world: A systematic review. Br. J. Nutr. 2005, 94, 56–63. [Google Scholar] [CrossRef]
- Da Costa, T.H.M.; Haisma, H.; Wells, J.C.K.; Mander, A.P.; Whitehead, R.G.; Bluck, L.J.C. How Much Human Milk Do Infants Consume? Data from 12 Countries Using a Standardized Stable Isotope Methodology. J. Nutr. 2010, 140, 2227–2232. [Google Scholar] [CrossRef]
- World Health Organization. Nutrient Adequacy of Exclusive Breastfeeding for the Term Infant during the First Six Months of Life; WHO: Geneva, Switzerland, 2002; Available online: http://www.who.int/child-adolescent-health/publications/NUTRITION/Nutrient_Adequacy.html (accessed on 29 January 2020).
- Kent, J.C.; Mitoulas, L.; Cox, D.B.; Owens, R.A.; Hartmann, P.E. Breast volume and milk production during extended lactation in women. Exp. Physiol. 1999, 84, 435–447. [Google Scholar] [CrossRef]
- Nazlee, N.; Bilal, R.; Latif, Z.; Bluck, L. Maternal Body Composition and Its Relationship to Infant Breast Milk Intake in Rural Pakistan. Food Nutr. Sci. 2011, 2, 932–937. [Google Scholar] [CrossRef]
- Stuff, J.E.; Garza, C.; Boutte, C.; Fraley, J.K.; O’Smith, E.; Klein, E.R.; Nichols, B.L. Sources of variance in milk and caloric intakes in breast-fed infants: Implications for lactation study design and interpretation. Am. J. Clin. Nutr. 1986, 43, 361–366. [Google Scholar] [CrossRef]
- Pao, E.M.; Himes, J.M.; Roche, A.F. Milk intakes and feeding patterns of breast-fed infants. J. Am. Diet. Assoc. 1980, 77, 540–545. [Google Scholar]
- Villalpando, S.F.; Butte, N.F.; Wong, W.W.; Flores-Huerta, S.; Hernandez-Beltran, M.J.; Smith, E.O.; Garza, C. Lactation performance of rural Mesoamerindians. Eur. J. Clin. Nutr. 1992, 46, 337–348. [Google Scholar] [PubMed]
- Piwoz, E.G.; Creed de Kanashiro, H.; Lopez de Romana, G.; Black, R.E.; Brown, K.H. Potential for misclassification of in-fants’ usual feeding practices using 24-hour dietary assessment methods. J. Nutr. 1995, 125, 57–65. [Google Scholar] [CrossRef] [PubMed]
- World Health Organization. Indicators for Assessing Breast- Feeding Practices. In Proceedings of the Reprinted Report of an Informal Meeting, Geneva, Switzerland, 11–12 June 1991. [Google Scholar]
- Gunderson, E.P.; Abrams, B.; Selvin, S. The relative importance of gestational gain and maternal characteristics associated with the risk of becoming overweight after pregnancy. Int. J. Obes. 2000, 24, 1660–1668. [Google Scholar] [CrossRef] [PubMed]
- Frankenfield, D.C.; Rowe, W.A.; Cooney, R.N.; Smith, J.; Becker, D. Limits of body mass index to detect obesity and predict body composition. Nutrition 2001, 17, 26–30. [Google Scholar] [CrossRef]
- Butte, N.F.; Hopkinson, J.M. Body Composition Changes during Lactation Are Highly Variable among Women. J. Nutr. 1998, 128, 381S–385S. [Google Scholar] [CrossRef]
- Hatsu, I.E.; McDougald, D.M.; Anderson, A.K. Effect of infant feeding on maternal body composition. Int. Breastfeed. J. 2008, 3, 18. [Google Scholar] [CrossRef]
- Robinson, J.J. Changes in body composition during pregnancy and lactation. Proc. Nutr. Soc. 1986, 45, 71–80. [Google Scholar] [CrossRef]
- Janney, C.A.; Zhang, D.; Sowers, M. Lactation and weight retention. Am. J. Clin. Nutr. 1997, 66, 1116–1124. [Google Scholar] [CrossRef]
- Dewey, K.G.; Heinig, M.J.; Nommsen, A.L. Maternal weight-loss patterns during prolonged lactation. Am. J. Clin. Nutr. 1993, 58, 162–166. [Google Scholar] [CrossRef]
- Dewey, K.G.; Cohen, R.J.; Brown, K.H.; Rivera, L.L. Effects of Exclusive Breastfeeding for Four versus Six Months on Maternal Nutritional Status and Infant Motor Development: Results of Two Randomized Trials in Honduras. J. Nutr. 2001, 131, 262–267. [Google Scholar] [CrossRef]
- Adair, L.S.; Popkin, B.M. Prolonged Lactation Contributes to Depletion of Maternal Energy Reserves in Filipino Women. J. Nutr. 1992, 122, 1643–1655. [Google Scholar] [CrossRef] [PubMed]
- Winkvist, A.; Rasmussen, K.M. Impact of lactation on maternal body weight and body composition. J. Mammary Gland. Biol. Neoplasia 1999, 4, 309–318. [Google Scholar] [CrossRef] [PubMed]
- U.S. Department of Health and Human Services. The Surgeon General’s Call to Action to Support Breastfeeding; U.S. Department of Health and Human Services, Office of the Surgeon General: Washington, DC, USA, 2011.
- Falivene, M.A.; Orden, A.B. Maternal behavioral factors influencing postpartum weight retention. Clinical and metabolic implications. Rev. Bras. Saúde Matern. Infant. 2017, 17, 251–259. [Google Scholar] [CrossRef][Green Version]
- Gould Rothberg, B.; Magriples, U.; Kershaw, T.; Rising, S.S.; Ickovics, J.R. Gestational weight gain and subsequent postpartum weight loss among young, low-income, ethnic minority women. Am. J. Obstet. Gynecol. 2011, 204, e1–e11. [Google Scholar] [CrossRef] [PubMed]
- Gunderson, E.P.; Rifas-Shiman, S.L.; Oken, E.; Rich-Edwards, J.W.; Kleinman, K.; Taveras, E.M.; Gillman, M.W. Association of Fewer Hours of Sleep at 6 Months Postpartum with Substantial Weight Retention at 1 Year Postpartum. Am. J. Epidemiol. 2007, 167, 178–187. [Google Scholar] [CrossRef] [PubMed]
- Nuss, H.; Clarke, K.; Klohe-Lehman, D.; Freeland-Graves, J. Influence of Nutrition Attitudes and Motivators for Eating on Postpartum Weight Status in Low-Income New Mothers. J. Am. Diet. Assoc. 2006, 106, 1774–1782. [Google Scholar] [CrossRef]
- Bradshaw, M.K.; Pfeiffer, S. Feeding mode and anthropometric changes in primiparas. Hum. Biol. 1988, 60, 251–261. [Google Scholar]
- To, W.W.K.; Wong, M.W.N. Body fat composition and weight changes during pregnancy and 6–8 months post-partum in primiparous and multiparous women. Aust. N. Z. J. Obstet. Gynaecol. 2009, 49, 34–38. [Google Scholar] [CrossRef]


| 1st Month | 3rd Month | 6th Month | 9th Month | 12th Month | |
|---|---|---|---|---|---|
| Babies’ weight (kg) | 4.7 ± 0.5 | 6.4 ± 1.0 | 8.1 ± 1.1 | 8.8 ± 0.9 | 9.5 ± 1.0 |
| Babies’ height (cm) | 52.6 ± 3.1 | 60.6 ± 3.5 | 64.9 ± 3.6 | 68.8 ± 4.7 | 73.6 ± 3.4 |
| WHZ | 1.27 ± 1.13 | 0.60 ± 1.34 | 1.40 ± 1.26 | 1.35 ± 1.40 | 0.57 ± 0.77 |
| WAZ | 0.28 ± 0.94 | 0.37 ± 1.27 | 0.55 ± 1.22 | 0.39 ± 1.00 | 0.18 ± 0.95 |
| HAZ | −0.65 ± 1.58 | 0.08 ± 1.47 | −0.72 ± 1.38 | −0.88 ± 1.24 | −0.47 ± 1.05 |
| BAZ | 0.95 ± 0.77 | 0.47 ± 1.24 | 1.23 ± 1.27 | 1.21 ± 1.41 | 0.63 ± 0.84 |
| Mothers’ age (years) median [Min; Max] | 30 [18; 41] | - | - | - | - |
| Mothers’ weight (kg) | 73.8 ± 11.8 | 66.6 ± 11.9 | 64.9 ± 11.6 | 64.0 ± 12.1 | 62.3 ± 12.1 |
| Mothers’ height (m) | 1.59 ± 0.07 | - | - | - | - |
| Mother’s education level | - | - | - | - | |
| No formal school, or primary school | 48.6% | ||||
| Secondary school | 35.7% | ||||
| High school or university | 15.7% |
| HMI (g/Day) | NMOI (g/Day) | TWI (g/Day) | MSE (mg/kg) | |
|---|---|---|---|---|
| 1st month | 437.8 ± 110.7 | 142.0 ± 145.5 | 563.3 ± 123.1 | 38,5 ± 14.5 |
| 3rd month | 585.6 ± 146.0 | 188.3 ± 169.7 | 751.4 ± 106.1 | 32.2 ± 13.3 |
| 6th month | 604.2± 142.5 | 265.4 ± 196.8 | 846.4 ± 107.7 | 28.8 ± 12.5 |
| 9th month | 512.2 ± 141.3 | 442.5 ± 136.0 | 935.0 ± 119.2 | 39.9 ± 12.9 |
| 12th month | 435.3 ± 100.7 | 659.8 ± 154.9 | 1078.3 ± 99.3 | 26.7 ± 11.4 |
| Exclusive Breastfeeding | Not-Exclusive Breastfeeding | p-Value | |
|---|---|---|---|
| 1st month | |||
| HMI (g/day) | 492.4 ± 109.1 | 383.7 ± 112.2 | 0.003 |
| NMOI (g/day) | 21.4 ± 21.8 | 252.6 ± 142.0 | <0.001 |
| TWI (g/day) | 494.8 ± 108.1 | 621.5 ± 129.0 | 0.002 |
| 3rd month | |||
| HMI (g/day) | 688.2 ± 94.3 | 531.3 ± 132.7 | <0.001 |
| NMOI (g/day) | 28.9 ± 25.4 | 255.5 ± 134.2 | <0.001 |
| TWI (g/day) | 690.6 ± 94.3 | 765.9 ± 93.2 | <0.001 |
| 6th month | |||
| HMI (g/day) | 733.3 ± 88.8 | 548.9 ± 123.7 | 0.003 |
| NMOI (g/day) | 45.0 ± 31.5 | 359.8 ± 157.4 | <0.001 |
| TWI (g/day) | 750.1 ± 91.3 | 887.6 ± 84.9 | 0.08 |
Publisher’s Note: MDPI stays neutral with regard to jurisdictional claims in published maps and institutional affiliations. |
© 2021 by the authors. Licensee MDPI, Basel, Switzerland. This article is an open access article distributed under the terms and conditions of the Creative Commons Attribution (CC BY) license (http://creativecommons.org/licenses/by/4.0/).
Share and Cite
Rabi, B.; Benjeddou, K.; Idrissi, M.; Rami, A.; Mekkaoui, B.; El Hamdouchi, A.; Benkirane, H.; Barkat, A.; Saeid, N.; El Kari, K.; et al. Effects of Breastfeeding on Maternal Body Composition in Moroccan Lactating Women during Twelve Months after Birth Using Stable Isotopic Dilution Technique. Nutrients 2021, 13, 146. https://doi.org/10.3390/nu13010146
Rabi B, Benjeddou K, Idrissi M, Rami A, Mekkaoui B, El Hamdouchi A, Benkirane H, Barkat A, Saeid N, El Kari K, et al. Effects of Breastfeeding on Maternal Body Composition in Moroccan Lactating Women during Twelve Months after Birth Using Stable Isotopic Dilution Technique. Nutrients. 2021; 13(1):146. https://doi.org/10.3390/nu13010146
Chicago/Turabian StyleRabi, Baha, Kaoutar Benjeddou, Mohamed Idrissi, Anass Rami, Bouchera Mekkaoui, Asmaa El Hamdouchi, Hasnae Benkirane, Amina Barkat, Naima Saeid, Khalid El Kari, and et al. 2021. "Effects of Breastfeeding on Maternal Body Composition in Moroccan Lactating Women during Twelve Months after Birth Using Stable Isotopic Dilution Technique" Nutrients 13, no. 1: 146. https://doi.org/10.3390/nu13010146
APA StyleRabi, B., Benjeddou, K., Idrissi, M., Rami, A., Mekkaoui, B., El Hamdouchi, A., Benkirane, H., Barkat, A., Saeid, N., El Kari, K., & Aguenaou, H. (2021). Effects of Breastfeeding on Maternal Body Composition in Moroccan Lactating Women during Twelve Months after Birth Using Stable Isotopic Dilution Technique. Nutrients, 13(1), 146. https://doi.org/10.3390/nu13010146