The Role of Polymorphisms in Vitamin D-Related Genes in Response to Vitamin D Supplementation

 , , , and
Abstract
1. Introduction
2. Materials and Methods
2.1. Study Subjects
2.2. Anthropometric Measures
2.3. Genetic Analysis of Polymorphisms Related to Vitamin D
2.4. Data Analysis
3. Results
4. Discussion
5. Conclusions
Supplementary Materials
Author Contributions
Funding
Acknowledgments
Conflicts of Interest
Abbreviations
| ALT | Alanine Aminotransferase |
| AST | Aspartate Aminotransferase |
| BMI | Body Mass Index |
| BUN | Blood Urea Nitrogen |
| HWE | Hardy–Weinberg Equilibrium |
| IFC | Integrated Fluidic Circuit |
| IRB | Institutional Review Board |
| LD | Linkage Disequilibrium |
| LSP | Locus-Specific Primer |
| PCR | Polymerase Chain Reaction |
| SNP | Single-Nucleotide Polymorphism |
| STA | Specific Target Amplification |
| TFBS | Transcription Factor Binding Site |
| PCA | Principal Component Analysis |
| QU | Qatar University |
| WC | Waist Circumference |
| 1000G | 1000 Genomes |
References
- Santoro, D.; Caccamo, D.; Lucisano, S.; Buemi, M.; Sebekova, K.; Teta, D.; De Nicola, L. Interplay of vitamin D, erythropoiesis, and the renin-angiotensin system. Biomed. Res. Int. 2015, 2015, 145828. [Google Scholar] [CrossRef] [PubMed]
- Holick, M.F. The vitamin D deficiency pandemic: Approaches for diagnosis, treatment and prevention. Rev. Endocr. Metab. Disord. 2017, 18, 153–165. [Google Scholar] [CrossRef] [PubMed]
- DeLuca, H.F. Vitamin D: Historical overview. Vitam. Horm. 2016, 100, 1–20. [Google Scholar] [CrossRef] [PubMed]
- Jones, G.; Strugnell, S.A.; DeLuca, H.F. Current understanding of the molecular actions of vitamin D. Physiol. Rev. 1998, 78, 1193–1231. [Google Scholar] [CrossRef] [PubMed]
- Elkum, N.; Alkayal, F.; Noronha, F.; Ali, M.M.; Melhem, M.; Al-Arouj, M.; Bennakhi, A.; Behbehani, K.; Alsmadi, O.; Abubaker, J. Vitamin D insufficiency in Arabs and South Asians positively associates with polymorphisms in GC and CYP2R1 genes. PLoS ONE 2014, 9, e113102. [Google Scholar] [CrossRef] [PubMed]
- Holick, M.F. Vitamin D deficiency. N. Engl. J. Med. 2007, 357, 266–281. [Google Scholar] [CrossRef]
- Erol, M.; Yigit, O.; Kucuk, S.H.; Bostan Gayret, O. Vitamin D deficiency in children and adolescents in Bagcilar, Istanbul. J. Clin. Res. Pediatr. Endocrinol. 2015, 7, 134–139. [Google Scholar] [CrossRef]
- Djennane, M.; Lebbah, S.; Roux, C.; Djoudi, H.; Cavalier, E.; Souberbielle, J.C. Vitamin D status of schoolchildren in Northern Algeria, seasonal variations and determinants of vitamin D deficiency. Osteoporos. Int. 2014, 25, 1493–1502. [Google Scholar] [CrossRef]
- Flores, M.; Macias, N.; Lozada, A.; Sanchez, L.M.; Diaz, E.; Barquera, S. Serum 25-hydroxyvitamin D levels among Mexican children ages 2 y to 12 y: A national survey. Nutrition 2013, 29, 802–804. [Google Scholar] [CrossRef]
- Vierucci, F.; Del Pistoia, M.; Fanos, M.; Gori, M.; Carlone, G.; Erba, P.; Massimetti, G.; Federico, G.; Saggese, G. Vitamin D status and predictors of hypovitaminosis D in Italian children and adolescents: A cross-sectional study. Eur. J. Pediatr. 2013, 172, 1607–1617. [Google Scholar] [CrossRef]
- Singh, P.; Kumar, M.; Al Khodor, S. Vitamin D deficiency in the gulf cooperation council: Exploring the triad of genetic predisposition, the gut microbiome and the immune system. Front. Immunol. 2019, 10, 1042. [Google Scholar] [CrossRef] [PubMed]
- Maalouf, G.; Gannage-Yared, M.H.; Ezzedine, J.; Larijani, B.; Badawi, S.; Rached, A.; Zakroui, L.; Masri, B.; Azar, E.; Saba, E.; et al. Middle East and North Africa consensus on osteoporosis. J. Musculoskelet. Neuronal. Interact. 2007, 7, 131–143. [Google Scholar] [PubMed]
- Chakhtoura, M.; Rahme, M.; Chamoun, N.; El-Hajj Fuleihan, G. Vitamin D in the Middle East and North Africa. Bone Rep. 2018, 8, 135–146. [Google Scholar] [CrossRef] [PubMed]
- Masoud, M.S.; Alokail, M.S.; Yakout, S.M.; Khattak, M.N.K.; AlRehaili, M.M.; Wani, K.; Al-Daghri, N.M. Vitamin D supplementation modestly reduces serum iron indices of healthy Arab Adolescents. Nutrients 2018, 10, 1870. [Google Scholar] [CrossRef]
- Bassil, D.; Rahme, M.; Hoteit, M.; Fuleihan Gel, H. Hypovitaminosis D in the Middle East and North Africa: Prevalence, risk factors and impact on outcomes. Dermatoendocrinology 2013, 5, 274–298. [Google Scholar] [CrossRef]
- Deluca, H.F. History of the discovery of vitamin D and its active metabolites. Bonekey. Rep. 2014, 3, 479. [Google Scholar] [CrossRef]
- Dusso, A.S.; Brown, A.J.; Slatopolsky, E. Vitamin D. Am. J. Physiol. Renal. Physiol. 2005, 289, F8–F28. [Google Scholar] [CrossRef]
- Berlanga-Taylor, A.J.; Plant, K.; Dahl, A.; Lau, E.; Hill, M.; Sims, D.; Heger, A.; Emberson, J.; Armitage, J.; Clarke, R.; et al. Genomic response to vitamin d supplementation in the setting of a randomized, placebo-controlled trial. EBioMedicine 2018, 31, 133–142. [Google Scholar] [CrossRef]
- Al-Daghri, N.M.; Yakout, S.M.; Wani, K.; Khattak, M.N.K.; Garbis, S.D.; Chrousos, G.P.; Al-Attas, O.S.; Alokail, M.S. IGF and IGFBP as an index for discrimination between vitamin D supplementation responders and nonresponders in overweight Saudi subjects. Medicine (Baltim.) 2018, 97, e0702. [Google Scholar] [CrossRef]
- Kurylowicz, A.; Ramos-Lopez, E.; Bednarczuk, T.; Badenhoop, K. Vitamin D-binding protein (DBP) gene polymorphism is associated with Graves’ disease and the vitamin D status in a Polish population study. Exp. Clin. Endocrinol. Diabetes 2006, 114, 329–335. [Google Scholar] [CrossRef]
- Ramos-Lopez, E.; Bruck, P.; Jansen, T.; Herwig, J.; Badenhoop, K. CYP2R1 (vitamin D 25-hydroxylase) gene is associated with susceptibility to type 1 diabetes and vitamin D levels in Germans. Diabetes Metab. Res. Rev. 2007, 23, 631–636. [Google Scholar] [CrossRef] [PubMed]
- Wang, T.J.; Zhang, F.; Richards, J.B.; Kestenbaum, B.; van Meurs, J.B.; Berry, D.; Kiel, D.P.; Streeten, E.A.; Ohlsson, C.; Koller, D.L.; et al. Common genetic determinants of vitamin D insufficiency: A genome-wide association study. Lancet 2010, 376, 180–188. [Google Scholar] [CrossRef]
- Arabi, A.; Khoueiry-Zgheib, N.; Awada, Z.; Mahfouz, R.; Al-Shaar, L.; Hoteit, M.; Rahme, M.; Baddoura, R.; Halabi, G.; Singh, R.; et al. CYP2R1 polymorphisms are important modulators of circulating 25-hydroxyvitamin D levels in elderly females with vitamin insufficiency, but not of the response to vitamin D supplementation. Osteoporos. Int. 2017, 28, 279–290. [Google Scholar] [CrossRef]
- Zhang, Y.; Wang, X.; Liu, Y.; Qu, H.; Qu, S.; Wang, W.; Ren, L. The GC, CYP2R1 and DHCR7 genes are associated with vitamin D levels in northeastern Han Chinese children. Swiss Med. Wkly. 2012, 142, w13636. [Google Scholar] [CrossRef] [PubMed]
- Bu, F.X.; Armas, L.; Lappe, J.; Zhou, Y.; Gao, G.; Wang, H.W.; Recker, R.; Zhao, L.J. Comprehensive association analysis of nine candidate genes with serum 25-hydroxy vitamin D levels among healthy Caucasian subjects. Hum. Genet. 2010, 128, 549–556. [Google Scholar] [CrossRef] [PubMed]
- Ahn, J.; Yu, K.; Stolzenberg-Solomon, R.; Simon, K.C.; McCullough, M.L.; Gallicchio, L.; Jacobs, E.J.; Ascherio, A.; Helzlsouer, K.; Jacobs, K.B.; et al. Genome-wide association study of circulating vitamin D levels. Hum. Mol. Genet. 2010, 19, 2739–2745. [Google Scholar] [CrossRef]
- Nissen, J.; Rasmussen, L.B.; Ravn-Haren, G.; Andersen, E.W.; Hansen, B.; Andersen, R.; Mejborn, H.; Madsen, K.H.; Vogel, U. Common variants in CYP2R1 and GC genes predict vitamin D concentrations in healthy Danish children and adults. PLoS ONE 2014, 9, e89907. [Google Scholar] [CrossRef]
- Signorello, L.B.; Shi, J.; Cai, Q.; Zheng, W.; Williams, S.M.; Long, J.; Cohen, S.S.; Li, G.; Hollis, B.W.; Smith, J.R.; et al. Common variation in vitamin D pathway genes predicts circulating 25-hydroxyvitamin D Levels among African Americans. PLoS ONE 2011, 6, e28623. [Google Scholar] [CrossRef]
- Wjst, M.; Altmuller, J.; Faus-Kessler, T.; Braig, C.; Bahnweg, M.; Andre, E. Asthma families show transmission disequilibrium of gene variants in the vitamin D metabolism and signalling pathway. Respir. Res. 2006, 7, 60. [Google Scholar] [CrossRef]
- Hibler, E.A.; Klimentidis, Y.C.; Jurutka, P.W.; Kohler, L.N.; Lance, P.; Roe, D.J.; Thompson, P.A.; Jacobs, E.T. CYP24A1 and CYP27B1 polymorphisms, concentrations of vitamin D metabolites, and odds of colorectal adenoma recurrence. Nutr. Cancer 2015, 67, 1131–1141. [Google Scholar] [CrossRef]
- Wu, X.; Cheng, J.; Yang, K. Vitamin D-related gene polymorphisms, plasma 25-hydroxy-vitamin D, Cigarette Smoke and Non-Small Cell Lung Cancer (NSCLC) risk. Int. J. Mol. Sci. 2016, 17, 1597. [Google Scholar] [CrossRef] [PubMed]
- Engelman, C.D.; Fingerlin, T.E.; Langefeld, C.D.; Hicks, P.J.; Rich, S.S.; Wagenknecht, L.E.; Bowden, D.W.; Norris, J.M. Genetic and environmental determinants of 25-hydroxyvitamin D and 1,25-dihydroxyvitamin D levels in Hispanic and African Americans. J. Clin. Endocrinol. Metab. 2008, 93, 3381–3388. [Google Scholar] [CrossRef] [PubMed]
- Hu, Z.; Tao, S.; Liu, H.; Pan, G.; Li, B.; Zhang, Z. The association between polymorphisms of vitamin D metabolic-related genes and vitamin D3 supplementation in type 2 diabetic patients. J. Diabetes Res. 2019, 2019, 8289741. [Google Scholar] [CrossRef]
- Penna-Martinez, M.; Ramos-Lopez, E.; Stern, J.; Kahles, H.; Hinsch, N.; Hansmann, M.L.; Selkinski, I.; Grunwald, F.; Vorlander, C.; Bechstein, W.O.; et al. Impaired vitamin D activation and association with CYP24A1 haplotypes in differentiated thyroid carcinoma. Thyroid 2012, 22, 709–716. [Google Scholar] [CrossRef] [PubMed]
- Orton, S.M.; Morris, A.P.; Herrera, B.M.; Ramagopalan, S.V.; Lincoln, M.R.; Chao, M.J.; Vieth, R.; Sadovnick, A.D.; Ebers, G.C. Evidence for genetic regulation of vitamin D status in twins with multiple sclerosis. Am. J. Clin. Nutr. 2008, 88, 441–447. [Google Scholar] [CrossRef]
- Kuhn, T.; Kaaks, R.; Teucher, B.; Hirche, F.; Dierkes, J.; Weikert, C.; Katzke, V.; Boeing, H.; Stangl, G.I.; Buijsse, B. Plasma 25-hydroxyvitamin D and its genetic determinants in relation to incident myocardial infarction and stroke in the European prospective investigation into cancer and nutrition (EPIC)-Germany study. PLoS ONE 2013, 8, e69080. [Google Scholar] [CrossRef]
- Miettinen, M.E.; Smart, M.C.; Kinnunen, L.; Keinanen-Kiukaanniemi, S.; Moilanen, L.; Puolijoki, H.; Saltevo, J.; Oksa, H.; Hitman, G.A.; Tuomilehto, J.; et al. The effect of age and gender on the genetic regulation of serum 25-hydroxyvitamin D—The FIN-D2D population-based study. J. Steroid. Biochem. Mol. Biol. 2018, 178, 229–233. [Google Scholar] [CrossRef] [PubMed]
- Rivera-Paredez, B.; Macias, N.; Martinez-Aguilar, M.M.; Hidalgo-Bravo, A.; Flores, M.; Quezada-Sanchez, A.D.; Denova-Gutierrez, E.; Cid, M.; Martinez-Hernandez, A.; Orozco, L.; et al. Association between Vitamin D deficiency and single nucleotide polymorphisms in the vitamin D receptor and GC genes and analysis of their distribution in Mexican postmenopausal women. Nutrients 2018, 10, 1175. [Google Scholar] [CrossRef]
- McGrath, J.J.; Saha, S.; Burne, T.H.; Eyles, D.W. A systematic review of the association between common single nucleotide polymorphisms and 25-hydroxyvitamin D concentrations. J. Steroid Biochem. Mol. Biol. 2010, 121, 471–477. [Google Scholar] [CrossRef]
- Zhang, Z.; He, J.W.; Fu, W.Z.; Zhang, C.Q.; Zhang, Z.L. An analysis of the association between the vitamin D pathway and serum 25-hydroxyvitamin D levels in a healthy Chinese population. J. Bone Miner. Res. 2013, 28, 1784–1792. [Google Scholar] [CrossRef]
- Holick, M.F.; Binkley, N.C.; Bischoff-Ferrari, H.A.; Gordon, C.M.; Hanley, D.A.; Heaney, R.P.; Murad, M.H.; Weaver, C.M.; Endocrine, S. Evaluation, treatment, and prevention of vitamin D deficiency: An endocrine society clinical practice guideline. J. Clin. Endocrinol. Metab. 2011, 96, 1911–1930. [Google Scholar] [CrossRef]
- Al-Daghri, N.M.; Mohammed, A.K.; Bukhari, I.; Rikli, M.; Abdi, S.; Ansari, M.G.A.; Sabico, S.; Hussain, S.D.; Alenad, A.; Al-Saleh, Y.; et al. Efficacy of vitamin D supplementation according to vitamin D-binding protein polymorphisms. Nutrition 2019, 63–64, 148–154. [Google Scholar] [CrossRef]
- Barrett, J.C.; Fry, B.; Maller, J.; Daly, M.J. Haploview: Analysis and visualization of LD and haplotype maps. Bioinformatics 2005, 21, 263–265. [Google Scholar] [CrossRef] [PubMed]
- Hedrick, P.W. Gametic disequilibrium in cats: Epistasis is an unlikely cause. J. Hered. 1987, 78, 204. [Google Scholar] [CrossRef] [PubMed]
- R Core Team. R: A Language and Environment for Statistical Computing; R Foundation for Statistical Computing: Vienna, Austria, 2013. [Google Scholar]
- Jain, R.; von Hurst, P.R.; Stonehouse, W.; Love, D.R.; Higgins, C.M.; Coad, J. Association of vitamin D receptor gene polymorphisms with insulin resistance and response to vitamin D. Metabolism 2012, 61, 293–301. [Google Scholar] [CrossRef] [PubMed]
- Iruzubieta, P.; Teran, A.; Crespo, J.; Fabrega, E. Vitamin D deficiency in chronic liver disease. World J. Hepatol. 2014, 6, 901–915. [Google Scholar] [CrossRef]
- Franca Gois, P.H.; Wolley, M.; Ranganathan, D.; Seguro, A.C. Vitamin D deficiency in chronic kidney disease: Recent evidence and controversies. Int. J. Environ. Res. Public Health 2018, 15, 1773. [Google Scholar] [CrossRef]
- Pike, J.W.; Meyer, M.B. The vitamin D receptor: New paradigms for the regulation of gene expression by 1,25-dihydroxyvitamin D3. Rheum. Dis. Clin. N. Am. 2012, 38, 13–27. [Google Scholar] [CrossRef]
- Malik, S.; Fu, L.; Juras, D.J.; Karmali, M.; Wong, B.Y.; Gozdzik, A.; Cole, D.E. Common variants of the vitamin D binding protein gene and adverse health outcomes. Crit. Rev. Clin. Lab. Sci. 2013, 50, 1–22. [Google Scholar] [CrossRef]
- Jones, G.; Prosser, D.E.; Kaufmann, M. Cytochrome P450-mediated metabolism of vitamin D. J. Lipid Res. 2014, 55, 13–31. [Google Scholar] [CrossRef]
- Thacher, T.D.; Levine, M.A. CYP2R1 mutations causing vitamin D-deficiency rickets. J. Steroid Biochem. Mol. Biol. 2017, 173, 333–336. [Google Scholar] [CrossRef] [PubMed]
- Wei, C.L.; Wu, Q.; Vega, V.B.; Chiu, K.P.; Ng, P.; Zhang, T.; Shahab, A.; Yong, H.C.; Fu, Y.; Weng, Z.; et al. A global map of p53 transcription-factor binding sites in the human genome. Cell 2006, 124, 207–219. [Google Scholar] [CrossRef] [PubMed]
- Dahan, O.; Gingold, H.; Pilpel, Y. Regulatory mechanisms and networks couple the different phases of gene expression. Trends Genet. 2011, 27, 316–322. [Google Scholar] [CrossRef] [PubMed]
- Gallegos, J.E.; Rose, A.B. An intron-derived motif strongly increases gene expression from transcribed sequences through a splicing independent mechanism in Arabidopsis Thaliana. Sci. Rep. 2019, 9, 13777. [Google Scholar] [CrossRef] [PubMed]
- Mascarenhas, D.; Mettler, I.J.; Pierce, D.A.; Lowe, H.W. Intron-mediated enhancement of heterologous gene expression in maize. Plant Mol. Biol. 1990, 15, 913–920. [Google Scholar] [CrossRef] [PubMed]
- Beildeck, M.E.; Islam, M.; Shah, S.; Welsh, J.; Byers, S.W. Control of TCF-4 expression by VDR and vitamin D in the mouse mammary gland and colorectal cancer cell lines. PLoS ONE 2009, 4, e7872. [Google Scholar] [CrossRef]
- Skversky, A.L.; Kumar, J.; Abramowitz, M.K.; Kaskel, F.J.; Melamed, M.L. Association of glucocorticoid use and low 25-hydroxyvitamin D levels: Results from the National Health and Nutrition Examination Survey (NHANES): 2001–2006. J. Clin. Endocrinol. Metab. 2011, 96, 3838–3845. [Google Scholar] [CrossRef]
- Hidalgo, A.A.; Trump, D.L.; Johnson, C.S. Glucocorticoid regulation of the vitamin D receptor. J. Steroid. Biochem. Mol. Biol. 2010, 121, 372–375. [Google Scholar] [CrossRef]
- Zhang, Y.; Leung, D.Y.; Goleva, E. Anti-inflammatory and corticosteroid-enhancing actions of vitamin D in monocytes of patients with steroid-resistant and those with steroid-sensitive asthma. J. Allergy Clin. Immunol. 2014, 133, 1744–1752 e1741. [Google Scholar] [CrossRef]
- Obradovic, D.; Gronemeyer, H.; Lutz, B.; Rein, T. Crosstalk of vitamin D and glucocorticoids in hippocampal cells. J. Neurochem. 2006, 96, 500–509. [Google Scholar] [CrossRef]
- Zhang, Y.; Leung, D.Y.; Goleva, E. Vitamin D enhances glucocorticoid action in human monocytes: Involvement of granulocyte-macrophage colony-stimulating factor and mediator complex subunit 14. J. Biol. Chem. 2013, 288, 14544–14553. [Google Scholar] [CrossRef] [PubMed]


| Mean | 95% CI | Normal Distribution | |
|---|---|---|---|
| Age | 21.173 | 20.803–21.542 | 0.0004 |
| BMI (kg/m2) | 24.344 | 23.298–25.390 | <0.0001 |
| Height (cm) | 159.407 | 158.252–160.563 | 0.7273 |
| Phase 1 ALT (U/L) | 9.825 | 8.798–10.852 | <0.0001 |
| Phase 1 AST (U/L) | 15.072 | 13.967–16.176 | 0.0015 |
| Phase 1 BUN (mg/dl) | 9.821 | 9.195–10.447 | 0.0109 |
| Phase 1 Calcium (mg/dl) | 9.171 | 8.882–9.459 | 0.6413 |
| Phase 1 Creatinine (mg/dl) | 0.463 | 0.437–0.490 | 0.4344 |
| Phase 2 ALT (U/L) | 12.948 | 11.525–14.371 | <0.0001 |
| Phase 2 AST (U/L) | 16.344 | 15.118–17.571 | 0.0016 |
| Phase 2 BUN (mg/dl) | 12.664 | 11.883–13.446 | 0.1309 |
| Phase 2 Calcium (mg/dl) | 11.324 | 10.996–11.652 | 0.0367 |
| Phase 2 Creatinine (mg/dl) | 0.674 | 0.639–0.708 | 0.0009 |
| Vitamin D Total Phase 1 | 11.014 | 9.989–12.038 | 0.1375 |
| Vitamin D Total Phase 2 | 34.332 | 31.430–37.234 | 0.8644 |
| Waist Circumference (inch) | 33.083 | 31.093–35.073 | <0.0001 |
| Weight (kg) | 62.149 | 59.047–65.251 | <0.0001 |
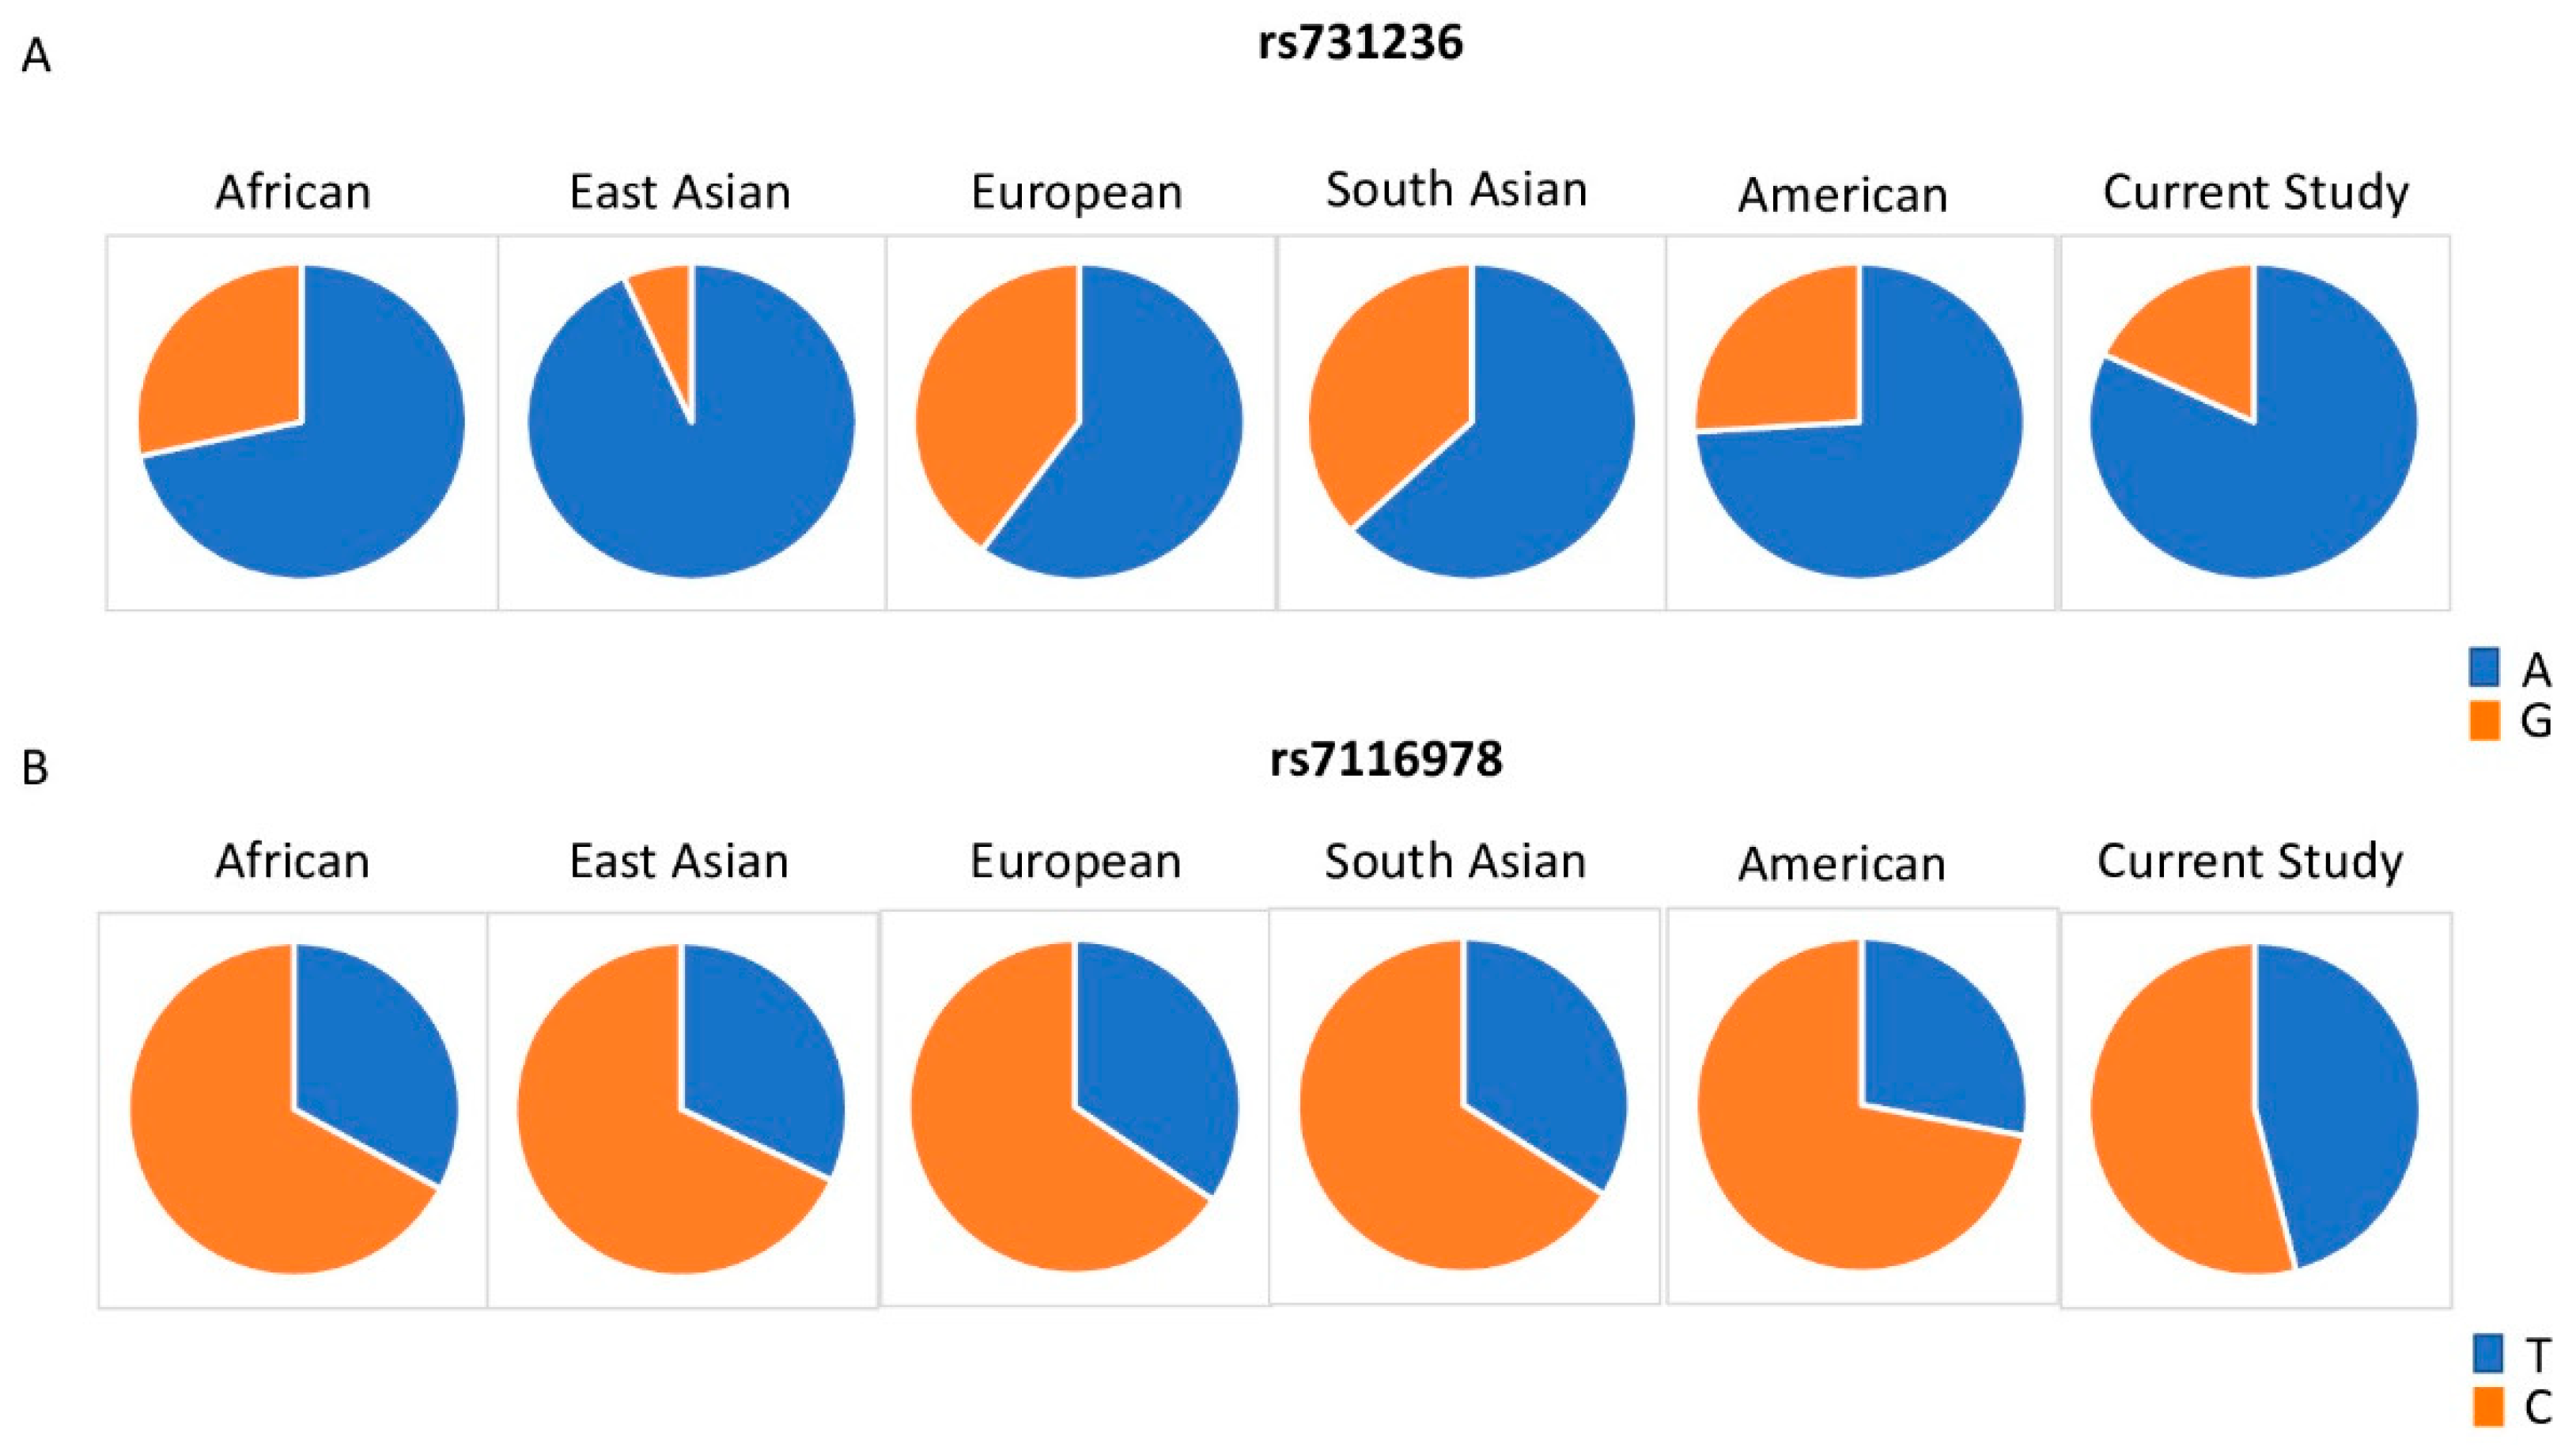
| SNP ID | Gene | Chr. | Allele | African (N = 1322) | East Asian (N = 1008) | European (N = 1006) | South Asian (N = 978) | American (N = 694) | Current Study Cohort (N = 89) | HWE p-Value |
|---|---|---|---|---|---|---|---|---|---|---|
| rs10783219 | VDR | 12 | Ref (T) | 0.023 | 0.441 | 0.332 | 0.33 | 0.51 | 0.55 | 0.29 |
| Alt (A) | 0.977 | 0.559 | 0.668 | 0.67 | 0.49 | 0.45 | ||||
| rs7139166 | VDR | 12 | Ref (C) | 0.963 | 0.981 | 0.577 | 0.8 | 0.72 | 0.73 | 0.17 |
| Alt (G) | 0.037 | 0.019 | 0.423 | 0.2 | 0.28 | 0.27 | ||||
| rs731236 | VDR | 12 | Ref (A) | 0.715 | 0.933 | 0.6 | 0.63 | 0.74 | 0.82 | 0.53 |
| Alt (G) | 0.285 | 0.067 | 0.4 | 0.37 | 0.26 | 0.18 | ||||
| rs757343 | VDR | 12 | Ref (C) | 0.945 | 0.783 | 0.854 | 0.89 | 0.85 | 0.6 | 0.07 |
| Alt (T) | 0.055 | 0.217 | 0.146 | 0.11 | 0.15 | 0.4 | ||||
| rs4516035 | VDR | 12 | Ref (T) | 0.963 | 0.981 | 0.578 | 0.8 | 0.72 | 0.6 | 0.05 * |
| Alt (C) | 0.037 | 0.019 | 0.422 | 0.2 | 0.28 | 0.4 | ||||
| rs10741657 | CYP2R1 | 11 | Ref (A) | 0.219 | 0.319 | 0.381 | 0.36 | 0.28 | 0.382 | 0.37 |
| Alt (G) | 0.781 | 0.681 | 0.619 | 0.64 | 0.72 | 0.618 | ||||
| rs10766197 | CYP2R1 | 11 | Ref (G) | 0.896 | 0.643 | 0.526 | 0.55 | 0.64 | 0.15 | 0.97 |
| Alt (A) | 0.104 | 0.357 | 0.474 | 0.45 | 0.36 | 0.85 | ||||
| rs12794714 | CYP2R1 | 11 | Ref (G) | 0.897 | 0.632 | 0.553 | 0.56 | 0.49 | 0.17 | 0.67 |
| Alt (A) | 0.103 | 0.368 | 0.447 | 0.44 | 0.51 | 0.83 | ||||
| rs1562902 | CYP2R1 | 11 | Ref (C) | 0.477 | 0.379 | 0.441 | 0.43 | 0.33 | 0.74 | 0.25 |
| Alt (T) | 0.523 | 0.621 | 0.559 | 0.57 | 0.67 | 0.26 | ||||
| rs10500804 | CYP2R1 | 11 | Ref (T) | 0.897 | 0.63 | 0.552 | 0.55 | 0.48 | 0.8 | 0.77 |
| Alt (G) | 0.103 | 0.37 | 0.448 | 0.45 | 0.52 | 0.2 | ||||
| rs1993116 | CYP2R1 | 11 | Ref (A) | 0.219 | 0.32 | 0.388 | 0.35 | 0.28 | 0.77 | 0.74 |
| Alt (G) | 0.781 | 0.68 | 0.612 | 0.65 | 0.72 | 0.23 | ||||
| rs7116978 | CYP2R1 | 11 | Ref (T) | 0.329 | 0.32 | 0.344 | 0.34 | 0.28 | 0.46 | 0.37 |
| Alt (C) | 0.671 | 0.68 | 0.656 | 0.66 | 0.72 | 0.54 | ||||
| rs10877012 | CYP27B1 | 12 | Ref (G) | 0.921 | 0.357 | 0.683 | 0.49 | 0.74 | 0.85 | 0.95 |
| Alt (T) | 0.079 | 0.643 | 0.317 | 0.51 | 0.26 | 0.15 | ||||
| rs4646536 | CYP27B1 | 12 | Ref (A) | 0.756 | 0.354 | 0.681 | 0.42 | 0.72 | 0.03 | 0.37 |
| Alt (G) | 0.244 | 0.646 | 0.319 | 0.58 | 0.28 | 0.97 | ||||
| rs703842 | CYP27B1 | 12 | Ref (A) | 0.7 | 0.354 | 0.68 | 0.42 | 0.71 | 0.15 | 0.1 |
| Alt (G) | 0.3 | 0.646 | 0.32 | 0.58 | 0.29 | 0.85 | ||||
| rs11234027 | DHCR7/NADSYN1 | 11 | Ref (G) | 0.651 | 0.696 | 0.808 | 0.65 | 0.76 | 0 | NA |
| Alt (A) | 0.349 | 0.304 | 0.192 | 0.35 | 0.24 | 1 | ||||
| rs12785878 | DHCR7/NADSYN1 | 11 | Ref (G) | 0.83 | 0.62 | 0.299 | 0.85 | 0.55 | 0.57 | 0.38 |
| Alt (T) | 0.17 | 0.38 | 0.701 | 0.15 | 0.45 | 0.43 | ||||
| rs3829251 | DNCR7/NADSYN1 | 11 | Ref (G) | 0.743 | 0.702 | 0.809 | 0.65 | 0.77 | 0.15 | 0.94 |
| Alt (A) | 0.257 | 0.298 | 0.191 | 0.35 | 0.23 | 0.85 | ||||
| rs1155563 | GC | 4 | Ref (T) | 0.943 | 0.664 | 0.756 | 0.68 | 0.81 | 0.6 | 0.14 |
| Alt (C) | 0.057 | 0.336 | 0.244 | 0.32 | 0.19 | 0.4 | ||||
| rs12512631 | GC | 4 | Ref (T) | 0.647 | 0.775 | 0.653 | 0.74 | 0.57 | 0.75 | 0.19 |
| Alt (C) | 0.353 | 0.225 | 0.347 | 0.26 | 0.43 | 0.25 | ||||
| rs16846876 | GC | 4 | Ref (A) | 0.853 | 0.74 | 0.702 | 0.7 | 0.78 | 0.403 | 0.04 * |
| Alt (T) | 0.147 | 0.26 | 0.298 | 0.3 | 0.22 | 0.596 | ||||
| rs17467825 | GC | 4 | Ref (A) | 0.946 | 0.739 | 0.751 | 0.7 | 0.79 | 0.72 | 0.32 |
| Alt (G) | 0.054 | 0.261 | 0.249 | 0.3 | 0.21 | 0.28 | ||||
| rs222020 | GC | 4 | Ref (C) | 0.633 | 0.416 | 0.162 | 0.13 | 0.21 | 0.73 | 0.17 |
| Alt (T) | 0.367 | 0.584 | 0.838 | 0.87 | 0.79 | 0.27 | ||||
| rs2282679 | GC | 4 | Ref (T) | 0.95 | 0.739 | 0.753 | 0.7 | 0.79 | 0.12 | 0.79 |
| Alt (G) | 0.05 | 0.261 | 0.247 | 0.3 | 0.21 | 0.88 | ||||
| rs2298849 | GC | 4 | Ref (A) | 0.573 | 0.599 | 0.801 | 0.84 | 0.78 | 0.6 | 0.05 * |
| Alt (G) | 0.427 | 0.401 | 0.199 | 0.16 | 0.22 | 0.4 | ||||
| rs2298850 | GC | 4 | Ref (G) | 0.974 | 0.74 | 0.764 | 0.71 | 0.8 | 0.75 | 0.02 * |
| Alt (C) | 0.026 | 0.26 | 0.236 | 0.29 | 0.2 | 0.25 | ||||
| rs2882679 | GC | 4 | Ref (C) | NA | NA | NA | NA | NA | 0.74 | 0.99 |
| Alt (T) | NA | NA | NA | NA | NA | 0.26 | ||||
| rs3755967 | GC | 4 | Ref (C) | 0.946 | 0.739 | 0.752 | 0.7 | 0.79 | 0.19 | 0.38 |
| Alt (T) | 0.054 | 0.261 | 0.248 | 0.3 | 0.21 | 0.81 | ||||
| rs4588 | GC | 4 | Ref (G) | 0.933 | 0.739 | 0.752 | 0.7 | 0.79 | 0.77 | 0.29 |
| Alt (T) | 0.067 | 0.261 | 0.248 | 0.3 | 0.21 | 0.23 | ||||
| rs7041 | GC | 4 | Ref (A) | 0.906 | 0.7 | 0.417 | 0.46 | 0.46 | 0.75 | 0.16 |
| Alt (C) | 0.094 | 0.3 | 0.583 | 0.54 | 0.54 | 0.25 | ||||
| rs17219315 | CYP24A1 | 20 | Ref (A) | 0.997 | 1 | 0.982 | 0.98 | 0.99 | 0.22 | 0.43 |
| Alt (G) | 0.003 | 0 | 0.018 | 0.02 | 0.01 | 0.88 | ||||
| rs2244719 | CYP24A1 | 20 | Ref (C) | 0.239 | 0.129 | 0.428 | 0.29 | 0.52 | 0.15 | 0.97 |
| Alt (T) | 0.761 | 0.871 | 0.572 | 0.71 | 0.48 | 0.85 | ||||
| rs229624 | CYP24A1 | 20 | Ref (G) | 0.893 | 0.969 | 0.815 | 0.8 | 0.9 | 0.53 | 0.35 |
| Alt (A) | 0.107 | 0.031 | 0.185 | 0.2 | 0.1 | 0.47 | ||||
| rs2296241 | CYP24A1 | 20 | Ref (G) | 0.508 | 0.594 | 0.467 | 0.58 | 0.58 | 0.54 | 0.19 |
| Alt (A) | 0.492 | 0.406 | 0.533 | 0.42 | 0.42 | 0.46 | ||||
| rs2426496 | CYP24A1 | 20 | Ref (T) | 0.432 | 0.357 | 0.324 | 0.35 | 0.24 | 0.74 | 0.99 |
| Alt (G) | 0.568 | 0.643 | 0.676 | 0.65 | 0.76 | 0.26 | ||||
| rs4809960 | CYP24A1 | 20 | Ref (T) | 0.905 | 0.78 | 0.769 | 0.75 | 0.79 | 0.82 | 0.84 |
| Alt (C) | 0.095 | 0.22 | 0.231 | 0.25 | 0.21 | 0.18 | ||||
| rs6013897 | CYP24A1 | 20 | Ref (T) | 0.74 | 0.851 | 0.758 | 0.67 | 0.63 | 0.72 | 0.37 |
| Alt (A) | 0.26 | 0.149 | 0.242 | 0.33 | 0.37 | 0.28 |
| SNP ID | Gene | p-Value (R/NR) | p-Value (S/D/I) |
|---|---|---|---|
| rs10783219 | VDR | 0.6071 | 0.5330 |
| rs7139166 | VDR | 0.4249 | 0.6209 |
| rs731236 | VDR | 0.5133 | 0.0336 |
| rs757343 | VDR | 0.6023 | 0.6926 |
| rs10741657 | CYP2R1 | 0.3748 | 0.4870 |
| rs10766197 | CYP2R1 | 0.7235 | 0.3820 |
| rs12794714 | CYP2R1 | 0.7221 | 0.8857 |
| rs1562902 | CYP2R1 | 0.3136 | 0.1389 |
| rs10500804 | CYP2R1 | 0.7443 | 0.8867 |
| rs1993116 | CYP2R1 | 0.6900 | 0.6161 |
| rs7116978 | CYP2R1 | 0.0727 | 0.0163 |
| rs10877012 | CYP27B1 | 0.7108 | 0.3583 |
| rs4646536 | CYP27B1 | 0.8004 | 0.8265 |
| rs703842 | CYP27B1 | 0.7845 | 0.7230 |
| rs12785878 | DHCR7/NADSYN1 | 0.9386 | 0.9820 |
| rs3829251 | DHCR7/NADSYN1 | 0.7488 | 0.4279 |
| rs1155563 | GC | 0.9104 | 0.9904 |
| rs12512631 | GC | 0.3288 | 0.1126 |
| rs17467825 | GC | 0.0661 | 0.1188 |
| rs222020 | GC | 0.4039 | 0.4397 |
| rs2282679 | GC | 0.9068 | 0.7540 |
| rs2882679 | GC | 0.4395 | 0.6346 |
| rs3755967 | GC | 0.8826 | 0.5654 |
| rs4588 | GC | 0.2287 | 0.1922 |
| rs7041 | GC | 0.1961 | 0.2328 |
| rs17219315 | CYP24A1 | 0.6713 | 0.3635 |
| rs2244719 | CYP24A1 | 0.7235 | 0.3820 |
| rs229624 | CYP24A1 | 0.8586 | 0.8796 |
| rs2296241 | CYP24A1 | 0.3863 | 0.4631 |
| rs2426496 | CYP24A1 | 0.4395 | 0.6346 |
| rs4809960 | CYP24A1 | 0.5668 | 0.1768 |
| rs6013897 | CYP24A1 | 0.7249 | 0.9156 |
© 2020 by the authors. Licensee MDPI, Basel, Switzerland. This article is an open access article distributed under the terms and conditions of the Creative Commons Attribution (CC BY) license (http://creativecommons.org/licenses/by/4.0/).
Share and Cite
Tomei, S.; Singh, P.; Mathew, R.; Mattei, V.; Garand, M.; Alwakeel, M.; Sharif, E.; Al Khodor, S. The Role of Polymorphisms in Vitamin D-Related Genes in Response to Vitamin D Supplementation. Nutrients 2020, 12, 2608. https://doi.org/10.3390/nu12092608
Tomei S, Singh P, Mathew R, Mattei V, Garand M, Alwakeel M, Sharif E, Al Khodor S. The Role of Polymorphisms in Vitamin D-Related Genes in Response to Vitamin D Supplementation. Nutrients. 2020; 12(9):2608. https://doi.org/10.3390/nu12092608
Chicago/Turabian StyleTomei, Sara, Parul Singh, Rebecca Mathew, Valentina Mattei, Mathieu Garand, Mariam Alwakeel, Elham Sharif, and Souhaila Al Khodor. 2020. "The Role of Polymorphisms in Vitamin D-Related Genes in Response to Vitamin D Supplementation" Nutrients 12, no. 9: 2608. https://doi.org/10.3390/nu12092608
APA StyleTomei, S., Singh, P., Mathew, R., Mattei, V., Garand, M., Alwakeel, M., Sharif, E., & Al Khodor, S. (2020). The Role of Polymorphisms in Vitamin D-Related Genes in Response to Vitamin D Supplementation. Nutrients, 12(9), 2608. https://doi.org/10.3390/nu12092608