Article

Identification of Genetic Factors Underlying the Association between Sodium Intake Habits and Hypertension Risk

1
Department of Family Medicine, Yongin Severance Hospital, Yonsei University College of Medicine, 363, Dongbaekjukjeon-daero, Giheung-gu, Yongin-si 16995, Korea
2
Theragen Bio Co., Ltd., Suwon 16229, Korea
3
Department of Family Medicine, Gangnam Severance Hospital, Yonsei University College of Medicine, 211 Eonju-ro, Gangnam-gu, Seoul 06273, Korea
*
Authors to whom correspondence should be addressed.
These authors are co-first authors who equally contribute to this work.
Nutrients 2020, 12(9), 2580; https://doi.org/10.3390/nu12092580
Submission received: 5 August 2020 / Revised: 16 August 2020 / Accepted: 22 August 2020 / Published: 25 August 2020
(This article belongs to the Special Issue Precision Nutrition)

Abstract

:
The role of sodium in hypertension remains unresolved. Although genetic factors have a significant impact on high blood pressure, studies comparing genetic susceptibility between people with low and high sodium diets are lacking. We aimed to investigate the genetic variations related to hypertension according to sodium intake habits in a large Korean population-based study. Data for a total of 57,363 participants in the Korean Genome and Epidemiology Study Health Examination were analyzed. Sodium intake was measured by a semi-quantitative food frequency questionnaire. We classified participants according to sodium intake being less than or greater than 2 g/day. We used logistic regression to test single-marker variants for genetic association with a diagnosis of hypertension, adjusting for age, sex, body mass index, exercise, alcohol, smoking, potassium intake, principal components 1, and principal components 2. Significant associations were defined as p < 5 × 10⁻⁸. In participants whose sodium intake was greater than 2 g/day, chromosome 6 open reading frame 10 (C6orf10)-human leukocyte antigen (HLA)-DQB1 rs6913309, ring finger protein (RNF)213 rs112735431, glycosylphosphatidylinositol anchored molecule-like (GML)- cytochrome P450 family 11 subfamily B member 1(CYP11B1) rs3819496, myosin light chain 2 (MYL2)-cut like homeobox 2 (CUX2) rs12229654, and jagged1 (JAG1) rs1887320 were significantly associated with hypertension. In participants whose intake was less than 2 g/day, echinoderm microtubule-associated protein-like 6(EML6) rs67617923 was significantly associated with hypertension. Genetic susceptibility associated with hypertension differed according to sodium intake. Identifying gene variants that contribute to the dependence of hypertension on sodium intake status could make possible more individualized nutritional recommendations for preventing cardiovascular diseases.

1. Introduction

Sodium is the most important electrolyte for maintaining extracellular fluid volume and regulating cellular membrane potential [1]. The importance of dietary sodium in regulating blood pressure (BP) has received much attention in the past. Hypertension has been the most important global risk factor for all-cause mortality and for cardiovascular mortality [2]. Many studies have demonstrated the association of sodium consumption with hypertension and risk of cardiovascular diseases (CVD) [3,4,5]. Therefore, the World Health Organization (WHO) recommends sodium intake of less than 2 g/day to reduce BP and the risk of CVD [6].
Under normal physiological adaptation to sodium intake, the pressure natriuresis curve is regulated by the renin–angiotensin system and renal sympathetic nerve activity [7]. Increased sodium intake suppressed angiotensin II and led to pressure natriuresis cure shifting, which increased renal sodium excretion [7]. Both epithelial sodium transporter and aldosterone level are also involved in adapting the dietary sodium intake. In patients with salt-sensitive increased BP, enhanced sodium reabsorption, changes in pressure natriuresis curve, a suppressed renin–angiotensin system, and gene polymorphisms in voltage-dependent Ca2+ channels and sodium-bicarbonate cotransporter were noted [8,9]. Furthermore, the levels of natriuretic peptides could be affected by excessive sodium intake, decreased potassium and magnesium intake, and metabolic diseases such as obesity [10,11,12].
However, the relationship between sodium intake and BP remains unresolved. A meta-analysis of 13 prospective studies with 177,035 participants reported that high salt intake is associated with significantly increased risk of stroke and total CVD [3]. Another meta-analysis that included 22 trials in hypertensive patients and 12 trials in normotensive participants reported that a salt reduction of 4.4 g/day led to a mean systolic blood pressure (SBP) change of −4.18 mm Hg (95% confidence interval [CI] −5.18 to −3.18, I2 = 75%), and a diastolic blood pressure (DBP) change of −2.06 mm Hg (CI, −2.67 to −1.45, I2 = 68%) [4]. Conversely, several studies reported an inverse association between sodium intake and CVD. Stolarz-Skrzypek et al. [13] found that SBP, but not DBP, was significantly correlated with 24 h urinary sodium excretion; however, the incidence of hypertension did not increase, and CVD risk decreased with increasing sodium excretion tertiles. Interestingly, some studies have shown a J-shaped association between sodium intake and CVD. Martin et al. [14] showed that sodium excretion rates greater than 7 g/day or less than 3 g/day were associated with increased risk of all CV events as well as CVD mortality, compared to sodium excretion of 4 to 5.99 g/day, using the two-cohort data. The same author [15] reaffirmed that estimated sodium intake of 3 to 6 g/day was associated with a low risk of CVD among 101,945 persons in 17 countries. These conflicting findings are due not only to differences among studies but also to the complexity of traits of hypertension. Essential hypertension, with varying or unknown pathology, accounts for 95% of all hypertension cases [16]. High BP is known to result from interaction among multiple factors, including genetic susceptibility, obesity, aging, sedentary life style, alcohol consumption, high salt intake (especially in salt-sensitive persons), and low potassium intake [16]. Genetic elements were reported to make a 30–70% contribution to BP variation [17,18]. Under similar environmental conditions, some individuals develop hypertension and others do not.
Single-nucleotide polymorphisms (SNPs), single base substitutions within the deoxyribonucleic acid (DNA) sequence, are the most common type of human genetic variation [19]. Inter-individual genetic variation is an important determinant of human nutritional requirements [20]. However, studies comparing genetic susceptibility associated with hypertension between people with low versus high sodium diets have been limited. Identifying gene variants that contribute to the association of hypertension with sodium intake could contribute to better understanding of the pathophysiology of hypertension, and offer opportunities to determine optimal nutrition status for individuals.
Therefore, we aimed to investigate the genetic variations involved in the relationship between hypertension and sodium intake, in a large Korean population-based study.

2. Materials and Methods

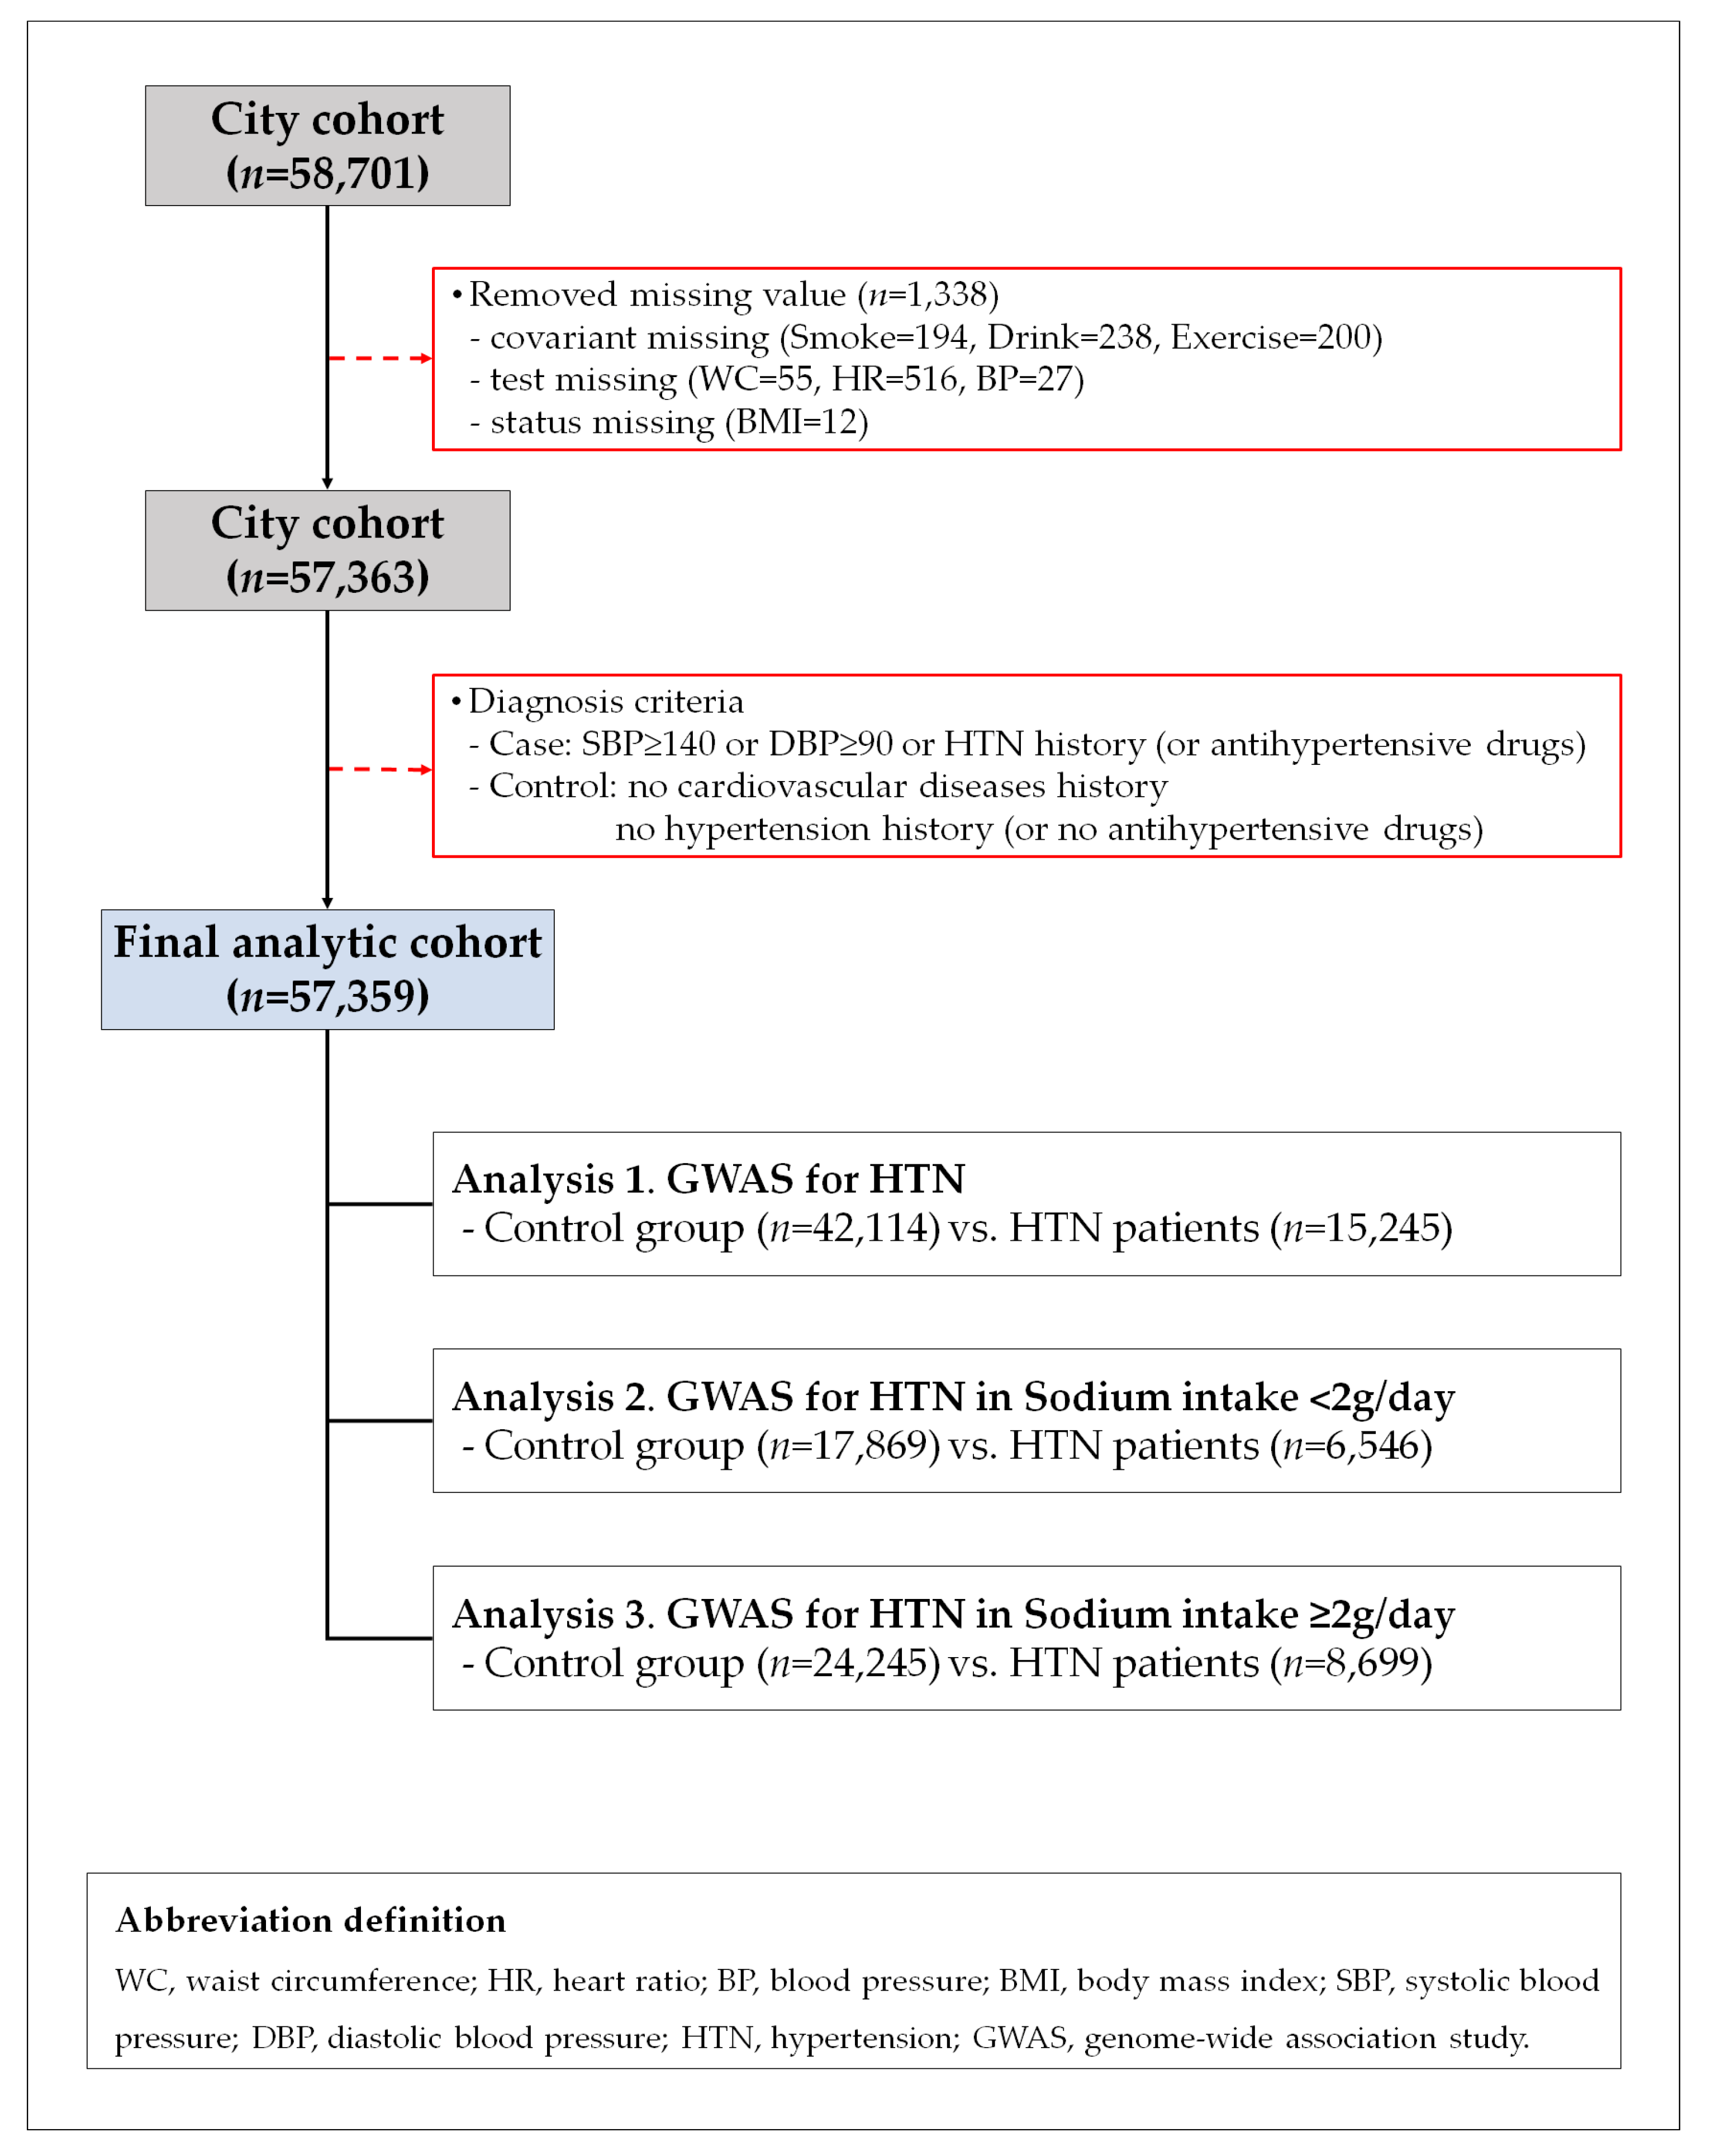
2.1. Study Population

The Korean Genome and Epidemiology Study (KoGES) is a large cohort study to find genetic and environmental factors, and their interactions, in non-communicable diseases, with government funding [21]. KoGES Health Examination (KoGES_HEXA), one of the subset cohorts of KoGES, consists of community dwellers and participants, aged ≥ 40 years at baseline recruited from the national health examinee registry.
In the current study, we included the total 58,701 participants who participated in KoGES_HEXA. We excluded participants in KoGES_HEXA from the present study if values were missing for BP, body mass index (BMI), waist circumference (WC), heart rate (HR), alcohol, smoking, or exercise (n = 1338). A total of 57,363 participants were included in the current study. Hypertensive patients (n = 15,245) were defined as those with SBP ≥ 140 mm Hg, DBP ≥ 90 mm Hg, or a history of hypertension or taking antihypertensive medication. Controls (n = 42,114) were defined as those without hypertension or taking anti-hypertensive drug or cardiovascular diseases.
Figure 1 shows a flow chart describing this study. We treated the three analyses set. In analysis 1, we compared with control (n = 42,114) and hypertension patients (n = 15,245). In analysis 2, we compared with controls (n = 17,869) and hypertension patients (n = 6,546) in the participants with <2 g/day (n = 24,415). In analysis 3, we compared with controls (n = 24,245) and hypertension patients (n = 8699) in the participants with ≥2 g/day (n = 32,994). The study was approved by the institutional review board of Theragen Bio Co., Ltd. (approval number: 700062-20190819-GP-006-02).

2.2. Assessment of Dietary Sodium and Potassium Intake and Covariates

For dietary assessment, a semi-quantitative food frequency questionnaire (FFQ) involving 103 items was developed for the KoGES. Participants reported the frequency and amount of foods eaten over the past year. The results of the questionnaire were analyzed, with reference to a food composition database, to estimate intakes. FFQs are widely used as the primary dietary assessment tool in epidemiological studies [22]. We classified participants based on sodium intake, according to the WHO recommendation of 2 g/day [6]. The WC was measured midway between the bottom rib and the iliac crest. Body mass index (BMI) was calculated as weight (kg) divided by height (m) squared. Blood pressures in the seated position were measured twice, using a mercury sphygmomanometer. Smoking status was classified into three categories: non-smokers, ex-smokers and current smokers. Drinking status was classified into three groups: non-drinkers (those who drink alcohol fewer than 12 times a year, with one drink not exceeding one cup), ex-drinkers, and current drinkers. Exercise was defined as regular exercise sufficient to cause perspiration.

2.3. Genotyping

Fasting blood samples were collected into one serum separator tube and two ethylenediaminetetraacetic acid tubes. Blood DNA samples were prepared, and all samples were then transported to the National Biobank of Korea. The SNP genotypes of participants were extracted from the Korea Biobank array (referred to as KoreanChip), which was optimized for the Korean population and to demonstrate findings of genome-wide association study (GWAS) of blood biochemical traits. The KoreanChip comprised >833,000 markers, including >247,000 rare or functional variants, derived from sequencing data for over 2500 Koreans [23]. Detailed information about the KoreanChip was described in a previous study [23]. We applied the following criteria in the analysis of KoreanChip data, to control the quality of genotyping results: call rate >97%, minor allele frequency >0.01, missing genotype >0.01, Hardy-Weinberg equilibrium p > 0.000001. In addition, the genotype used in the analysis is genome data which imputed data from a dataset of 1000 genome phase 1 and 2 Asian panels.

2.4. Statistical Analysis

The data were presented either as mean ± standard deviation or as numbers (percentage). To compare participants with and without hypertension, we used two-tailed Student’s t-tests for continuous variables, or chi-squared tests for categorical variables. In addition, we performed principal component analysis (PCA) to reduce bias of genomic data according to the region where samples were collected, and used principal component (PC)1 and PC2 as covariates in statistical analyses. We used logistic regression to test single-marker variants for genetic association with a diagnosis of hypertension, while adjusting for age, sex, BMI, exercise, alcohol, smoking, potassium intake, PC1 and PC2. All statistical tests were based on an adjusted model using PLINK (ver. 1.07). p values < 5 × 10⁻⁸ were considered as statistically significant.

3. Results

3.1. General Characteristics of the Study Population

Table 1 shows the general characteristics of participant categorized according to sodium intake. There were 24,415 (42.6%) and 32,944 (57.4%) participants with sodium intakes <2 g/day or ≥2 g/day, respectively, and with respective mean ages of 54.1 and 53.6 years. The proportion of men was significantly higher among participants with sodium intake ≥2 g/day. SBP and DBP were also significantly higher in this group. The mean total cholesterol (TC) and low-density lipoprotein (LDL) cholesterol level were not different between two groups. The mean level of triglyceride (TG) was significantly higher in participants who intake sodium intake was ≥2 g/day, while the mean level of high-density lipoprotein (HDL) cholesterol was significantly lower in this group. The mean level of C-reactive protein (CRP) was not different between two groups. The proportions of exercise, drinking, and smoking were higher among participants with sodium intake ≥2 g/day. Sodium and potassium consumptions were significantly higher in participants with sodium intake ≥2 g/day (all p < 0.001). The sodium to potassium (Na/K) ratio was also significantly higher in participants with sodium intake ≥2 g/day (p < 0.001). Table 1 also presents characteristics of participants subcategorized according to the presence of hypertension (HTN). The mean age, BMI, WC, SBP, and DBP were significantly higher in hypertensive patients than controls, whether sodium intake was <2 or ≥2 g/day. The mean TC, HDL, LDL were significantly lower in hypertensive patients than controls, whether sodium intake was < or ≥2 g/day. The TG and CRP were significantly higher in hypertensive patients than controls, whether sodium intake was <2 or ≥2 g/day. Among participants with sodium intake <2 g/day, sodium and potassium intakes were lower for hypertensive patients (p = 0.038, and p < 0.001), whereas mean Na/K was higher in hypertensive patients than in controls (p < 0.001). Among participants with sodium intake ≥2 g/day, sodium intake was similar between hypertensives and controls (p = 0.433), while potassium intake was significantly lower (p < 0.001) and Na/K was higher in hypertensive patients (p < 0.001) than in controls.

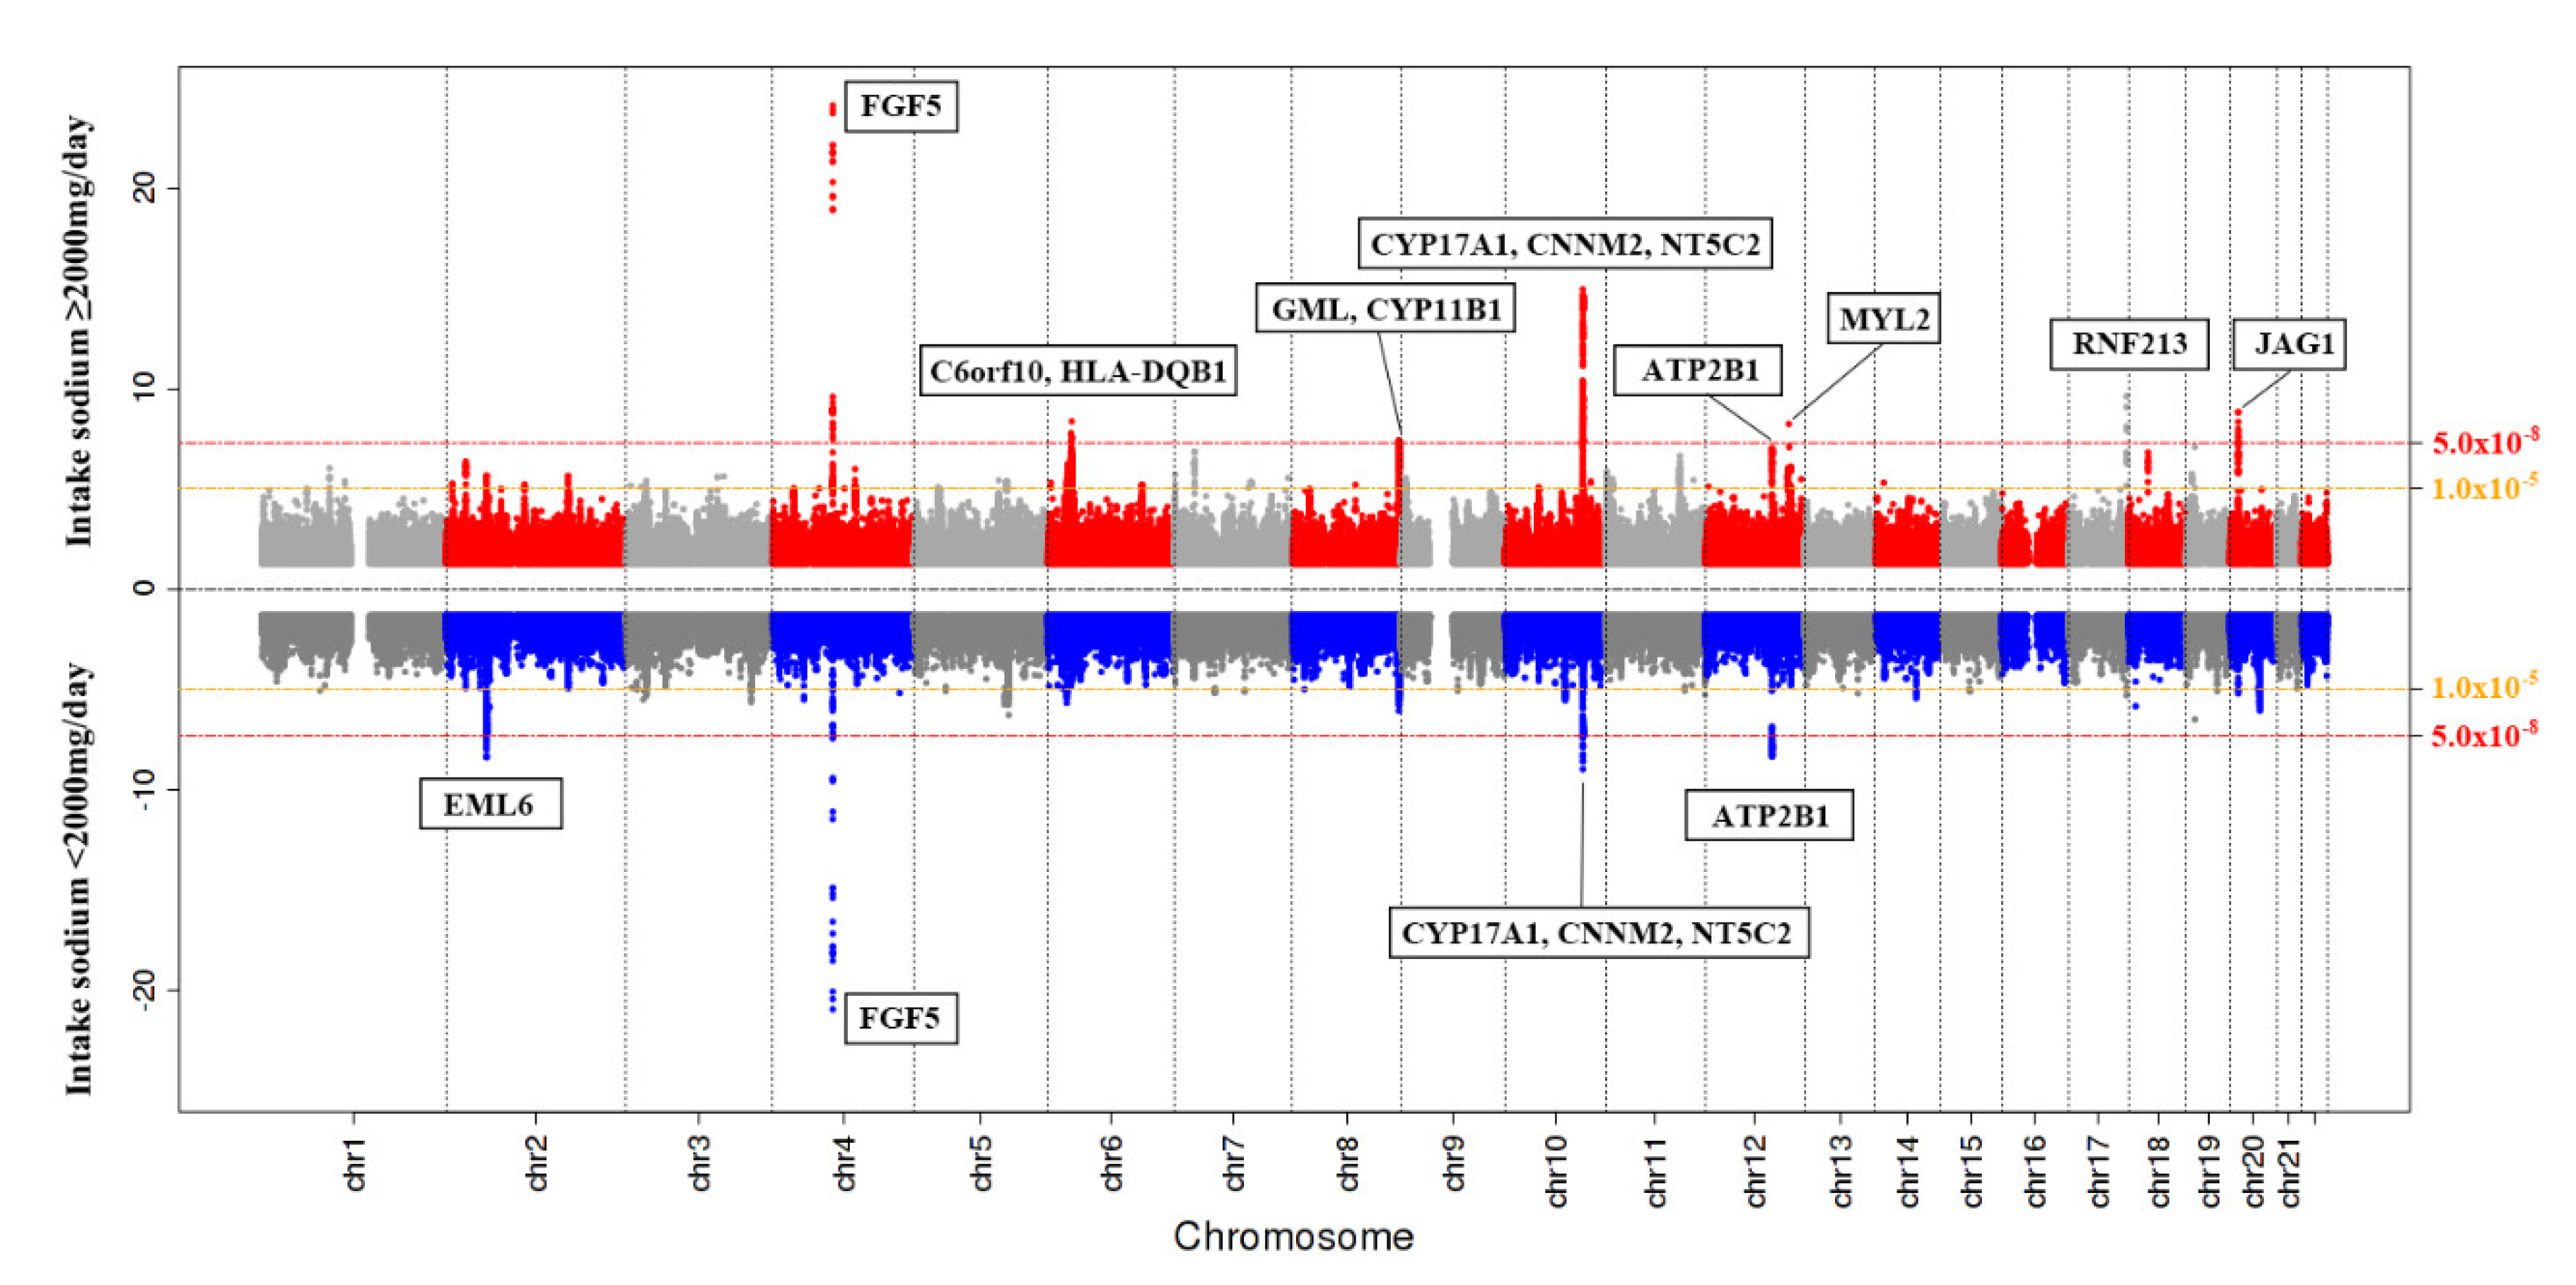
3.2. SNPs Associated with Hypertension Based on Sodium Intake

Table 2 shows the SNPs most strongly associated or clustered with hypertension in the Korean subjects, according to their sodium intake. Odds ratios (OR) and 95% CIs were calculated using logistic regression analysis after adjusting for age, sex, BMI, alcohol consumption, smoking, physical activity, and potassium intake. SNPs rs16998073 and rs12509595 demonstrated significant association with hypertension risk both in participants with sodium intake <2 g/day and those with intake ≥2 g/day. SNPs rs1191582, rs11105378, and rs140473396 were significantly associated with a decreased risk of hypertension, both in participants with sodium intake <2 g/day and those with intake ≥ 2g/day. SNP rs67617923 was significantly associated with increased risk of hypertension only in participants with sodium intake <2 g/day (OR = 1.294 [1.187–1.410], p = 4.29 × 10⁻⁹). SNPs rs6913309 and rs112735431 were significantly associated with hypertension only in participants with sodium intake ≥2 g/day (OR = 1.145 [1.094–1.197], p = 4.23 × 10⁻⁹; and OR =1.706 [1.446–2.012], p = 2.38 × 10⁻¹⁰, respectively). SNPs rs3819496, rs12229654, and rs1887320 were significantly associated with decreased risk of hypertension in participants with sodium intake ≥2 g/day (OR = 0.892 [0.857–0.929], p = 3.73 × 10⁻⁸; OR = 0.834 [0.787–0.883], p = 5.25 × 10⁻¹⁰; and OR = 0.892 [0.859–0.925], p = 1.45 × 10⁻⁹, respectively). All SNPs that were found to be significantly related to hypertension are described in the Supplementary Tables (Table S1, SNPs significantly related to hypertension; Table S2, SNPs significantly related to hypertension in participants with sodium intake <2 g/day; Table S3, SNPs significantly related to hypertension in participants with sodium intake ≥2 g/day).
A Miami plot shows p-values for the SNP associations with hypertension in participants whose sodium intake was either <2 g/day or ≥2 g/day (Figure 2).

4. Discussion

This study identified both shared loci and sodium intake-specific loci related to hypertension. Fibroblast growth factor 5 (FGF5), PR domain zinc finger protein 8(PRDM8)-FGF5, 5’-nucleotidase, cytosolic II(NT5C2), ATPase plasma membrane Ca2+ transporting 1(ATP2B1), long intergenic non-protein coding RNA 936(LINC00936), and cyclin and CBS domain divalent metal cation transport mediator 2(CNNM2)-NT5C2 were commonly identified loci both in participants whose intakes were less than 2 g/day and in those with intakes greater than 2 g/day. Chromosome 6 open reading frame 10(C6orf10), human leukocyte antigen (HLA)-DQB1, ring finger protein (RNF)213, glycosylphosphatidylinositol anchored molecule-like (GML), cytochrome P450 family 11 subfamily B Member 1(CYP11B1), myosin light chain 2 (MYL2), cut like homeobox 2 (CUX2), and jagged1(JAG1) were significantly associated with hypertension in participants whose sodium intake was greater than 2 g/day, while loci in echinoderm microtubule-associated protein-like 6 (EML6) were significantly associated with hypertension in participants whose sodium intake was less than 2 g/day.
Guyton [24] established that long-term elevation of blood pressure is caused by vasoconstriction including the renal arteries or excess sodium retention through the kidney. The role of the kidney in BP control had been discovered by hypotension or hypertension caused by gene mutations which affect net renal sodium reabsorption [25]. For example, the loss of function mutations of the thiazide-sensitive NaCl symporter (e.g., Gitelman syndrome) impairs sodium reabsorption in the distal convoluted tubes and this results in a loss of sodium, potassium, and magnesium and a decrease in BP [25]. Enhanced tubular reabsorption of salt is important in the pathogenesis of obesity-related hypertension by regulating phosphorylation of Na+-K+-2Cl cotransporter and regulation of STE20/SPS1-related proline/alanine-rich kinase (SPAK)/oxidative-stress-responsive kinase-1 (OSR1) by AMP-activated protein kinase [26]. Recently, it was discovered that genetic variations at a number of loci increases susceptibility to hypertension in the context of environmental exposures through a variety of physiological mechanisms. Salt sensitivity has been more frequently observed in black people than white people and hypertensive persons than normotensive persons [27,28]. Therefore, races and individuals’ circumstance should be considered in salt intake and gene interaction studies [29,30]. In the current study, FGF5 rs16998073 and PRDM8-FGF5 rs12509595 were significantly associated with an increased risk of hypertension both in participants with sodium intake < 2 g/day and in those with intake ≥2 g/day. FGF5 rs16998073 was a well noted polymorphism in the largest GWAS performed by the Global Blood Pressure Genetics Consortium [31]. FGF5, a member of the fibroblast growth factor family, stimulates cell growth and proliferation of cardiac myocytes and promotes angiogenesis [32]. The association between FGF5 rs16998073 and hypertension was also recapitulated in a study of East Asians [33], and this polymorphism was shown to be associated with salt sensitivity in Koreans [34].
NT52C rs1191582, ATP2B1-LINC00936 rs11105378, and CNNM2-NT5C2 rs140473396 were significantly associated with decreased risk of hypertension, whether sodium intake was <2 or ≥2 g/day. NT52C rs11191582 is located in the gene-rich region near CYP17A1-CNNM2-NT5C2, which in GWAS was reported to contain a number of regulatory polymorphisms related to CVD [35,36]. Our study is the first to note the association of this polymorphism with hypertension. The association of ATP2B1 rs11105378 with hypertension was reported in European, Japanese and Korean studies [37]. ATP2B1 encodes the plasma membrane calcium transporting ATPase isoform 1, which plays a critical role in regulating blood pressure through alteration of intracellular calcium homeostasis and vasoconstriction in vascular smooth muscle cells [37,38]. CNNM2-NT5C2 rs140473396 was recently noted in a large, trans-ethnic study that included 776,078 participants from the Million Veteran Program, and in collaborating studies to identify the common variants, rare variants, and genetically predicted expression across multiple tissues of genes associated with blood pressure [39].
In the participants with sodium intake <2 g/day, we found significant association of rs67617923 in EML6 with increased risk of hypertension. While associations of several genetic variants in EML6 (e.g., rs17046380, rs72806698) with hypertension have been noted previously [40], rs67617923 is a novel genetic variant that was newly discovered in our study. Future studies to replicate this polymorphism association, and efforts to uncover the role of EML6 in blood pressure, are needed.
In participants with sodium intake ≥2 g/day, C6orf10-HLA-DQB1 rs6913309, and RNF213 rs112735431 were associated with increased risk of hypertension. C6orf10-HLA-DQB1 rs6913309 is another novel genetic variant that this study has newly discovered. An allele of HLA-DQB1 (which encodes a class II molecule expressed in antigen-presenting cells) increases the production of autoantibodies against angiotensin AT1 receptors, which was associated with essential hypertension in Chinese patients [41]. However, the exact role of HLA-DQB1 remains unclear. Lie et al. [42] found that the rs112735431 polymorphism of RNF213 was strongly associated with moyamoya disease in East Asian populations, including Chinese, Japanese, and Korean. This polymorphism has also been found to be related to intracranial artery steno-occlusive disease and moyamoya disease in Koreans [43]. The prevalence of moyamoya disease is 10 times higher in Japan and Korea than in Europe [44]. A previous study, which investigated the moyamoya disease susceptibility polymorphisms, reported that p.R4810K in RNF213 was found in the East Asian population but not in Southeast Asians [45]. Interestingly, the minor allele frequencies of the rs112735431 polymorphism were specified only in the East Asian population and in the present study. Although the physiologic function of RNF213 is not yet clear, previous studies found it to be involved in a novel signaling pathway in intracranial angiogenesis, and in the proliferation and maintenance of endothelial cells [42,46]. Ohkubo et al. [47] suggested that RNF213 promotes endothelial cell proliferation in response to inflammatory signals from the environment. Excess salt intake promotes vasoconstriction by decreasing nitric oxide production and increasing endothelial cell stiffness [48]. Furthermore, sodium intake is associated with systemic inflammation [49]. We may assume that excess sodium intake could be a provoking factor for the genetic effect of RNF213 on hypertension. Koizumi et al. [50] revealed that RNF213 was significantly associated with high BP in Japanese populations. Park et al. [43] also reported that the proportion of hypertension was higher in moyamoya diseases patients with the rs112735431 polymorphism of RNF213 than in those with wild type. This Korean GWAS was the first to note the association of this polymorphism with hypertension. Further studies to find association between the rs112735431 polymorphism in RNF213 and hypertension in other races/ethnicities are also needed.
We also found GML-CYP11B1 rs3819496, MYL2-CUX2 rs12229654, and JAG1 rs1887320 to be significantly associated with decreased risk of hypertension in participants with sodium intake ≥2 g/day. SNP rs3819496 represents a novel genetic variant, which was newly discovered in this study. Although MYL2-CUX2 rs12229654 and its association with hypertension were first reported in this study, a strong association of genetic variants of MYL2-CUX2 with high-density lipoprotein cholesterol was shown in a Korean GWAS meta-analysis, and it was replicated in a BioBank Japan GWAS, Health 2, and Shanghai Jiao Tong University cohort [51]. Another study conducted in Korea found that rs1229654 was also associated with dyslipidemia and diabetes [52]. Metabolic alteration due to rs1229654 might lead to the development of hypertension. Interestingly, the frequency of this polymorphism was determined only in the present study and in the East Asian population. Furthermore, persons carrying mutations in MYL-2, encoding slow cardiac myosin regulatory light chain 2, developed hypertrophic cardiomyopathy in the presence of hypertension or other risk factors for hypertrophy [53]. We may cautiously assume that excess salt intake might be an additional risk factor for hypertension or CVD in individuals with this genetic susceptibility. Association of JAG1 rs1887320 with hypertension and CVD risk was reported in Chinese cohorts [54,55].
Our study has certain limitations. We investigated the hypertension-related SNPs according to dietary sodium intake, as measured by FFQ. Although FFQ is a practical method to assess intake in large cohort studies, such questionnaires use a limited list of food items and cannot accurately consider additional salt intake via seasoning. Recall bias is another important limitation with FFQ. Second, we could not exclude the possibility of secondary hypertension due to a lack of information about it. Nevertheless, this is the first study to investigate hypertension-related SNPs according to sodium intake in a large population-based study. The current study identified previously well-reported SNPs related to hypertension. Furthermore, we identified several novel genetic variants associated with hypertension according to sodium intake.

5. Conclusions

In this large population-based study, we identified genetic susceptibility differences between participants whose sodium intake was less than 2 g/day and those whose intake was greater than 2 g/day. Discovering genetic predisposition for different sodium intakes would be helpful to establish the individualized medical nutrition therapy for disease management, and better targeted public health nutrition interventions. In further study, the effects and contributions of other confounding and interaction factors such as smoking, alcohol, and environmental factors on hypertension should be considered comprehensively.

Supplementary Materials

The following are available online at https://www.mdpi.com/2072-6643/12/9/2580/s1, Table S1: The hypertension susceptibility loci identified by GWAS signal in the Korean, Table S2: The significant association SNPs with hypertension susceptibility loci according to sodium intake (<2 g) in the Korean, Table S3: The significant association SNPs with hypertension susceptibility loci according to sodium intake greater than 2g per day in the Korean.

Author Contributions

Y.-J.K., J.O.K., J.-W.L., K.-W.H.: conception and design of data, analysis and interpretation of data, drafting the article or revising it critically for important intellectual content and final approval of the version to be published. J.-M.P., J.-E.C., D.-H.P., Y.S., S.-J.K.: analysis and interpretation of data. All authors have read and agreed to the published version of the manuscript.

Funding

This work was supported by the Bio and Medical Technology Development Program through the National Research Foundation of Korea, funded by the Ministry of Science, ICT, and Future Planning (NRF2018R1D1A1B07049223), and by the Technology Innovation Program (20002781, A Platform for Prediction and Management of Health Risk Based on Personal Big Data and Lifelogging) funded by the Ministry of Trade, Industry and Energy (MOTIE), Korea.

Acknowledgments

This study was conducted with bioresources from National Biobank of Korea, the Centers of Disease Control and Prevention, Republic of Korea (2019-059).

Conflicts of Interest

The authors declare no conflict of interest.

References

  1. Shrimanker, I.; Bhattarai, S. Electrolytes. In StatPearls; StatPearls Publishing: Treasure Island, FL, USA, 2020. [Google Scholar]
  2. GBD 2017 Risk Factor Collaborators. Global, regional, and national comparative risk assessment of 84 behavioural, environmental and occupational, and metabolic risks or clusters of risks for 195 countries and territories, 1990–2017: A systematic analysis for the Global Burden of Disease Study 2017. Lancet 2018, 392, 1923–1994. [Google Scholar]
  3. Strazzullo, P.; D’Elia, L.; Kandala, N.B.; Cappuccio, F.P. Salt intake, stroke, and cardiovascular disease:meta-analysis of prospective studies. BMJ 2009, 339, b4567. [Google Scholar] [CrossRef] [Green Version]
  4. He, F.J.; Li, J.; Macgregor, G.A. Effect of longer term modest salt reduction on blood pressure: Cochrane systematic review and meta-analysis of randomised trials. BMJ 2013, 346, f1325. [Google Scholar] [CrossRef] [PubMed] [Green Version]
  5. Khaw, K.T.; Bingham, S.; Welch, A.; Luben, R.; O’Brien, E.; Wareham, N.; Day, N. Blood pressure and urinary sodium in men and women: The Norfolk Cohort of the European Prospective Investigation into Cancer (EPIC-Norfolk). Am. J. Clin. Nutr. 2004, 80, 1397–1403. [Google Scholar] [CrossRef] [PubMed]
  6. World Health Organization. Guideline: Sodium Intake for Adults and Children; World Health Organization: Geneva, Switzerland, 2012. [Google Scholar]
  7. Ivy, J.R.; Bailey, M.A. Pressure natriuresis and the renal control of arterial blood pressure. J. Physiol. 2014, 592, 3955–3967. [Google Scholar] [CrossRef]
  8. Suzuki, H.; Kimmel, P.L. Nutrition and Kidney Disease: A New Era; Karger Medical and Scientific Publishers: Basel, Switzerland, 2007; Volume 155. [Google Scholar]
  9. Huang, L.; Chu, Y.; Huang, X.; Ma, S.; Lin, K.; Huang, K.; Sun, H.; Yang, Z. Association between gene polymorphisms of voltage-dependent Ca2+ channels and hypertension in the dai people of china: A case-control study. BMC Med. Genet. 2020, 21, 44. [Google Scholar] [CrossRef] [Green Version]
  10. Mervaala, E.M.; Himberg, J.J.; Laakso, J.; Tuomainen, P.; Karppanen, H. Beneficial effects of a potassium- and magnesium-enriched salt alternative. Hypertension 1992, 19, 535–540. [Google Scholar] [CrossRef] [PubMed] [Green Version]
  11. Kathryn, L.M. Pathophysiology: The Biologic Basis for Disease in Adults and Children, 7th ed.; Elsevier, Mosby: St. Louis, MO, USA, 2014. [Google Scholar]
  12. Asferg, C.L.; Nielsen, S.J.; Andersen, U.B.; Linneberg, A.; Møller, D.V.; Hedley, P.L.; Christiansen, M.; Goetze, J.P.; Esler, M.; Jeppesen, J.L. Relative atrial natriuretic peptide deficiency and inadequate renin and angiotensin ii suppression in obese hypertensive men. Hypertension 2013, 62, 147–153. [Google Scholar] [CrossRef] [PubMed] [Green Version]
  13. Stolarz-Skrzypek, K.; Kuznetsova, T.; Thijs, L.; Tikhonoff, V.; Seidlerová, J.; Richart, T.; Jin, Y.; Olszanecka, A.; Malyutina, S.; Casiglia, E.; et al. Fatal and nonfatal outcomes, incidence of hypertension, and blood pressure changes in relation to urinary sodium excretion. JAMA 2011, 305, 1777–1785. [Google Scholar] [CrossRef] [Green Version]
  14. O’Donnell, M.J.; Yusuf, S.; Mente, A.; Gao, P.; Mann, J.F.; Teo, K.; McQueen, M.; Sleight, P.; Sharma, A.M.; Dans, A.; et al. Urinary sodium and potassium excretion and risk of cardiovascular events. JAMA 2011, 306, 2229–2238. [Google Scholar] [CrossRef] [Green Version]
  15. O’Donnell, M.; Mente, A.; Rangarajan, S.; McQueen, M.J.; Wang, X.; Liu, L.; Yan, H.; Lee, S.F.; Mony, P.; Devanath, A.; et al. Urinary sodium and potassium excretion, mortality, and cardiovascular events. N. Engl. J. Med. 2014, 371, 612–623. [Google Scholar] [CrossRef] [PubMed] [Green Version]
  16. Carretero, O.A.; Oparil, S. Essential hypertension. Part I: Definition and etiology. Circulation 2000, 101, 329–335. [Google Scholar] [CrossRef] [PubMed]
  17. Doris, P.A. The genetics of blood pressure and hypertension: The role of rare variation. Cardiovasc. Ther. 2011, 29, 37–45. [Google Scholar] [CrossRef] [PubMed] [Green Version]
  18. Levy, D.; DeStefano, A.L.; Larson, M.G.; O’Donnell, C.J.; Lifton, R.P.; Gavras, H.; Cupples, L.A.; Myers, R.H. Evidence for a gene influencing blood pressure on chromosome 17. Genome scan linkage results for longitudinal blood pressure phenotypes in subjects from the framingham heart study. Hypertension 2000, 36, 477–483. [Google Scholar] [CrossRef] [PubMed]
  19. Wang, D.G.; Fan, J.B.; Siao, C.J.; Berno, A.; Young, P.; Sapolsky, R.; Ghandour, G.; Perkins, N.; Winchester, E.; Spencer, J.; et al. Large-scale identification, mapping, and genotyping of single-nucleotide polymorphisms in the human genome. Science 1998, 280, 1077–1082. [Google Scholar] [CrossRef] [PubMed] [Green Version]
  20. Stover, P.J. Influence of human genetic variation on nutritional requirements. Am. J. Clin. Nutr. 2006, 83, 436S–442S. [Google Scholar] [CrossRef] [Green Version]
  21. Kim, Y.; Han, B.G. Cohort Profile: The Korean Genome and Epidemiology Study (KoGES) Consortium. Int. J. Epidemiol. 2017, 46, 1350. [Google Scholar] [CrossRef]
  22. Shim, J.S.; Oh, K.; Kim, H.C. Dietary assessment methods in epidemiologic studies. Epidemiol. Health 2014, 36, e2014009. [Google Scholar] [CrossRef]
  23. Moon, S.; Kim, Y.J.; Han, S.; Hwang, M.Y.; Shin, D.M.; Park, M.Y.; Lu, Y.; Yoon, K.; Jang, H.M.; Kim, Y.K.; et al. The Korea Biobank Array: Design and Identification of Coding Variants Associated with Blood Biochemical Traits. Sci. Rep. 2019, 9, 1382. [Google Scholar] [CrossRef] [Green Version]
  24. Guyton, A.C. Blood pressure control—Special role of the kidneys and body fluids. Science 1991, 252, 1813–1816. [Google Scholar] [CrossRef]
  25. Gug, C.; Mihaescu, A.; Mozos, I. Two mutations in the thiazide-sensitive nacl co-transporter gene in a romanian gitelman syndrome patient: Case report. Ther. Clin. Risk Manag. 2018, 14, 149–155. [Google Scholar] [CrossRef] [PubMed] [Green Version]
  26. Davies, M.; Fraser, S.A.; Galic, S.; Choy, S.W.; Katerelos, M.; Gleich, K.; Kemp, B.E.; Mount, P.F.; Power, D.A. Novel mechanisms of na+ retention in obesity: Phosphorylation of nkcc2 and regulation of spak/osr1 by ampk. Am. J. Physiol. Renal Physiol. 2014, 307, F96–F106. [Google Scholar] [CrossRef] [PubMed] [Green Version]
  27. Weinberger, M.H.; Miller, J.Z.; Luft, F.C.; Grim, C.E.; Fineberg, N.S. Definitions and characteristics of sodium sensitivity and blood pressure resistance. Hypertension 1986, 8, II127. [Google Scholar] [CrossRef] [PubMed] [Green Version]
  28. Elijovich, F.; Weinberger, M.H.; Anderson, C.A.; Appel, L.J.; Bursztyn, M.; Cook, N.R.; Dart, R.A.; Newton-Cheh, C.H.; Sacks, F.M.; Laffer, C.L. Salt sensitivity of blood pressure: A scientific statement from the american heart association. Hypertension 2016, 68, e7–e46. [Google Scholar] [CrossRef] [PubMed] [Green Version]
  29. Flack, J.M.; Ensrud, K.E.; Mascioli, S.; Launer, C.A.; Svendsen, K.; Elmer, P.J.; Grimm, R.H., Jr. Racial and ethnic modifiers of the salt-blood pressure response. Hypertension 1991, 17, I115–I121. [Google Scholar] [CrossRef] [Green Version]
  30. Weinberger, M.H. Salt sensitivity of blood pressure in humans. Hypertension 1996, 27, 481–490. [Google Scholar] [CrossRef]
  31. Newton-Cheh, C.; Johnson, T.; Gateva, V.; Tobin, M.D.; Bochud, M.; Coin, L.; Najjar, S.S.; Zhao, J.H.; Heath, S.C.; Eyheramendy, S.; et al. Genome-wide association study identifies eight loci associated with blood pressure. Nat. Genet. 2009, 41, 666–676. [Google Scholar] [CrossRef]
  32. Vatner, S.F. FGF induces hypertrophy and angiogenesis in hibernating myocardium. Circ. Res. 2005, 96, 705–707. [Google Scholar] [CrossRef] [Green Version]
  33. Xi, B.; Shen, Y.; Reilly, K.H.; Wang, X.; Mi, J. Recapitulation of four hypertension susceptibility genes (CSK, CYP17A1, MTHFR, and FGF5) in East Asians. Metabolism 2013, 62, 196–203. [Google Scholar] [CrossRef]
  34. Rhee, M.Y.; Yang, S.J.; Oh, S.W.; Park, Y.; Kim, C.I.; Park, H.K.; Park, S.W.; Park, C.Y. Novel genetic variations associated with salt sensitivity in the Korean population. Hypertens. Res. 2011, 34, 606–611. [Google Scholar] [CrossRef]
  35. Cheema, A.N.; Rosenthal, S.L.; Ilyas Kamboh, M. Proficiency of data interpretation: Identification of signaling SNPs/specific loci for coronary artery disease. Database 2017, 2017. [Google Scholar] [CrossRef] [PubMed] [Green Version]
  36. Bragina, E.Y.; Goncharova, I.A.; Garaeva, A.F.; Nemerov, E.V.; Babovskaya, A.A.; Karpov, A.B.; Semenova, Y.V.; Zhalsanova, I.Z.; Gomboeva, D.E.; Saik, O.V. Molecular relationships between bronchial asthma and hypertension as comorbid diseases. J. Integr. Bioinform. 2018, 15. [Google Scholar] [CrossRef] [PubMed]
  37. Tabara, Y.; Kohara, K.; Kita, Y.; Hirawa, N.; Katsuya, T.; Ohkubo, T.; Hiura, Y.; Tajima, A.; Morisaki, T.; Miyata, T.; et al. Common variants in the ATP2B1 gene are associated with susceptibility to hypertension: The Japanese Millennium Genome Project. Hypertension 2010, 56, 973–980. [Google Scholar] [CrossRef] [PubMed] [Green Version]
  38. Kobayashi, Y.; Hirawa, N.; Tabara, Y.; Muraoka, H.; Fujita, M.; Miyazaki, N.; Fujiwara, A.; Ichikawa, Y.; Yamamoto, Y.; Ichihara, N.; et al. Mice lacking hypertension candidate gene ATP2B1 in vascular smooth muscle cells show significant blood pressure elevation. Hypertension 2012, 59, 854–860. [Google Scholar] [CrossRef] [Green Version]
  39. Giri, A.; Hellwege, J.N.; Keaton, J.M.; Park, J.; Qiu, C.; Warren, H.R.; Torstenson, E.S.; Kovesdy, C.P.; Sun, Y.V.; Wilson, O.D.; et al. Trans-ethnic association study of blood pressure determinants in over 750,000 individuals. Nat. Genet. 2019, 51, 51–62. [Google Scholar] [CrossRef] [Green Version]
  40. Takeuchi, F.; Akiyama, M.; Matoba, N.; Katsuya, T.; Nakatochi, M.; Tabara, Y.; Narita, A.; Saw, W.Y.; Moon, S.; Spracklen, C.N.; et al. Interethnic analyses of blood pressure loci in populations of East Asian and European descent. Nat. Commun. 2018, 9, 1–16. [Google Scholar] [CrossRef] [Green Version]
  41. Zhu, F.; Sun, Y.; Wang, M.; Ma, S.; Chen, X.; Cao, A.; Chen, F.; Qiu, Y.; Liao, Y. Correlation between HLA-DRB1, HLA-DQB1 polymorphism and autoantibodies against angiotensin AT(1) receptors in Chinese patients with essential hypertension. Clin. Cardiol. 2011, 34, 302–308. [Google Scholar] [CrossRef]
  42. Liu, W.; Morito, D.; Takashima, S.; Mineharu, Y.; Kobayashi, H.; Hitomi, T.; Hashikata, H.; Matsuura, N.; Yamazaki, S.; Toyoda, A.; et al. Identification of RNF213 as a susceptibility gene for moyamoya disease and its possible role in vascular development. PLoS ONE 2011, 6, e22542. [Google Scholar] [CrossRef] [Green Version]
  43. Park, M.G.; Shin, J.H.; Lee, S.W.; Park, H.R.; Park, K.P. RNF213 rs112735431 polymorphism in intracranial artery steno-occlusive disease and moyamoya disease in Koreans. J. Neurol. Sci. 2017, 375, 331–334. [Google Scholar] [CrossRef]
  44. Guey, S.; Kraemer, M.; Hervé, D.; Ludwig, T.; Kossorotoff, M.; Bergametti, F.; Schwitalla, J.C.; Choi, S.; Broseus, L.; Callebaut, I.; et al. Rare rnf213 variants in the c-terminal region encompassing the ring-finger domain are associated with moyamoya angiopathy in caucasians. Eur. J. Hum. Genet. 2017, 25, 995–1003. [Google Scholar] [CrossRef]
  45. Liu, W.; Hitomi, T.; Kobayashi, H.; Harada, K.H.; Koizumi, A. Distribution of moyamoya disease susceptibility polymorphism p.R4810k in rnf213 in east and southeast asian populations. Neurol Med. Chir. 2012, 52, 299–303. [Google Scholar] [CrossRef] [Green Version]
  46. Fujimura, M.; Sonobe, S.; Nishijima, Y.; Niizuma, K.; Sakata, H.; Kure, S.; Tominaga, T. Genetics and Biomarkers of Moyamoya Disease: Significance of RNF213 as a Susceptibility Gene. J. Stroke 2014, 16, 65–72. [Google Scholar] [CrossRef] [PubMed] [Green Version]
  47. Ohkubo, K.; Sakai, Y.; Inoue, H.; Akamine, S.; Ishizaki, Y.; Matsushita, Y.; Sanefuji, M.; Torisu, H.; Ihara, K.; Sardiello, M.; et al. Moyamoya disease susceptibility gene RNF213 links inflammatory and angiogenic signals in endothelial cells. Sci. Rep. 2015, 5, 13191. [Google Scholar] [CrossRef] [PubMed] [Green Version]
  48. Toda, N.; Arakawa, K. Salt-induced hemodynamic regulation mediated by nitric oxide. J. Hypertens. 2011, 29, 415–424. [Google Scholar] [CrossRef] [PubMed]
  49. Fogarty, A.W.; Lewis, S.A.; McKeever, T.M.; Britton, J.R. Is higher sodium intake associated with elevated systemic inflammation? A population-based study. Am. J. Clin. Nutr. 2009, 89, 1901–1904. [Google Scholar] [CrossRef]
  50. Koizumi, A.; Kobayashi, H.; Liu, W.; Fujii, Y.; Senevirathna, S.T.; Nanayakkara, S.; Okuda, H.; Hitomi, T.; Harada, K.H.; Takenaka, K.; et al. P.R4810K, a polymorphism of RNF213, the susceptibility gene for moyamoya disease, is associated with blood pressure. Environ. Health Prev. Med. 2013, 18, 121–129. [Google Scholar] [CrossRef] [Green Version]
  51. Kim, Y.J.; Go, M.J.; Hu, C.; Hong, C.B.; Kim, Y.K.; Lee, J.Y.; Hwang, J.Y.; Oh, J.H.; Kim, D.J.; Kim, N.H.; et al. Large-scale genome-wide association studies in East Asians identify new genetic loci influencing metabolic traits. Nat. Genet. 2011, 43, 990–995. [Google Scholar] [CrossRef]
  52. Heo, S.G.; Hwang, J.Y.; Uhmn, S.; Go, M.J.; Oh, B.; Lee, J.Y.; Park, J.W. Male-specific genetic effect on hypertension and metabolic disorders. Hum. Genet. 2014, 133, 311–319. [Google Scholar] [CrossRef]
  53. Claes, G.R.; van Tienen, F.H.; Lindsey, P.; Krapels, I.P.; Helderman-van den Enden, A.T.; Hoos, M.B.; Barrois, Y.E.; Janssen, J.W.; Paulussen, A.D.; Sels, J.W.; et al. Hypertrophic remodelling in cardiac regulatory myosin light chain (MYL2) founder mutation carriers. Eur. Heart J. 2016, 37, 1815–1822. [Google Scholar] [CrossRef] [Green Version]
  54. Lu, X.; Huang, J.; Wang, L.; Chen, S.; Yang, X.; Li, J.; Cao, J.; Chen, J.; Li, Y.; Zhao, L.; et al. Genetic predisposition to higher blood pressure increases risk of incident hypertension and cardiovascular diseases in Chinese. Hypertension 2015, 66, 786–792. [Google Scholar] [CrossRef] [Green Version]
  55. Lu, X.; Wang, L.; Lin, X.; Huang, J.; Charles Gu, C.; He, M.; Shen, H.; He, J.; Zhu, J.; Li, H.; et al. Genome-wide association study in Chinese identifies novel loci for blood pressure and hypertension. Hum. Mol. Genet. 2015, 24, 865–874. [Google Scholar] [CrossRef] [PubMed]
Figure 1. Flow chart of study population.
Nutrients 12 02580 g001
Figure 2. A Miami plot shows p-values for the SNP associations with hypertension in participants whose sodium intake was either <2 g/day or ≥2 g/day.
Nutrients 12 02580 g002
Table 1. General characteristics of study population based on sodium intake and according to prevalence of hypertension.
CharacteristicsSodium Intakep1,†p2,†p3,†Sodium Intake <2 g/DaySodium Intake ≥2 g/Day
<2 g/Day
(n = 24,415)
≥2 g/Day
(n = 32,944)
Without HTN
(n = 17,869)
With HTN
(n = 6546)
pWithout HTN
(n = 24,245)
With HTN
(n = 8699)
p
Age (years,)54.05 ± 7.9053.58 ± 8.07<0.0001<0.00010.00252.70 ± 7.7057.73 ± 7.25<0.000152.23 ± 7.8557.36 ± 7.44<0.0001
Sex (male, %)7453 (30.5)12,348 (37.5)<0.0001 <0.0001 <0.0001 4929 (27.6)2524 (38.6)<0.0001 8264 (34.1)4084 (46.9)<0.0001
BMI (kg/m2)24.02 ± 46.6324.20 ± 34.680.6060.743<0.000123.29 ± 2.7024.91 ± 2.92<0.000123.59 ± 2.7425.17 ± 2.95<0.0001
WC (cm,)80.08 ± 8.5481.26 ± 8.65<0.0001<0.0001<0.000178.72 ± 8.2383.78 ± 8.29<0.000179.93 ± 8.3584.97 ± 8.40<0.0001
SBP (mmHg)122.14 ± 14.80122.57 ± 14.730.001<0.00010.042117.57 ± 11.73134.62 ± 15.12<0.0001118.07 ± 11.65135.12 ± 15.14<0.0001
DBP (mmHg)75.44 ± 9.7175.94 ± 9.72<0.0001<0.00010.00172.89 ± 8.1882.43 ± 10.11<0.000173.42 ± 8.2182.96 ± 10.15<0.0001
HR (bpm)69.30 ± 9.2869.06 ± 9.000.0020.0120.0968.94 ± 8.9370.27 ± 10.11<0.000168.73 ± 8.7070.00 ± 9.74<0.0001
TC (mg/dL)197.19 ± 36.00197.50 ± 35.450.3070.4240.558197.88 ± 35.46195.33 ± 37.35<0.0001198.16 ± 35.11195.68 ± 36.30<0.0001
TG (mg/dL)122.06 ± 83.51127.35 ± 87.03<0.0001<0.00010.0001115.17 ± 77.32140.86 ± 95.93<0.0001120.52 ± 82.17146.35 ± 96.79<0.0001
HDL-C (mg/dL)54.23 ± 13.3053.43 ± 13.04<0.0001<0.0001<0.000155.05 ± 13.3452.00 ± 12.91<0.000154.23 ± 13.1451.19 ± 12.49<0.0001
LDL-C (mg/dL)119.14 ± 32.36119.40 ± 31.980.3440.5310.52120.28 ± 31.72116.00 ± 33.89<0.0001120.48 ± 31.46116.36 ± 33.21<0.0001
CRP (mg/dL)0.14 ± 0.450.14 ± 0.340.3330.4320.6390.13 ± 0.460.17 ± 0.41<0.00010.13 ± 0.340.16 ± 0.34<0.0001
Exercise status
Yes (%)13,103 (53.7)18,250 (55.4)<0.0001 <0.0001 0.4419422 (52.7)3681 (56.2)<0.0001 13,304 (54.9)4946 (56.9)<0.0001
No (%)11,312 (46.3)14,694 (44.6) 8447 (47.3)2865 (43.8) 10,941 (45.1)3753 (43.1)
Smoking status
Non-smokers (%)18,638 (76.3)23,386 (71.0)<0.0001 <0.0001 <0.0001 13,957 (78.1)4681 (71.5)<0.0001 17,779 (73.3)5607 (64.5)<0.0001
Ex-smokers (%)3484 (14.3)5586 (17.0) 2235 (12.5)1249 (19.1) 3562 (14.7)2024 (23.3)
Current smokers (%)2293 (9.4)3972 (12.1) 1677 (9.4)616 (9.4) 2904 (12.0)1068 (12.3)
Drinking status
Non-drinker (%)13,411 (54.9)16,369 (49.7)<0.0001 <0.0001 <0.0001 9880 (55.3)3531 (53.9)<0.0001 12,333 (50.9)4036 (46.4)<0.0001
Ex-drinker (%)921 (3.8)1212 (3.7) 605 (3.4)316 (4.8) 767 (3.2)445 (5.1)
Current drinker (%)10083 (41.3)15363 (46.6) 7384 (41.3)2699 (41.2) 11145 (46.0)4218 (48.5)
Total intake energy (kcal/day)1498.32 ± 394.321923.57 ± 577.56<0.0001<0.0001<0.00011502.56 ± 397.521486.77 ± 385.270.00561938.06 ± 588.371883.05 ± 544.22<0.0001
Sugar (g/day)275.09 ± 74.34335.71 ± 92.28<0.0001<0.0001<0.0001274.83 ± 74.99275.80 ± 72.540.3667337.21 ± 93.79331.51 ± 87.81<0.0001
Fat (g/day)21.03 ± 10.7232.85 ± 19.94<0.0001<0.0001<0.000121.54 ± 10.9419.62 ± 9.96<0.000133.57 ± 20.3230.81 ± 18.71<0.0001
Protein (g/day)46.51 ± 14.3968.25 ± 27.58<0.0001<0.0001<0.000146.83 ± 14.5045.64 ± 14.03<0.000168.90 ± 28.0366.45 ± 26.22<0.0001
Sugar ratio73.48 ± 6.4570.41 ± 7.05<0.0001<0.0001<0.000112.53 ± 2.2312.32 ± 2.12<0.000114.12 ± 2.5514.02 ± 2.69<0.0001
Fat ratio5.58 ± 2.286.60 ± 2.40<0.0001<0.0001<0.00015.71 ± 2.325.24 ± 2.12<0.00016.70 ± 2.396.32 ± 2.40<0.0001
Protein ratio12.47 ± 2.2014.09 ± 2.59<0.0001<0.0001<0.000173.19 ± 6.5774.28 ± 6.05<0.000170.20 ± 7.0171.01 ± 7.12<0.0001
Na (mg/day)1323.39 ± 435.983254.94 ± 1251.19<0.0001<0.0001<0.00011328.30 ± 433.081310.05 ± 443.580.00383258.11 ± 1258.903245.85 ± 1229.300.4329
K (mg/day)1591.80 ± 561.362694.00 ± 1046.87<0.0001<0.0001<0.00011607.78 ± 564.811548.20 ± 549.57<0.00012719.81 ± 1069.772621.77 ± 976.41<0.0001
Na/K ratio0.87 ± 0.281.26 ± 0.34<0.0001<0.0001<0.00010.86 ± 0.280.88 ± 0.29<0.00011.25 ± 0.341.29 ± 0.35<0.0001
Data are presented either as mean ± standard deviation or as numbers (percentage). p values are calculated by two-tail Student’s t-test or Chi-squared test . 1 The p-value comparing the baseline characteristic between the sodium intake <2 g/day group and the sodium intake ≥2 g/day group, among all participants.2 The p-value comparing the baseline characteristic between the sodium intake <2 g/day group and sodium intake ≥2 g/day group, among participants without HTN. 3 The p-value comparing the baseline characteristic between the sodium intake <2 g/day group and sodium intake ≥2 g/day group, among participants with HTN. Sugar intake ratio = total sugar (gram) × 4 kcal/total energy intake (kcal) × 100; protein intake ratio = protein (gram) × 4 kcal/total energy intake (kcal) × 100; fat intake ratio (gram) × 9 kcal/total energy intake (kcal) × 100. BMI, body mass index; WC, waist circumference; SBP, systolic blood pressure; DBP, diastolic blood pressure; HR, heart rate; TC, total cholesterol; TG, triglyceride; HDL, high-density lipoprotein cholesterol; LDL, low density lipoprotein cholesterol; CRP, C-reactive protein. HTN, hypertension.
Table 2. Single-nucleotide polymorphisms (SNPs) most strongly associated with hypertension susceptibility loci in the Korean population, according to sodium intake.
SNPChr:BPA1MAFGeneFeatureCluster SNP *OR (95% CI)p
Present StudyEASEURAMR
Participants with sodium intake <2 g/day
rs676179232:54968517A0.063 0.074 0.160 0.098 EML6intron variantrs72806698; rs67246257; rs67514855 1.294 (1.187–1.410)4.29 × 10⁻⁹
rs169980734:81184341T0.347 0.360 0.268 0.267 FGF5upstream gene variantrs12509595; rs108571471.245 (1.190–1.302)1.14 × 10⁻²¹
rs1119158210:104913653A0.227 0.265 0.089 0.193 NT5C2intron variantrs11191479; rs11191484; rs72050190; rs145010450; rs108838150.849 (0.806–0.895)1.08 × 10⁻⁹
rs1110537812:90090741T0.372 0.310 0.141 0.112 ATP2B1–LINC00936intergenic regionrs2681485; rs7136259; rs11105377; rs1401982; rs16890400.874 (0.836–0.915)4.67 × 10⁻⁹
Participants with sodium intake ≥2 g/day
rs125095954:81182554C0.347 0.361 0.267 0.267 PRDM8–FGF5intergenic regionrs16998073; rs108571471.228 (1.181–1.277)7.46 × 10⁻²⁵
rs69133096:32339840A0.212 0.139 0.310 0.244 C6orf10–HLA-DQB1upstream gene variantN/A1.145 (1.094–1.197)4.23 × 10⁻⁹
rs11273543117:78358945A0.011 0.002 0.000 0.000 RNF213missense variantrs1383098701.706 (1.446–2.012)2.38 × 10⁻¹⁰
rs38194968:143923891G0.312 0.321 0.421 BP0.442 GML–CYP11B1intron variantrs3753123; rs143247792; rs4527848; rs4606038; rs285240310.892 (0.857.0.929)3.73 × 10⁻⁸
rs14047339610:104795885GAC0.247 0.285 0.097 0.197 CNNM2–NT5C2intron variantrs11191479; rs11191484; rs72050190; rs145010450; rs108838150.836 (0.800–0.873)1.11 × 10⁻¹⁵
rs1222965412:111414461G0.141 0.159 0.000 0.000 MYL2–CUX2intergenic regionrs149607519; rs148177611; rs2188380; rs122271620.834 (0.787–0.883)5.25 × 10⁻¹⁰
rs188732020:10965998G0.478 0.540 0.461 0.264 JAG1intergenic regionrs6108787; rs1327235; rs6108789; rs9132200.892 (0.859–0.925)1.45x10⁻⁹
SNP, single-nucleotide polymorphism; Chr, chromosome; BP, base pair; EAS, East Asian; EUR, European; AMR, American; N/A, not applicable; MAF, major allele frequency; A1, minor allele; OR, odds ratio; 95% CI, 95% confidence interval. * The cluster SNP is the top five SNPs with an R2 value of 0.8 or higher, and within a ±200 kb range.

