Is the Sustainable Choice a Healthy Choice?—Water Footprint Consequence of Changing Dietary Patterns


Abstract
1. Introduction
- (1)
- Despite the majority of similar studies focusing on GHGE or several environmental factors, the present one focused on the water footprint and gives a more detailed analysis of that critically important issue.
- (2)
- The studies on sustainable nutrition focus on countries and regions. There is a wide-ranging consensus in the literature [28] that sociocultural traditions and differences in food availability limit the application of general solutions, which is why each research study, focusing on the environmental consequences of changing dietary patterns in a given region or country, could be considered a contribution to a better understanding of the interplay between environment and nutrition. Since all dimensions related to sustainable nutrition (such as the economy, food availability, food safety, sociocultural aspects, traditional meals, health condition of the population, etc.) are regionally different, each study that focuses on a new region necessarily involves methodological novelty. The challenge of these analyses is to collect and compile data from different databases and to develop scenarios and their measurements to evaluate dietary quality, environmental impact, and the association between them [29]. According to our best knowledge, this is the first study to attempt to integrate healthiness and the environmental aspect in terms of the nutrition of Hungary; thus, the methods can be regarded as novelties. These methods were based on a critical literature review but needed to be innovatively applied in the context of Hungary. Based on these, this study can be regarded as a methodological novelty and its results can contribute to the development of dietary recommendations involving sustainable nutrition in Hungary.
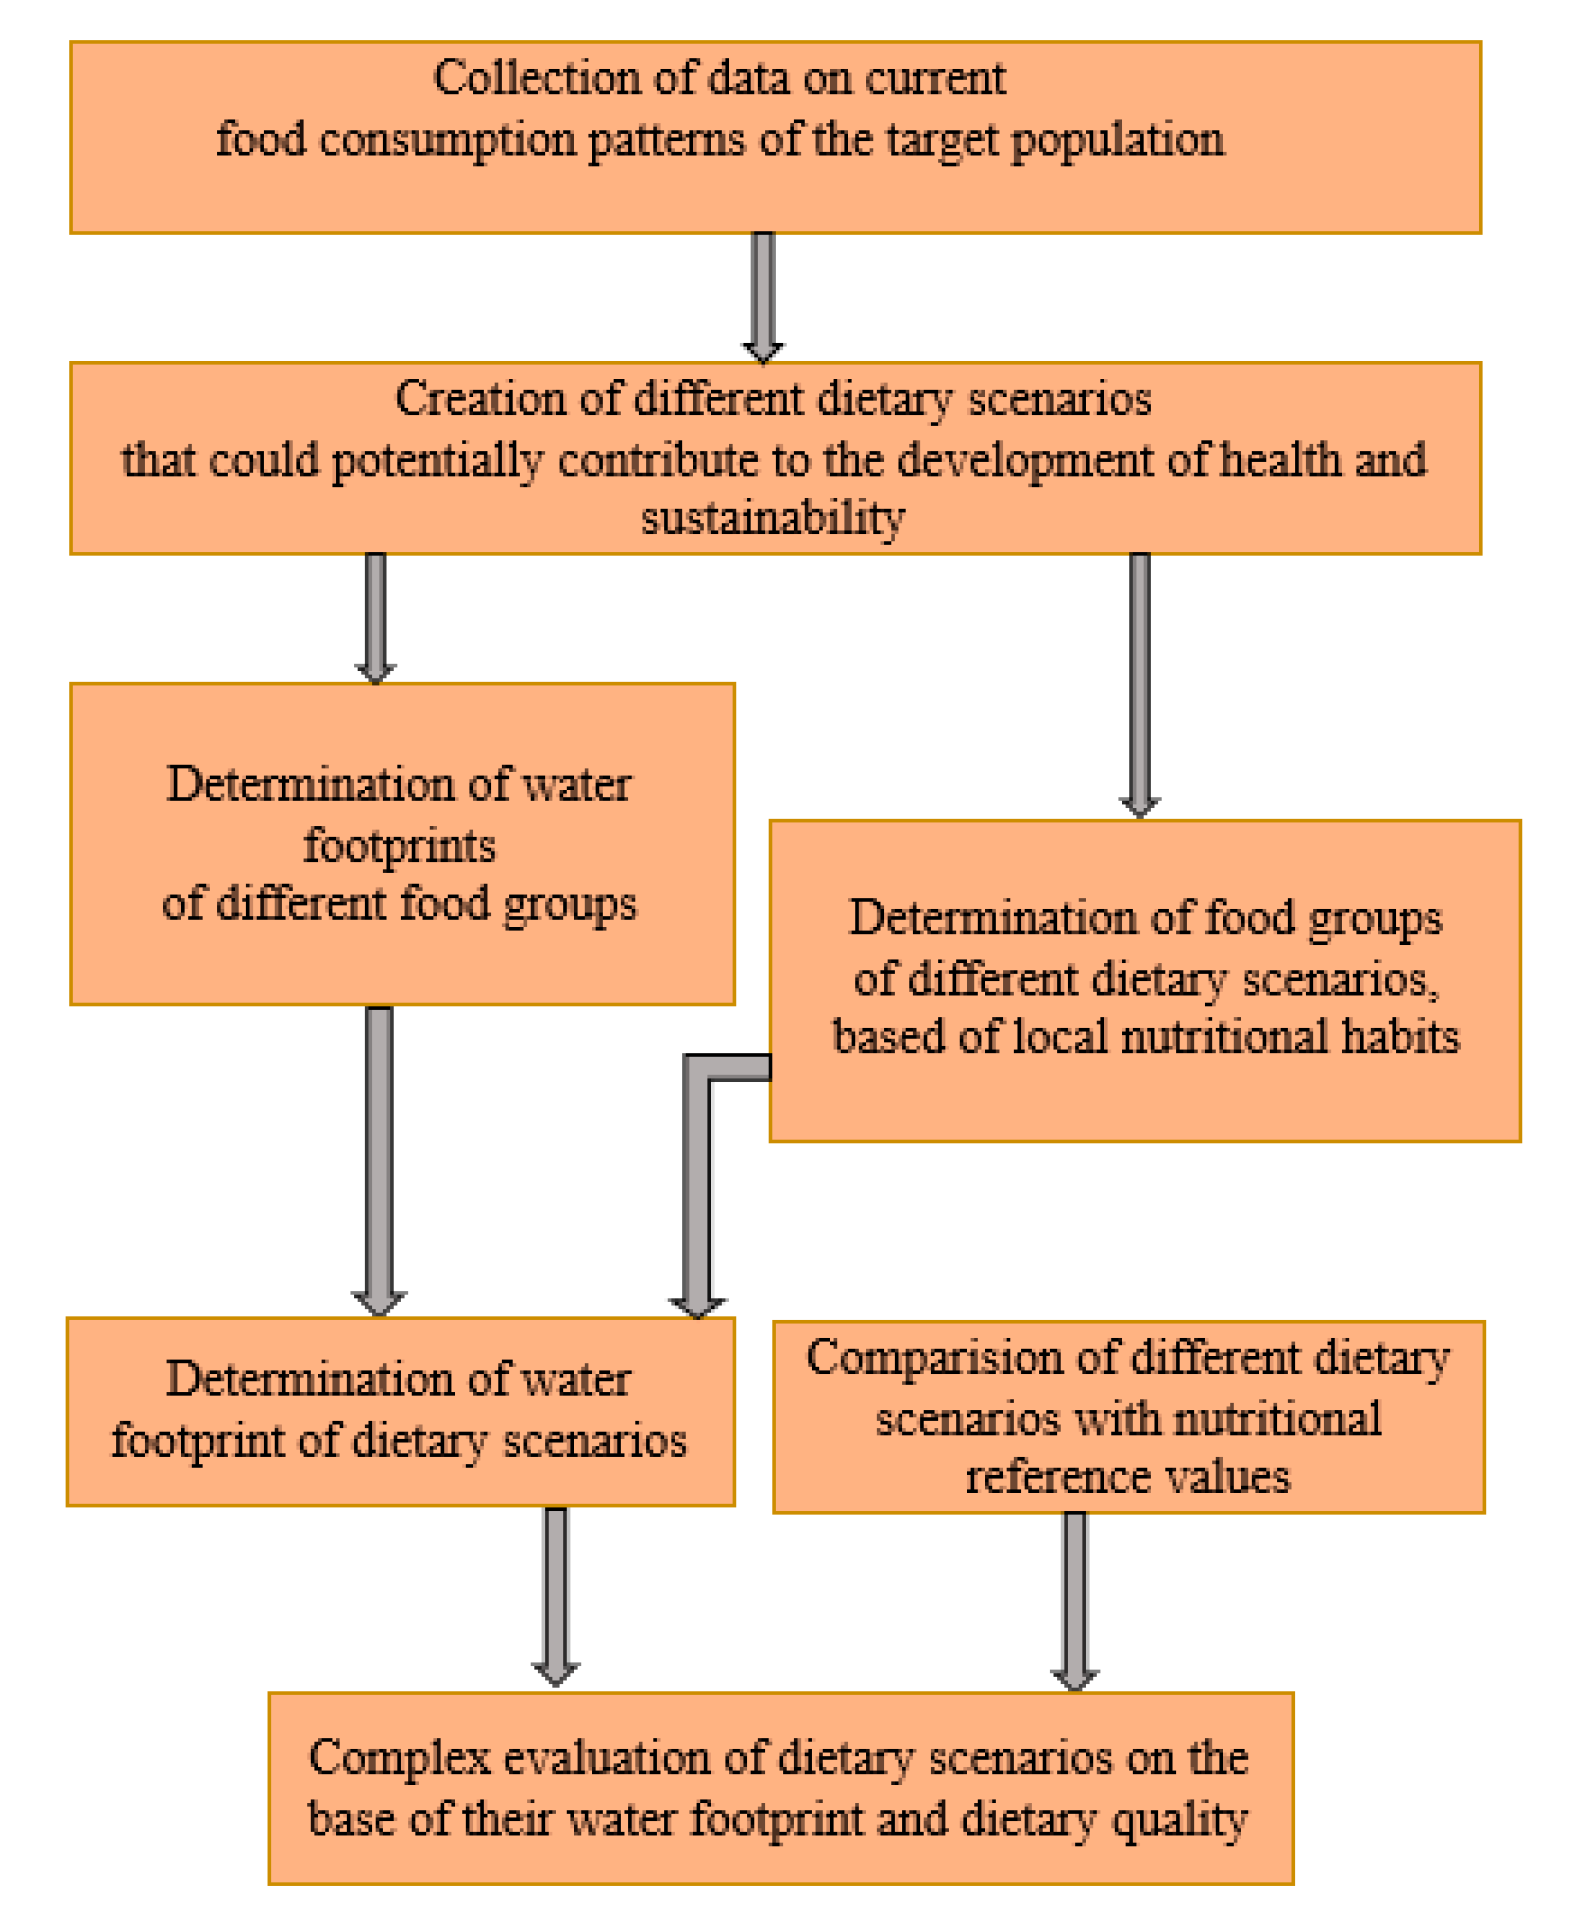
2. Materials and Methods
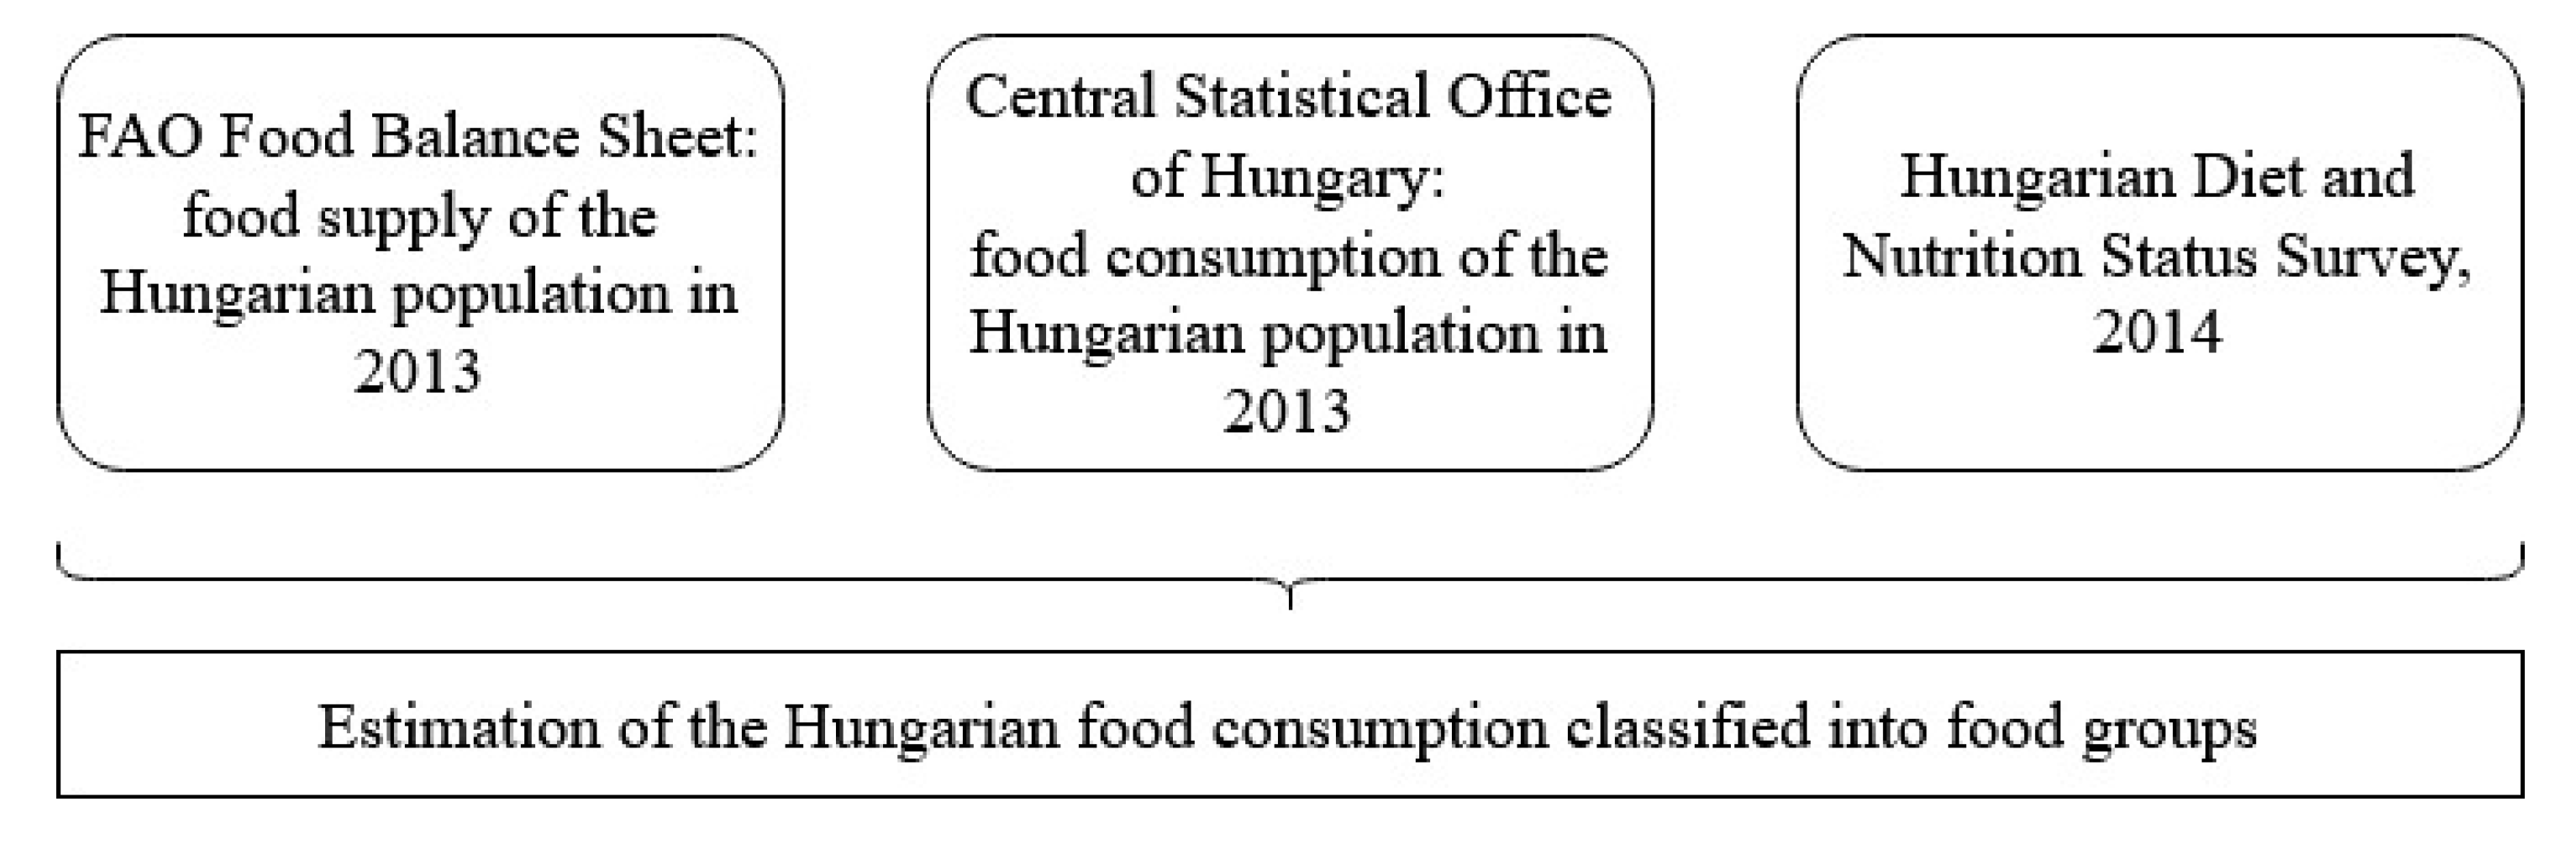
2.1. Estimation of Food Consumption and the Proportion of Food Groups that Represent Current Nutrition in Hungary
- NDp = weighted average of the nutrient density of the pth food group (nutrient quantity/100 g),
- FIs = supply of ith food item (100 g/day/capita), and
- FDi = nutrient density of food item (nutrient quantity/100 g).
2.2. Characteristics of the Scenarios
- (1)
- All dietary scenarios are composed of food groups that include the weighted average of the most commonly consumed food items in Hungary in order to represent a relevant and culturally acceptable diet as close as possible to reality.
- (2)
- All dietary scenarios have a standardized energy content for both men (2718 kcal/day/capita) and women (2033 kcal/day/capita) that are based on the published data of the HDNSS (Supplement 4). Separation of male and female scenarios was necessary, since the recommended nutrient values are gender specific ones, and the published data of the HDNSS—which were the bases of all scenarios—are also specific for genders [33].
- (3)
- The food group of alcoholic drinks was included in all scenarios even if they were not included in all of the alternative guidelines, since they are present in the nutrition of the Hungarian population in a considerable amount [31] and the exclusion of them from alternative dietary scenarios would show biased results.
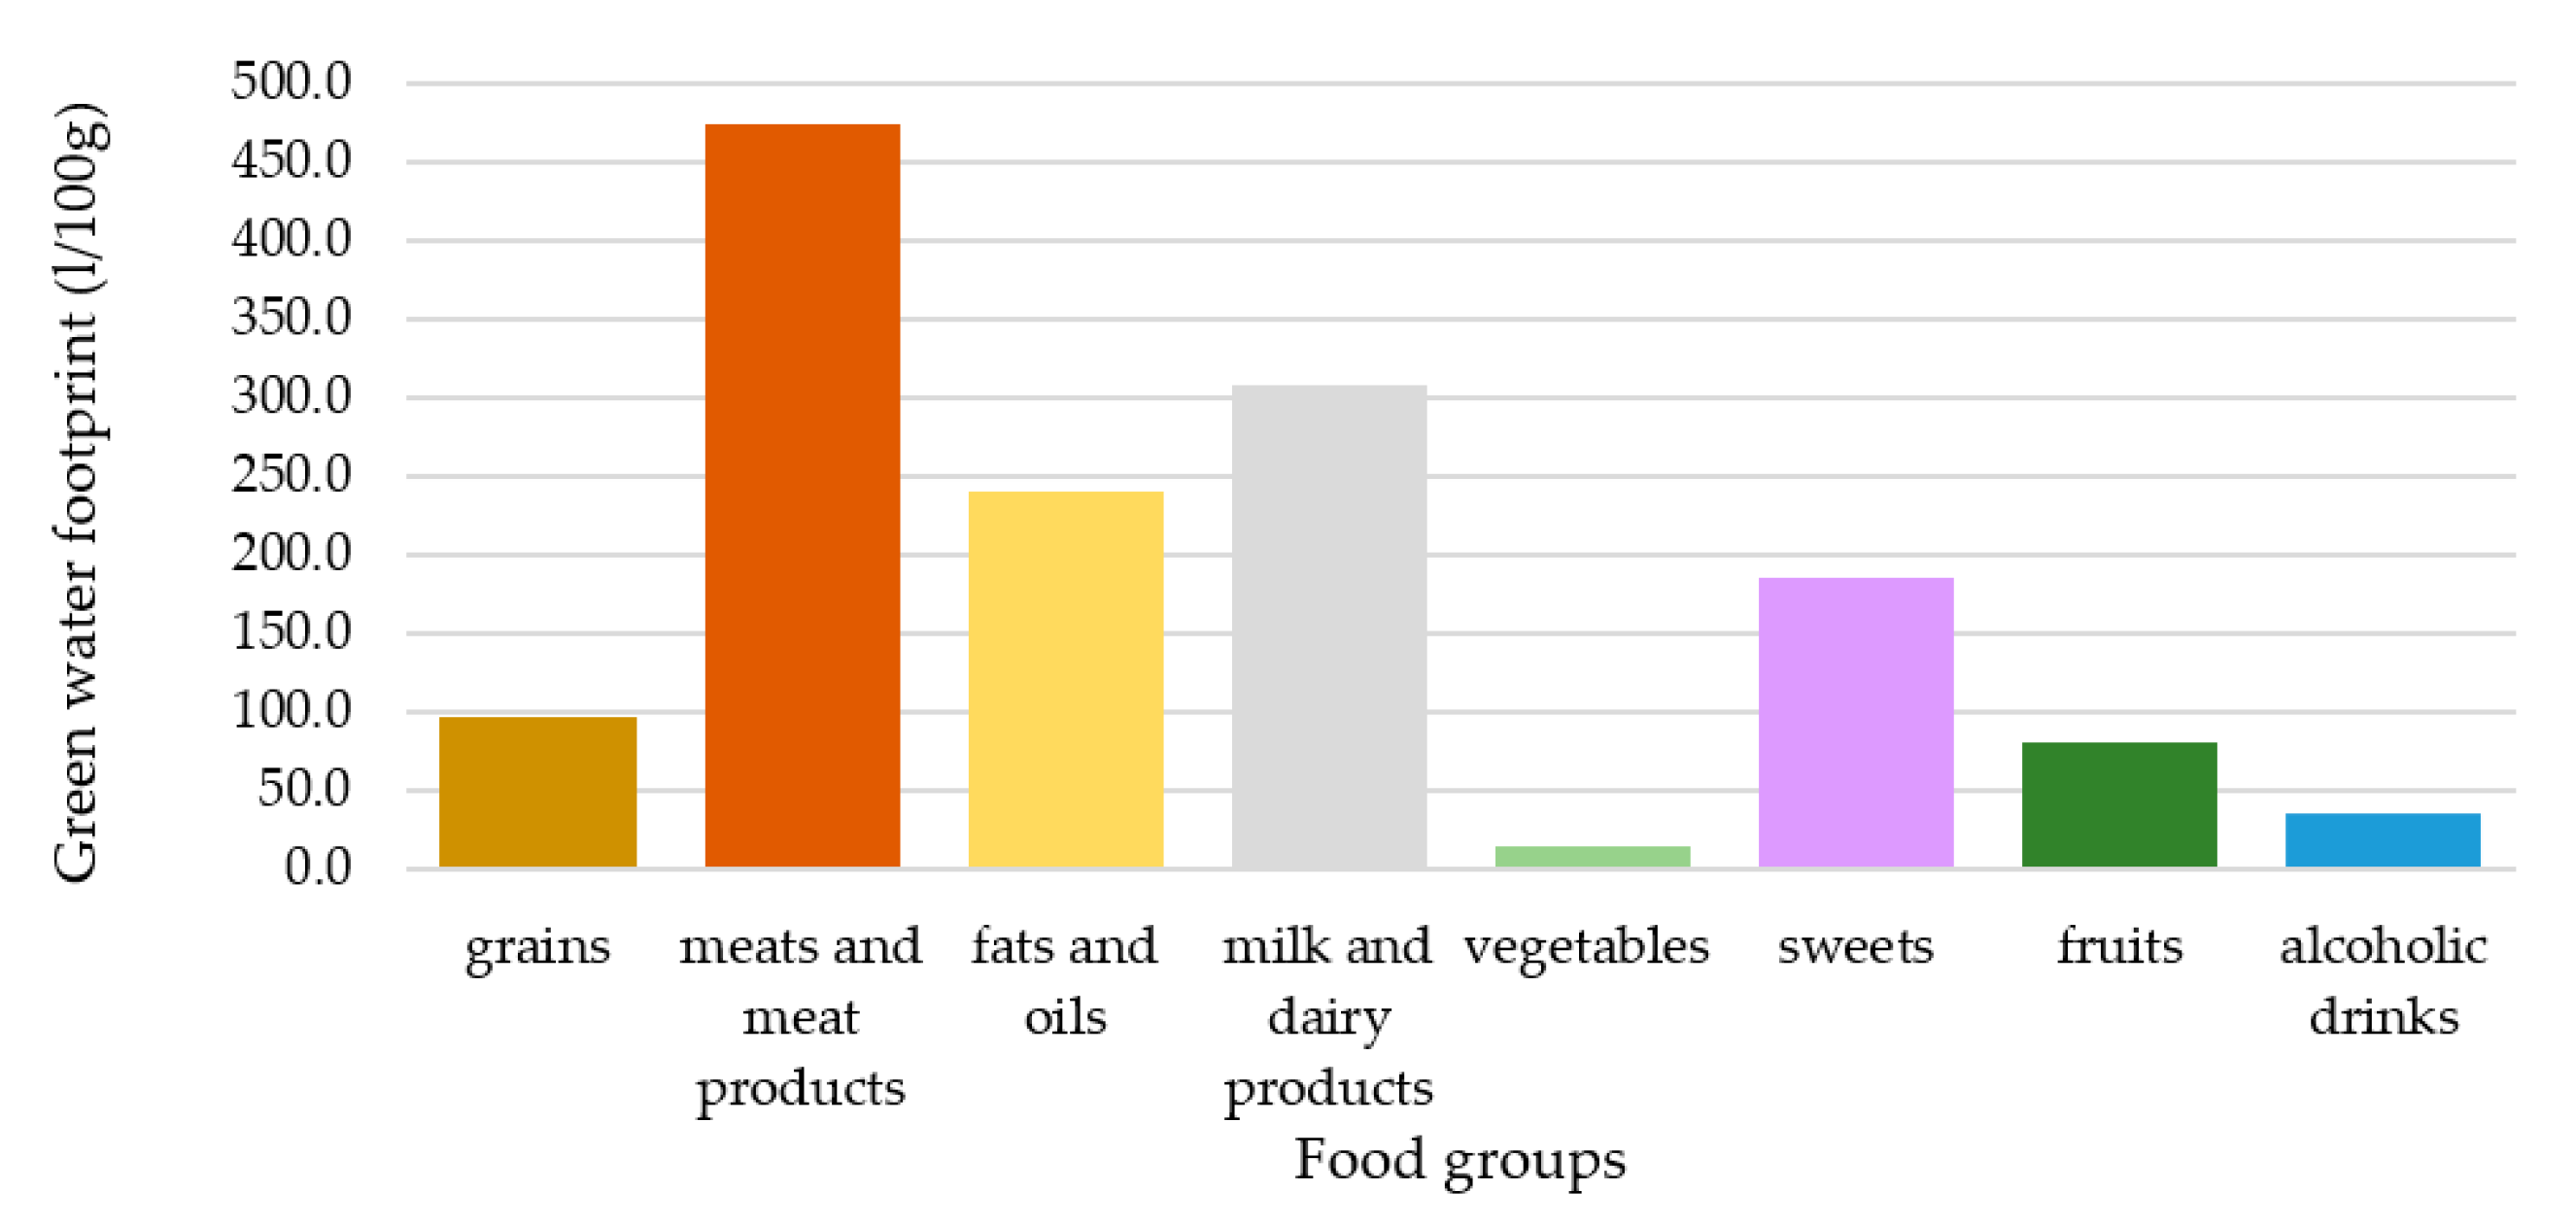
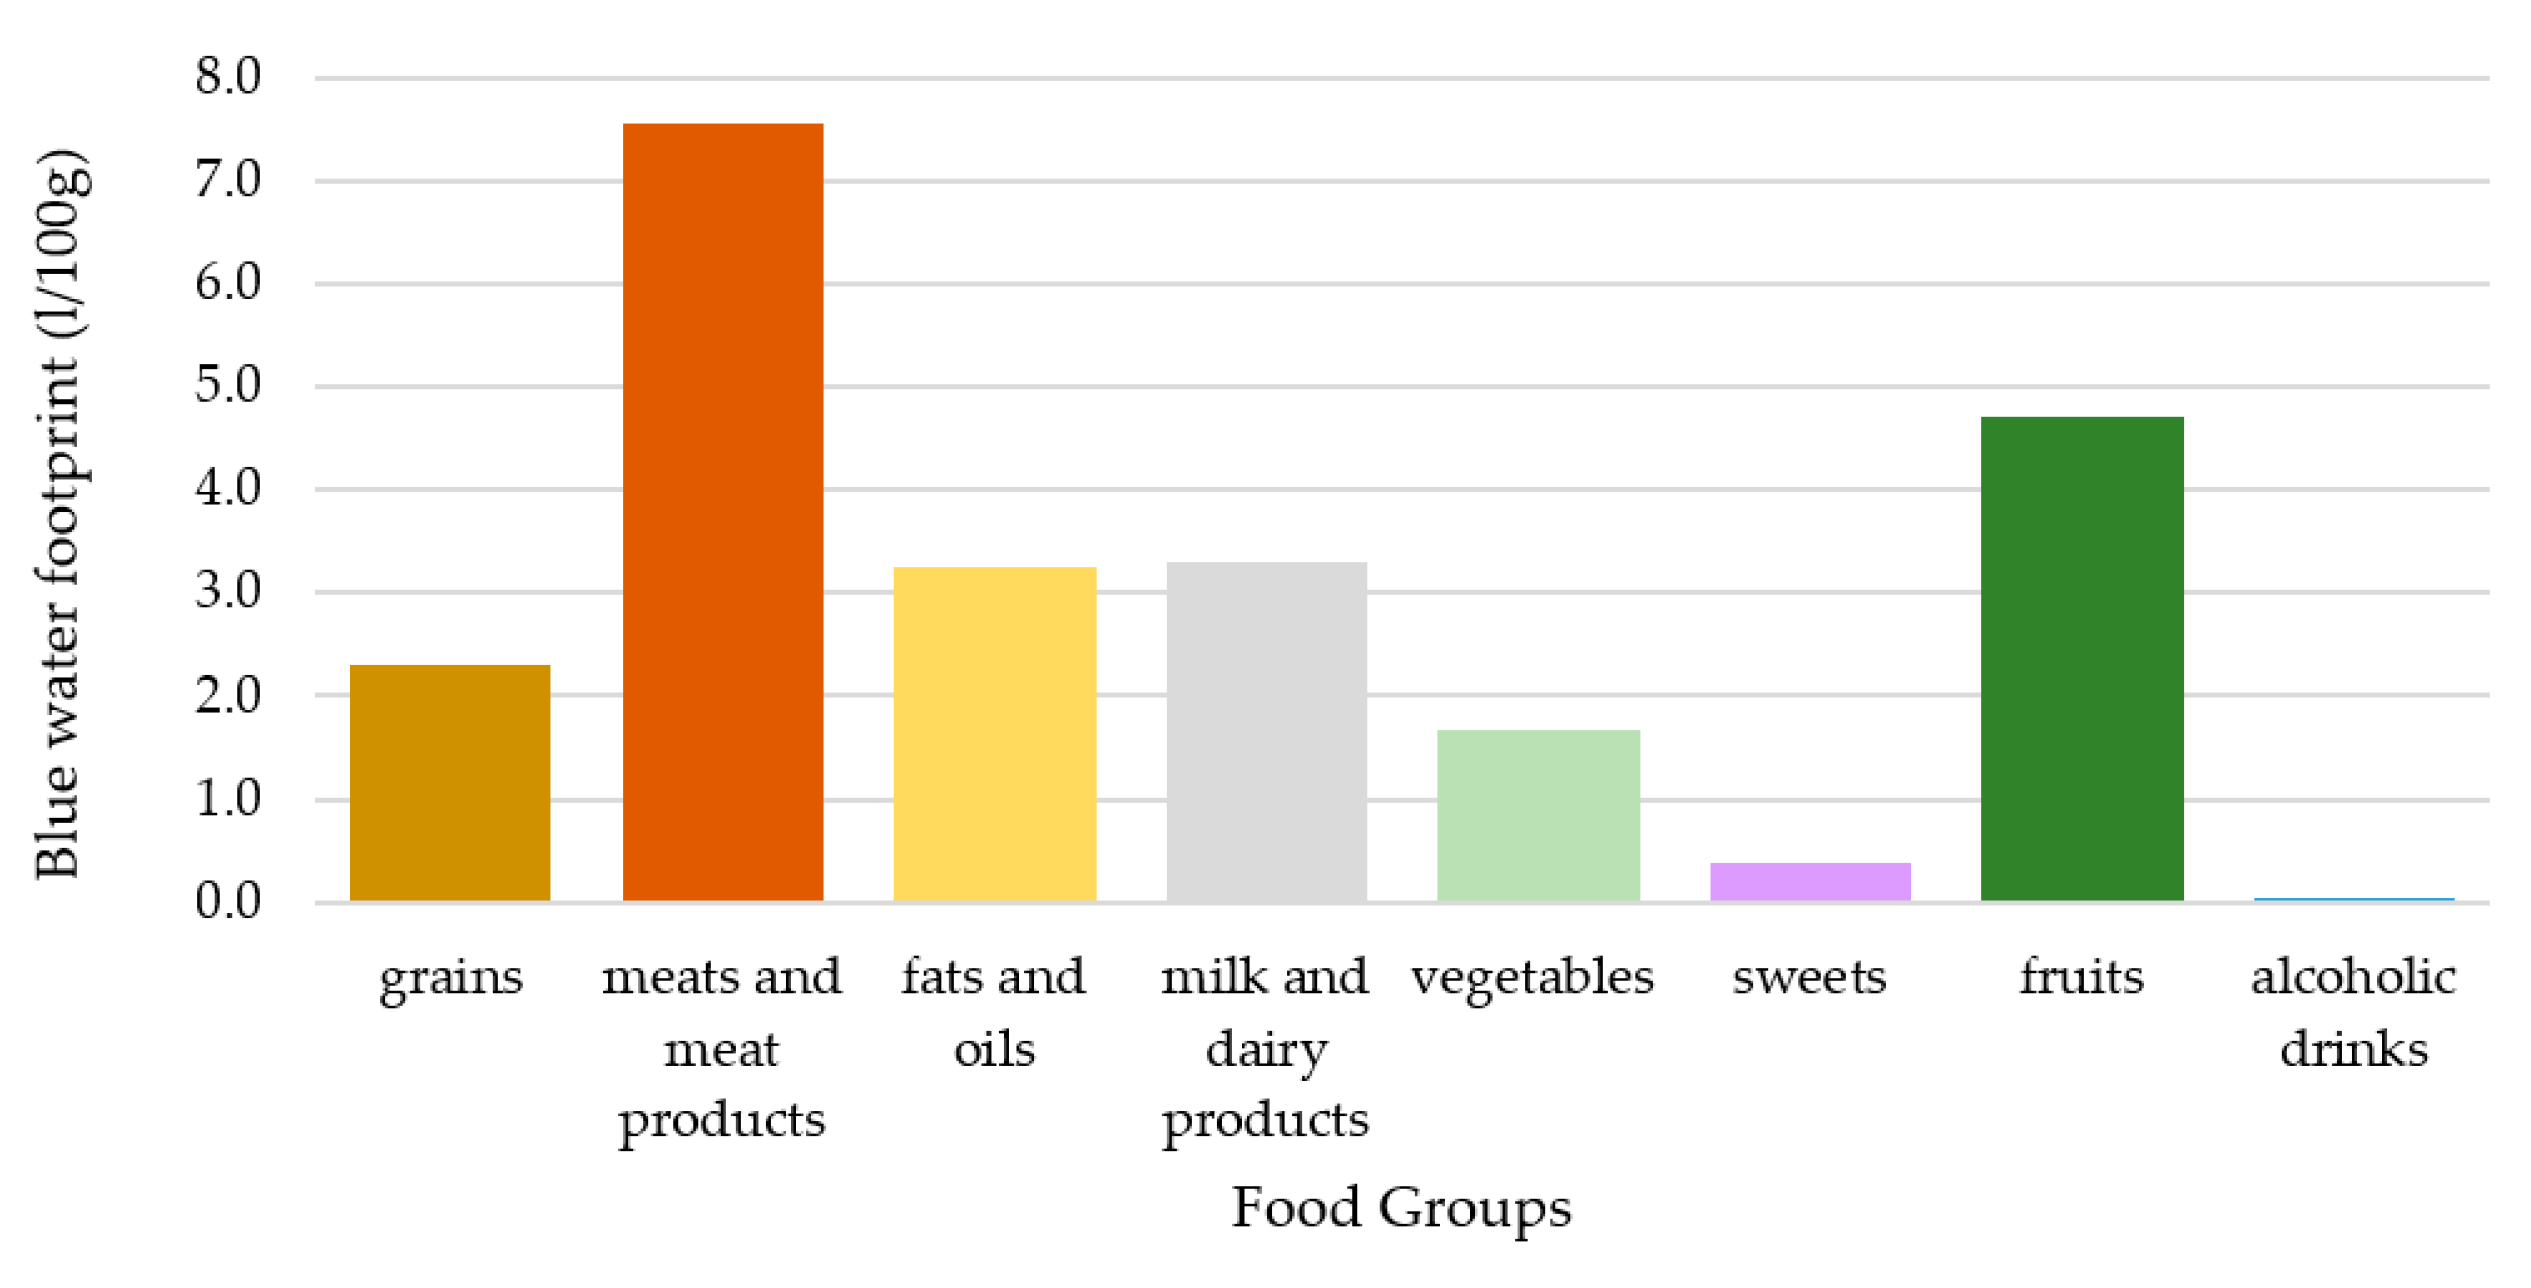
2.3. Water Footprint of the Food Groups
- FGwf = weighted average of water footprint of the pth food group (L/100 g/day/cap),
- FIs = supply of food item (100 g/day/cap), and
- WDi = water footprint of food item [L/100 g].
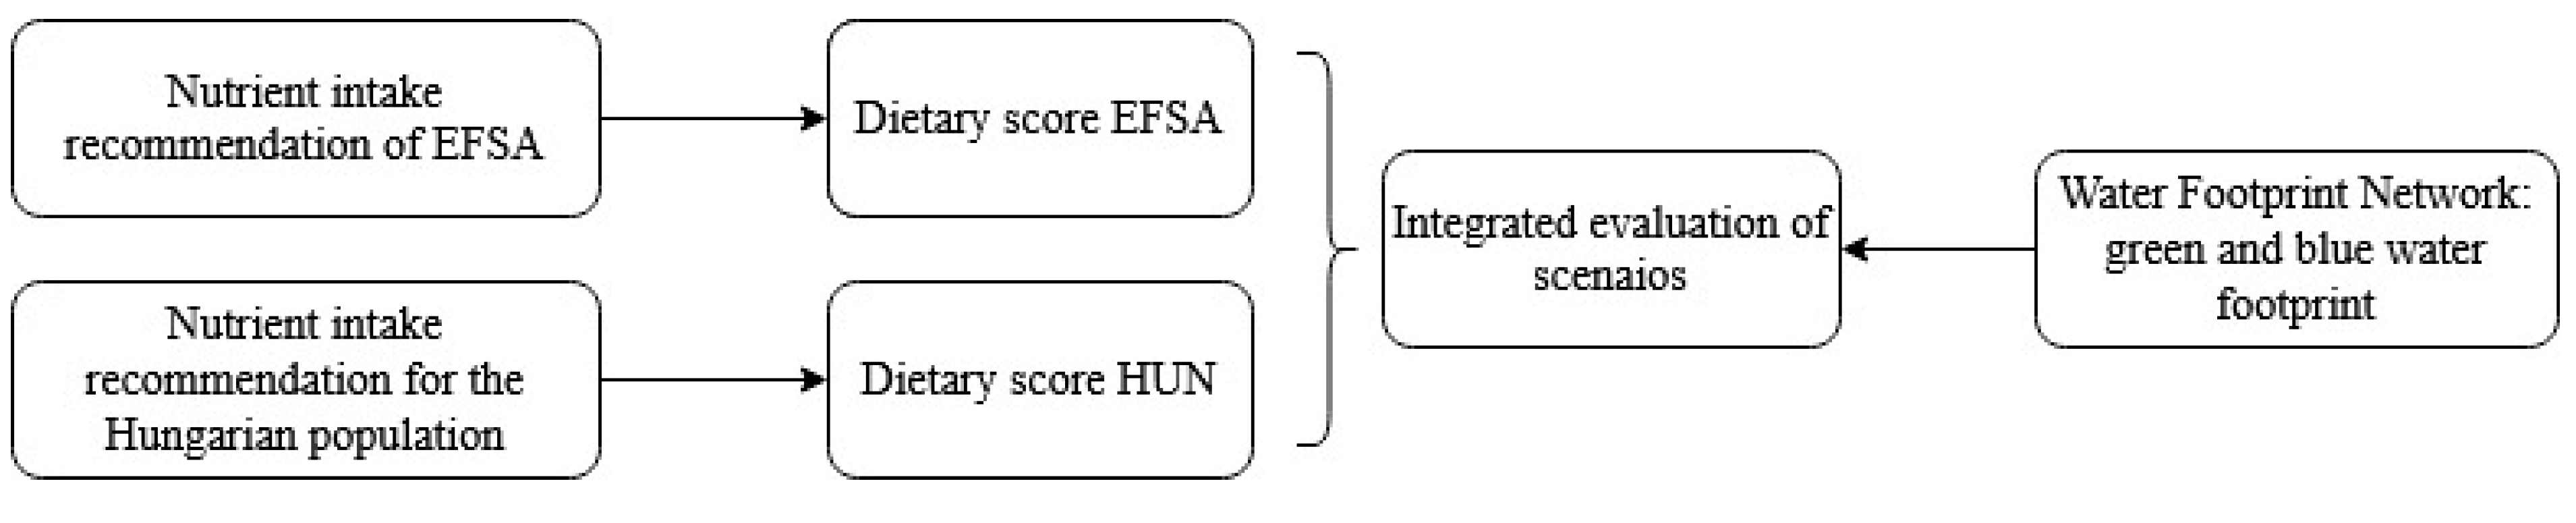
2.4. Integrated Analysis of Scenarios
2.5. Development and Application of Dietary Quality Score
- (1)
- Dietary quality scoreHUN: The algorithms of this score were based on the dietary reference values for the healthy Hungarian population published in Sarkadi Nagy et al. [33] (Supplement 5).
- (2)
- Dietary quality scoreEFSA: The algorithms of this score were based on the dietary reference values for the healthy population published by EFSA [52,53] (Supplement 5).
3. Results
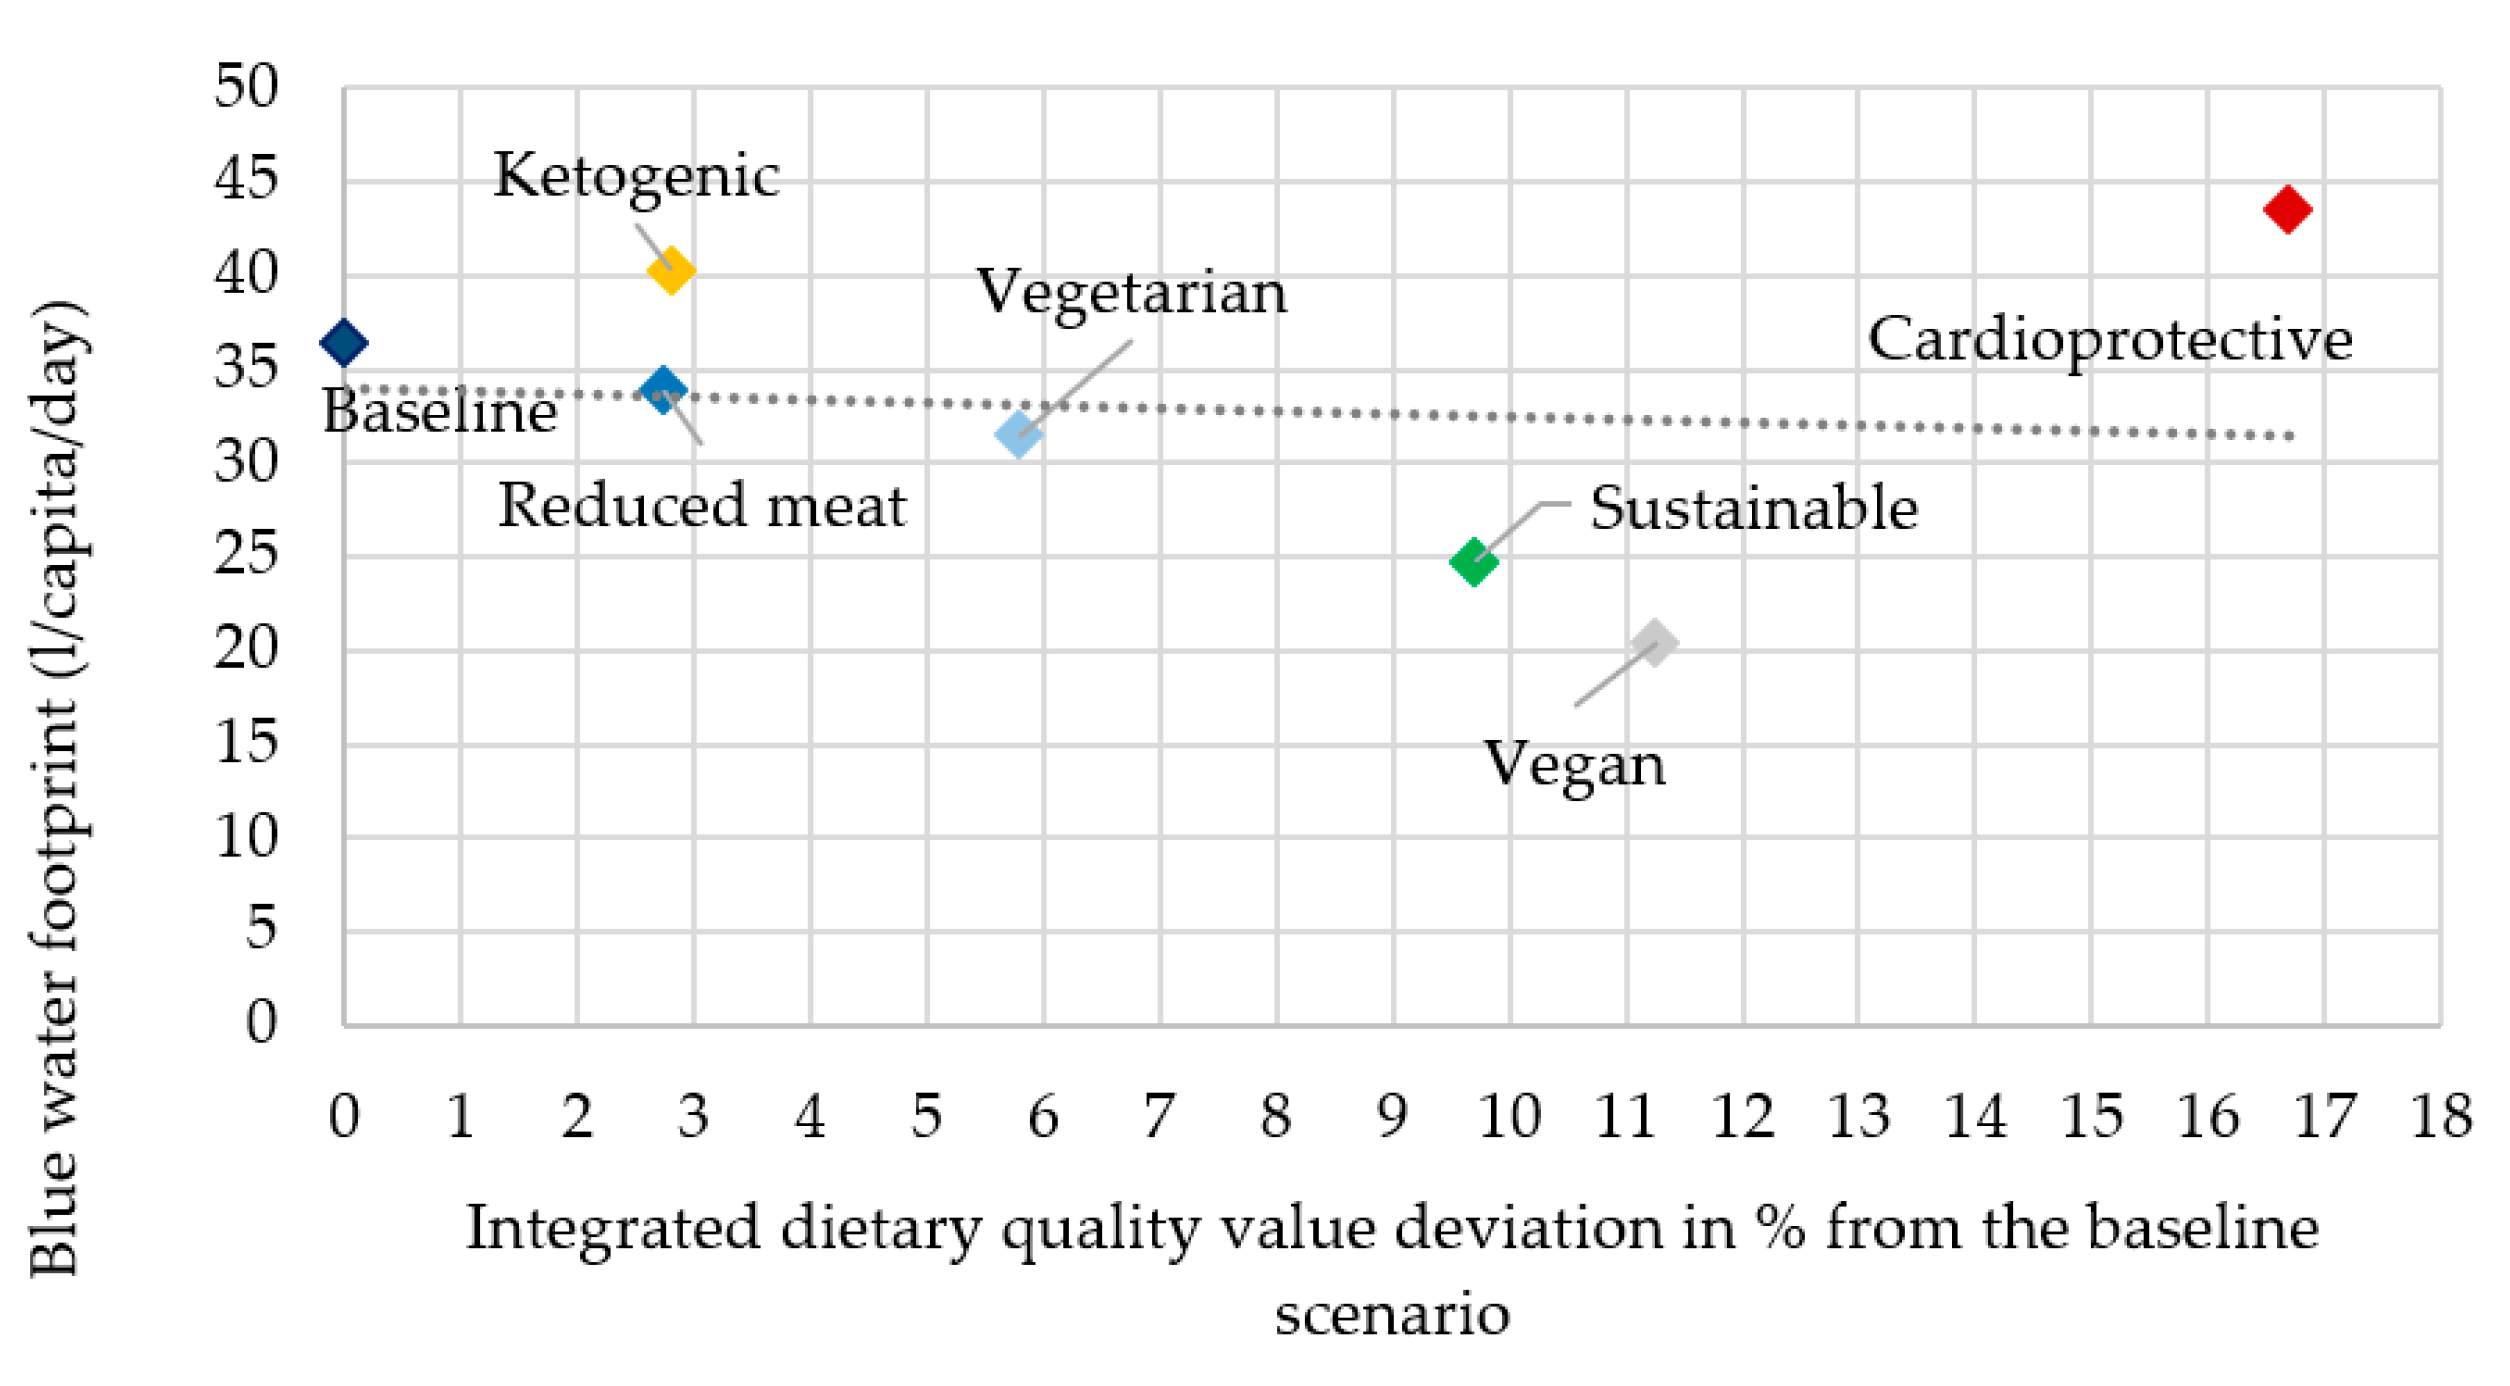
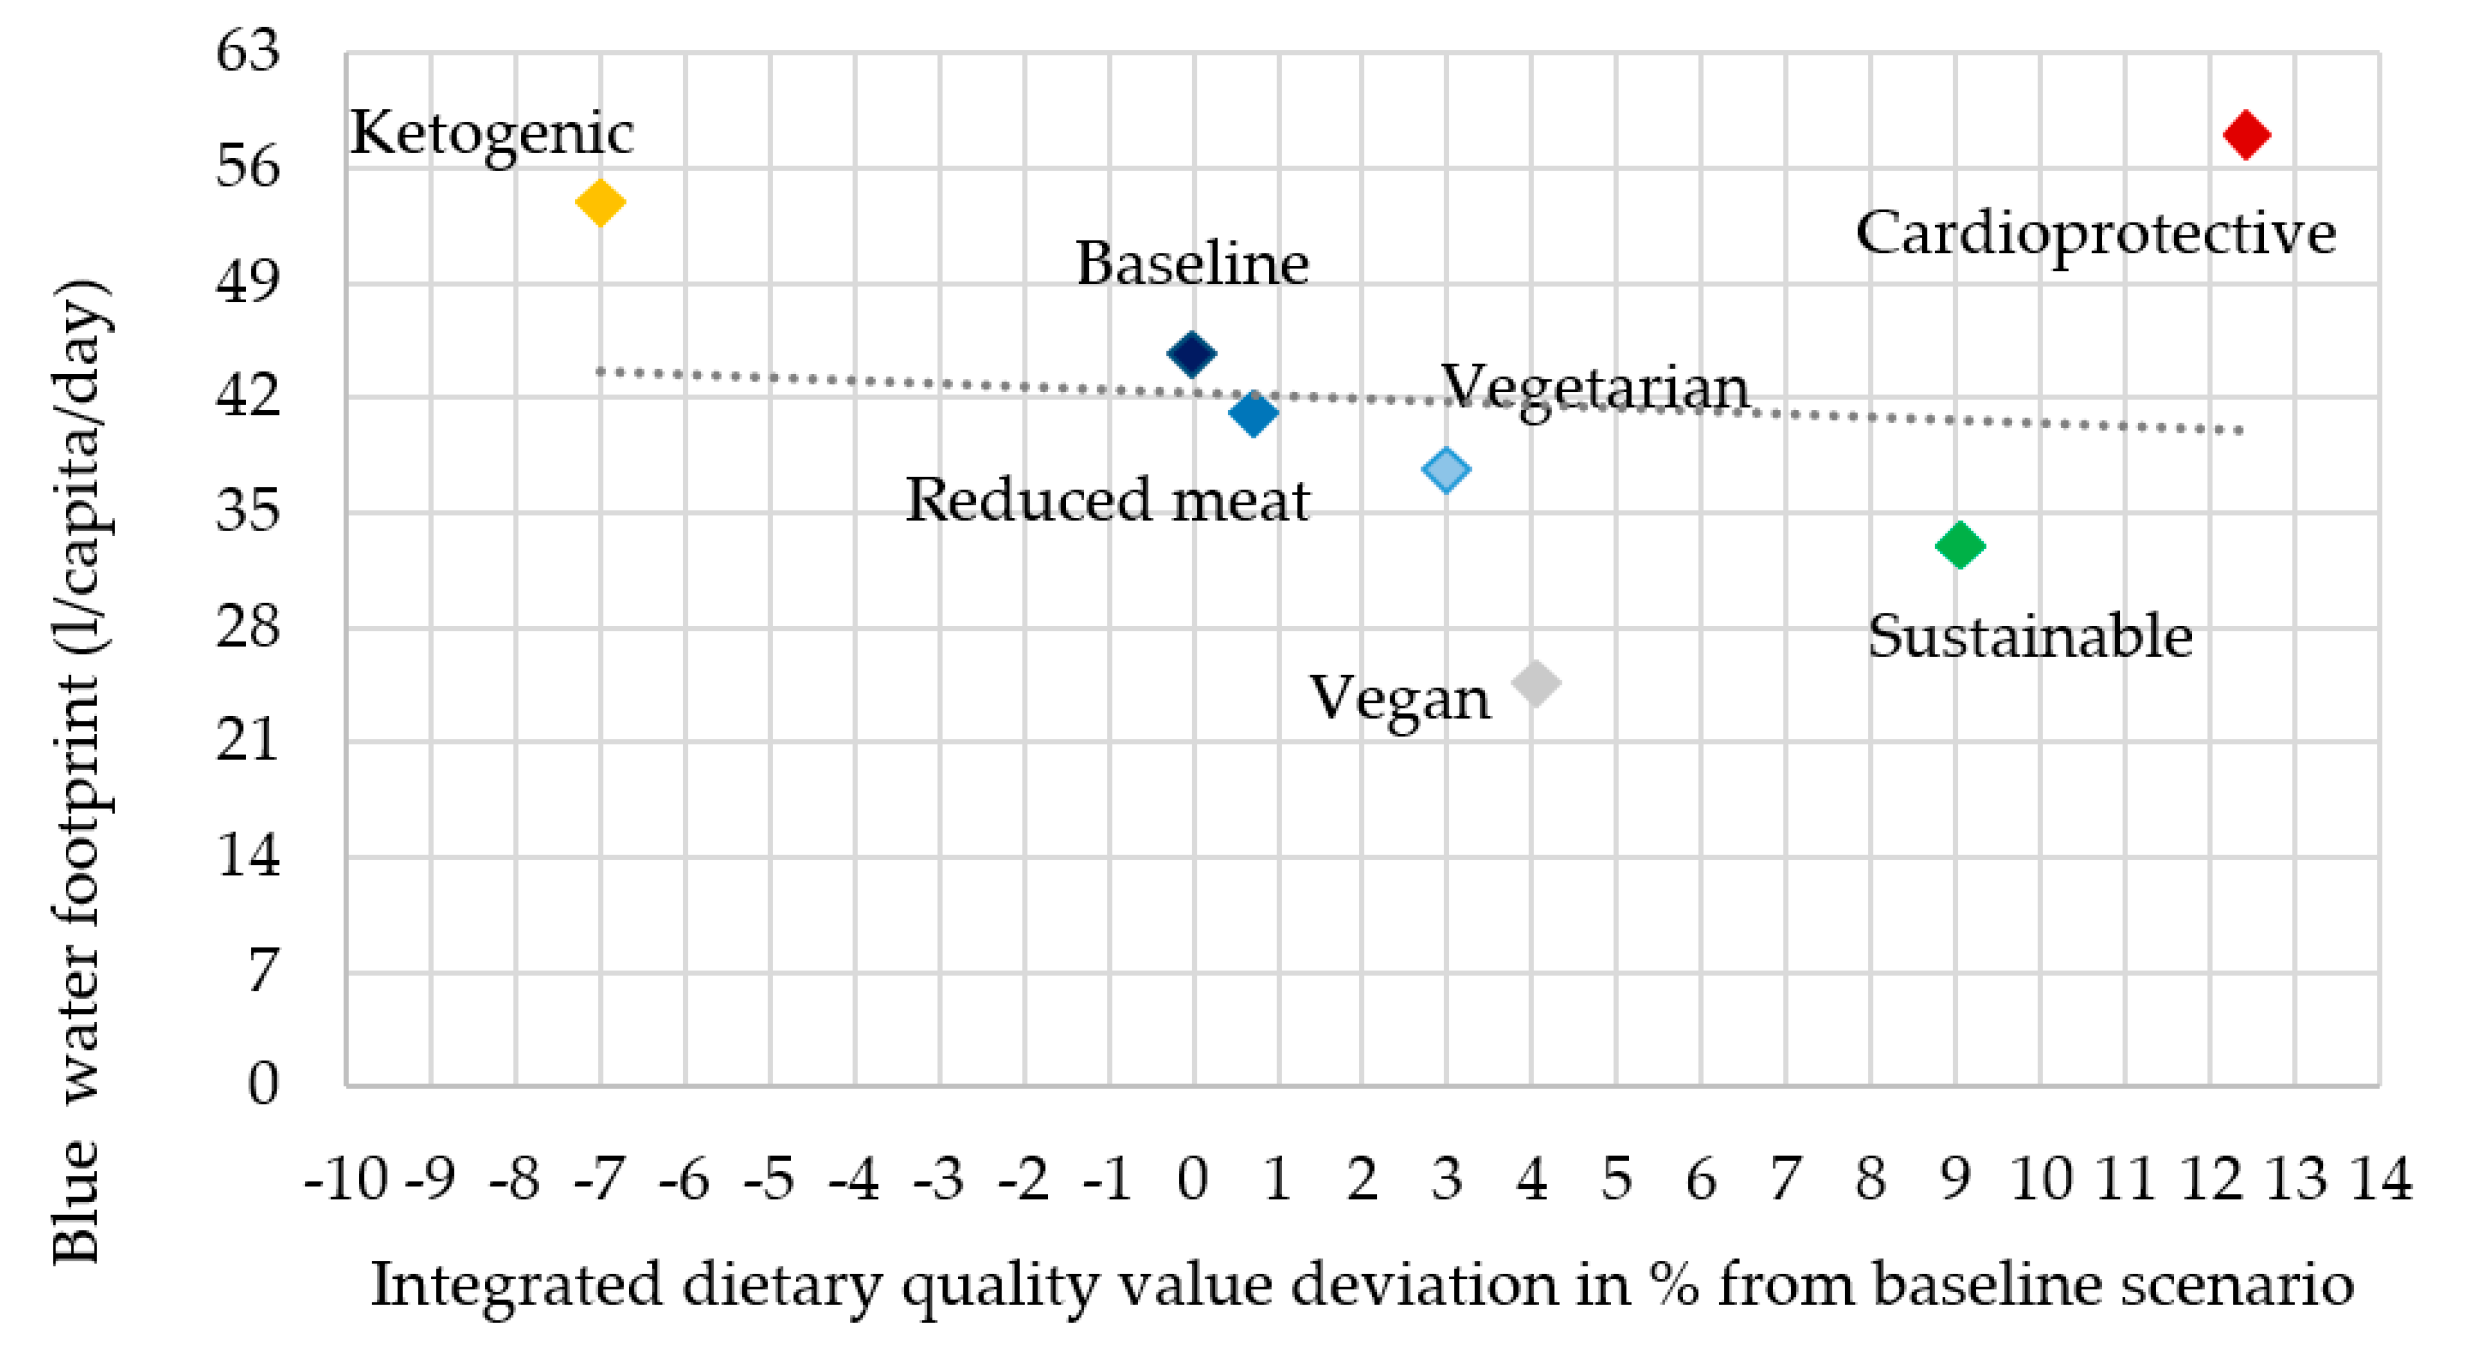
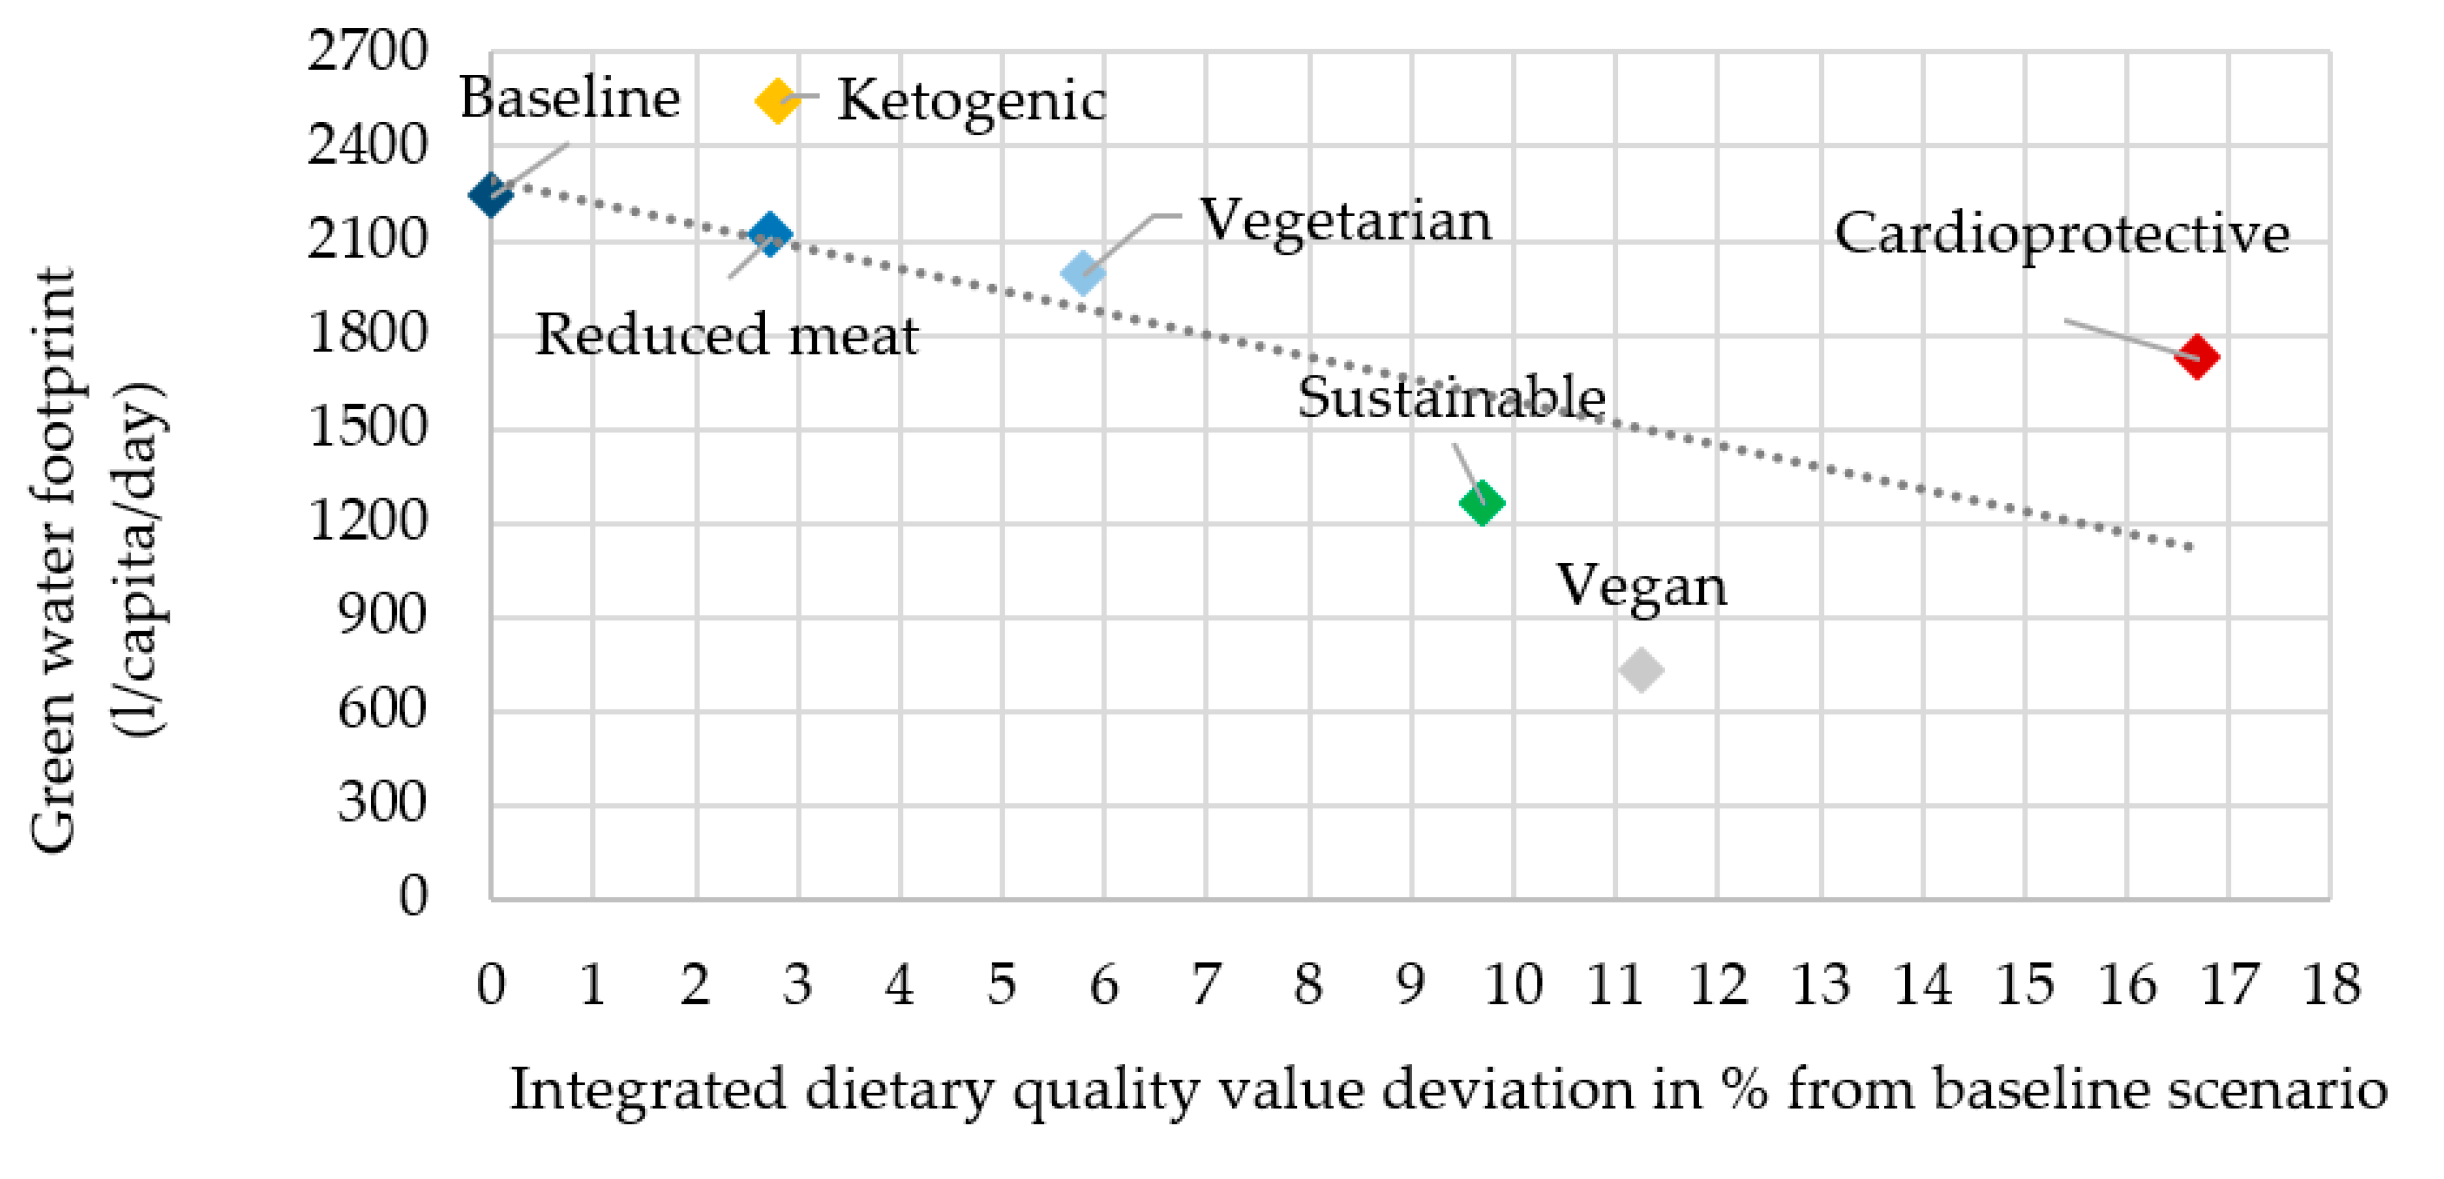
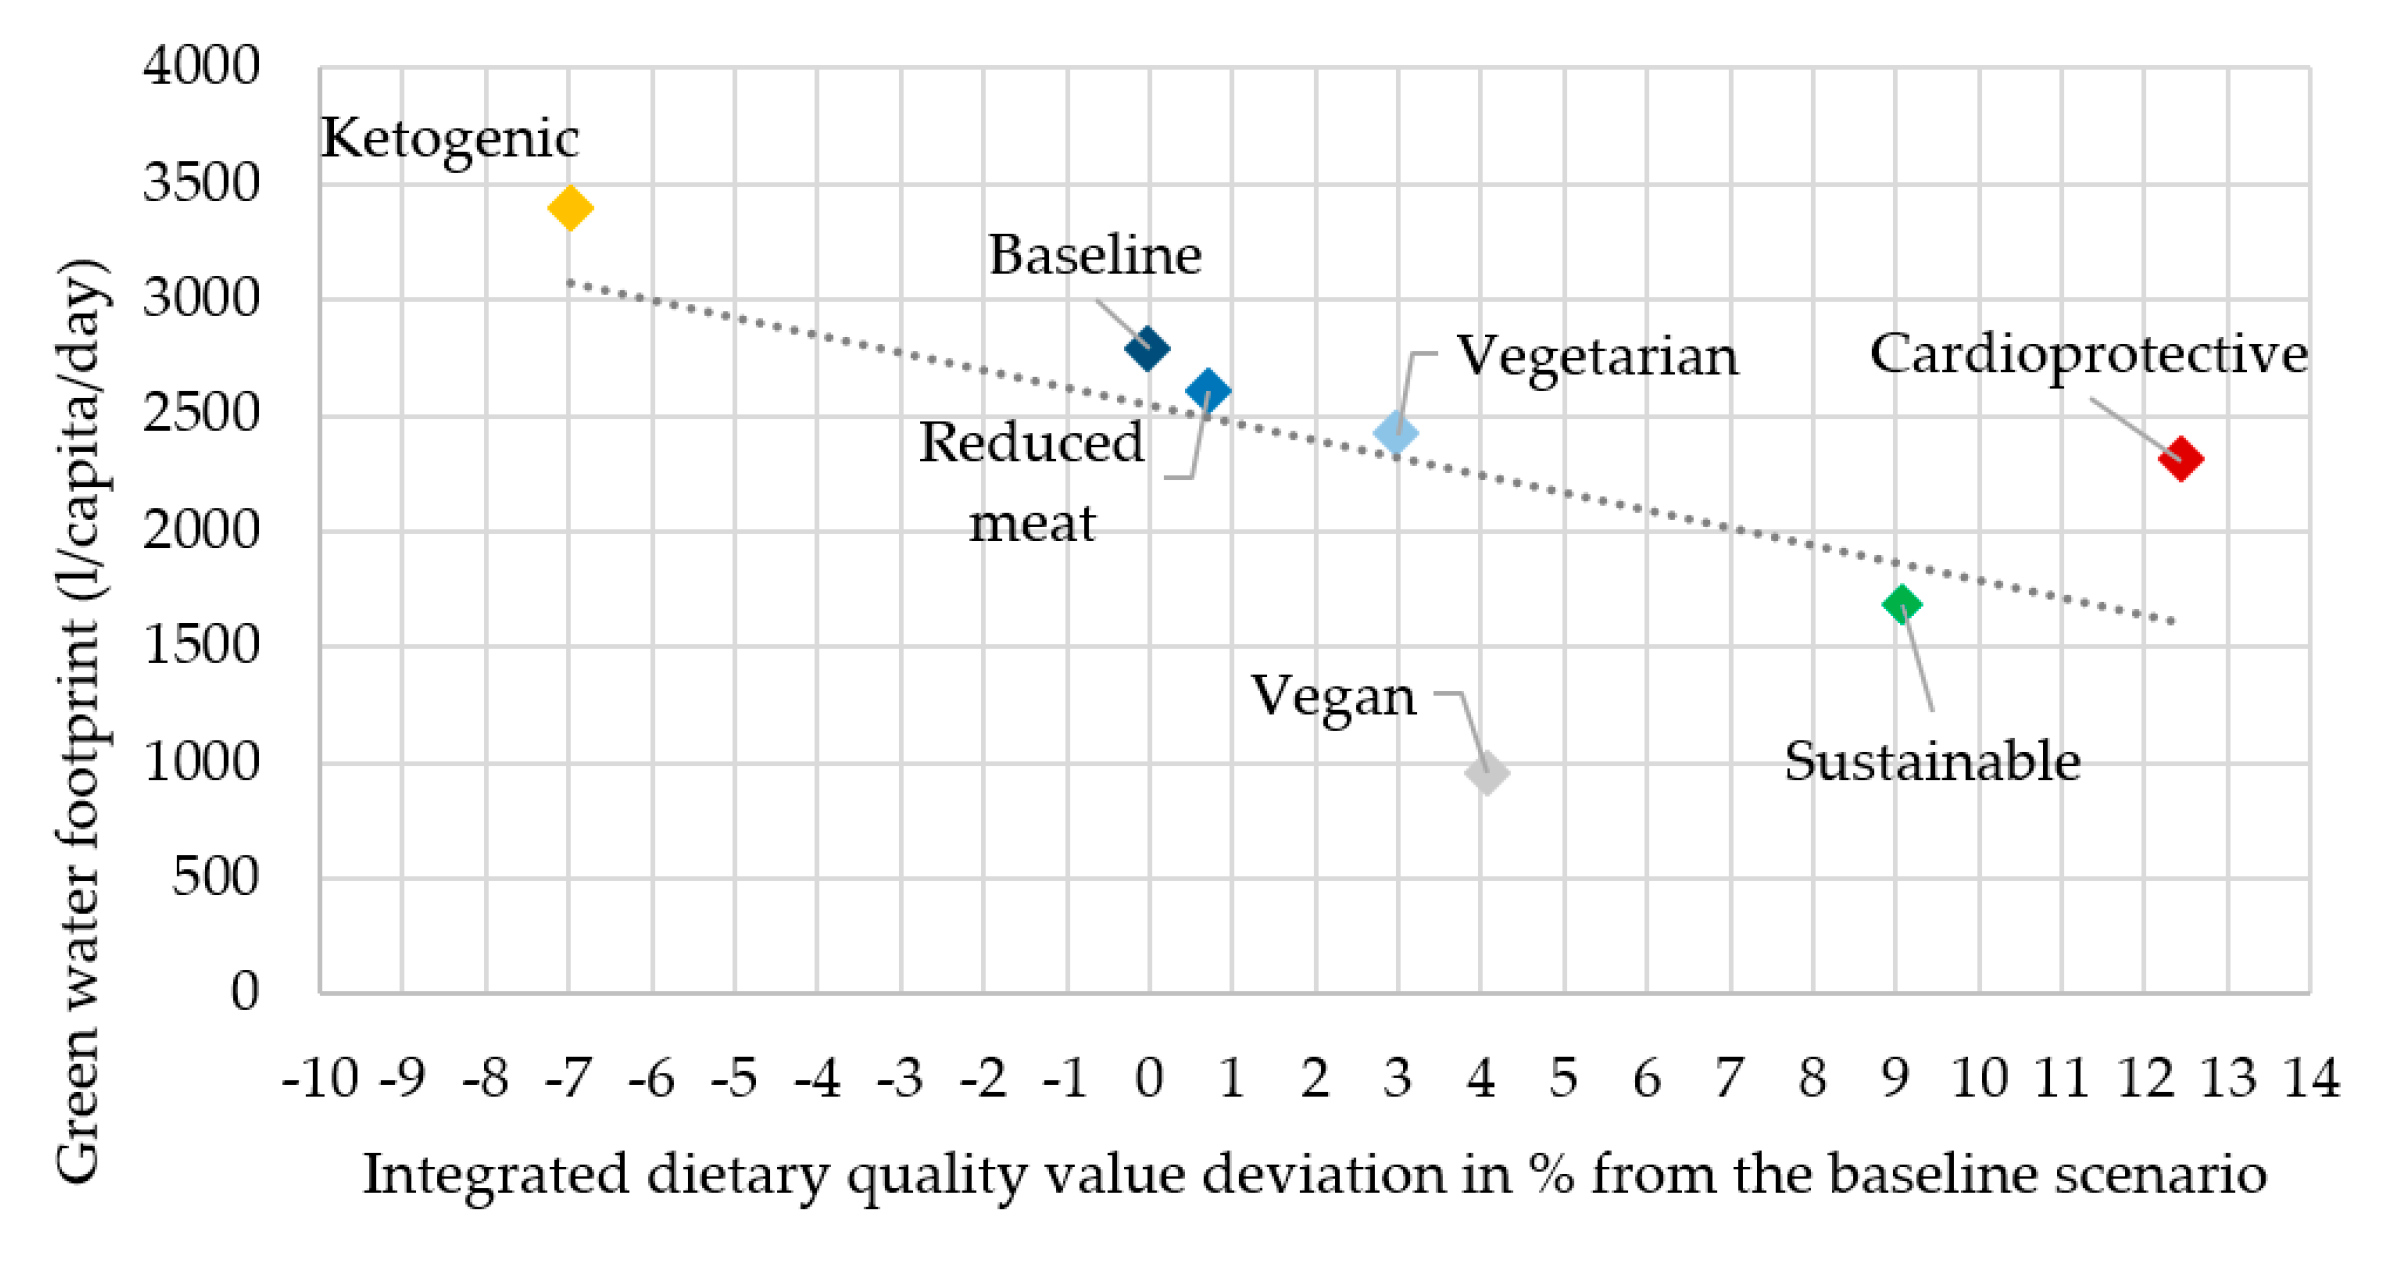
3.1. The Relationship between Water Footprint and Dietary Quality
3.2. Analysis of the Relative Changes in the Water Footprint in Different Scenarios
4. Discussion
4.1. Synergy between Dietary Quality and Environmental Impact
4.2. Reduction of the Water Footprint: Comparison of Results with Other Studies
4.3. Differences between the Genders
4.4. Limitations
- (1)
- We used secondary data for our calculation; however, the data on the water footprint, food consumption (Central Statistical Office (CSO) [32]), food supply (Food and Agriculture Organization (FAO) [31]), and the nutritional survey by Sarkadi Nagy et al. [33] were all country specific. The only noncountry-specific data we used were acquired from the FoodData Central Database of the USDA [36], but this is a widely accepted source in nutrition science. Similar studies that analyzed sustainable nutrition on a population have also mostly used secondary data [10,11,57].
- (2)
- The scenarios are “theoretical” diets that are based on the current nutrition pattern of Hungary. In studies that analyze dietary scenarios, there is always a question as to how realistic they are. “Cultural acceptability” is a very important aspect of sustainable nutrition [9] and even though dietary quality and sustainability are crucially important for the future, we cannot map out a pathway for future nutrition that is not regionally acceptable. In this study, we ensured cultural acceptability with the food items included, all of which were the most commonly consumed food items weighted by their supply value according to our national statistical data [32].
- (3)
- Another limiting aspect of this present and other similar studies is comparability. However, these comparisons have been made with the limitations based on the following differences: (1) The type of environmental impact categories included in the calculations, (2) the creation and evaluation of the dietary scenarios, and (3) the population analyzed.
- (4)
- The availability of data in some cases has been rather limited. It would be highly desirable to use more recent data, but the current international and national statistical systems are not capable of offering more recent information.
5. Conclusions
Supplementary Materials
Author Contributions
Funding
Conflicts of Interest
Abbreviations
| GHGE | greenhouse gas emission |
| GWF | green water footprint |
| BWF | blue water footprint |
| IDQV | integrated dietary quality value |
| FAO FBS | Food and Agriculture Organization of the United Nations Food Balance Sheet |
| HDNSS | Hungarian Diet and Nutritional Status Survey |
| CSO | Central Statistical Office |
| IHME | Institute for Health Metrics and Evaluation |
| WFN | Water Footprint Network |
References
- Lukiewska, K. Changes in the competitive position of the food industry in the European Union member states. Forum Sci. Oecon. 2019, 7, 71–87. [Google Scholar] [CrossRef]
- Kiss, A.; Popp, J.; Oláh, J.; Lakner, Z. The reform of school catering in Hungary: Anatomy of a health-education attempt. Nutrients 2019, 11, 716. [Google Scholar] [CrossRef] [PubMed]
- Vasa, L. Economic coherences between food consumption and income conditions in the Hungarian households. Ann. Agrar. Sci. 2005, 3, 228–233. [Google Scholar]
- Ashe, M.; Graff, S.; Spector, C. Changing places: Policies to make a healthy choice the easy choice. Public Health 2011, 125, 889–895. [Google Scholar] [CrossRef] [PubMed]
- Gonzalez Fischer, C.; Garnett, T. Plates, Pyramids, Planet; Food and Agriculture Organization of the United Nations (FAO): Oxford, UK, 2016; pp. 1–80. Available online: http://www.fao.org/3/a-i5640e.pdf (accessed on 20 June 2020).
- Vasa, L. The water pricing effects on the water use of the hungarian households. Eurasian J. Bus. Econ. 2009, 2, 91–98. [Google Scholar]
- Reynolds, C.J.; Buckley, J.D.; Weinstein, P.; Boland, J. Are the dietary guidelines for meat, fat, fruit and vegetable consumption appropriate for environmental sustainability? A review of the literature. Nutrients 2014, 6, 2251–2265. [Google Scholar] [CrossRef]
- Meltzer, H.M.; Brantsæter, A.L.; Trolle, E.; Eneroth, H.; Fogelholm, M.; Ydersbond, T.A.; Birgisdottir, B.E. Environmental sustainability perspectives of the nordic diet. Nutrients 2019, 11, 2248. [Google Scholar] [CrossRef]
- Ingram, J.; Gustafson, D.; Gutman, A.; Leet, W.; Drewnowski, A.; Fanzo, J. Seven food system metrics of sustainable nutrition security. Sustainability 2016, 8, 196. [Google Scholar] [CrossRef]
- Hallström, E.; Davis, J.; Woodhouse, A.; Sonesson, U. Using dietary quality scores to assess sustainability of food products and human diets: A systematic review. Ecol. Indic. 2018, 93, 219–230. [Google Scholar] [CrossRef]
- Hallström, E.; Carlsson-Kanyama, A.; Börjesson, P. Environmental impact of dietary change: A systematic review. J. Clean. Prod. 2015, 91, 1–11. [Google Scholar] [CrossRef]
- Chen, C.; Chaudhary, A.; Mathys, A. Dietary change scenarios and implications for environmental, nutrition, human health and economic dimensions of food sustainability. Nutrients 2019, 11, 856. [Google Scholar] [CrossRef] [PubMed]
- van Dooren, C.; Marinussen, M.; Blonk, H.; Aiking, H.; Vellinga, P. Exploring dietary guidelines based on ecological and nutritional values: A comparison of six dietary patterns. Food Policy 2014, 44, 36–46. [Google Scholar] [CrossRef]
- Serrem, K.; Dunay, A.; Serrem, C.; Atubukha, B.; Oláh, J.; Illés, C.B. Paucity of nutrition guidelines and nutrient quality of meals served to kenyan boarding high school students. Sustainability 2020, 12, 3463. [Google Scholar] [CrossRef]
- Nohr, D.; Biesalski, H. Mealthy’food: Meat as a healthy and valuable source of micronutrients. Animal 2007, 1, 309–316. [Google Scholar] [CrossRef] [PubMed]
- Schüpbach, R.; Wegmüller, R.; Berguerand, C.; Bui, M.; Herter-Aeberli, I. Micronutrient status and intake in omnivores, vegetarians and vegans in Switzerland. Eur. J. Nutr. 2017, 56, 283–293. [Google Scholar] [CrossRef]
- Hys, K. Identification of the reasons why individual consumers purchase dietary supplements. In Perspectives on Consumer Behaviour. Theoretical Aspects and Practical Applications; Springer: Cham, Germany, 2020. [Google Scholar]
- Hess, T.; Andersson, U.; Mena, C.; Williams, A. The impact of healthier dietary scenarios on the global blue water scarcity footprint of food consumption in the UK. Food Policy 2015, 50, 1–10. [Google Scholar] [CrossRef]
- Tom, M.S.; Fischbeck, P.S.; Hendrickson, C.T. Energy use, blue water footprint, and greenhouse gas emissions for current food consumption patterns and dietary recommendations in the US. Environ. Syst. Decis. 2016, 36, 92–103. [Google Scholar] [CrossRef]
- De Marco, A.; Velardi, M.; Camporeale, C.; Screpanti, A.; Vitale, M. The adherence of the diet to Mediterranean principle and its impacts on human and environmental health. Int. J. Environ. Prot. Policy 2014, 2, 64–75. [Google Scholar] [CrossRef]
- Capone, R.; Iannetta, M.; El Bilali, H.; Colonna, N.; Debs, P.; Dernini, S.; Maiani, G.; Intorre, F.; Polito, A.; Turrini, A. A preliminary assessment of the environmental sustainability of the current Italian dietary pattern: Water footprint related to food consumption. J. Food Nutr. Res. 2013, 1, 59–67. [Google Scholar] [CrossRef]
- Vanham, D.; Mekonnen, M.; Hoekstra, A.Y. The water footprint of the EU for different diets. Ecol. Indic. 2013, 32, 1–8. [Google Scholar] [CrossRef]
- Vanham, D.; Hoekstra, A.Y.; Bidoglio, G. Potential water saving through changes in European diets. Environ. Int. 2013, 61, 45–56. [Google Scholar] [CrossRef] [PubMed]
- Meier, T.; Christen, O. Gender as a factor in an environmental assessment of the consumption of animal and plant-based foods in Germany. Int. J. Life Cycle Assess. 2012, 17, 550–564. [Google Scholar] [CrossRef]
- Downs, S.M.; Fanzo, J. Is a cardio-protective diet sustainable? A review of the synergies and tensions between foods that promote the health of the heart and the planet. Curr. Nutr. Rep. 2015, 4, 313–322. [Google Scholar] [CrossRef] [PubMed][Green Version]
- Aranceta-Bartrina, J.; Partearroyo, T.; López-Sobaler, A.M.; Ortega, R.M.; Varela-Moreiras, G.; Serra-Majem, L.; Pérez-Rodrigo, C. Updating the food-based dietary guidelines for the spanish population: The Spanish Society of Community Nutrition (SENC) proposal. Nutrients 2019, 11, 2675. [Google Scholar] [CrossRef] [PubMed]
- Mantzioris, E.; Villani, A. Translation of a Mediterranean-style diet into the Australian dietary guidelines: A nutritional, ecological and environmental perspective. Nutrients 2019, 11, 2507. [Google Scholar] [CrossRef] [PubMed]
- Padrão, S.M.; Aguiar, O.B.; de Oliveira Damasceno Barão, G. Food and nutrition education: The defense of a counter-hegemonic and historical-critical perspective for education. Demetra Food Nutr. Health Aliment. Nutr. Saúde 2017, 12. [Google Scholar] [CrossRef]
- Gazan, R.; Brouzes, C.M.C.; Vieux, F.; Maillot, M.; Luch, A.; Darmon, N. Mathematical optimization to explore tomorrow’s sustainable diets: A narrative review. Adv. Nutr. Int. Rev. J. 2018, 9. [Google Scholar] [CrossRef]
- Vanham, D. The water footprint of Austria for different diets. Water Sci. Technol. 2013, 67, 824–830. [Google Scholar] [CrossRef]
- Food and Agriculture Organization (FAO). Food Balance Sheet. 2013. Available online: http://www.fao.org/faostat/en/#data/FBS (accessed on 20 June 2020).
- Central Statistical Office (CSO). 2.2.3.6. Amount of Food Consumption per Capita per Year Classified by Income and Type of Region into Deciles 2010. 2013. Available online: https://www.ksh.hu/docs/hun/xstadat/xstadateves/i_zhc023a.html (accessed on 20 June 2020).
- Sarkadi Nagy, E.; Bakacs, M.; Illés, É.; Nagy, B.; Varga, A.; Kis, O.; Schreiberné Molnár, E.; Martos, É. Országos Táplálkozás és Tápláltsági Állapot Vizsgálat–OTÁP2014. II. A magyar lakosság energia-és makrotápanyag-bevitele. Orv. Hetil. 2017, 158, 587–597. [Google Scholar] [CrossRef]
- Schreiberné Molnár, E.; Nagy-Lőrincz, Z.; Nagy, B.; Bakacs, M.; Kis, O.; Sarkadi Nagy, E.; Martos, É. Országos Táplálkozás-és Tápláltsági Állapot Vizsgálat-OTÁP2014. V. A magyar lakosság vitaminbevitele. Orv. Hetil. 2017, 158, 1303–1313. [Google Scholar] [CrossRef][Green Version]
- Nagy, B.; Nagy-Lőrincz, Z.; Bakacs, M.; Illés, É.; Sarkadi Nagy, E.; Erdei, G.; Martos, É. Országos Táplálkozás és Tápláltsági Állapot Vizsgálat–OTÁP2014. IV. A magyar lakosság mikroelem-bevitele. Orv. Hetil. 2017, 158, 803–810. [Google Scholar] [CrossRef] [PubMed]
- USDA, U.S. Department of Agriculture Agricultural Research Service. Food Data Central; 2019. Available online: https://fdc.nal.usda.gov/ (accessed on 20 June 2020).
- Röös, E.; Karlsson, H.; Witthöft, C.; Sundberg, C. Evaluating the sustainability of diets–combining environmental and nutritional aspects. Environ. Sci. Policy 2015, 47, 157–166. [Google Scholar] [CrossRef]
- Institute for Health Metrics and Evaluation (IHME). Global Burden of Disease: Cause of death in Hungary, both Sexes. 2017. Available online: https://vizhub.healthdata.org/gbd-compare/ (accessed on 20 June 2020).
- Willett, W.; Rockström, J.; Loken, B.; Springmann, M.; Lang, T.; Vermeulen, S.; Garnett, T.; Tilman, D.; DeClerck, F.; Wood, A. Food in the Anthropocene: The EAT–lancet commission on healthy diets from sustainable food systems. Lancet 2019, 393, 447–492. [Google Scholar] [CrossRef]
- Mozaffarian, D.; Appel, L.J.; Van Horn, L. Components of a cardioprotective diet: New insights. Circulation 2011, 123, 2870–2891. [Google Scholar] [CrossRef] [PubMed]
- Adam-Perrot, A.; Clifton, P.; Brouns, F. Low-carbohydrate diets: Nutritional and physiological aspects. Obes. Rev. 2006, 7, 49–58. [Google Scholar] [CrossRef]
- Water Footprint Network. What is Waterfootprint? 2020. Available online: https://waterfootprint.org/en/water-footprint/what-is-water-footprint/ (accessed on 20 June 2020).
- Megkonnen, M.M.; Hoekstra, A.Y. The Green, Blue and Grey Water Footprint of Crops and Derived Crop Products. Value of Water Research; Report Series 47; UNESCO-IHE: Delft, The Netherlands; UNESCO-IHE Institute for Water Education: Delft, The Netherlands, 2010; pp. 1–42. Available online: http://www.waterfootprint.org/Reports/Report47-WaterFootprintCrops-Vol1.pdf (accessed on 20 June 2020).
- Megkonnen, M.M.; Hoekstra, A.Y. The Green, Blue and Grey Water Footprint of Farm Animals and Animal Products; UNESCO-IHE Institue for Water Education: Delft, The Netherlands, 2010; pp. 1–50. Available online: https://waterfootprint.org/media/downloads/Report-48-WaterFootprint-AnimalProducts-Vol1_1.pdf (accessed on 20 June 2020).
- Lukas, M.; Rohn, H.; Lettenmeier, M.; Liedtke, C.; Wiesen, K. The nutritional footprint–integrated methodology using environmental and health indicators to indicate potential for absolute reduction of natural resource use in the field of food and nutrition. J. Clean. Prod. 2016, 132, 161–170. [Google Scholar] [CrossRef]
- Hendrie, G.A.; Baird, D.; Ridoutt, B.; Hadjikakou, M.; Noakes, M. Overconsumption of energy and excessive discretionary food intake inflates dietary greenhouse gas emissions in Australia. Nutrients 2016, 8, 690. [Google Scholar] [CrossRef]
- van Dooren, C.; Douma, A.; Aiking, H.; Vellinga, P. Proposing a novel index reflecting both climate impact and nutritional impact of food products. Ecol. Econ. 2017, 131, 389–398. [Google Scholar] [CrossRef]
- Masset, G.; Soler, L.-G.; Vieux, F.; Darmon, N. Identifying sustainable foods: The relationship between environmental impact, nutritional quality, and prices of foods representative of the french diet. J. Acad. Nutr. Diet. 2014, 114, 862–869. [Google Scholar] [CrossRef]
- Saarinen, M.; Fogelholm, M.; Tahvonen, R.; Kurppa, S. Taking nutrition into account within the life cycle assessment of food products. J. Clean. Prod. 2017, 149, 828–844. [Google Scholar] [CrossRef]
- Perignon, M.; Masset, G.; Ferrari, G.; Barré, T.; Vieux, F.; Maillot, M.; Amiot, M.-J.; Darmon, N. How low can dietary greenhouse gas emissions be reduced without impairing nutritional adequacy, affordability and acceptability of the diet? A modelling study to guide sustainable food choices. Public Health Nutr. 2016, 19, 2662–2674. [Google Scholar] [CrossRef] [PubMed]
- Drewnowski, A.; Rehm, C.D.; Martin, A.; Verger, E.O.; Voinnesson, M.; Imbert, P. Energy and nutrient density of foods in relation to their carbon footprint. Am. J. Clin. Nutr. 2015, 101, 184–191. [Google Scholar] [CrossRef] [PubMed]
- European Food Safety Authority (EFSA). Dietary Reference Values for Sodium. 2017. Available online: http://onlinelibrary.wiley.com/doi/10.2903/j.efsa.2019.5778/full (accessed on 20 June 2020).
- European Food Safety Authority (EFSA). Dietary Reference Values for Chloride. 2017. Available online: http://onlinelibrary.wiley.com/doi/10.2903/j.efsa.2019.5779/full (accessed on 20 June 2020).
- Masset, G.; Vieux, F.; Verger, E.O.; Soler, L.-G.; Touazi, D.; Darmon, N. Reducing energy intake and energy density for a sustainable diet: A study based on self-selected diets in French adults. Am. J. Clin. Nutr. 2014, 99, 1460–1469. [Google Scholar] [CrossRef]
- Nagy, B.; Nagy-Lőrincz, Z.; Bakacs, M.; Illés, É.; Sarkadi Nagy, E.; Martos, É. Országos Táplálkozás és Tápláltsági Állapot Vizsgálat–OTÁP2014. III. A magyar lakosság makroelem-bevitele. Orv. Hetil. 2017, 158, 651–661. [Google Scholar] [CrossRef] [PubMed]
- Gómez-Luciano, A.C.; Vriesekoop, F.; Urbano, B. Towards food security of alternative dietary proteins: A comparison between Spain and the Dominican Republic. Amfiteatr. Econ. 2019, 21, 393–407. [Google Scholar] [CrossRef]
- Jones, A.D.; Hoey, L.; Blesh, J.; Miller, L.; Green, A.; Shapiro, L.F. A systematic review of the measurement of sustainable diets. Adv. Nutr. 2016, 7, 641–664. [Google Scholar] [CrossRef]
- Van Dooren, C.; Aiking, H. Defining a nutritionally healthy, environmentally friendly, and culturally acceptable low lands diet. Int. J. Life Cycle Assess. 2016, 21, 688–700. [Google Scholar] [CrossRef]
- Kiss, A.; Pfeiffer, L.; Popp, J.; Lakner, Z. A Blind man leads a blind man? Personalised nutrition-related attitudes, knowledge and behaviours of fitness trainers in Hungary. Nutrients 2020, 12, 663. [Google Scholar] [CrossRef]
- Škare, M.; Družeta, R.P. Constructing poverty lines in Croatia using Kakwani’s model. Journal of scientific papers. Econ. Sociol. 2017, 10, 209–221. [Google Scholar] [CrossRef]
- Qerimi, Q.; Sergi, B.S. The nature and the scope of the global economic crisis’ impact on employment trends and policies in South East Europe. J. Int. Stud. 2017, 10, 143–153. [Google Scholar] [CrossRef]
- Bilan, Y.; Mishchuk, H.; Samoliuk, N.; Yurchyk, H. Impact of income distribution on social and economic well-being of the state. Sustainability 2020, 12, 429. [Google Scholar] [CrossRef]


| Study, Year, Country | Ecological Indicator | Dietary Quality Assessment | Nutritional Data | Key Findings |
|---|---|---|---|---|
| Hess, et al. [18], UK | blue water footprint | food consumption quantity and structure as an indicator of dietary quality | five alternative healthier diet scenarios based on UK food consumption | Healthier scenarios had a small impact on total blue water scarcity footprint. |
| Tom, et al. [19], US | energy use, blue water footprint, and greenhouse gas emissions | foods as an indicator of dietary quality | three dietary scenarios based, on the 2010 USDA Dietary Guidelines | Reducing caloric intake levels to achieve “normal” weight without shifting food mix decreases energy use, blue water footprint and GHG emissions by around 9%. |
| De Marco, et al. [20], European perspective | ecological, water and carbon footprints | food consumption quantity and structure as an indicator of dietary quality, Mediterranean Adequacy Index (MAI) | food consumption data from the Food and Agriculture Organization food balance sheets in 48 European countries | An increase of 1 unit of MAI can reduce the ecological, carbon and water footprint |
| Capone, et al. [21], Italy | water footprint | food consumption quantity and structure as an indicator of dietary quality | food consumption data from the Food and Agriculture Organization food balance sheets in Italy, the United States and Finland | Adherence of the Italian population to the Mediterranean dietary pattern can bring health benefits and also reduces water footprint. |
| Vanham, et al. [22], Austria | water footprint | food consumption quantity and structure as an indicator of dietary quality | four different scenarios based upon food-based dietary guidelines | A vegetarian diet would result in the lowest water footprint consumption. |
| Vanham, et al. [23] European perspective | water footprint | food consumption quantity and structure as an indicator of dietary quality | four different scenarios based upon regional food-based dietary guidelines | A vegetarian diet could result in lower water use related to food consumption in European countries. |
| Meier and Christen [24] | chemical emissions, land use, blue water use | food consumption quantity and structure as an indicator of dietary quality | separated analysis of different food groups | In the case of sustainable food consumption gender is an important factor to consider. |
| Downs and Fanzo [25] | carbon footprint, ecological footprint, water footprint | food consumption quantity and structure as an indicator of dietary quality | separated analysis of different food groups | A cardioprotective diet can contribute to a more healthy and sustainable diet; however in order to achieve this food choices need to be considered specifically. |
| Scenarios | Short Description | Data Source |
|---|---|---|
| (1) Dietary Scenarios Based on the HDNSS and its Modifications | ||
| Baseline (HDNSSoriginal) | The baseline scenario represents the current nutrition in Hungary; the proportions of food groups (kcal/capita/day) are based on the published data of the HDNSS. | Sarkadi Nagy, et al. [33] |
| Reduced meat content diet | The reduced meat scenario is based on the baseline scenario; the meat food group was reduced by 50% in kcal and was replaced by eggs (12.5% in kcal), dairy products (12.5% in kcal), legumes (12.5% in kcal) and nuts (12.5% in kcal). | Sarkadi Nagy, et al. [33] |
| Vegetarian diet | The vegetarian scenario is based on the baseline scenario; the meat food group was reduced by 100% and was replaced by eggs (25% in kcal), dairy products (25% in kcal), legumes (25% in kcal) and nuts (25% in kcal). | Sarkadi Nagy, et al. [33] |
| Vegan diet | The vegan scenario is based on the baseline scenario; the meat and milk and dairy products food groups were reduced by 100% and replaced by grains (25% in kcal), potatoes (25% in kcal), legumes (25% in kcal) and nuts (25% in kcal). | Sarkadi Nagy, et al. [33] |
| (2) Dietary Scenarios Based on Guidelines and Alternative Diets | ||
| Planetary health diet (Sustainable) | The sustainable scenario is based on the description of the planetary health diet. The planetary health diet is developed on the principle of respect for health and nature. | Willett, et al. [39] |
| Cardioprotective diet (Cardioprotective) | The cardioprotective scenario is based on the elements of the cardioprotective diet. | Mozaffarian, et al. [40] |
| Low-carbohydrate high-fat diet (Ketogenic) | The ketogenic scenario is based on the widely accepted nutrient distribution of low-carbohydrate high-fat diets: 50–60% fat, 20–30% protein and a maximum of 30% carbohydrates | Adam-Perrot, et al. [41] |
| Classification of Nutrients | Elements of Dietary Quality ScoreHUN (n = 25) | Elements of Dietary Quality ScoreEFSA (n = 20) |
|---|---|---|
| (1) Qualifying nutrients (The population intake level of these is either adequate or low and a reasonably higher intake level is not related to health-risks). To elevate their intake would be beneficial on the population level) [34,52,53,55]. | dietary fiber (g), thiamin (mg), riboflavin (mg), niacin (NE), vitamin B6 (mg), folate (μg), vitamin B12 (μg), vitamin C (mg), vitamin A (μg), vitamin E (mg), calcium (mg), magnesium (mg), zinc (mg), potassium (mg), iron (mg), phosphorus (mg) | dietary fiber (g), thiamin (mg), riboflavin (mg), niacin (NE), vitamin B6 (mg), folate (μg), vitamin C (mg), vitamin A (μg), calcium (mg), magnesium (mg), zinc (mg), potassium (mg), iron (mg), phosphorus (mg) |
| (2) Dis-qualifying nutrients (the population intake level of these is high and related to health-risks) [34,35,52,53,55]. To lower their intake would be beneficial on the population level. | sugars (g), cholesterol (mg), total fat (g), sodium (mg), saturated fatty acids (mg) | sugars (g), saturated fatty acids (mg) |
| (3) Macronutrients with recommended intake range (nutrients that contribute to energy intake and have a recommended reference range) [56]. | total carbohydrate (g), total protein (g) | total carbohydrate (g), total protein (g), total fat (g) |
| (4) Recommended intake ratio of two nutrients (nutrients that interfere with each other in their absorption and/or utilization [34,35,55]. | Na:K, Ca:P |
| Scenarios | Green Water Footprint | Blue Water Footprint | ||
|---|---|---|---|---|
| Male | Value (L/Capita/Day) | Change in % Compared to Baseline Scenario | Value (L/Capita/Day) | Change in % Compared to Baseline Scenario |
| Baseline | 2785.6 | 44.6 | ||
| Reduced meat | 2602.1 | −6.6 | 41 | −8 |
| Vegetarian | 2418.5 | −13.2 | 37.5 | −15.9 |
| Vegan | 954.7 | −65.7 | 24.5 | −45 |
| Sustainable | 1681.7 | −39.6 | 33 | −26 |
| Cardioprotective | 2305.4 | −17.2 | 58 | +30.1 |
| Ketogenic | 3393.2 | +21.8 | 53.8 | +20.7 |
| Female | ||||
| Baseline | 2238.7 | 36.3 | ||
| Reduced meat | 2114 | −5.6 | 33.9 | −6.6 |
| Vegetarian | 1989.2 | −11.1 | 31.5 | −13.3 |
| Vegan | 729.8 | −67.4 | 20.4 | −43.8 |
| Sustainable | 1257.9 | −43.8 | 24.7 | −31.9 |
| Cardioprotective | 1724.4 | −23 | 43.4 | +19.6 |
| Ketogenic | 2538 | +13.4 | 40.2 | +10.9 |
© 2020 by the authors. Licensee MDPI, Basel, Switzerland. This article is an open access article distributed under the terms and conditions of the Creative Commons Attribution (CC BY) license (http://creativecommons.org/licenses/by/4.0/).
Share and Cite
Tompa, O.; Lakner, Z.; Oláh, J.; Popp, J.; Kiss, A. Is the Sustainable Choice a Healthy Choice?—Water Footprint Consequence of Changing Dietary Patterns. Nutrients 2020, 12, 2578. https://doi.org/10.3390/nu12092578
Tompa O, Lakner Z, Oláh J, Popp J, Kiss A. Is the Sustainable Choice a Healthy Choice?—Water Footprint Consequence of Changing Dietary Patterns. Nutrients. 2020; 12(9):2578. https://doi.org/10.3390/nu12092578
Chicago/Turabian StyleTompa, Orsolya, Zoltán Lakner, Judit Oláh, József Popp, and Anna Kiss. 2020. "Is the Sustainable Choice a Healthy Choice?—Water Footprint Consequence of Changing Dietary Patterns" Nutrients 12, no. 9: 2578. https://doi.org/10.3390/nu12092578
APA StyleTompa, O., Lakner, Z., Oláh, J., Popp, J., & Kiss, A. (2020). Is the Sustainable Choice a Healthy Choice?—Water Footprint Consequence of Changing Dietary Patterns. Nutrients, 12(9), 2578. https://doi.org/10.3390/nu12092578