Insulin Resistance Is Associated with Reduced Food Odor Sensitivity across a Wide Range of Body Weights

 ,
,
Abstract
1. Introduction
2. Materials and Methods
2.1. Subjects
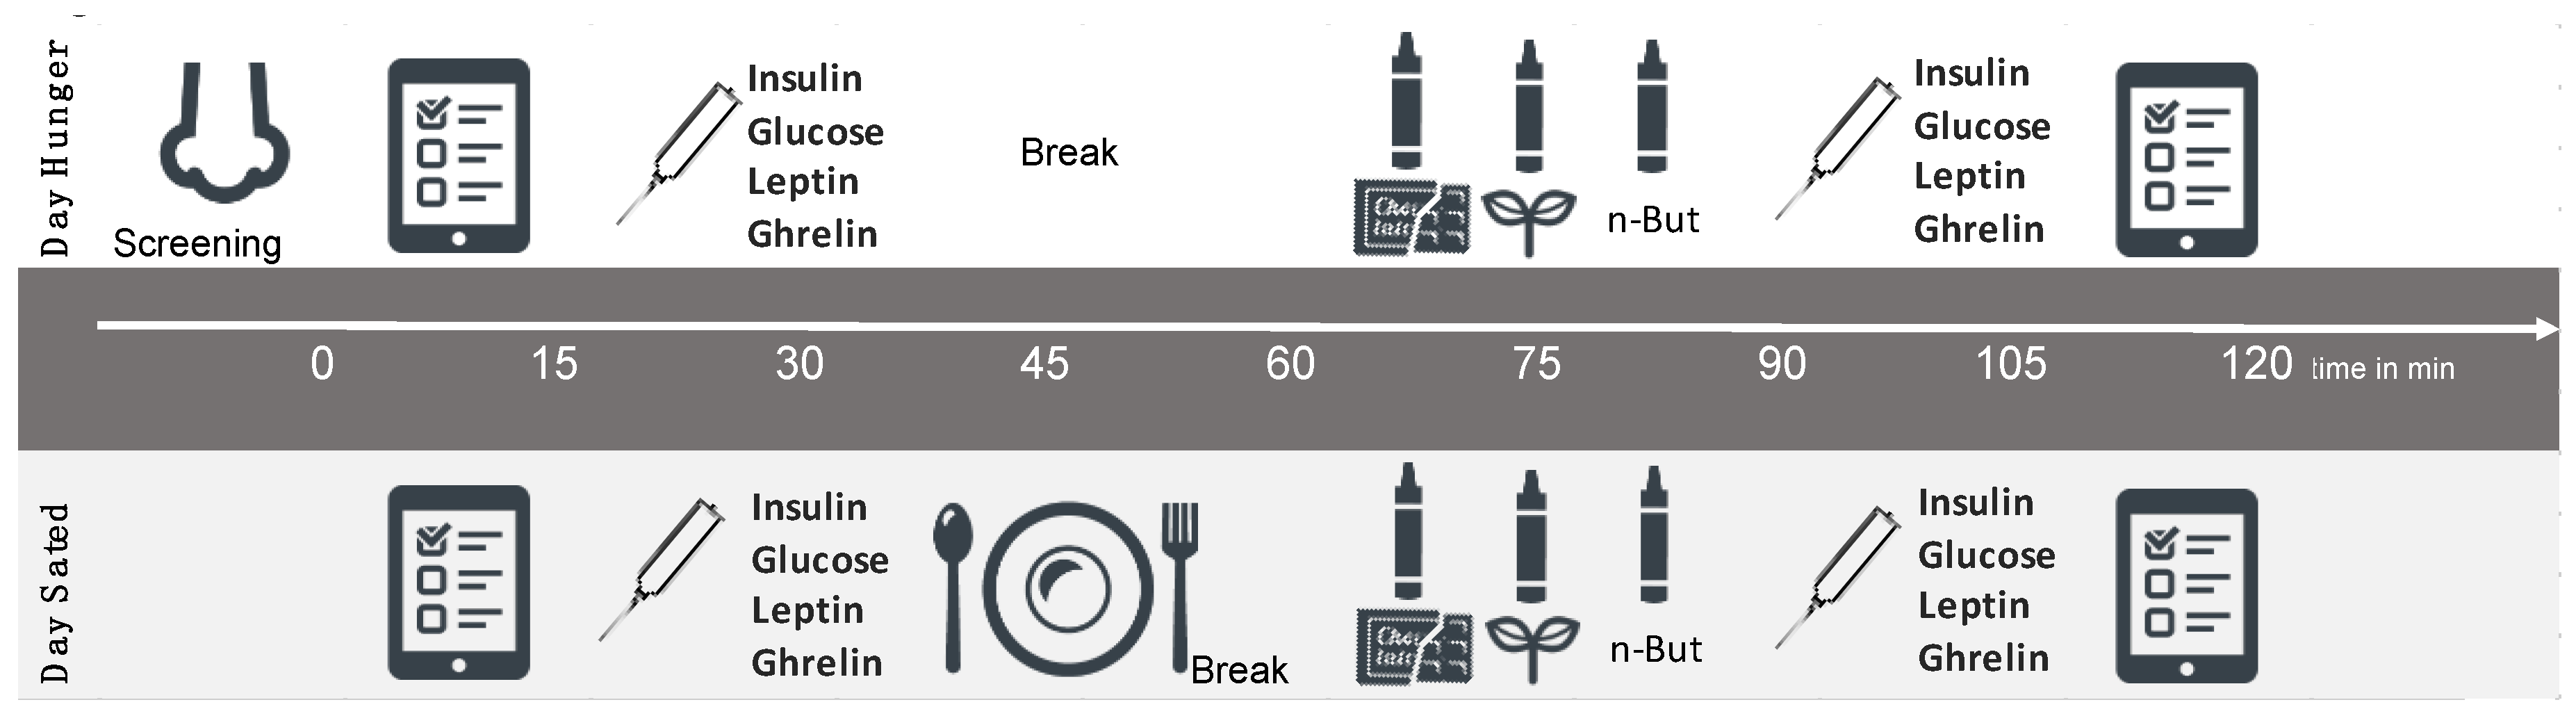
2.2. Study Design
2.3. Questionnaires and Interviews
2.4. Testing of Olfactory Performance
2.5. Blood Collection
2.6. Data Analysis
3. Results
3.1. Main Hypotheses
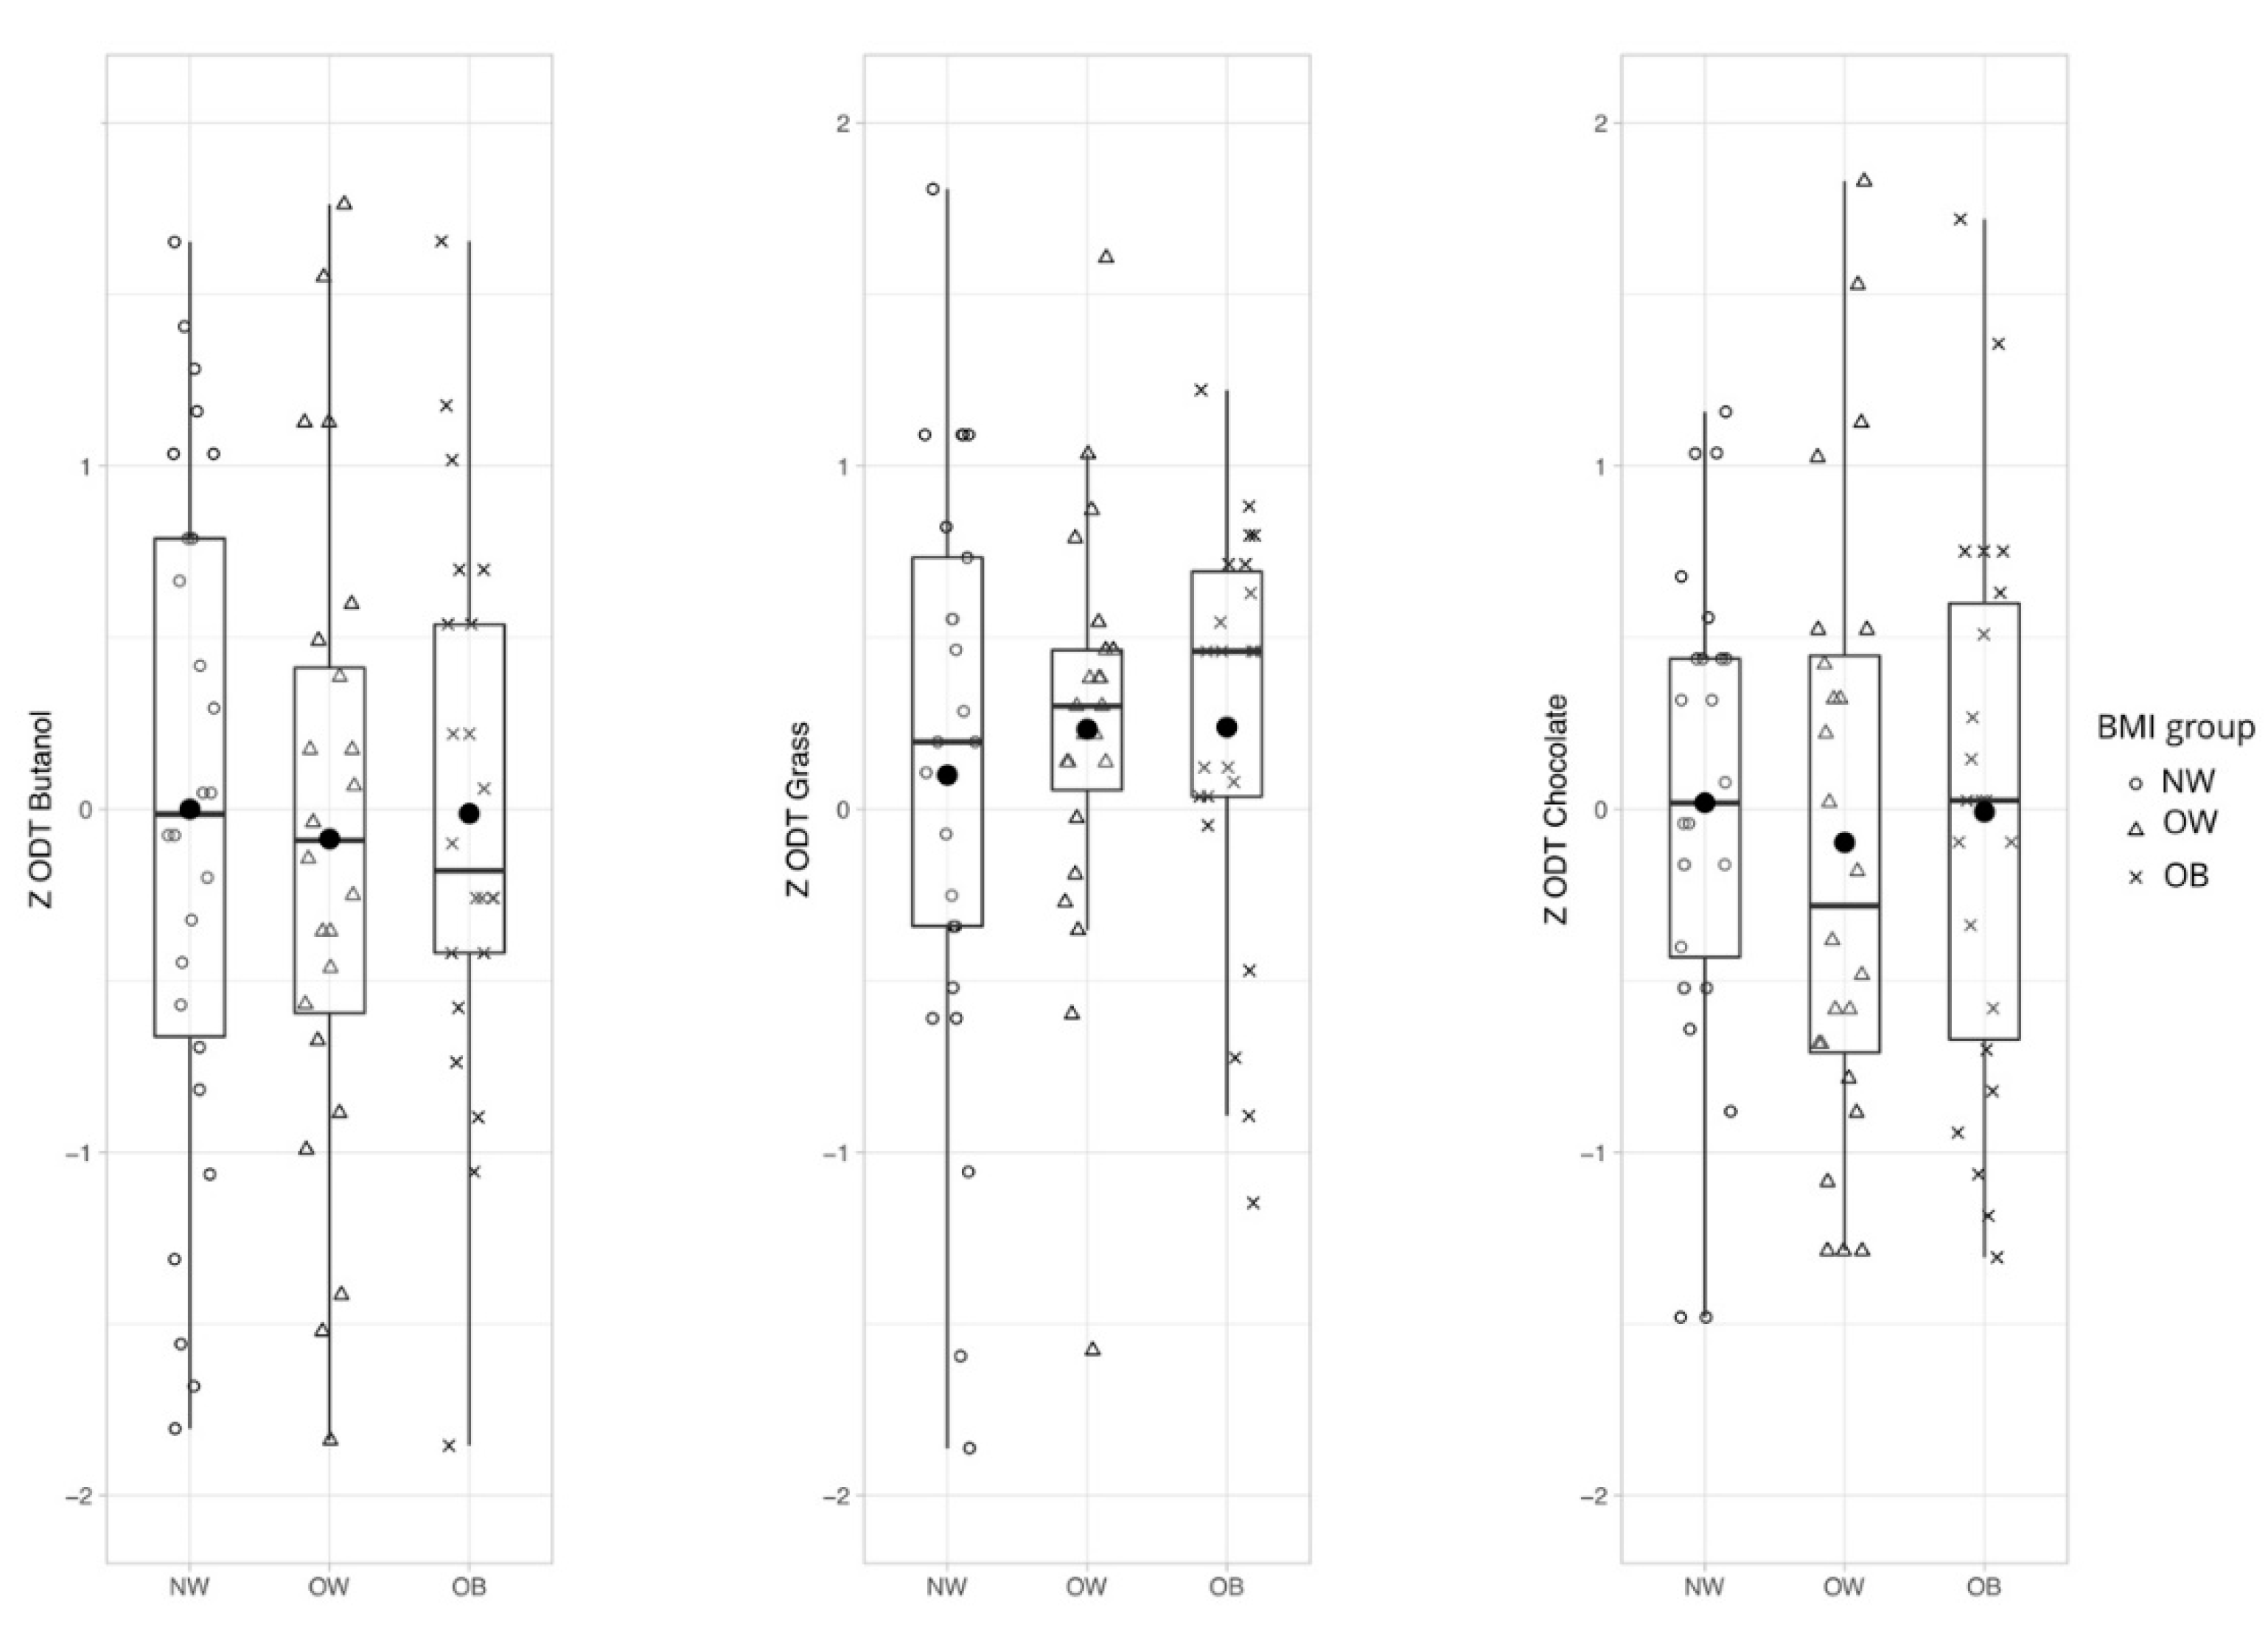
3.1.1. Hypothesis 1: General Olfactory Sensitivity Differs Between Weight Groups Depending on Odor Quality
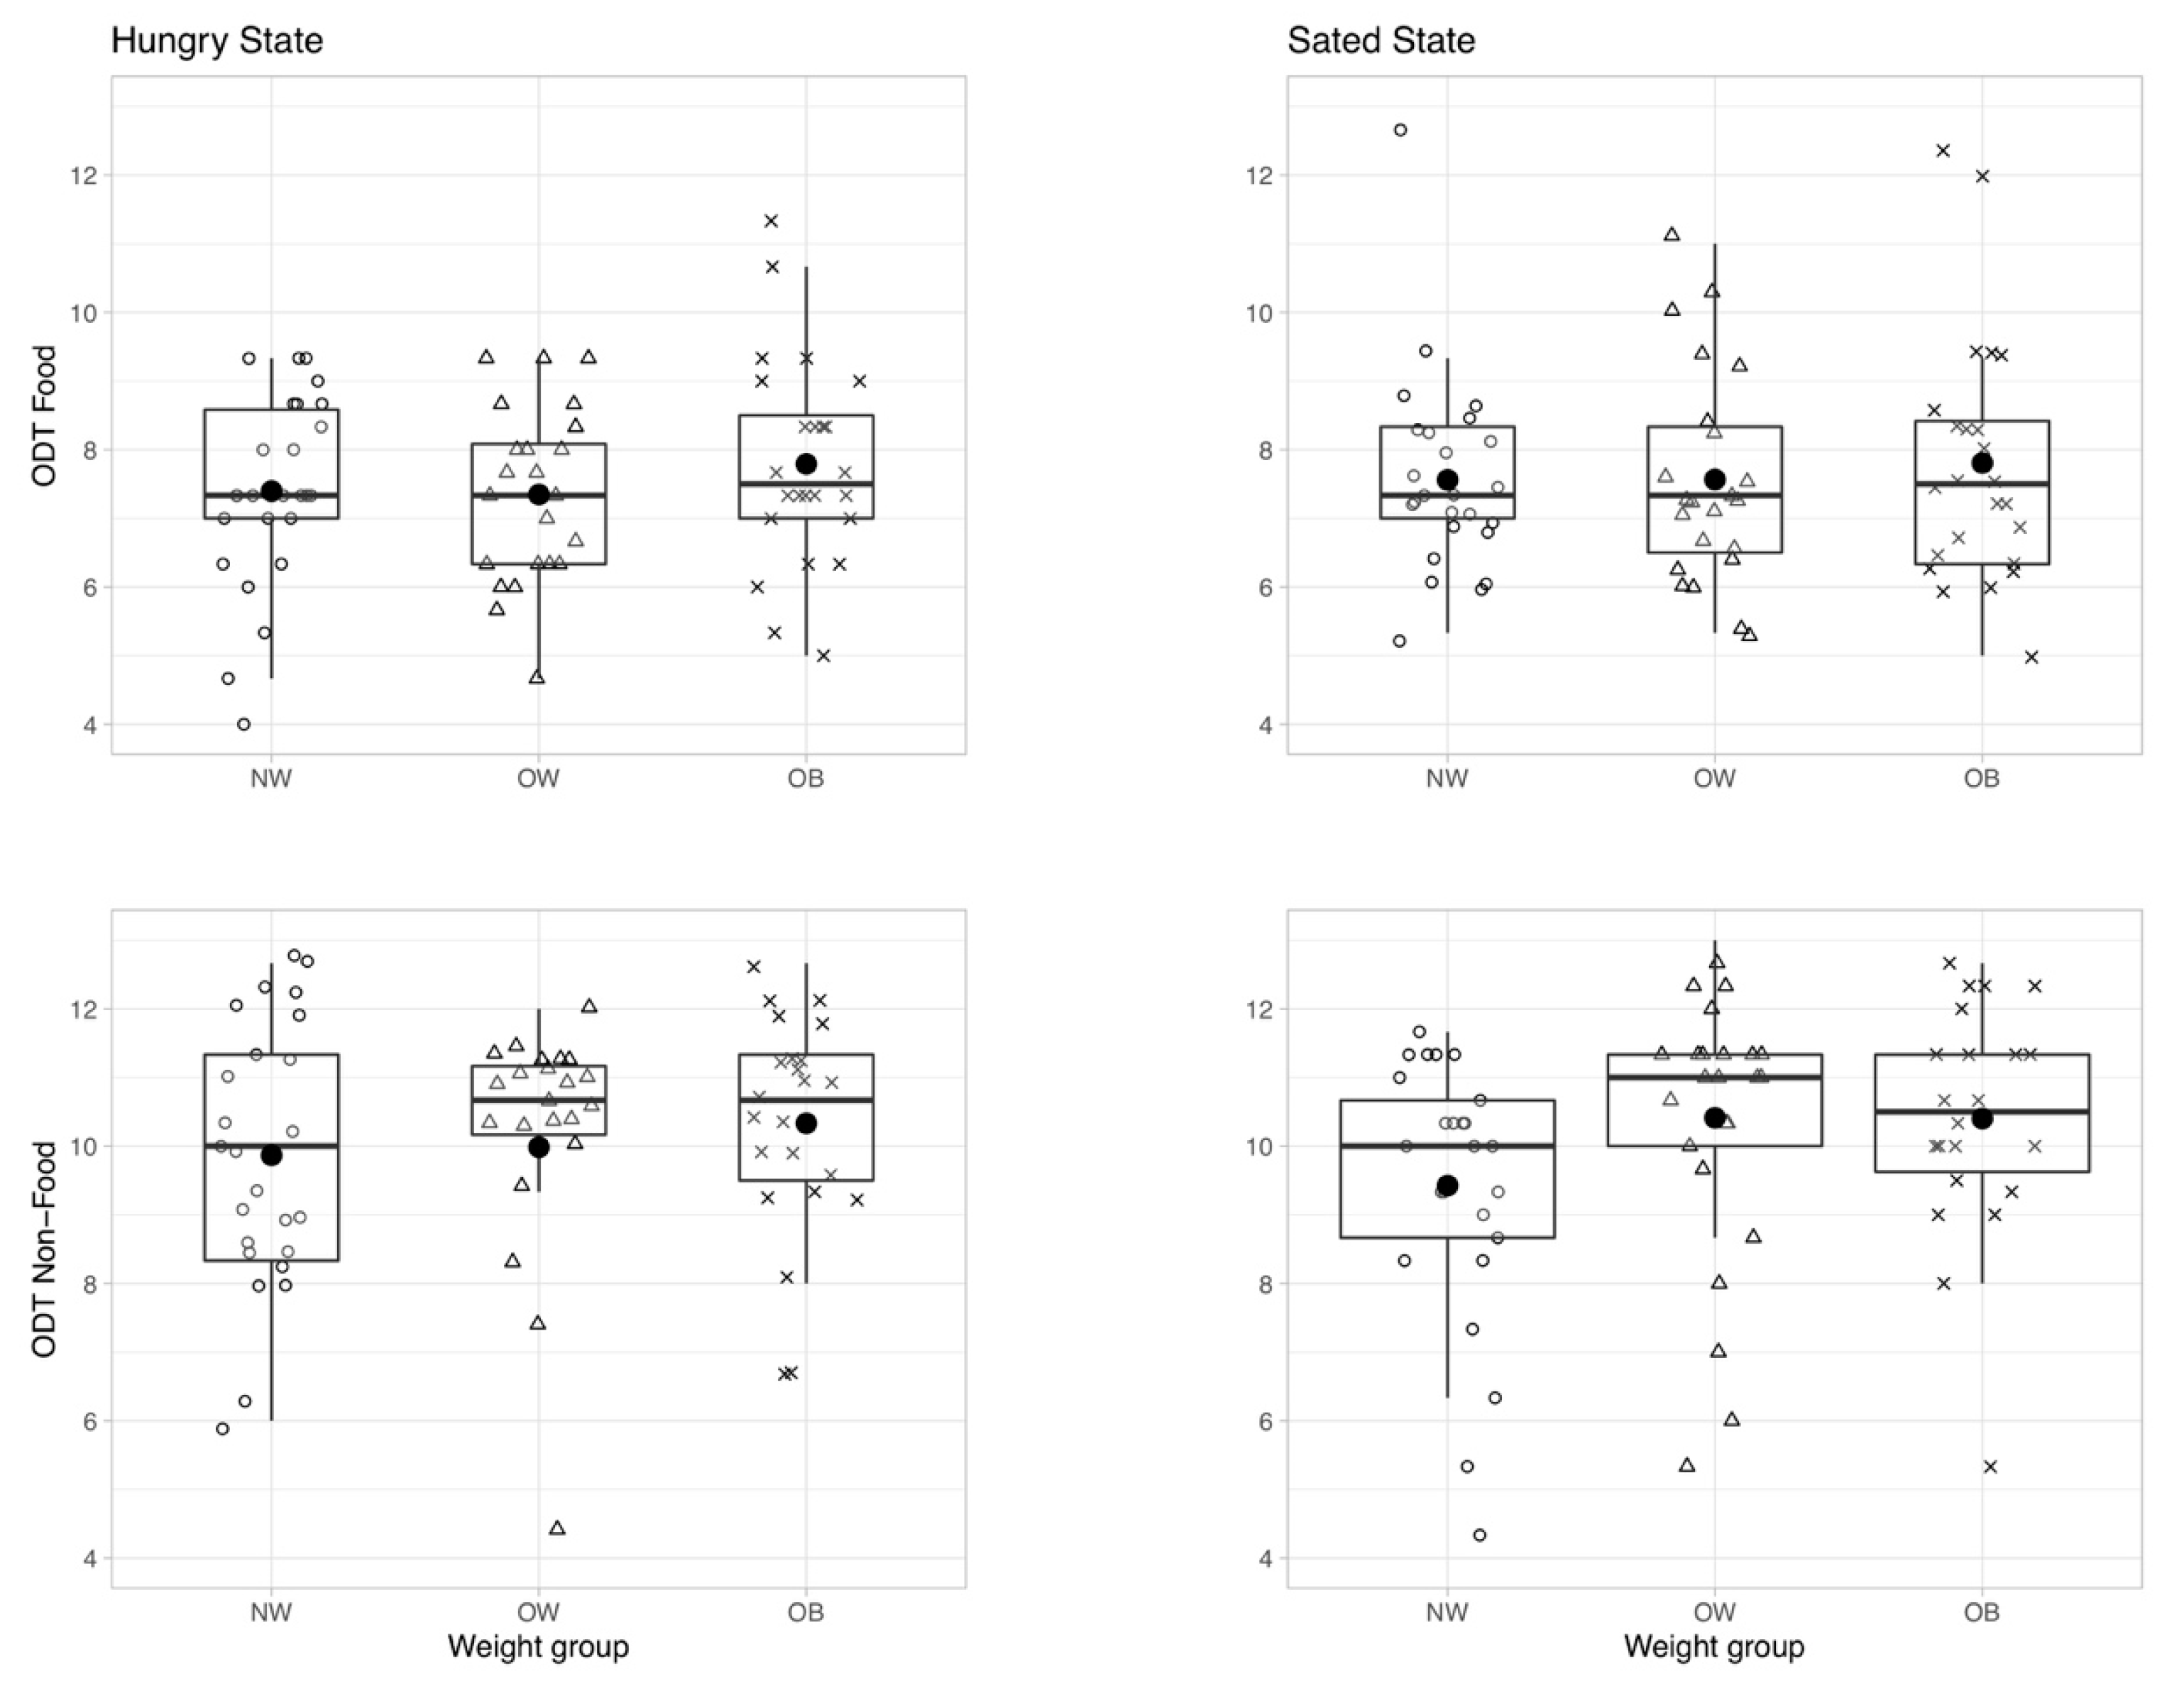
3.1.2. Hypothesis 2: Olfactory Sensitivity Depends on Hunger State
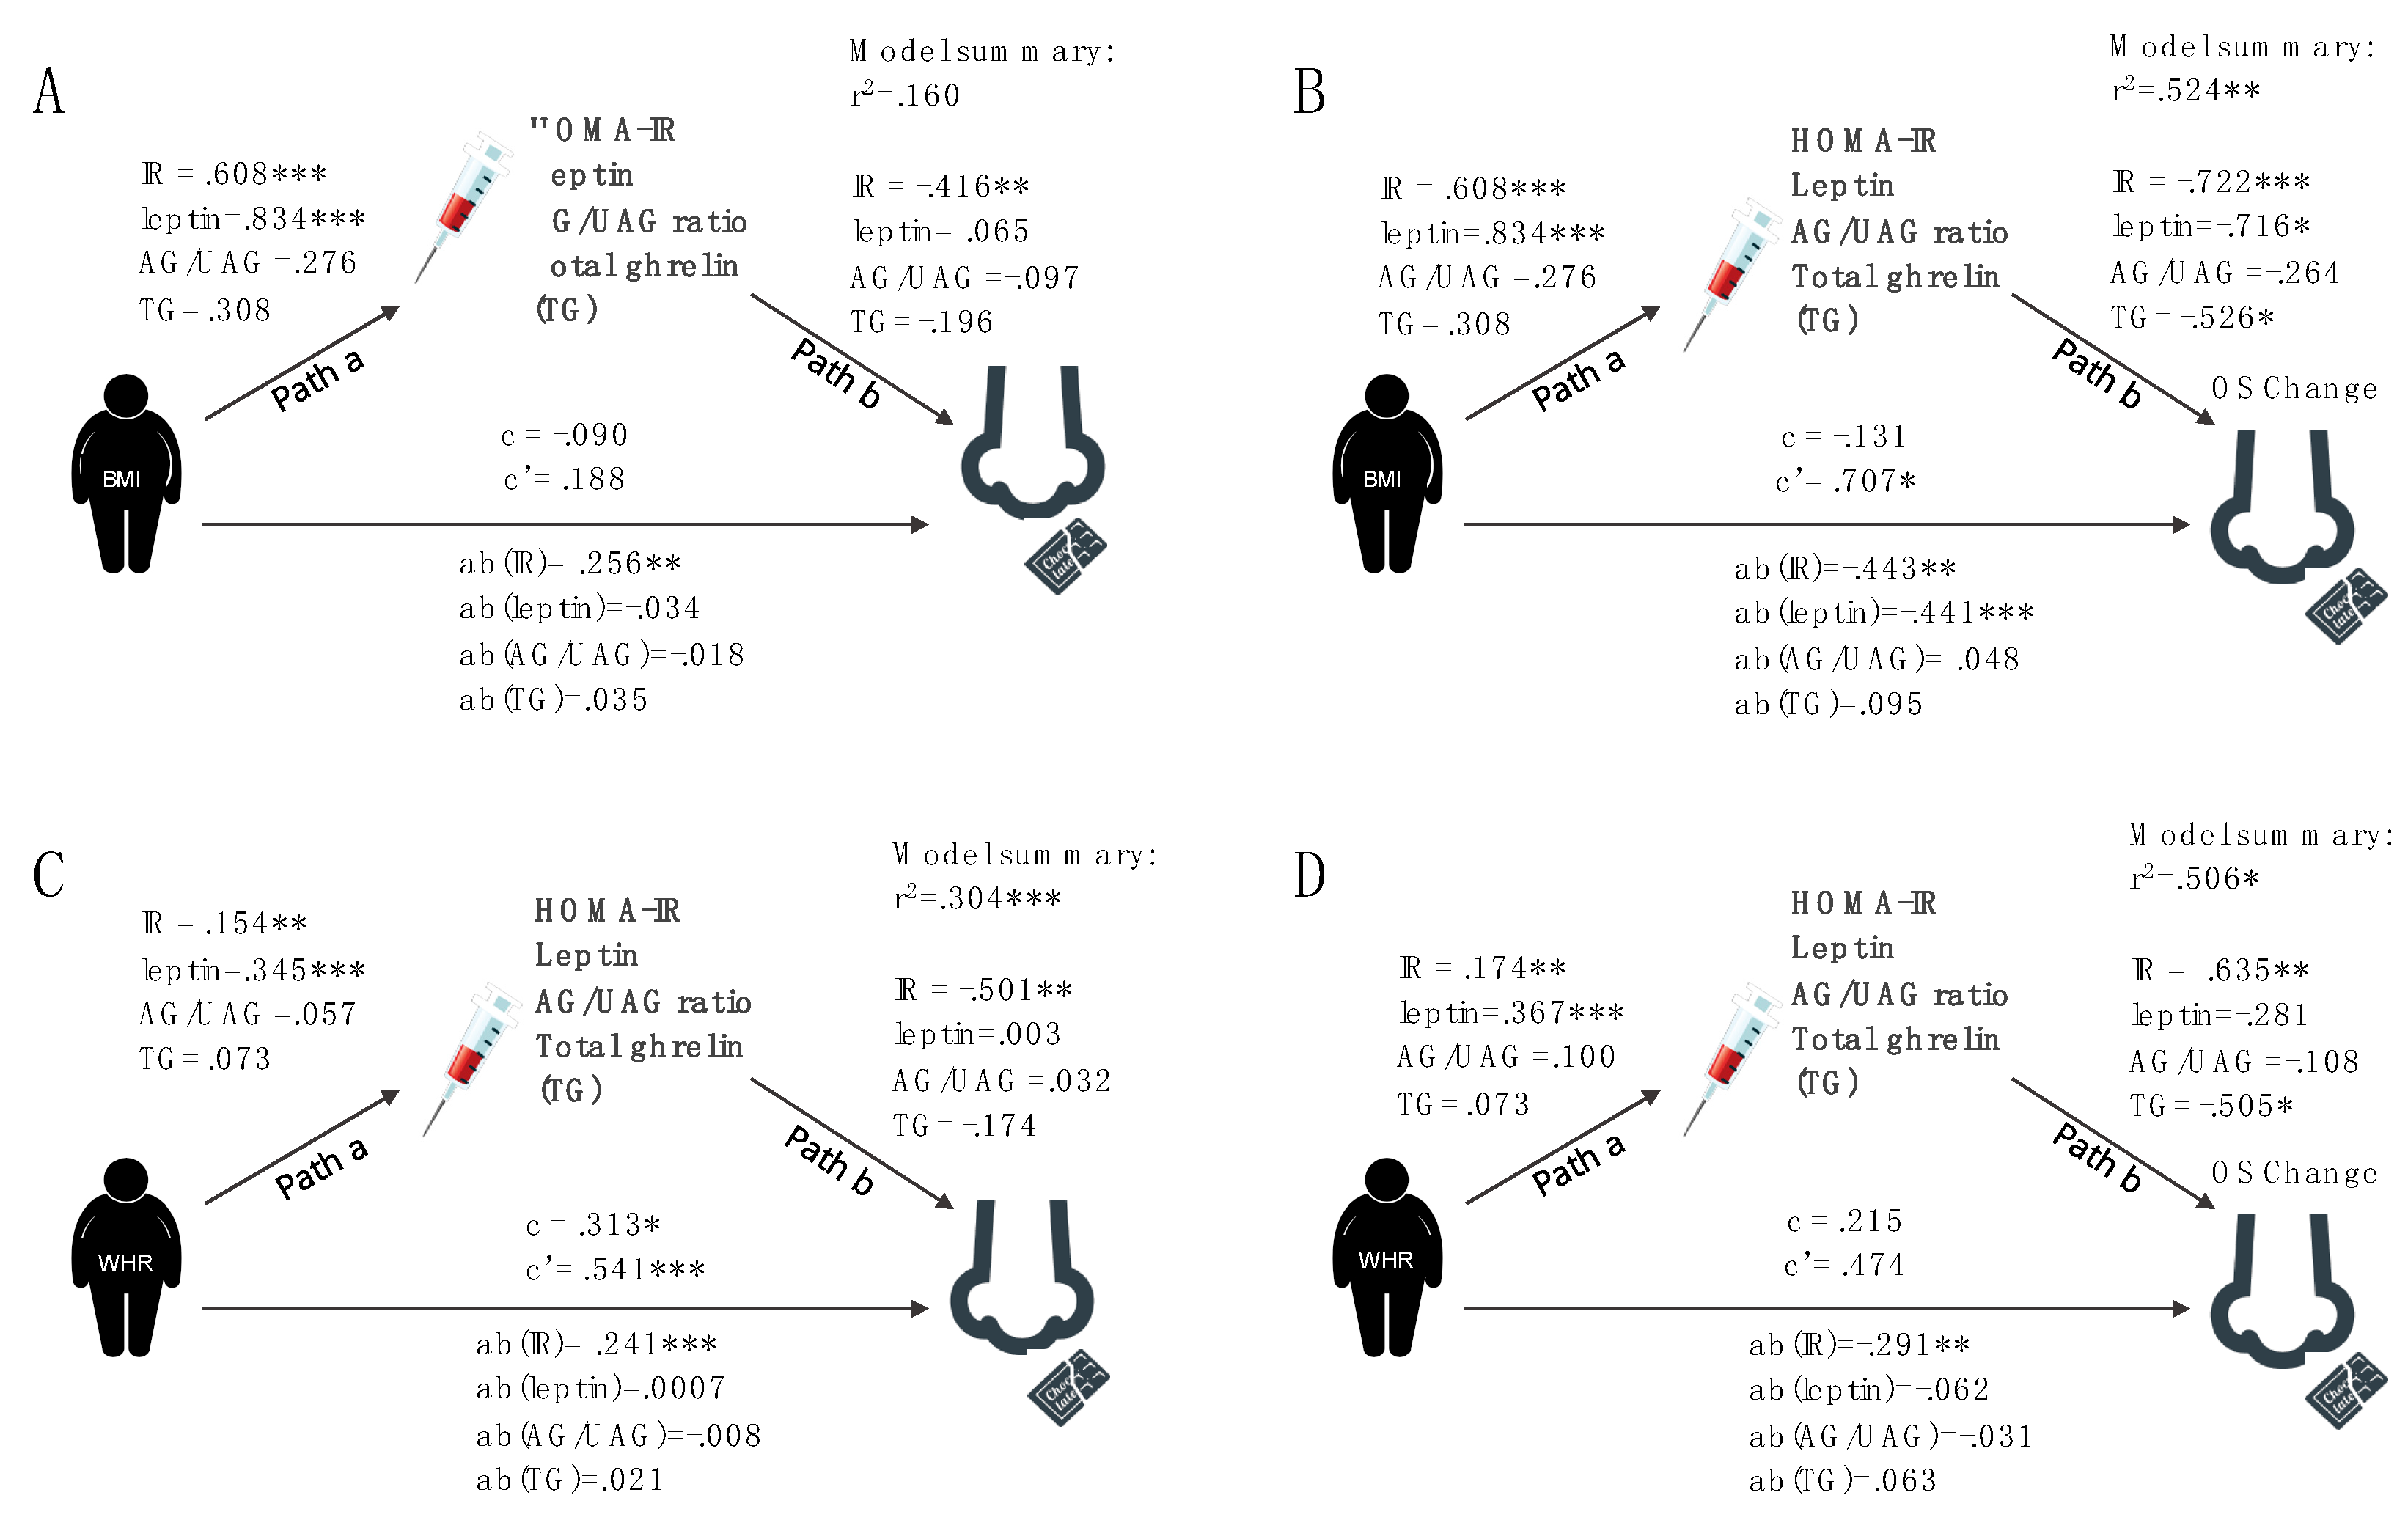
3.1.3. Hypothesis 3: Hormones Mediate Olfactory Performance
General Odor Sensitivity
Change in Odor Sensitivity in Response to a Meal
3.2. Post Hoc Analyses
4. Discussion
Limitations
5. Conclusions
Supplementary Materials
Author Contributions
Funding
Acknowledgments
Conflicts of Interest
References
- Lahey, R.; Khan, S.S. Trends in Obesity and Risk of Cardiovascular Disease. Curr. Epidemiol. Rep. 2018, 5, 243–251. [Google Scholar] [CrossRef]
- Xu, Y.; Mishra, S. Obesity-Linked Cancers: Current Knowledge, Challenges and Limitations in Mechanistic Studies and Rodent Models. Cancers 2018, 10, 523. [Google Scholar] [CrossRef] [PubMed]
- World Health Organization. World Health Statistics 2016: Monitoring Health for the SDGs Sustainable Development Goals; World Health Organization: Geneva, Switzerland, 2016. [Google Scholar]
- Lopez-Gonzalez, D.; Partida-Gaytán, A.; Wells, J.C.; Reyes-Delpech, P.; Avila-Rosano, F.; Ortiz-Obregon, M.; Gomez-Mendoza, F.; Diaz-Escobar, L.; Clark, P. Obesogenic Lifestyle and Its Influence on Adiposity in Children and Adolescents, Evidence from Mexico. Nutrients 2020, 12, 819. [Google Scholar] [CrossRef] [PubMed]
- Berthoud, H.R. The neurobiology of food intake in an obesogenic environment. Proc. Nutr. Soc. 2012, 71, 478–487. [Google Scholar] [CrossRef] [PubMed]
- Stroebele, N.; De Castro, J.M. Effect of ambience on food intake and food choice. Nutrition 2004, 20, 821–838. [Google Scholar] [CrossRef]
- Gaillet-Torrent, M.; Sulmont-Rosse, C.; Issanchou, S.; Chabanet, C.; Chambaron, S. Impact of a non-attentively perceived odour on subsequent food choices. Appetite 2014, 76, 17–22. [Google Scholar] [CrossRef]
- Coelho, J.S.; Polivy, J.; Herman, C.P.; Pliner, P. Wake up and smell the cookies. Effects of olfactory food-cue exposure in restrained and unrestrained eaters. Appetite 2009, 52, 517–520. [Google Scholar] [CrossRef]
- Ferriday, D.; Brunstrom, J.M. “I just can’t help myself”: effects of food-cue exposure in overweight and lean individuals. Int. J. Obes. 2011, 35, 142–149. [Google Scholar] [CrossRef]
- Boswell, R.G.; Kober, H. Food cue reactivity and craving predict eating and weight gain: A meta-analytic review. Obes. Rev. Off. J. Int. Assoc. Study Obes. 2016, 17, 159–177. [Google Scholar] [CrossRef]
- Belfort-DeAguiar, R.; Seo, D. Food Cues and Obesity: Overpowering Hormones and Energy Balance Regulation. Curr. Obes. Rep. 2018, 7, 122–129. [Google Scholar] [CrossRef]
- Proserpio, C.; Invitti, C.; Boesveldt, S.; Pasqualinotto, L.; Laureati, M.; Cattaneo, C.; Pagliarini, E. Ambient Odor Exposure Affects Food Intake and Sensory Specific Appetite in Obese Women. Front. Psychol. 2019, 10, 7. [Google Scholar] [CrossRef] [PubMed]
- Stafford, L.D.; Whittle, A. Obese individuals have higher preference and sensitivity to odor of chocolate. Chem. Senses 2015, 40, 279–284. [Google Scholar] [CrossRef] [PubMed]
- Fernandez-Garcia, J.C.; Alcaide, J.; Santiago-Fernandez, C.; Roca-Rodriguez, M.M.; Aguera, Z.; Banos, R.; Botella, C.; de la Torre, R.; Fernandez-Real, J.M.; Fruhbeck, G.; et al. An increase in visceral fat is associated with a decrease in the taste and olfactory capacity. PLoS ONE 2017, 12, e0171204. [Google Scholar]
- Peng, M.; Coutts, D.; Wang, T.; Cakmak, Y.O. Systematic review of olfactory shifts related to obesity. Obes. Rev. 2019, 20, 325–338. [Google Scholar] [CrossRef]
- Richardson, B.E.; Vander Woude, E.A.; Sudan, R.; Thompson, J.S.; Leopold, D.A. Altered olfactory acuity in the morbidly obese. Obes. Surg. 2004, 14, 967–969. [Google Scholar] [CrossRef]
- Enck, P.; Rieber, N.; Sauer, H.; Klosterhalfen, S.; Mack, I.; Zipfel, S.; Teufel, M. Almost Nothing-Not Even Bariatric Surgery for Obesity-Changes Olfactory Sensitivity. J. Res. Obes. 2014. [Google Scholar] [CrossRef]
- Aime, P.; Duchamp-Viret, P.; Chaput, M.A.; Savigner, A.; Mahfouz, M.; Julliard, A.K. Fasting increases and satiation decreases olfactory detection for a neutral odor in rats. Behav. Brain Res. 2007, 179, 258–264. [Google Scholar] [CrossRef]
- Cameron, J.D.; Goldfield, G.S.; Doucet, E. Fasting for 24 h improves nasal chemosensory performance and food palatability in a related manner. Appetite 2012, 58, 978–981. [Google Scholar] [CrossRef]
- Albrecht, J.; Schreder, T.; Kleemann, A.M.; Schopf, V.; Kopietz, R.; Anzinger, A.; Demmel, M.; Linn, J.; Kettenmann, B.; Wiesmann, M. Olfactory detection thresholds and pleasantness of a food-related and a non-food odour in hunger and satiety. Rhinology 2009, 47, 160–165. [Google Scholar]
- Ulusoy, S.; Dinc, M.E.; Dalgic, A.; Topak, M.; Dizdar, D.; Is, A. Are people who have a better smell sense, more affected from satiation? Braz. J. Otorhinolaryngol. 2016, 83, 640–645. [Google Scholar] [CrossRef]
- Haqq, A.M.; Farooqi, I.S.; O’Rahilly, S.; Stadler, D.D.; Rosenfeld, R.G.; Pratt, K.L.; LaFranchi, S.H.; Purnell, J.Q. Serum Ghrelin Levels Are Inversely Correlated with Body Mass Index, Age, and Insulin Concentrations in Normal Children and Are Markedly Increased in Prader-Willi Syndrome. J. Clin. Endocrinol. Metab. 2003, 88, 174–178. [Google Scholar] [CrossRef] [PubMed]
- Korek, E.; Krauss, H.; Gibas-Dorna, M.; Kupsz, J.; Piątek, M.; Piątek, J. Fasting and postprandial levels of ghrelin, leptin and insulin in lean, obese and anorexic subjects. Prz. Gastroenterol. 2013, 8, 383–389. [Google Scholar] [CrossRef] [PubMed]
- Palouzier-Paulignan, B.; Lacroix, M.C.; Aime, P.; Baly, C.; Caillol, M.; Congar, P.; Julliard, A.K.; Tucker, K.; Fadool, D.A. Olfaction under metabolic influences. Chem. Senses 2012, 37, 769–797. [Google Scholar] [CrossRef] [PubMed]
- Lacroix, M.-C.; Badonnel, K.; Meunier, N.; Tan, F.; Schlegel-Le Poupon, C.; Durieux, D.; Monnerie, R.; Baly, C.; Congar, P.; Salesse, R.; et al. Expression of insulin system in the olfactory epithelium: first approaches to its role and regulation. J. Neuroendocrinol. 2008, 20, 1176–1190. [Google Scholar] [CrossRef] [PubMed]
- Tong, J.; Mannea, E.; Aime, P.; Pfluger, P.T.; Yi, C.X.; Castaneda, T.R.; Davis, H.W.; Ren, X.; Pixley, S.; Benoit, S.; et al. Ghrelin enhances olfactory sensitivity and exploratory sniffing in rodents and humans. J. Neurosci. Off. J. Soc. Neurosci. 2011, 31, 5841–5846. [Google Scholar] [CrossRef] [PubMed]
- Henkin, R.I. Intranasal insulin: From nose to brain. Nutrition 2010, 26, 624–633. [Google Scholar] [CrossRef]
- Lean, M.E.J.; Malkova, D. Altered gut and adipose tissue hormones in overweight and obese individuals: Cause or consequence? Int. J. Obes. 2016, 40, 622–632. [Google Scholar] [CrossRef]
- Murphy, K.G.; Bloom, S.R. Gut hormones and the regulation of energy homeostasis. Nature 2006, 444, 854–859. [Google Scholar] [CrossRef]
- Jung, U.J.; Choi, M.S. Obesity and its metabolic complications: The role of adipokines and the relationship between obesity, inflammation, insulin resistance, dyslipidemia and nonalcoholic fatty liver disease. Int. J. Mol. Sci. 2014, 15, 6184–6223. [Google Scholar] [CrossRef]
- Münzberg, H.; Heymsfield, S.B. Leptin, Obesity, and leptin Resistance. In Leptin-Regulation and Clinical Applications; Sam Dagogo-Jack, M.D., Ed.; Springer International Publishing: Cham, Switzerland, 2015; pp. 67–78. [Google Scholar]
- Heiker, J.T. Vaspin (serpinA12) in obesity, insulin resistance, and inflammation. J. Pept. Sci. Off. Publ. Eur. Pept. Soc. 2014, 20, 299–306. [Google Scholar] [CrossRef]
- Cui, H.; López, M.; Rahmouni, K. The cellular and molecular bases of leptin and ghrelin resistance in obesity. Nat. Rev. Endocrinol. 2017, 13, 338–351. [Google Scholar] [CrossRef] [PubMed]
- Tschöp, M.; Weyer, C.; Tataranni, P.A.; Devanarayan, V.; Ravussin, E.; Heiman, M.L. Circulating ghrelin levels are decreased in human obesity. Diabetes 2001, 50, 707–709. [Google Scholar] [CrossRef]
- Tschöp, M.; Wawarta, R.; Riepl, R.L.; Friedrich, S.; Bidlingmaier, M.; Landgraf, R.; Folwaczny, C. Post-prandial decrease of circulating human ghrelin levels. J. Endocrinol. Investig. 2001, 24, RC19–RC21. [Google Scholar] [CrossRef] [PubMed]
- Delhanty, P.J.; Neggers, S.J.; van der Lely, A.J. Mechanisms in endocrinology: Ghrelin: the differences between acyl-and des-acyl ghrelin. Eur. J. Endocrinol. 2012, 167, 601–608. [Google Scholar] [CrossRef] [PubMed]
- St-Pierre, D.H.; Karelis, A.D.; Coderre, L.; Malita, F.; Fontaine, J.; Mignault, D.; Brochu, M.; Bastard, J.-P.; Cianflone, K.; Doucet, E.; et al. Association of acylated and nonacylated ghrelin with insulin sensitivity in overweight and obese postmenopausal women. J. Clin. Endocrinol. Metab. 2007, 92, 264–269. [Google Scholar] [CrossRef]
- Hummel, T.; Kobal, G.; Gudziol, H.; Mackay-Sim, A. Normative data for the “Sniffin’ Sticks” including tests of odor identification, odor discrimination, and olfactory thresholds: an upgrade based on a group of more than 3,000 subjects. Eur. Arch. Oto Rhino Laryngol. 2007, 264, 237–243. [Google Scholar] [CrossRef] [PubMed]
- Mueller, C.; Renner, B. A new procedure for the short screening of olfactory function using five items from the “Sniffin’ Sticks” identification test kit. Am. J. Rhinol. 2006, 20, 113–116. [Google Scholar] [CrossRef]
- Aitken, R.C. Measurement of feelings using visual analogue scales. Proc. R. Soc. Med. 1969, 62, 989–993. [Google Scholar]
- Beck, A.T.; Ward, C.H.; Mendelson, M.; Mock, J.; Erbaugh, J. An inventory for measuring depression. Arch. Gen. Psychiatry 1961, 4, 561–571. [Google Scholar] [CrossRef]
- Loeffler, M.; Engel, C.; Ahnert, P.; Alfermann, D.; Arelin, K.; Baber, R.; Beutner, F.; Binder, H.; Brähler, E.; Burkhardt, R.; et al. The LIFE-Adult-Study: objectives and design of a population-based cohort study with 10,000 deeply phenotyped adults in Germany. BMC Public Health 2015, 15, 1–14. [Google Scholar] [CrossRef]
- Derntl, B.; Schopf, V.; Kollndorfer, K.; Lanzenberger, R. Menstrual cycle phase and duration of oral contraception intake affect olfactory perception. Chem. Senses 2013, 38, 67–75. [Google Scholar] [CrossRef] [PubMed]
- McNeil, J.; Cameron, J.D.; Finlayson, G.; Blundell, J.E.; Doucet, E. Greater overall olfactory performance, explicit wanting for high fat foods and lipid intake during the mid-luteal phase of the menstrual cycle. Physiol. Behav. 2013, 112, 84–89. [Google Scholar] [CrossRef] [PubMed]
- Pössel, M.; Freiherr, J.; Horstmann, A. Rapid Assessment of Olfactory Sensitivity Using the “Sniffin’ Sticks”. Chemosens. Percept. 2019, 13, 37–44. [Google Scholar] [CrossRef]
- Team RStudio. RStudio: Integrated Development Environment for R. Boston; RStudio Inc.: Boston, MA, USA, 2016. [Google Scholar]
- Matthews, D.R.; Hosker, J.P.; Rudenski, A.S.; Naylor, B.A.; Treacher, D.F.; Turner, R.C. Homeostasis model assessment: insulin resistance and β-cell function from fasting plasma glucose and insulin concentrations in man. Diabetologia 1985, 28, 412–419. [Google Scholar] [CrossRef]
- Hoaglin, D.C.; Iglewicz, B. Fine-Tuning Some Resistant Rules for Outlier Labeling. J. Am. Stat. Assoc. 1987, 82, 1147–1149. [Google Scholar] [CrossRef]
- Castro-Schilo, L.; Grimm, K.J. Using residualized change versus difference scores for longitudinal research. J. Soc. Pers. Relatsh. 2018, 35, 32–58. [Google Scholar] [CrossRef]
- Lee, C.H.; Shih, A.Z.L.; Woo, Y.C.; Fong, C.H.Y.; Leung, O.Y.; Janus, E.; Cheung, B.M.Y.; Lam, K.S.L. Optimal Cut-Offs of Homeostasis Model Assessment of Insulin Resistance (HOMA-IR) to Identify Dysglycemia and Type 2 Diabetes Mellitus: A 15-Year Prospective Study in Chinese. PLoS ONE 2016, 11, e0163424. [Google Scholar] [CrossRef]
- Fernández-Aranda, F.; Agüera, Z.; Fernández-García, J.C.; Garrido-Sanchez, L.; Alcaide-Torres, J.; Tinahones, F.J.; Giner-Bartolomé, C.; Baños, R.M.; Botella, C.; Cebolla, A.; et al. Smell-taste dysfunctions in extreme weight/eating conditions: Analysis of hormonal and psychological interactions. Endocrine 2016, 51, 256–267. [Google Scholar] [CrossRef]
- Sun, X.; Veldhuizen, M.G.; Babbs, A.E.; Sinha, R.; Small, D.M. Perceptual and Brain Response to Odors Is Associated with Body Mass Index and Postprandial Total Ghrelin Reactivity to a Meal. Chem. Senses 2016, 41, 233–248. [Google Scholar] [CrossRef]
- Pastor, A.; Fernandez-Aranda, F.; Fito, M.; Jimenez-Murcia, S.; Botella, C.; Fernandez-Real, J.M.; Fruhbeck, G.; Tinahones, F.J.; Fagundo, A.B.; Rodriguez, J.; et al. A Lower Olfactory Capacity Is Related to Higher Circulating Concentrations of Endocannabinoid 2-Arachidonoylglycerol and Higher Body Mass Index in Women. PLoS ONE 2016, 11, e0148734. [Google Scholar] [CrossRef]
- Julliard, A.K.; Chaput, M.A.; Apelbaum, A.; Aimé, P.; Mahfouz, M.; Duchamp-Viret, P. Changes in rat olfactory detection performance induced by orexin and leptin mimicking fasting and satiation. Behav. Brain Res. 2007, 183, 123–129. [Google Scholar] [CrossRef] [PubMed]
- Aimé, P.; Palouzier-Paulignan, B.; Salem, R.; Al Koborssy, D.; Garcia, S.; Duchamp, C.; Romestaing, C.; Julliard, A.K. Modulation of olfactory sensitivity and glucose-sensing by the feeding state in obese Zucker rats. Front. Behav. Neurosci. 2014, 8, 326. [Google Scholar]
- Riera, C.E.; Tsaousidou, E.; Halloran, J.; Follett, P.; Hahn, O.; Pereira, M.M.A.; Ruud, L.E.; Alber, J.; Tharp, K.; Anderson, C.M.; et al. The Sense of Smell Impacts Metabolic Health and Obesity. Cell Metab. 2017, 26, 198–211. [Google Scholar] [CrossRef] [PubMed]
- Hayes, J.E.; Jinks, A.L. Evaluation of smoking on olfactory thresholds of phenyl ethyl alcohol and n-butanol. Physiol. Behav. 2012, 107, 177–180. [Google Scholar] [CrossRef] [PubMed]
- Hummel, T.; Sekinger, B.; Wolf, S.R.; Pauli, E.; Kobal, G. “Sniffin” sticks’: Olfactory performance assessed by the combined testing of odor identification, odor discrimination and olfactory threshold. Chem. Senses 1997, 22, 39–52. [Google Scholar] [CrossRef]
- Croy, I.; Lange, K.; Krone, F.; Negoias, S.; Seo, H.-S.; Hummel, T. Comparison between odor thresholds for phenyl ethyl alcohol and butanol. Chem. Senses 2009, 34, 523–527. [Google Scholar] [CrossRef]
- Doty, R.L.; McKeown, D.A.; Lee, W.W.; Shaman, P. A study of the test-retest reliability of ten olfactory tests. Chem. Senses 1995, 20, 645–656. [Google Scholar] [CrossRef]
- Albrecht, J.; Anzinger, A.; Kopietz, R.; Schopf, V.; Kleemann, A.M.; Pollatos, O.; Wiesmann, M. Test-retest reliability of the olfactory detection threshold test of the Sniffin’ sticks. Chem. Senses 2008, 33, 461–467. [Google Scholar] [CrossRef]
- Stafford, L.D.; Welbeck, K. High hunger state increases olfactory sensitivity to neutral but not food odors. Chem. Senses 2011, 36, 189–198. [Google Scholar] [CrossRef]


| Total | Normal Weight (NW) | Overweight (OW) | Obese (OB) | p-Value | |
|---|---|---|---|---|---|
| (75, 37 females) | (n = 26, 14 females) | (n = 25, 12 females) | (n = 24, 11 females) | ||
| Characteristics | |||||
| Age (years) | 27.2 ± 3.7 | 26.1 ± 2.7 | 27.3 ± 1.3 | 27.7 ± 4.4 | p = 0.142 a |
| BMI (kg/m2) | 27.8 ± 5.3 | 22.4 ± 1.7 | 27.3 ± 1.3 | 34.1 ± 3.5 | p < 0.001 a |
| BDI sum | 4.0 ± 3.6 | 2.9 ± 3.0 | 4.5 ± 4.1 | 4.5 ± 3.4 | p = 0.169 a |
| Passive Smoke | 3.0 ± 8.5 | 4.8 ± 13.9 | 2.1 ± 2.7 | 2.1 ± 3.5 | p = 0.443 a |
| Metabolic profile | |||||
| HOMA-IR | 1.18 ± 0.79 | 0.71 ± 0.30 | 1.11 ±0.63 | 1.78 ± 0.94 | p = 0.019 b, p < 0.001 c, p = 0.018 d |
| Leptin | 15.59 ± 17.88 | 6.19 ± 3.92 | 12.65 ± 13.1 | 26.77 ± 23.25 | p < 0.001 a |
| Total ghrelin | 571.53 ± 218.17 | 604.35 ± 238.32 | 626.46 ± 186.43 | 478.75 ± 204.12 | p = 0.926 b, p = 0.097 c, p = 0.044 d |
| AG/UAG ratio | 19.92 ±14.21 | 21.39 ± 16.25 | 16.22 ± 8.67 | 22.19 ± 16.17 | p = 0.278 a |
| Odors | |||||
| N-butanol | |||||
| Pleasantness | 3.72 ± 1.80 | 3.23 ± 1.71 | 4.14 ± 2.03 | ns a | |
| Intensity | 7.28 ± 1.78 | 7.52 ± 1.80 | 6.67 ± 1.88 | ns a | |
| Familiarity | 5.72 ± 2.51 | 6.00 ±2.79 | 5.16 ± 2.65 | ns a | |
| Chocolate | |||||
| Pleasantness | 8.03 ± 1.46 | 7.76 ± 2.04 | 7.55 ± 1.54 | ns a | |
| Intensity | 7.99 ± 1.70 | 7.79 ± 1.64 | 7.79 ± 1.45 | ns a | |
| Familiarity | 8.61 ± 1.32 | 8.80 ± 1.24 | 8.26 ± 1.65 | ns a | |
| Grass | |||||
| Pleasantness | 7.31 ± 1.55 | 7.46 ± 1.92 | 6.58 ±2.51 | ns a | |
| Intensity | 7.73 ± 1.63 | 7.80 ± 2.05 | 7.64 ± 1.70 | ns a | |
| Familiarity | 7.69 ± 2.10 | 7.90 ± 2.83 | 7.35 ± 2.71 | ns a | |
© 2020 by the authors. Licensee MDPI, Basel, Switzerland. This article is an open access article distributed under the terms and conditions of the Creative Commons Attribution (CC BY) license (http://creativecommons.org/licenses/by/4.0/).
Share and Cite
Poessel, M.; Freiherr, J.; Wiencke, K.; Villringer, A.; Horstmann, A. Insulin Resistance Is Associated with Reduced Food Odor Sensitivity across a Wide Range of Body Weights. Nutrients 2020, 12, 2201. https://doi.org/10.3390/nu12082201
Poessel M, Freiherr J, Wiencke K, Villringer A, Horstmann A. Insulin Resistance Is Associated with Reduced Food Odor Sensitivity across a Wide Range of Body Weights. Nutrients. 2020; 12(8):2201. https://doi.org/10.3390/nu12082201
Chicago/Turabian StylePoessel, Maria, Jessica Freiherr, Kathleen Wiencke, Arno Villringer, and Annette Horstmann. 2020. "Insulin Resistance Is Associated with Reduced Food Odor Sensitivity across a Wide Range of Body Weights" Nutrients 12, no. 8: 2201. https://doi.org/10.3390/nu12082201
APA StylePoessel, M., Freiherr, J., Wiencke, K., Villringer, A., & Horstmann, A. (2020). Insulin Resistance Is Associated with Reduced Food Odor Sensitivity across a Wide Range of Body Weights. Nutrients, 12(8), 2201. https://doi.org/10.3390/nu12082201