Impact of Taste on Food Choices in Adolescence—Systematic Review and Meta-Analysis

 , ,
, ,
Abstract
1. Introduction
2. Materials and Methods
2.1. Search Strategy
2.2. Inclusion and Exclusion Criteria
2.3. Study Selection
2.4. Data Extraction
2.5. Quality Assessment of Studies
2.6. Statistical Analysis
3. Results
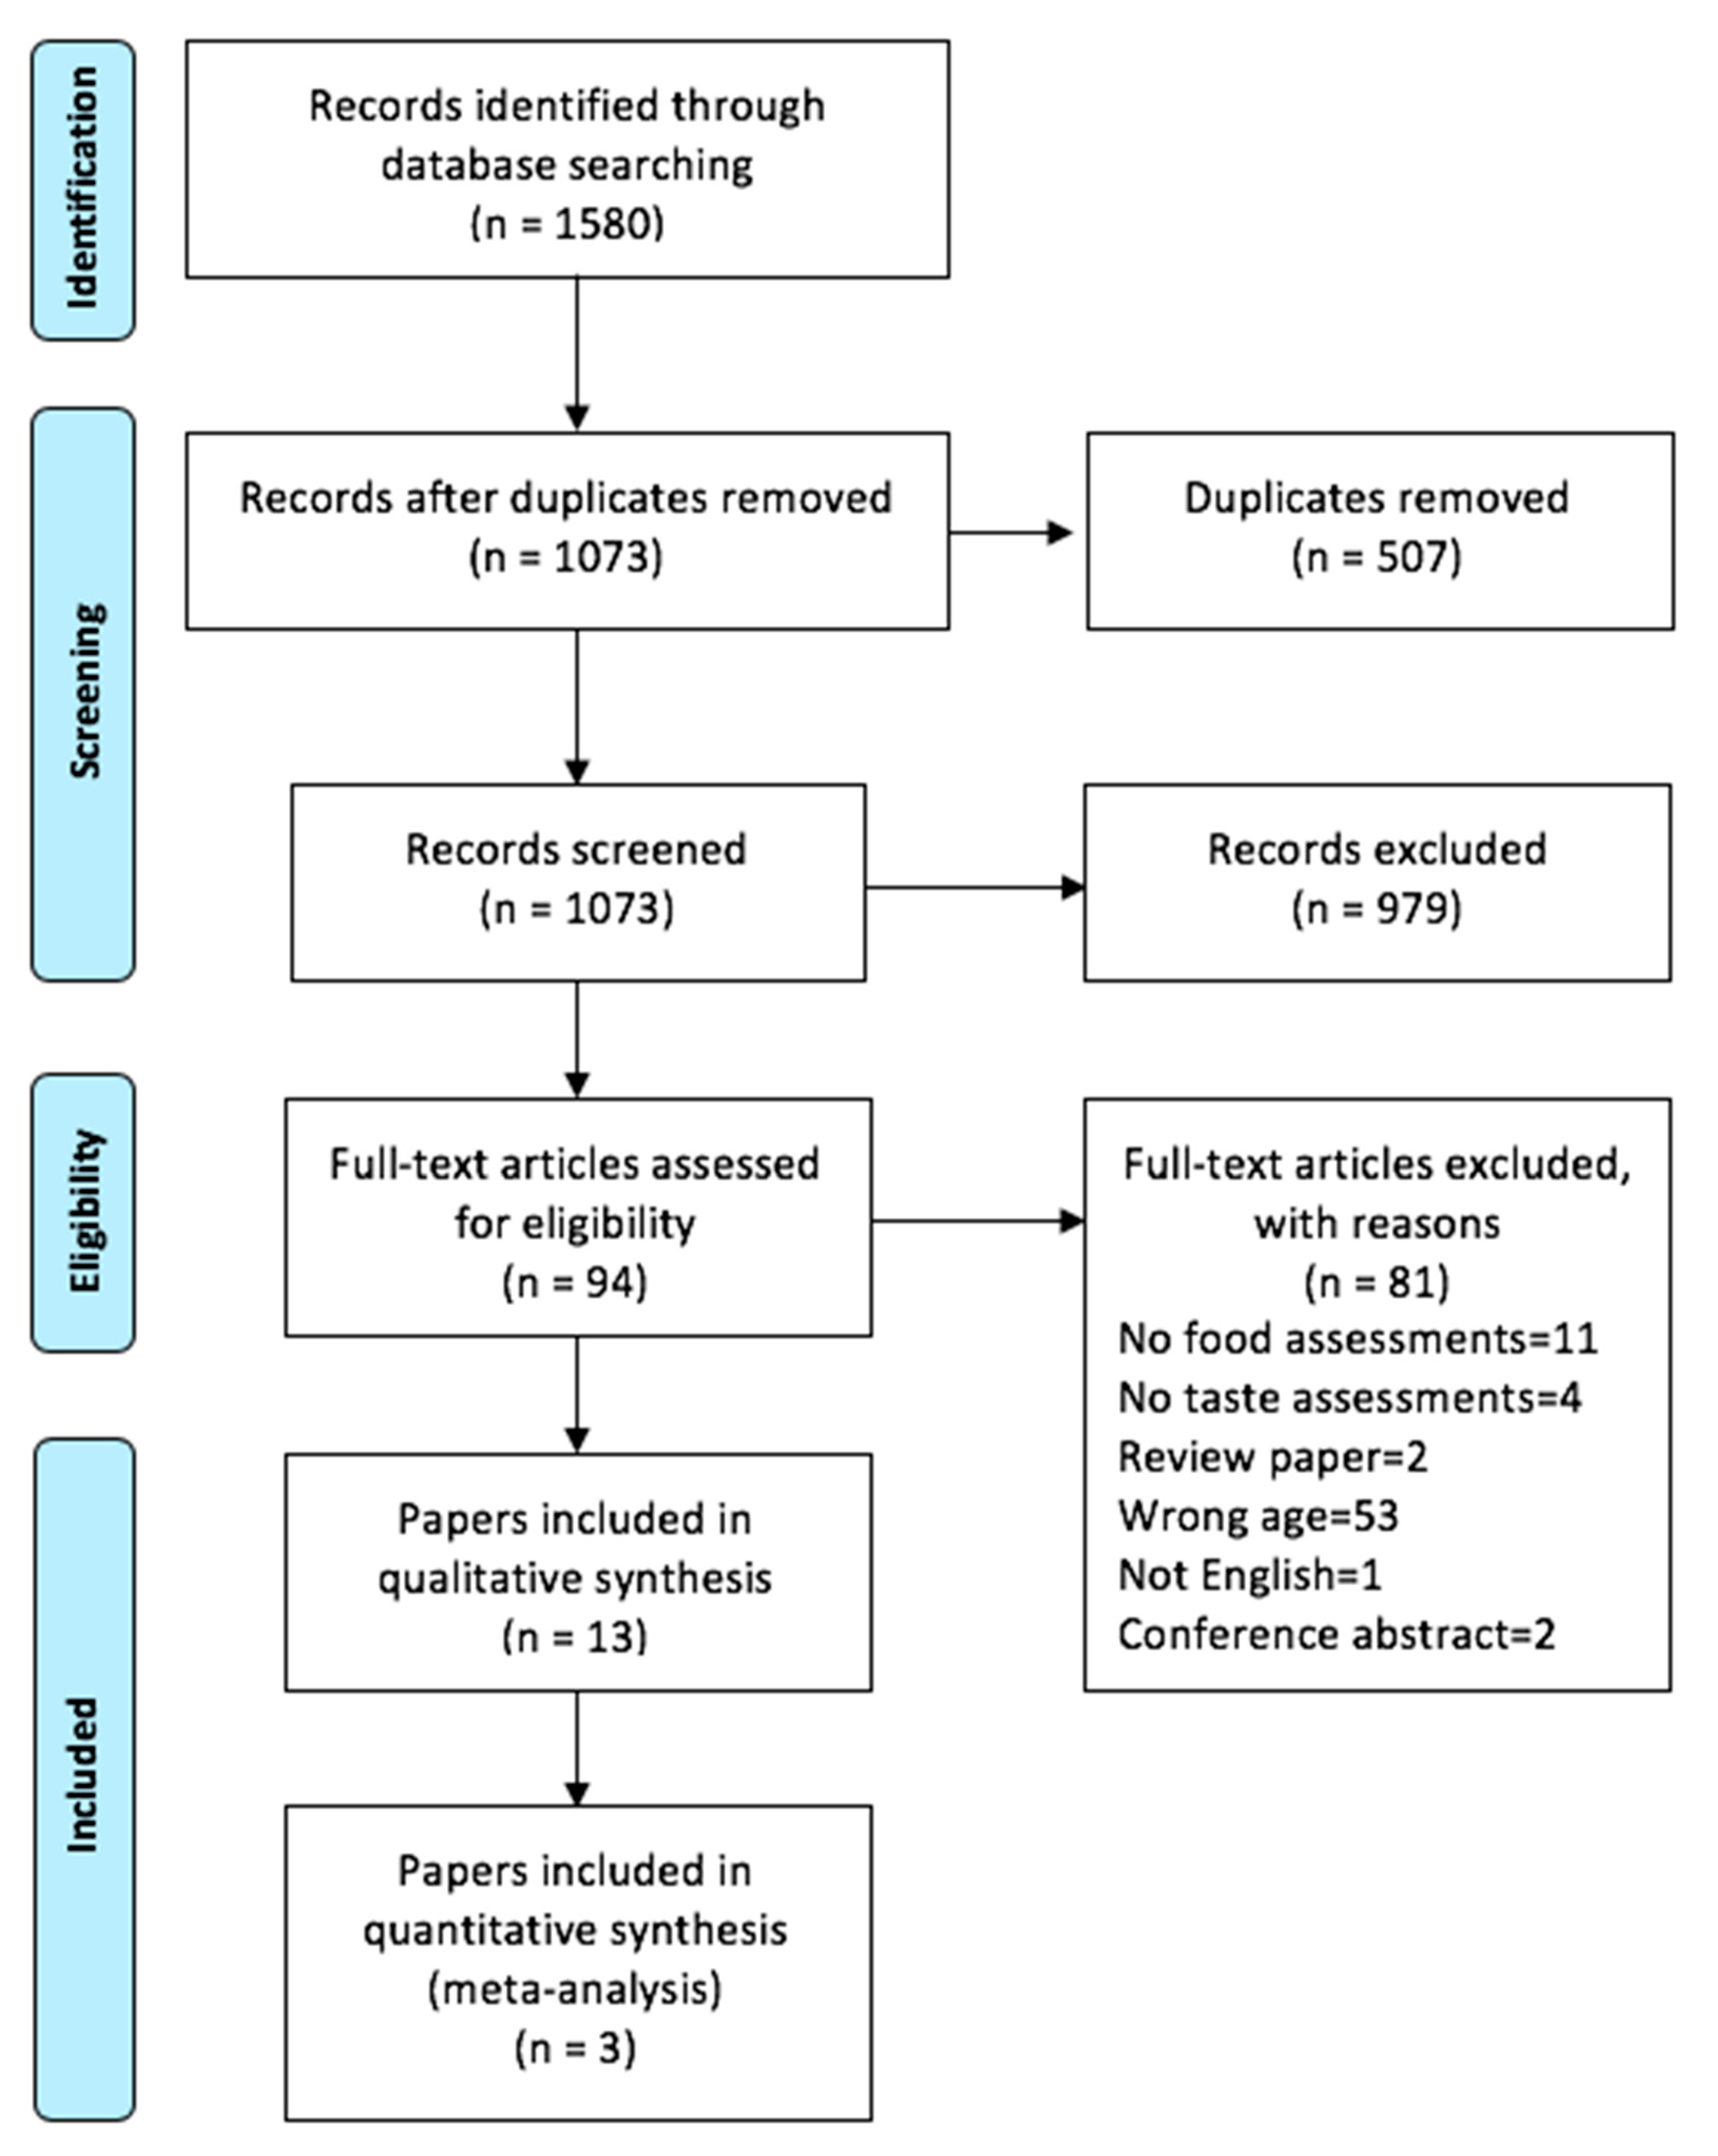
3.1. Systematic Search
3.2. Study Characteristics
3.3. Qualitative Summary of Findings
3.3.1. Bitter
3.3.2. Sweet
3.3.3. Fatty
3.3.4. Other Tastes
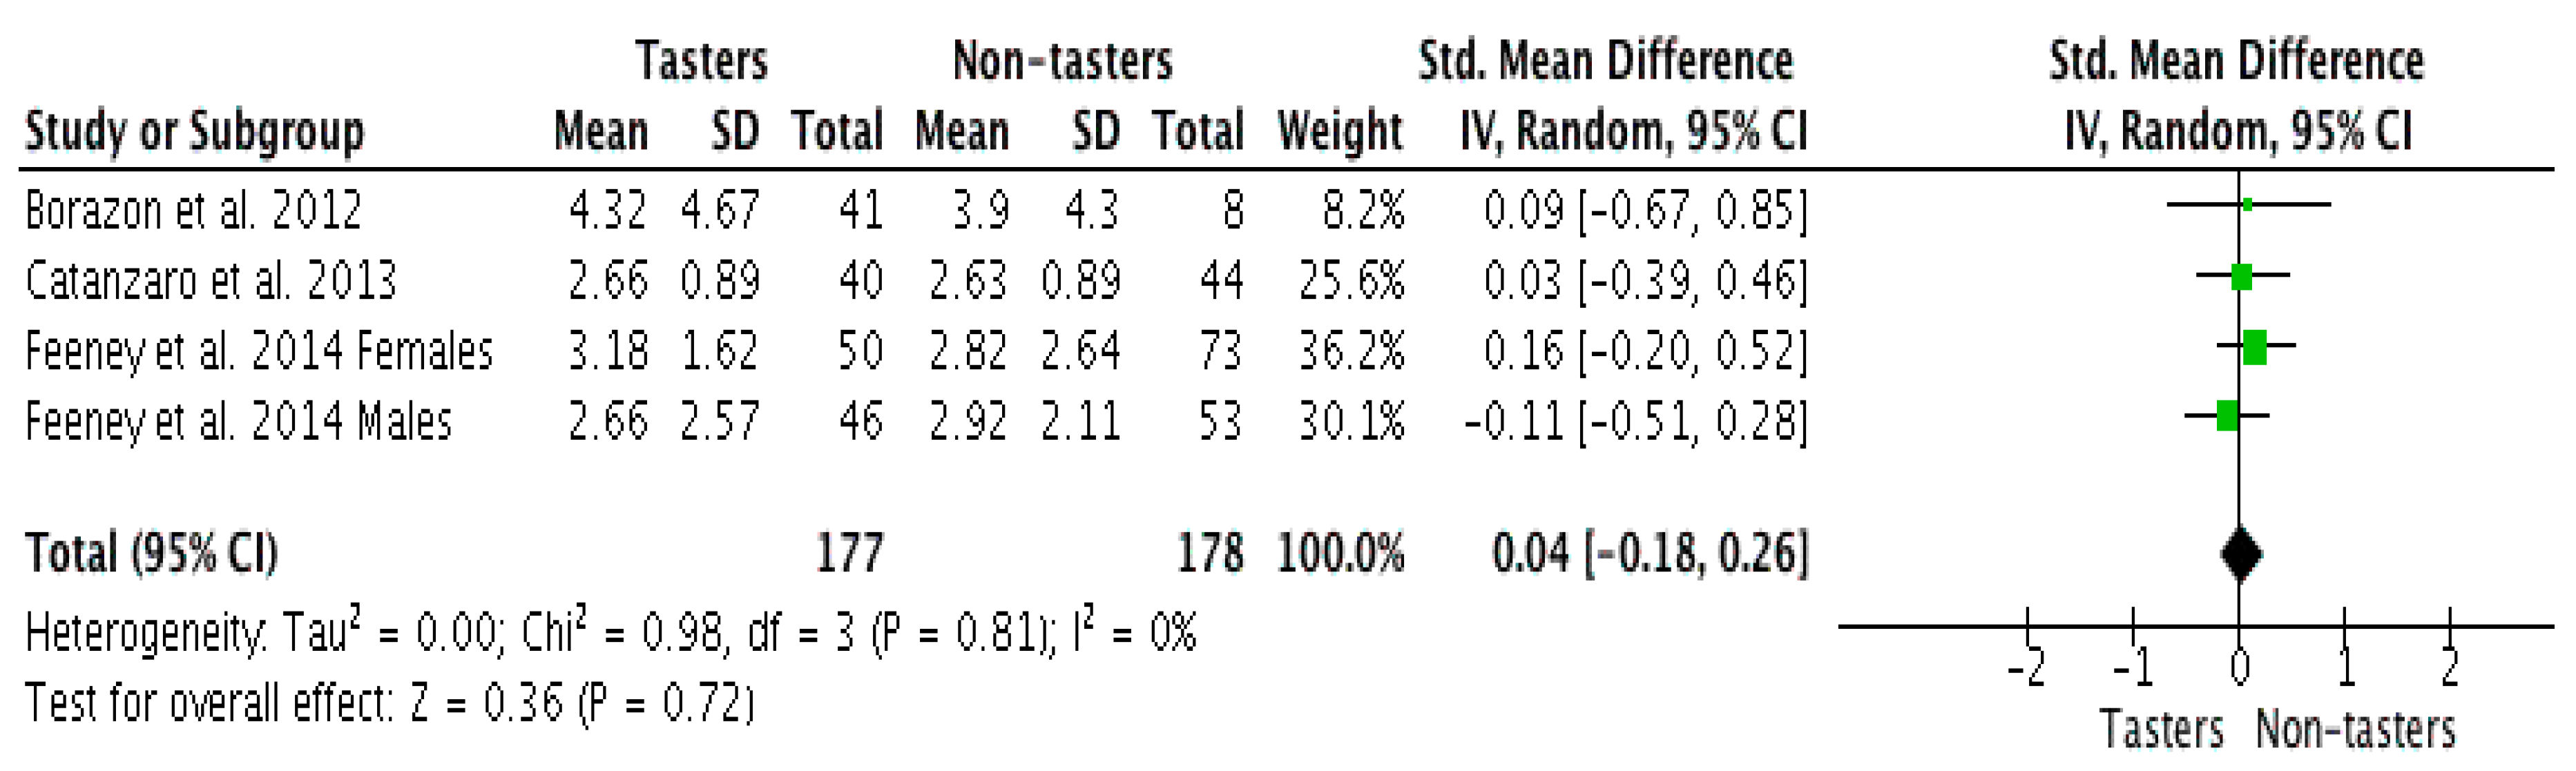
3.4. Meta-Analysis
4. Discussion
5. Conclusions
Supplementary Materials
Author Contributions
Funding
Conflicts of Interest
References
- Chamoun, E.; Mutch, D.M.; Allen-Vercoe, E.; Buchholz, A.C.; Duncan, A.M.; Spriet, L.L.; Haines, J.; Ma, D.W.L.; Guelph Family Health Study. A review of the associations between single nucleotide polymorphisms in taste receptors, eating behaviors, and health. Crit. Rev. Food Sci. Nutr. 2018, 58, 194–207. [Google Scholar] [CrossRef]
- Barragan, R.; Coltell, O.; Portoles, O.; Asensio, E.M.; Sorli, J.V.; Ortega-Azorin, C.; Gonzalez, J.I.; Saiz, C.; Fernandez-Carrion, R.; Ordovas, J.M.; et al. Bitter, sweet, salty, sour and umami taste perception decreases with age: Sex-specific analysis, modulation by genetic variants and taste-preference associations in 18 to 80 year-old subjects. Nutrients 2018, 10, 1539. [Google Scholar] [CrossRef] [PubMed]
- Feeney, E.; O’Brien, S.; Scannell, A.; Markey, A.; Gibney, E.R. Genetic variation in taste perception: Does it have a role in healthy eating? Proc. Nutr. Soc. 2011, 70, 135–143. [Google Scholar] [CrossRef]
- Tepper, B.J.; Banni, S.; Melis, M.; Crnjar, R.; Barbarossa, I.T. Genetic Sensitivity to the bitter taste of 6-n-propylthiouracil (PROP) and its association with physiological mechanisms controlling body mass index (BMI). Nutrients 2014, 6, 3363–3381. [Google Scholar] [CrossRef]
- Roura, E.; Aldayyani, A.; Thavaraj, P.; Prakash, S.; Greenway, D.; Thomas, W.G.; Meyerhof, W.; Roudnitzky, N.; Foster, S.R. Variability in human bitter taste sensitivity to chemically diverse compounds can be accounted for by differential TAS2R activation. Chem. Senses 2015, 40, 427–435. [Google Scholar] [CrossRef] [PubMed]
- Tornwall, O.; Silventoinen, K.; Keskitalo-Vuokko, K.; Perola, M.; Kaprio, J.; Tuorila, H. Genetic contribution to sour taste preference. Appetite 2012, 58, 687–694. [Google Scholar] [CrossRef] [PubMed]
- Yeomans, M.R.; Tepper, B.J.; Rietzschel, J.; Prescott, J. Human hedonic responses to sweetness: Role of taste genetics and anatomy. Physiol. Behav. 2007, 91, 264–273. [Google Scholar] [CrossRef] [PubMed]
- Noh, H.; Paik, H.Y.; Kim, J.; Chung, J. Salty taste acuity is affected by the joint action of alphaENaC A663T gene polymorphism and available zinc intake in young women. Nutrients 2013, 5, 4950–4963. [Google Scholar] [CrossRef]
- Tinoco-Mar, B.A.; Valdes Miramontes, E.H.; Virgen-Carrillo, C.A.; Sanchez-Murguia, T.P. Umami taste preference (Monosodic glutamate) in Mexican scholar children. Ann. Nutr. Metab. 2017, 71 (Suppl. S2), 1298–1299. [Google Scholar]
- Shen, Y.C.; Kennedy, O.B.; Methven, L. Exploring the effects of genotypical and phenotypical variations in bitter taste sensitivity on perception, liking and intake of brassica vegetables in the UK. Food Qual. Prefer. 2016, 50, 71–81. [Google Scholar] [CrossRef]
- Keller, K.L.; Liang, L.C.; Sakimura, J.; May, D.; Van Belle, C.; Breen, C.; Driggin, E.; Tepper, B.J.; Lanzano, P.C.; Deng, L.; et al. Common variants in the CD36 gene are associated with oral fat perception, fat preferences, and obesity in African Americans. Obesity 2012, 20, 1066–1073. [Google Scholar] [CrossRef]
- Negri, R.; Di Feola, M.; Di Domenico, S.; Scala, M.G.; Artesi, G.; Valente, S.; Smarrazzo, A.; Turco, F.; Morini, G.; Greco, L. Taste perception and food choices. J. Pediatric Gastroenterol. Nutr. 2012, 54, 624–629. [Google Scholar] [CrossRef] [PubMed]
- Podzimek, S.; Duskova, M.; Broukal, Z.; Racz, B.; Starka, L.; Duskova, J. The evolution of taste and perinatal programming of taste preferences. Physiol. Res. 2018, 67, S421–S429. [Google Scholar] [CrossRef]
- Iatridi, V.; Hayes, J.E.; Yeomans, M.R. Quantifying sweet taste liker phenotypes: Time for some consistency in the classification criteria. Nutrients 2019, 11, 129. [Google Scholar] [CrossRef]
- Laaksonen, O.; Ahola, J.; Sandell, M. Explaining and predicting individually experienced liking of berry fractions by the hTAS2R38 taste receptor genotype. Appetite 2013, 61, 85–96. [Google Scholar] [CrossRef] [PubMed]
- Eny, K.M.; Wolever, T.M.S.; Corey, P.N.; El-Sohemy, A. Genetic variation in TAS1R2 (Ile191Val) is associated with consumption of sugars in overweight and obese individuals in 2 distinct populations. Am. J. Clin. Nutr. 2010, 92, 1501–1510. [Google Scholar] [CrossRef] [PubMed]
- Blakemore, S.J.; Burnett, S.; Dahl, R.E. The role of puberty in the developing adolescent brain. Hum. Brain Mapp. 2010, 31, 926–933. [Google Scholar] [CrossRef] [PubMed]
- World Health Organization. Adolescent Development. Available online: https://www.who.int/maternal_child_adolescent/topics/adolescence/development/en/ (accessed on 15 September 2019).
- Washi, S.A.; Ageib, M.B. Poor diet quality and food habits are related to impaired nutritional status in 13- to 18-year-old adolescents in Jeddah. Nutr. Res. 2010, 30, 527–534. [Google Scholar] [CrossRef]
- Al Faris, N.A.; Al-Tamimi, J.Z.; Al-Jobair, M.O.; Al-Shwaiyat, N.M. Trends of fast food consumption among adolescent and young adult Saudi girls living in Riyadh. Food Nutr. Res. 2015, 59, 26488. [Google Scholar] [CrossRef]
- Beck, A.L.; Iturralde, E.M.; Haya-Fisher, J.; Kim, S.; Keeton, V.; Fernandez, A. Barriers and facilitators to healthy eating among low-income Latino adolescents. Appetite 2019, 138, 215–222. [Google Scholar] [CrossRef]
- Vaitkeviciute, R.; Ball, L.E.; Harris, N. The relationship between food literacy and dietary intake in adolescents: A systematic review. Public Health Nutr. 2014, 18, 649–658. [Google Scholar] [CrossRef] [PubMed]
- Albar, S.A.; Alwan, N.A.; Evans, C.E.L.; Cade, J.E. Is there an association between food portion size and BMI among British adolescents? Br. J. Nutr. 2014, 112, 841–851. [Google Scholar] [CrossRef]
- De Graaf, C.; Zandstra, E.H. Sweetness intensity and pleasantness in children, adolescents, and adults. Physiol. Behav. 1999, 67, 513–520. [Google Scholar] [CrossRef]
- Chamoun, E.; Liu, A.A.S.; Duizer, L.M.; Darlington, G.; Duncan, A.M.; Haines, J.; Ma, D.W.L. Taste sensitivity and taste preference measures are correlated in healthy young adults. Chem. Senses 2018, 44, 129–134. [Google Scholar] [CrossRef] [PubMed]
- Basson, M.D.; Bartoshuk, L.M.; Dichello, S.Z.; Panzini, L.; Weiffenbach, J.M.; Duffy, V.B. Association between 6-n-propylthiouracil (PROP) bitterness and colonic neoplasms. Dig. Dis. Sci. 2005, 50, 483–489. [Google Scholar] [CrossRef]
- World Obesity Federation. Prevalence of Obesity. Available online: https://www.worldobesity.org/about/about-obesity/prevalence-of-obesity (accessed on 15 September 2019).
- Bawajeeh, A.; Cade, J.; Evans, C.; Zulyniak, M.; Albar, S. The Effect of Genetics of Taste on Food Preference and Intake in Adolescence. Available online: https://www.crd.york.ac.uk/prospero/display_record.php?ID=CRD42019134088 (accessed on 3 July 2020).
- World Health Organization. Adolescent Health. Available online: https://www.who.int/health-topics/adolescent-health/#tab=tab_1 (accessed on 14 June 2020).
- Dinehart, M.E.; Hayes, J.E.; Bartoshuk, L.M.; Lanier, S.L.; Duffy, V.B. Bitter taste markers explain variability in vegetable sweetness, bitterness, and intake. Physiol. Behav. 2006, 87, 304–313. [Google Scholar] [CrossRef] [PubMed]
- Keller, K.L.; Adise, S. Variation in the ability to taste bitter thiourea compounds: Implications for food acceptance, dietary intake, and obesity risk in children. Annu. Rev. Nutr. 2016, 36, 157–182. [Google Scholar] [CrossRef]
- Leite, I.C.R.; Dos Santos, J.C., Jr.; De Sousa, C.C.S.; Lima, A.V.; Miranda-Vilela, A.L. Recognition of phenylthiocarbamide (PTC) in taste test is related to blood group B phenotype, females, and risk of developing food allergy: A cross-sectional Brazilian-based study. Nutr. Res. 2018, 52, 22–38. [Google Scholar] [CrossRef]
- Tepper, B.J. Nutritional implications of genetic taste variation: The role of PROP sensitivity and other taste phenotypes. Annu. Rev. Nutr. 2008, 28, 367–388. [Google Scholar] [CrossRef]
- Ungprasert, P.; Srivali, N.; Kittanamongkolchai, W. Risk of coronary artery disease in patients with ankylosing spondylitis: A systematic review and meta-analysis. Ann. Transl. Med. 2015, 3, 51. [Google Scholar] [CrossRef]
- Wells, G.; Shea, B.; O’Connell, D.; Peterson, J.; Welch, V.; Losos, M. The Newcastle-Ottawa Scale (NOS) for Assessing the Quality of Nonrandomised Studies in Meta-Analyses; Department of Epidemiology and Medicine, University of Ottowa: Ontario, ON, Canada, 2000. [Google Scholar]
- Madhavan, A.; Lagorio, L.A.; Crary, M.A.; Dahl, W.J.; Carnaby, G.D. Prevalence of and risk factors for dysphagia in the community dwelling elderly: A systematic review. J. Nutr. Health Aging 2016, 20, 806–815. [Google Scholar] [CrossRef] [PubMed]
- Stata Statistical Software: Release 15; StataCorp: College Station, TX, USA, 2017.
- Review Manager (RevMan) [Computer Program]; Version 5.3; The Nordic Cochrane Centre, T.C.C.: Copenhagen, Denmark, 2014.
- Cochrane Handbook for Systematic Reviews of Interventions; Version 5.1.0 ed.; Higgins, J.P.T., Green, S., Eds.; The Cochrane Collaboration: London, UK, 2011. [Google Scholar]
- Borazon, E.Q.; Villarino, B.J.; Magbuhat, R.M.T.; Sabandal, M.L. Relationship of PROP (6-n-propylthiouracil) taster status with body mass index, food preferences, and consumption of Filipino adolescents. Food Res. Int. 2012, 47, 229–235. [Google Scholar] [CrossRef]
- Catanzaro, D.; Chesbro, E.C.; Velkey, A.J. Relationship between food preferences and PROP taster status of college students. Appetite 2013, 68, 124–131. [Google Scholar] [CrossRef] [PubMed]
- Coldwell, S.E.; Oswald, T.K.; Reed, D.R. A marker of growth differs between adolescents with high vs. low sugar preference. Physiol. Behav. 2009, 96, 574–580. [Google Scholar] [CrossRef]
- Feeney, E.L.; O’Brien, S.A.; Scannell, A.G.M.; Markey, A.; Gibney, E.R. Genetic and environmental influences on liking and reported intakes of vegetables in Irish children. Food Qual. Prefer. 2014, 32, 253–263. [Google Scholar] [CrossRef]
- Feeney, E.L.; O’Brien, S.A.; Scannell, A.G.; Markey, A.; Gibney, E.R. Suprathreshold measures of taste perception in children—Association with dietary quality and body weight. Appetite 2017, 113, 116–123. [Google Scholar] [CrossRef]
- Inoue, H.; Yamakawa-Kobayashi, K.; Suzuki, Y.; Nakano, T.; Hayashi, H.; Kuwano, T. A case study on the association of variation of bitter-taste receptor gene TAS2R38 with the height, weight and energy intake in japanese female college students. J. Nutr. Sci. Vitam. 2013, 59, 16–21. [Google Scholar] [CrossRef]
- Joseph, P.V.; Reed, D.R.; Mennella, J.A. Individual differences among children in sucrose detection thresholds: Relationship with age, gender, and bitter taste genotype. Nurs. Res. 2016, 65, 3–12. [Google Scholar] [CrossRef]
- Mennella, J.A.; Colquhoun, T.A.; Bobowski, N.K.; Olmstead, J.W.; Bartoshuk, L.; Clark, D. Farm to sensory lab: Taste of blueberry fruit by children and adults. J. Food Sci. 2017, 82, 1713–1719. [Google Scholar] [CrossRef]
- O’Brien, S.A.; Feeney, E.L.; Scannell, A.G.; Markey, A.; Gibney, E.R. Bitter taste perception and dietary intake patterns in irish children. J. Nutr. Nutr. 2013, 6, 43–58. [Google Scholar] [CrossRef] [PubMed]
- Oftedal, K.N.; Tepper, B.J. Influence of the PROP bitter taste phenotype and eating attitudes on energy intake and weight status in pre-adolescents: A 6-year follow-up study. Physiol. Behav. 2013, 118, 103–111. [Google Scholar] [CrossRef] [PubMed]
- Pioltine, M.B.; De Melo, M.E.; Santos, A.; Machado, A.D.; Fernandes, A.E.; Fujiwara, C.T.; Cercato, C.; Mancini, M.C. Genetic variation in CD36 is associated with decreased fat and sugar intake in obese children and adolescents. J. Nutr. Nutr. 2017, 9, 300–305. [Google Scholar] [CrossRef]
- Pioltine, M.B.; De Melo, M.E.; Santos, A.S.; Machado, A.D.; Fernandes, A.E.; Fujiwara, C.T.; Cercato, C.; Mancini, M.C. Genetic variations in sweet taste receptor gene are related to chocolate powder and dietary fiber intake in obese children and adolescents. J. Pers. Med. 2018, 8, 7. [Google Scholar] [CrossRef] [PubMed]
- Sharma, K.; Kaur, G.K. PTC bitter taste genetic polymorphism, food choices, physical growth in body height and body fat related traits among adolescent girls from Kangra Valley, Himachal Pradesh (India). Ann. Biol. 2014, 41, 29–39. [Google Scholar] [CrossRef] [PubMed]
- Mattes, R.D. Fat taste in humans: Is it a primary? In Fat Detection: Taste, Texture, and Post Ingestive Effects; Montmayeur, J.-P., Le Coutre, J., Eds.; Taylor & Francis: Oxfordshire UK, 2010. [Google Scholar]
- Al-Hazzaa, H.M.; Abahussain, N.A.; Al-Sobayel, H.I.; Qahwaji, D.M.; Musaiger, A.O. Physical activity, sedentary behaviors and dietary habits among Saudi adolescents relative to age, gender and region. Int. J. Behav. Nutr. Phys. Act. 2011, 8, 140. [Google Scholar] [CrossRef]
- Al Muammar, M.; El Shafie, M. Association between dietary habits and body mass index of adolescent females in intermediate schools in Riyadh, Saudi Arabia. East. Mediterr. Health J. 2014, 20, 39–45. [Google Scholar] [CrossRef] [PubMed]
- Ashi, H.; Campus, G.; Forslund, H.; Hafiz, W.; Ahmed, N.; Lingstrom, P. The Influence of sweet taste perception on dietary intake in relation to dental caries and bmi in saudi arabian schoolchildren. Int. J. Dent. 2017, 2017, 4262053. [Google Scholar] [CrossRef]
- Smith, A.D.; Fildes, A.; Cooke, L.; Herle, M.; Shakeshaft, N.; Plomin, R.; Llewellyn, C. Genetic and environmental influences on food preferences in adolescence. Am. J. Clin. Nutr. 2016, 104, 446–453. [Google Scholar] [CrossRef]
- Elbel, B.; Gyamfi, J.; Kersh, R. Child and adolescent fast-food choice and the influence of calorie labeling: A natural experiment. Int. J. Obes. 2011, 35, 493. [Google Scholar] [CrossRef]
- Ensaff, H.; Coan, S.; Sahota, P.; Braybrook, D.; Akter, H.; McLeod, H. Adolescents’ food choice and the place of plant-based foods. Nutrients 2015, 7, 4619–4637. [Google Scholar] [CrossRef]
- Hallstrom, L.; Vereecken, C.A.; Ruiz, J.R.; Patterson, E.; Gilbert, C.C.; Catasta, G.; Diaz, L.E.; Gomez-Martinez, S.; Gross, M.G.; Gottrand, F.; et al. Breakfast habits and factors influencing food choices at breakfast in relation to socio-demographic and family factors among European adolescents. The HELENA study. Appetite 2011, 56, 649–657. [Google Scholar] [CrossRef]
- Beck, T.K.; Jensen, S.; Bjoern, G.K.; Kidmose, U. The masking effect of sucrose on perception of bitter compounds in brassica vegetables. J. Sens. Stud. 2014, 29, 190–200. [Google Scholar] [CrossRef]
- Drewnowski, A.; Gomez-Carneros, C. Bitter taste, phytonutrients, and the consumer: A review. Am. J. Clin. Nutr. 2000, 72, 1424–1435. [Google Scholar] [CrossRef]
- Keast, R.S.J.; Breslin, P.A.S. An overview of binary taste–taste interactions. Food Qual. Prefer. 2003, 14, 111–124. [Google Scholar] [CrossRef]
- Van Langeveld, A.W.B.; Teo, P.S.; De Vries, J.H.M.; Feskens, E.J.M.; De Graaf, C.; Mars, M. Dietary taste patterns by sex and weight status in the Netherlands. Br. J. Nutr. 2018, 119, 1195–1206. [Google Scholar] [CrossRef] [PubMed]
- Armstrong, C.L.H. 6-N-propylthiouracil: Orosensory influence on taste, diet, and chronic disease risk. Diss. Abstr. Int. Sect. B Sci. Eng. 2008, 69, 2240. [Google Scholar]
- Turner-McGrievy, G.; Tate, D.F.; Moore, D.; Popkin, B. Taking the bitter with the sweet: Relationship of supertasting and sweet preference with metabolic syndrome and dietary intake. J. Food Sci. 2013, 78, S336–S342. [Google Scholar] [CrossRef] [PubMed]
- Calò, C.; Padiglia, A.; Zonza, A.; Corrias, L.; Contu, P.; Tepper, B.J.; Barbarossa, I.T. Polymorphisms in TAS2R38 and the taste bud trophic factor, gustin gene co-operate in modulating PROP taste phenotype. Physiol. Behav. 2011, 104, 1065–1071. [Google Scholar] [CrossRef]
- Mennella, J.A.; Pepino, M.Y.; Reed, D.R. Genetic and environmental determinants of bitter perception and sweet preferences. Pediatrics 2005, 115, e216–e222. [Google Scholar] [CrossRef]
- Wardle, J.; Cooke, L. Genetic and environmental determinants of children’s food preferences. Br. J. Nutr. 2008, 99 (Suppl. S1), S15–S21. [Google Scholar] [CrossRef]
- Williams, J.A.; Bartoshuk, L.M.; Fillingim, R.B.; Dotson, C.D. Exploring ethnic differences in taste perception. Chem. Senses 2016, 41, 449–456. [Google Scholar] [CrossRef] [PubMed]


| Criteria/Studies | [40] | [41] | [42] | [43] | [44] | [45] | [46] | [47] | [48] | [49] | [50] | [51] | [52] |
|---|---|---|---|---|---|---|---|---|---|---|---|---|---|
| Study Design | Cross-Sectional | Cross-Sectional | Cross-Sectional | Cross-Sectional | Cross-Sectional | Cross-Sectional | Cross-Sectional | Cross-Sectional | Cross-Sectional | Follow-Up | Cross-Sectional | Cross-Sectional | Cross-Sectional |
| Representativeness1 | 1 | 0 | 1 | 1 | 1 | 0 | 1 | 1 | 1 | 1 | 1 | 1 | 0 |
| Sample Size 2 | 1 | 0 | 1 | 1 | 1 | 0 | 1 | 0 | 1 | 0 | 0 | 1 | 1 |
| Non-Respondents 3 | 0 | 1 | 1 | 1 | 1 | 0 | 0 | 0 | 1 | 1 | 0 | 1 | 0 |
| Exposure 4 | 1 | 1 | 0 | 1 | 1 | 1 | 1 | 0 | 1 | 1 | 1 | 1 | 1 |
| Comparability 5 | 1 | 0 | 1 | 1 | 1 | 1 | 1 | 1 | 1 | 1 | 1 | 1 | 1 |
| Outcome 6 | 1 | 1 | 1 | 1 | 1 | 2 | 2 | 0 | 1 | 2 | 1 | 1 | 1 |
| Statistical Test 7 | 0 | 1 | 1 | 1 | 1 | 1 | 1 | 1 | 1 | 1 | 1 | 1 | 1 |
| Total Scores | 5 | 4 | 6 | 7 | 7 | 5 | 7 | 3 | 7 | 7 | 5 | 7 | 5 |
| Study | Study Design/Year | Location/Ethnicity | Population characteristics | Study Measurements | Study Outcomes | |||
|---|---|---|---|---|---|---|---|---|
| Sample | Age (Years) | Taste Studied | Taste Test | Dietary Assessments | ||||
| Phenotype Taste Test | ||||||||
| * [40] | Cross-sectional 2012 | Philippine/Filipino | 120 (60 F, 60 M) | 13–17 (Mean = 15) | Bitter |
|
|
|
| * [41] | Cross-sectional 2013 | South-eastern USA/Ethnicity NR | 139 (76 F, 48 M) (15 NR) | 18–37 (Mean = 19.7) | Bitter |
|
|
|
| [52] | Cross-sectional 2014 | India/Indian | 210 F | 11–18 | Bitter |
|
|
|
| [42] | Cross-sectional 2009 | USA/2 Alaskan Native, 4 American Indian, 14 Asian/Pacific Islander, 31 Black, Non-Hispanic, 11 Hispanic, 73 White, Non-Hispanic, 8 others | 143 (65 F, 78 M) | 11–15 (Mean = 13.5) | Sweet |
|
|
|
| [47] | Cross-sectional 2017 | USA/diverse ethnicity | 49 (28 F, 21 M) | 6–16 (Mean = 11.9) | Sweet |
|
|
|
| Genotype taste test | ||||||||
| [45] | Cross-sectional 2013 | Japan/Japanese | 87 F | 18–22 | Bitter |
|
|
|
| [50] | Cross-sectional 2017 | Brazil/Brazilian | 580 | 7–18 (Mean = 12.2) obese (Mean = 10.4) normal weight | Fat |
|
|
|
| [51] | Cross-sectional 2018 | Brazil/Brazilian | 648 (303 F, 345 M) | 7–18 (Mean = 12.2) obese and (Mean = 10.4) normal weight | Sweet |
|
|
|
| Phenotypes and genotypes taste tests | ||||||||
| * [43] | Cross-sectional 2014 | Dublin/White Caucasian | 525 (300 F, 225 M) | 7–13 (Mean = 10.39) | Bitter Sweet |
|
|
|
| [44] | Cross-sectional 2017 | Dublin/White Caucasian | 525 (300 F, 225 M) | 7–13 (Mean = 10.25) | Bitter Sweet |
|
|
|
| [46] | Cross-sectional 2016 | USA/136 Black, 46 White Caucasian, 2 Asians, 51 more than one ethnicity, 219 non-Hispanic | 235 (124 F, 111 M) | 7–14 (Mean = 10.4) | Bitter Sweet |
|
|
|
| [48] | Cross-sectional 2013 | Dublin/White Caucasian | 525 (300 F, 225 M) | 7–13 (Mean = 10.25) | Bitter |
|
|
|
| [49] | 6-year Follow-up 2013 | USA 86% white Caucasian | 73 (28 F, 45 M) | 7–13 (Mean = 10.3) | Bitter |
| 3 24-h recalls
|
|
© 2020 by the authors. Licensee MDPI, Basel, Switzerland. This article is an open access article distributed under the terms and conditions of the Creative Commons Attribution (CC BY) license (http://creativecommons.org/licenses/by/4.0/).
Share and Cite
Bawajeeh, A.O.; Albar, S.A.; Zhang, H.; Zulyniak, M.A.; Evans, C.E.L.; Cade, J.E. Impact of Taste on Food Choices in Adolescence—Systematic Review and Meta-Analysis. Nutrients 2020, 12, 1985. https://doi.org/10.3390/nu12071985
Bawajeeh AO, Albar SA, Zhang H, Zulyniak MA, Evans CEL, Cade JE. Impact of Taste on Food Choices in Adolescence—Systematic Review and Meta-Analysis. Nutrients. 2020; 12(7):1985. https://doi.org/10.3390/nu12071985
Chicago/Turabian StyleBawajeeh, Areej O., Salwa A. Albar, Huifeng Zhang, Michael A. Zulyniak, Charlotte E. L. Evans, and Janet E. Cade. 2020. "Impact of Taste on Food Choices in Adolescence—Systematic Review and Meta-Analysis" Nutrients 12, no. 7: 1985. https://doi.org/10.3390/nu12071985
APA StyleBawajeeh, A. O., Albar, S. A., Zhang, H., Zulyniak, M. A., Evans, C. E. L., & Cade, J. E. (2020). Impact of Taste on Food Choices in Adolescence—Systematic Review and Meta-Analysis. Nutrients, 12(7), 1985. https://doi.org/10.3390/nu12071985