Article

The Effect of Vitamin D3 Supplementation on Physical Capacity among Active College-Aged Males

by
Sylwester Kujach
1,*,†,
Dariusz Lyzwinski
2,†,
Maciej Chroboczek
1,
Dawid Bialowas
1,
Jedrzej Antosiewicz
3 and
Radoslaw Laskowski
1
1
Faculty of Physical Education, Department of Physiology, Gdansk University of Physical Education and Sport, Gorskiego 1, 80-336 Gdansk, Poland
2
Department of Sport and Physical Education, Medical University of Gdansk, M. Skłodowskiej-Curie 3a, 80-210 Gdansk, Poland
3
Faculty of Health Sciences, Department of Bioenergetics and Physiology of Exercise, Medical University of Gdansk, Debinki 1, 80-211 Gdansk, Poland
*
Author to whom correspondence should be addressed.
S.K. and D.L. contributed equally to this work.
Nutrients 2020, 12(7), 1936; https://doi.org/10.3390/nu12071936
Submission received: 8 May 2020 / Revised: 25 June 2020 / Accepted: 27 June 2020 / Published: 30 June 2020
(This article belongs to the Special Issue Nutrition Strategies for Improved Anaerobic Performance)

Abstract

:
Vitamin D3 supplementation can affect strength and power; however, the effect on both aerobic and anaerobic performance remains unclear. Here, we investigate the effects of eight weeks of a high dose of vitamin D3 supplementation and its impact on circulating 25-hydroxyvitamin D (25-OH-D3) concentrations and selected indicators of physical capacity. Subjects (n = 28, age 21.1 ± 1.6) were divided into two groups: supplemented (SUP), which was given 6000 IU of vitamin D3 daily for eight weeks; and placebo group (PLA). Serum 25-OH-D3 concentrations were determined in pre- and post-intervention. Aerobic ( V . O2max test) and anaerobic (Wingate Anaerobic Test) capacity were determined before and after the supplementation. The mean baseline concentration of 25-OH-D3 was recognized as deficient (20 ng/mL) and significantly increased over time in the supplemented group (p < 0.01, η2 = 0.86), whilst it remained unchanged in the placebo group. Moreover, the supplementation caused a significant improvement in maximal aerobic (p < 0.05, η2 = 0.27) and anaerobic power (p < 0.01, η2 = 0.51) whereas no changes were observed in PLA group. The V . O2max differences were also significant in the supplemented group (p < 0.05). In summary, the changes in aerobic and anaerobic capacity observed in this study were associated with a serum concentration of 25-OH-D3. Our data imply that vitamin D3 supplementation with a dose of 6000 IU daily for eight weeks is sufficient to improve physical capacity and vitamin D3 status.

1. Introduction

Sport and recreational activity-induced adaptation includes changes in skeletal muscle, such as biogenesis of mitochondria, induction of antioxidant enzymes, etc. [1] Exercise also induces changes in other tissues such as the heart, adipose, bones, arteries, and lungs [2]. Interestingly, there is an increasing number of studies demonstrating that exercise-induced adaptation is related to vitamin D status [3,4]. Conversely, several studies indicate that many athletes and non-athletes are vitamin D deficient [4,5]. Vitamin D deficiency is defined as a concentration of 25-OH-D3 lower than 20 ng/mL while optimal concentration is 30–60 ng/mL [6]. Low vitamin D status is a result of sunlight limitations due to geographical location, lifestyle associated with spending most of the time indoors (both during work and in free time) and the so-called Western diet, i.e., a diet poor in natural exogenous sources of vitamin D [6]. Thus, international health organizations recommend 400 to 6000 IU/day vitamin D supplementation, depending on age and health status, so the concentration of 25-OH-D3 reaches the optimal level [6]. It has been reported that athletes and non-trained controls with vitamin D deficiency had smaller hearts compared with vitamin D sufficient subjects [7]. As cardiac output is strictly related to submaximal and maximal oxygen consumption, one can expect that correcting vitamin D deficiency could have a positive impact on V . O2max. Consistently reports demonstrate a positive association between serum 25-OH-D3 and V . O2max [8]. Conversely, no such association was observed in another study [9]. What is more, oxygen uptake is related to pulmonary function [2]. There are limited data as to whether vitamin D status can modify lung function in human subjects especially during exhaustive exercise; however, vitamin D deficiency has been shown to cause deficits in pulmonary function associated with lower lung volume compared to in vitamin D sufficient animals [10,11]. Certainly, the effects of vitamin D on lung function can be related to respiratory muscles [10,12], whereas decreased efficiency of respiratory muscle contraction can significantly limit physical capacity and exercise performance [13].
Vitamin D receptors (VDR) have been found in both nuclei and membranes of the human skeletal muscle cells [14]. Through its receptor, vitamin D3 modifies many processes including inhibition of skeletal muscle atrophy, anti-inflammatory, anti-apoptotic, cell differentiation, and proliferation functions [14,15]. It can also modify skeletal muscle metabolism and antioxidant potential [14,16,17,18,19]. It has been shown that vitamin D status could modulate muscle strength and power measured by maximum number of repetitions (bench press, leg extension, and flexion exercises, or 10–20 s sprint ability) among the elderly, active individuals, and athletes [3,8,20,21].
Conversely, vitamin D deficiency has been associated with impaired muscle action, including muscle weakness [22], sarcopenia development [23], and decreased muscle strength [24]. There is an increasing amount of evidence indicating a positive effect of vitamin D supplementation on physical performance; however, the results from studies analyzing the effect of vitamin D supplementation on aerobic capacity-reflected by V . O2max level are still ambiguous [9,25,26,27].
Exogenous vitamin D supplementation is considered to be an effective approach to improve vitamin D status [28].
Given this evidence, we hypothesized that aerobic and anaerobic physical capacity would improve in response to vitamin D supplementation and be related to improvements in the respiratory function. Here, we investigated whether eight weeks of high dose vitamin D3 supplementation affects circulating 25-OH-D3 concentrations and evaluate if the improved status of vitamin D can be related to changes in physical performance.

2. Materials and Methods

A total of 28 healthy, male subjects participated in the study. Subjects were divided into two groups: supplemented (SUP; n = 14, mean age 21.7 ± 1.8 years) and placebo group (PLA; n = 14, mean age 20.5 ± 1.4 years), based on their physical fitness level ( V . O2max) and anaerobic capacity. Initial physical capacity level as well as vitamin D concentration did not differ between supplemented and placebo groups. All the subjects provided written informed consent before the study procedures. All the procedures were approved by the Bioethical Committee of the Regional Medical Society (KB-3/14). The study was conducted in accordance with the Declaration of Helsinki.

2.1. Study Design

The participants reported to the laboratory on three separate occasions before and after treatment. Before starting the experiment, the subjects were interviewed about eating habits and level of physical activity. Additionally, participants were asked to come to the laboratory for a familiarization, to learn about the testing procedures. Next, they completed blood collection, anthropometric measurements and aerobic ( V . O2max) and anaerobic assessment (Wingate test). After one day the main intervention session followed. All participants performed the same battery of exercise tests before and after the treatment period. Researchers carrying out exercise tests were not informed about the type of treatment. An overview of the experimental protocol is presented in Figure 1. All the physical capacity tests took place in the morning 2 h after light breakfast.

2.2. Anthropometric Measurements

Body mass (BM) and body composition were analyzed using a multi-frequency impedance plethysmograph body composition analyzer (In Body 720, Biospace, Seoul, Korea). The participants had voided their bladders and bowels prior to the analysis. The measurements were performed in the standing position that is recommended in the manuals and the subjects wore only briefs. The analyzer accurately measures body water and body composition, including fat mass, free fat mass, skeletal muscle mass, and soft lean mass [29].

2.3. Supplementation

Subjects from the supplemented group were given 6000 IU of vitamin D3 daily in capsule form (2000 IU per capsule), whereas the placebo group received identical-looking capsules containing sunflower oil. Capsules were administered in a single-blind design. All participants were asked to take three capsules per day in the morning for eight weeks. The supplementation procedure was carried out from January to the beginning of March. The participants were medical university students (not professional athletes) and their physical activity level and diet were determined during the first interview. One month before and during the experiment, participants did not take any vitamin or other supplements. The participants took part in 3 h per week of supervised physical activity and diet did not differ from the accepted nutrition standards. Diets were not strictly standardized but the participants were instructed by the dietitian to maintain their nutritional habits throughout the whole experiment.

2.4. Maximal Oxygen Uptake- V . O2max Test

The participants performed a graded ergometry test on a cycle ergometer (884E Sprint Bike, Monark, Vansbro, Sweden). The ergometer seat height was individually adjusted and the participants were allowed a 5 min warm-up period at an intensity of 1.5 W·kg−1 with a pedaling cadence of 60 rpm. After the warm-up period, work rate was increased by 25 W·min−1 until volitional exhaustion. Breath by breath pulmonary gas exchange was measured using MetaMax 3B (Cortex Biophysik GmbH, Leipzig, Germany). During V . O2max test, maximal lung minute ventilation (VEmax mL·min−1), maximal breath frequency (BFmax 1·min−1), and V . O2max were determined when at least two of the following criteria were met: (1) achievement of 90% of age-predicted peak heart rate (220-age), (2) a rating of perceived exertion scale (RPE) of 19 or 20, and (3) respiratory exchange ratio (RER) exceeded 1.05 [30].

2.5. Anaerobic Capacity Measurement—Wingate Anaerobic Test

After a standard warm-up, all subjects performed a 30 s “all-out” supramaximal test on a mechanically braked cycle ergometer (884E Sprint Bike, Monark, Vansbro, Sweden). The test was initiated from a dead stop with the resistance equal to 75 g·kg body mass−1 (corresponding to 7.5% of an individual’s body mass) preset on the ergometer’s friction belt [31,32]. The obtained results were analyzed for maximal anaerobic power (MAnP) and work output.

2.6. Vitamin D Determination

The assay was performed on the IDS-iSYS Multi-Discipline Automated Analyzer. 10 µL of serum aliquots were automatically pipetted and subjected to a pre-treatment step with NaOH (part of the reagent used for CLIA and ELISA methods) to denature the DBP inside the IDS-iSYS Multi-Discipline Automated Analyzer. This assay is aligned to the NIST SRM 2972. The measurement range of this assay is 7–125 ng/mL (information of the manufacturer). The IDS-iSYS 25(OH)DS Control Set (IS-2730S) was used for quality control [33].

2.7. Statistical Analyses

The statistical analyses were performed using STATISTICA 13.0 software (Statsoft, Tulsa, OK, USA). All data are expressed as mean and standard deviation (SD), or standard error of mean (SEM). The normality of data distribution was established using the Shapiro-Wilk W-test. The level of significance was set as p < 0.05 for all of the analyses. Additionally, a two-way analysis of variance (ANOVA) with repeated measures was used to investigate the significance of differences between groups and time. Significant main effects were further analyzed using the Bonferroni or Tukey post hoc test. The effect size (η2) has also been calculated. The value of η2 has been interpreted as follows: 0.1 a small effect, 0.3 a medium effect, and 0.5 a large effect, as previously described [32]. Changes (delta) in both groups were compared using an independent samples t-test or a U-Mann–Whitney test, according to the data distribution. Correlations between variables were evaluated using the Pearson correlation coefficient.

3. Results

3.1. Subject Characteristics

All subjects completed the study. The anthropometric and physical activity parameters are presented in Table 1. At baseline, there were no significant differences in basic anthropometric characteristics or in aerobic performance between the groups.

3.2. Vitamin D Status

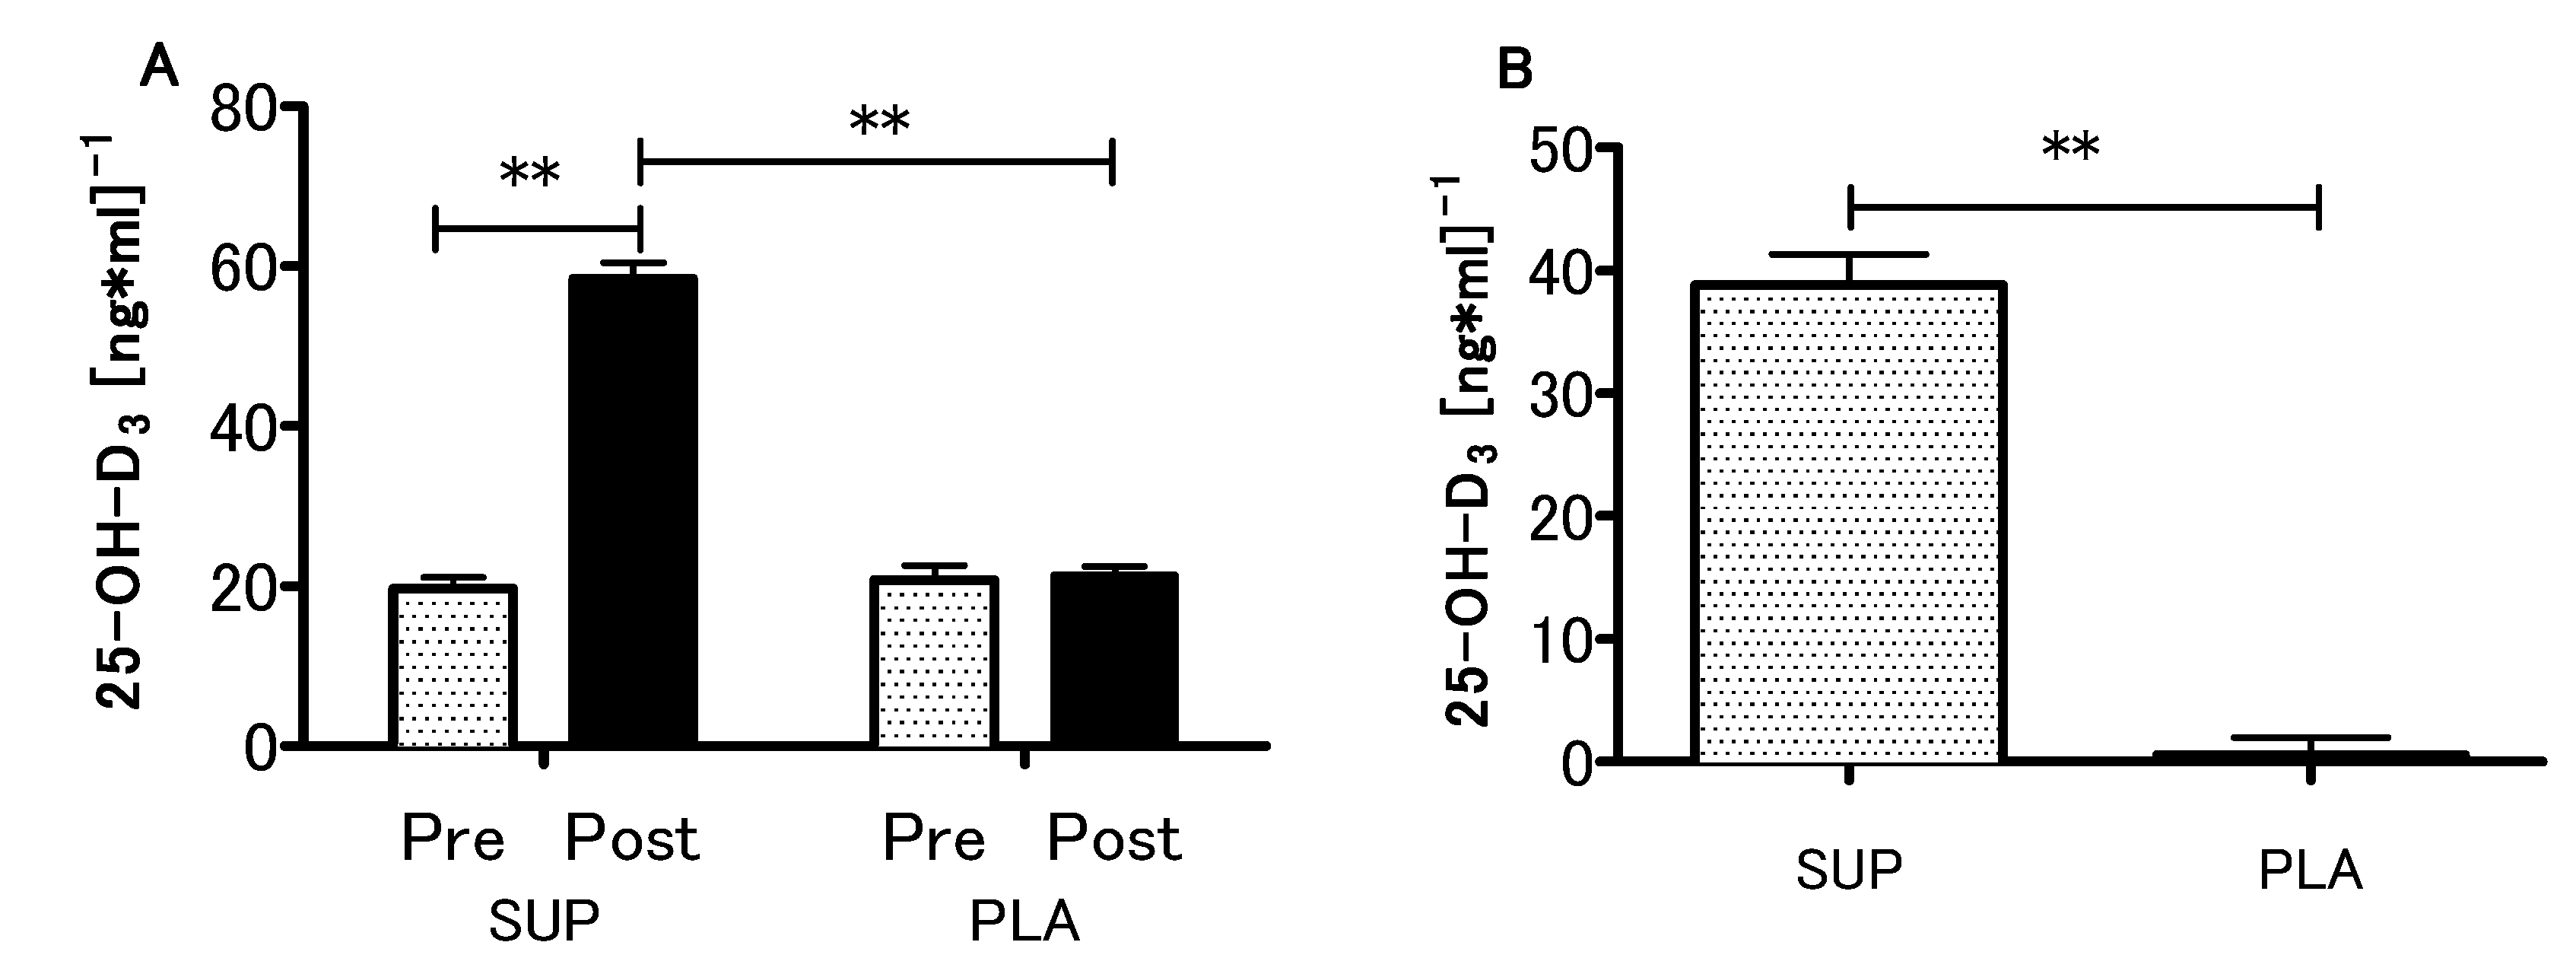
At the baseline, the mean serum concentration of 25-OH-D3 in both supplemented and control groups was 20.2 ± 6.2 ng/mL (~50 nmol/L), which was recognized as a deficiency [34]. What is more, initial 25-OH-D3 levels did not differ between supplemented and placebo groups (19.6 ± 5.4 vs 20.7 ± 6.8 ng/mL). In the supplemented group, the serum 25-OH-D3 concentration increased significantly after the intervention (initial 19.6 ± 5.4 ng/mL, after intervention 58.4 ± 7.3 ng/mL, ~200% increase, p < 0.001), while in the placebo group only non-significant changes were observed (initial 20.7 ± 6.8 ng/ml, after intervention 21.2 ± 4.7 ng/mL, ~2.5% increase, p > 0.05) (Figure 2A). There was a significant interaction between the groups (SUP/PLA) and time (PRE/POST) factors when we performed a two-way ANOVA with repeated measures (p < 0.01, η2 = 0.86; F (1.26) = 172.1). The delta 25-OH-D3 difference was significantly more positive in the SUP than in the PLA group (z = 4.47; p < 0.001) (Figure 2B).

3.3. Effect of Vitamin D Supplementation on Aerobic Capacity

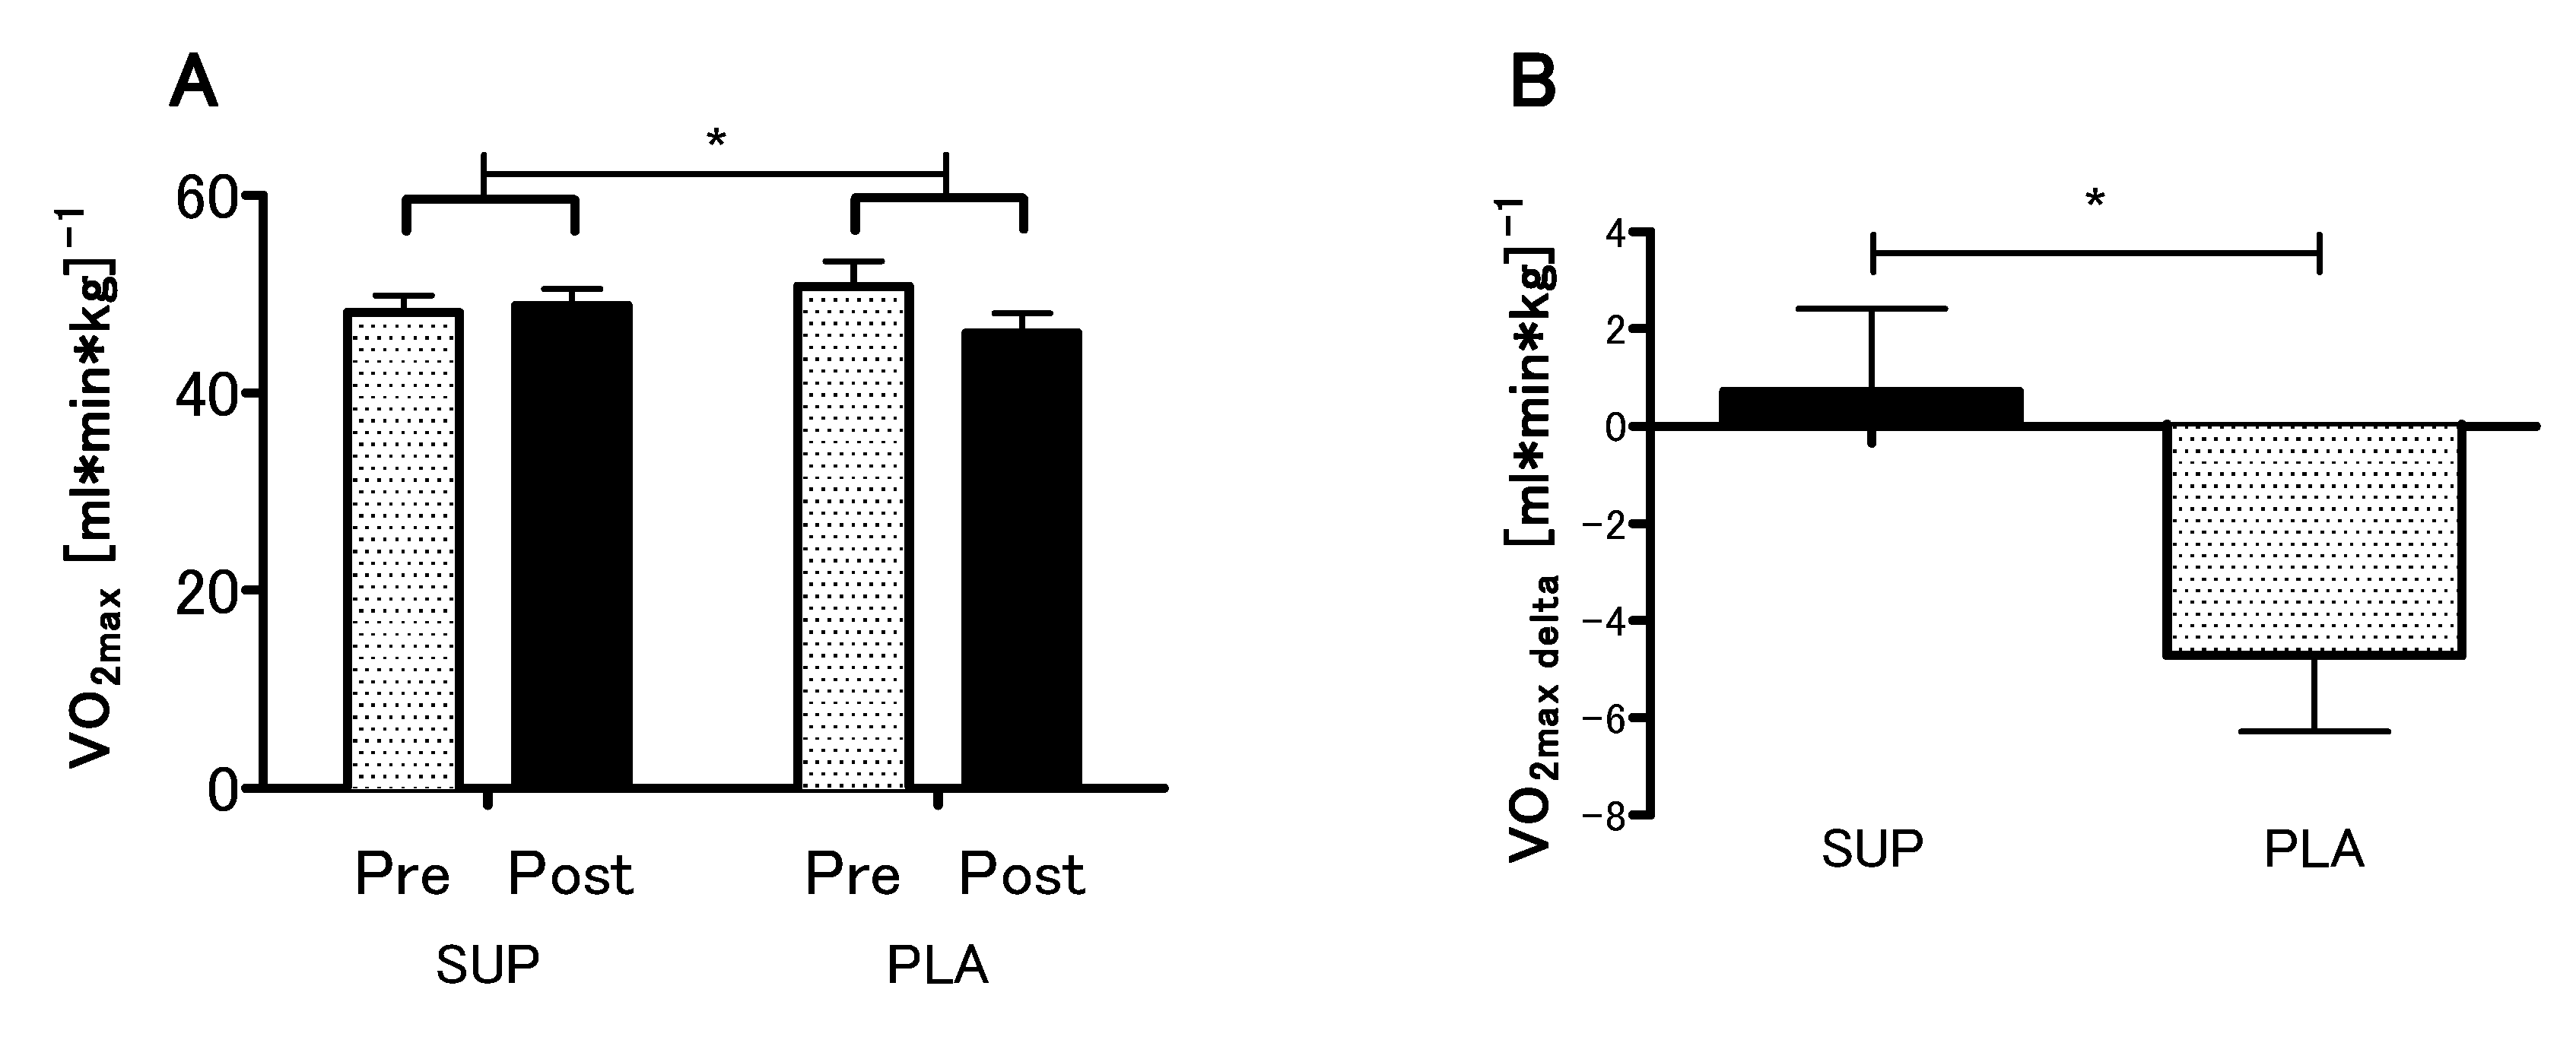
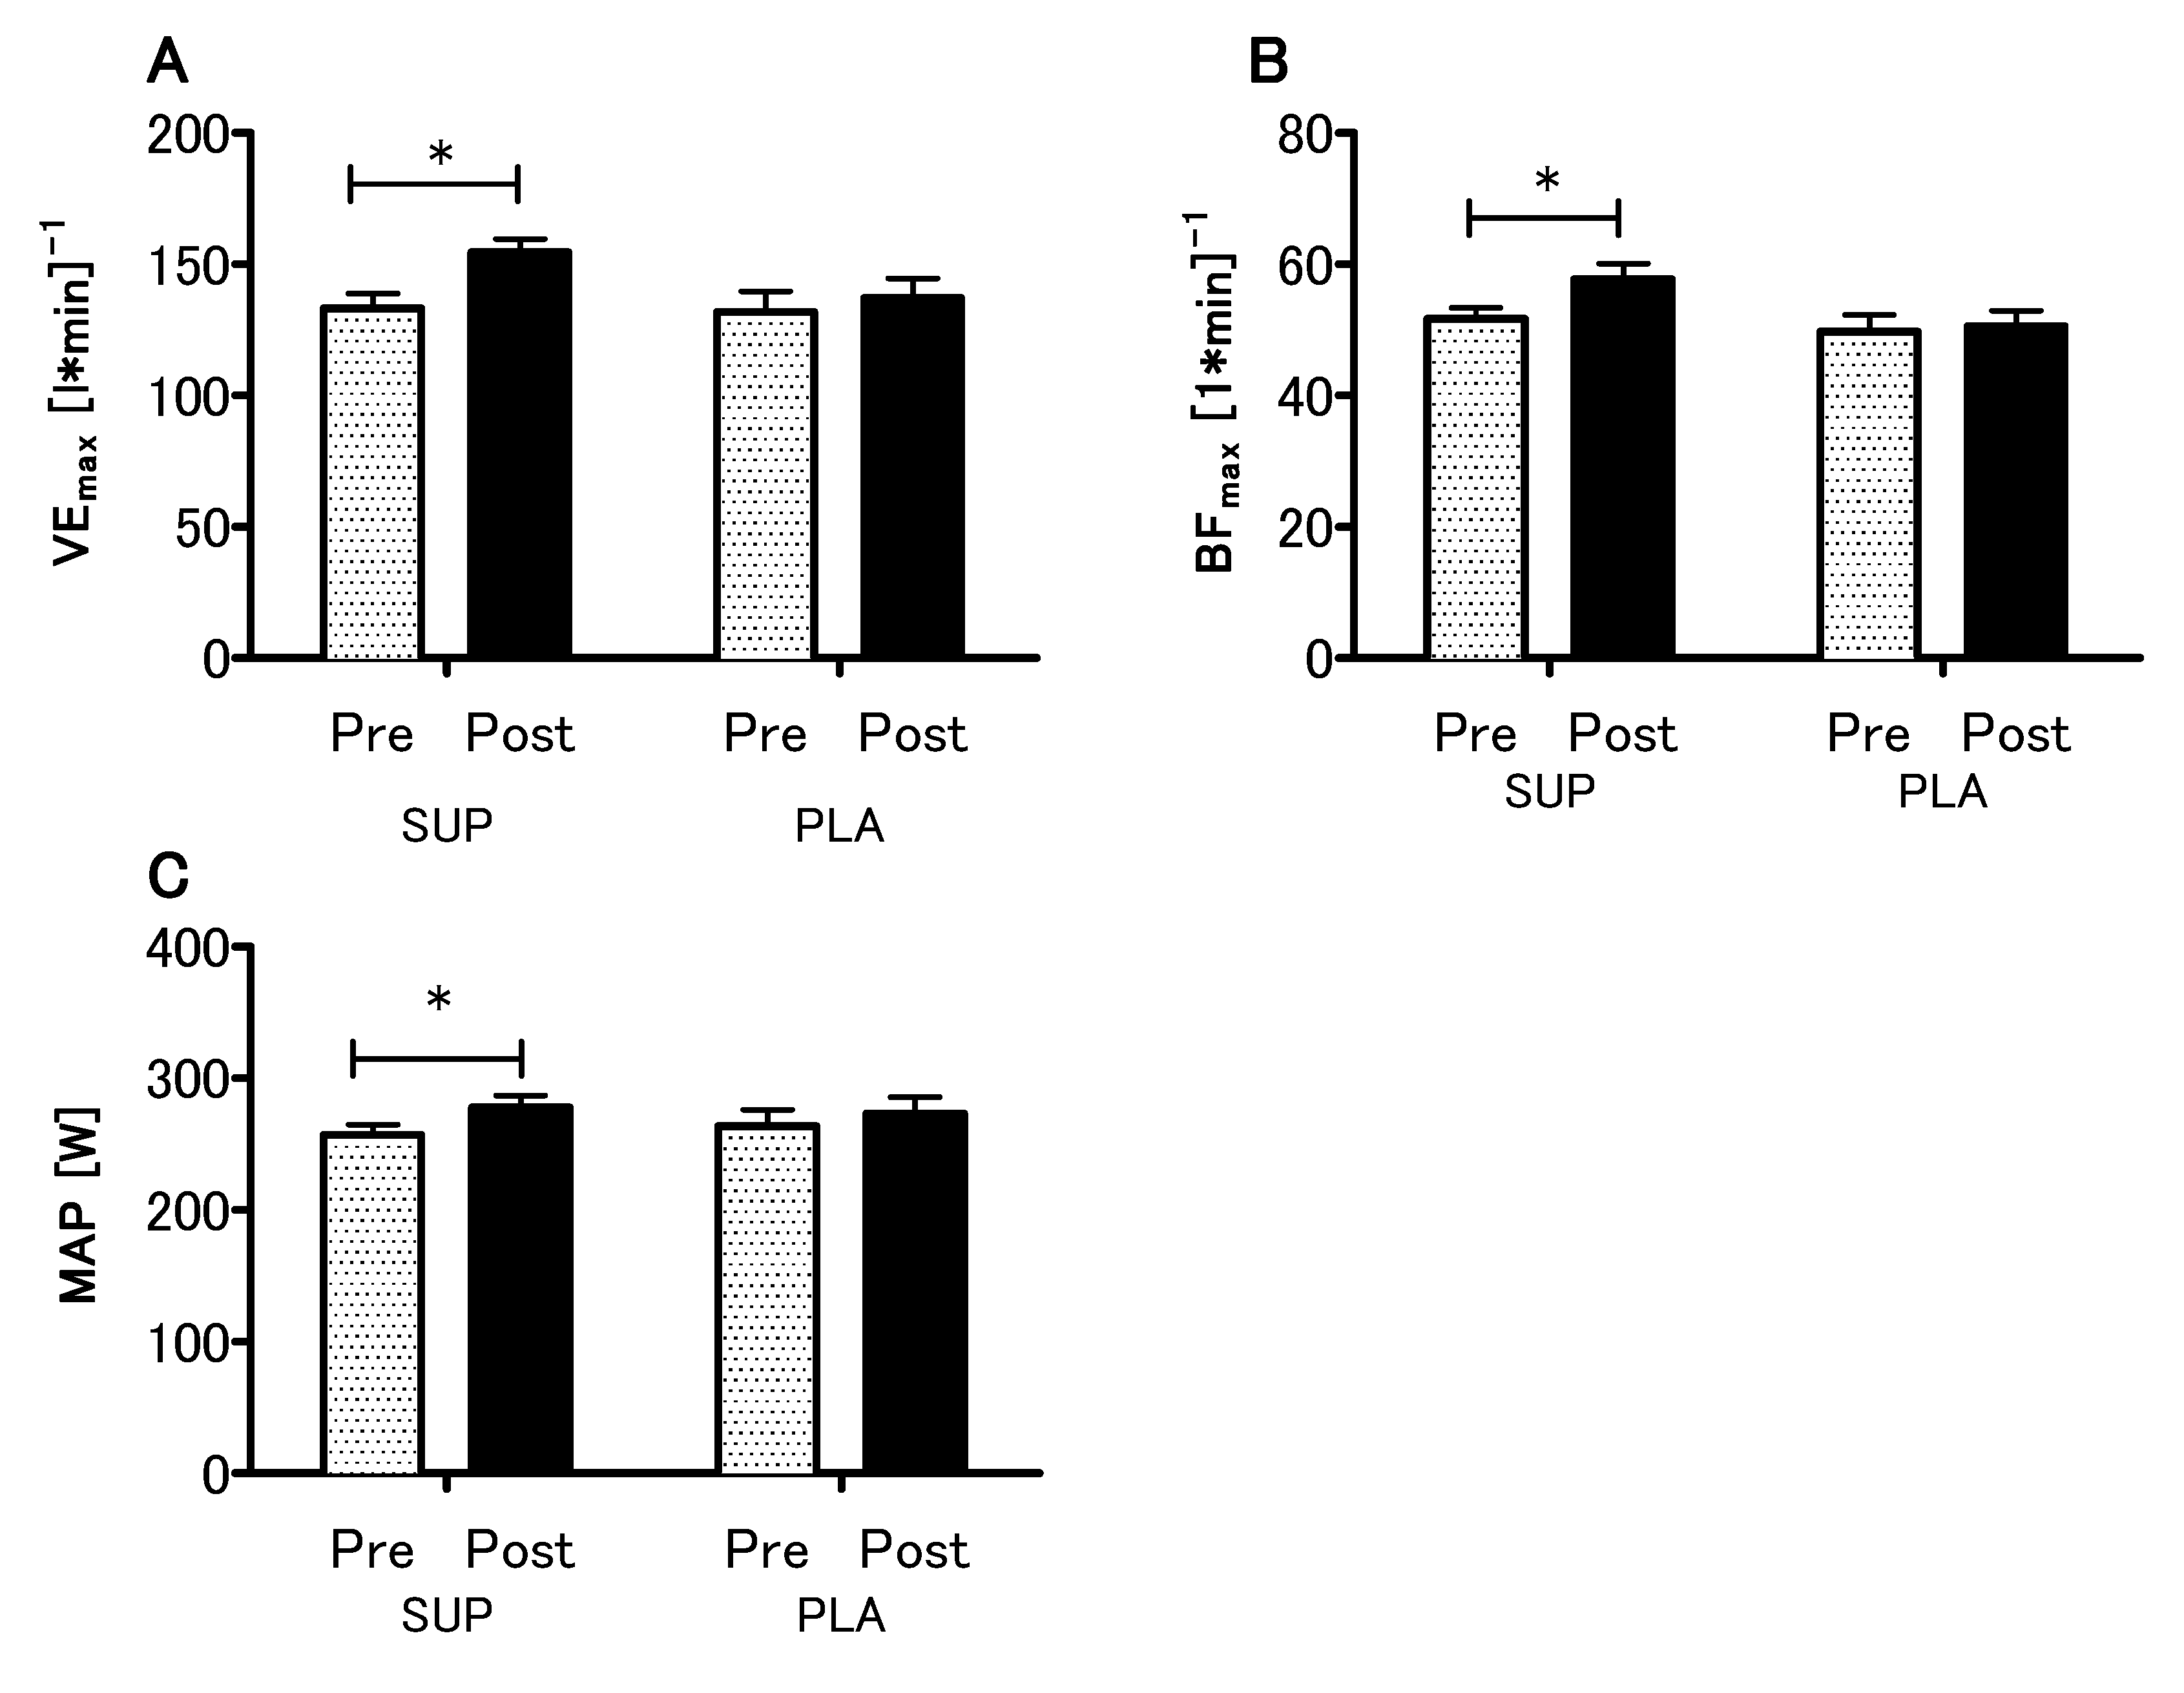
The analyses revealed no statistical differences between the SUP and PLA groups in V . O2max (p = 0.79), VEmax (p = 0.99), BFmax (p = 0.92) and MAP (p = 0.96) for the pre-sessions. There was significant interaction between group and time (SUP/PLA) × (PRE/POST) factors when we performed a two-way ANOVA with repeated measures for V . O2max (p < 0.05, η2 = 0.17; F (1.26) = 5.54) (Figure 3A). Next, we performed contrast analyses between SUP (post-pre) versus PLA (post-pre). The delta V . O2max difference was significantly different between groups t (26) = 2.35; p < 0.05, unpaired t-test (Figure 3B). Moreover, there was a significant main effect of time in the VEmax, BFmax and MAP (p < 0.01, η2 = 0.26; F (1.26) = 9.33., p < 0.05, η2 = 0.12; F (1,26) = 3.88 and p < 0.01, η2 = 0.27; F (1.26) = 9.64, respectively), whereas neither main effect of group nor interaction of the factors was significant. The analyses revealed a significant increase in the VEmax, BFmax, and MAP among the SUP group (Figure 4).

3.4. Effect of Vitamin D Supplementation on Anaerobic Capacity

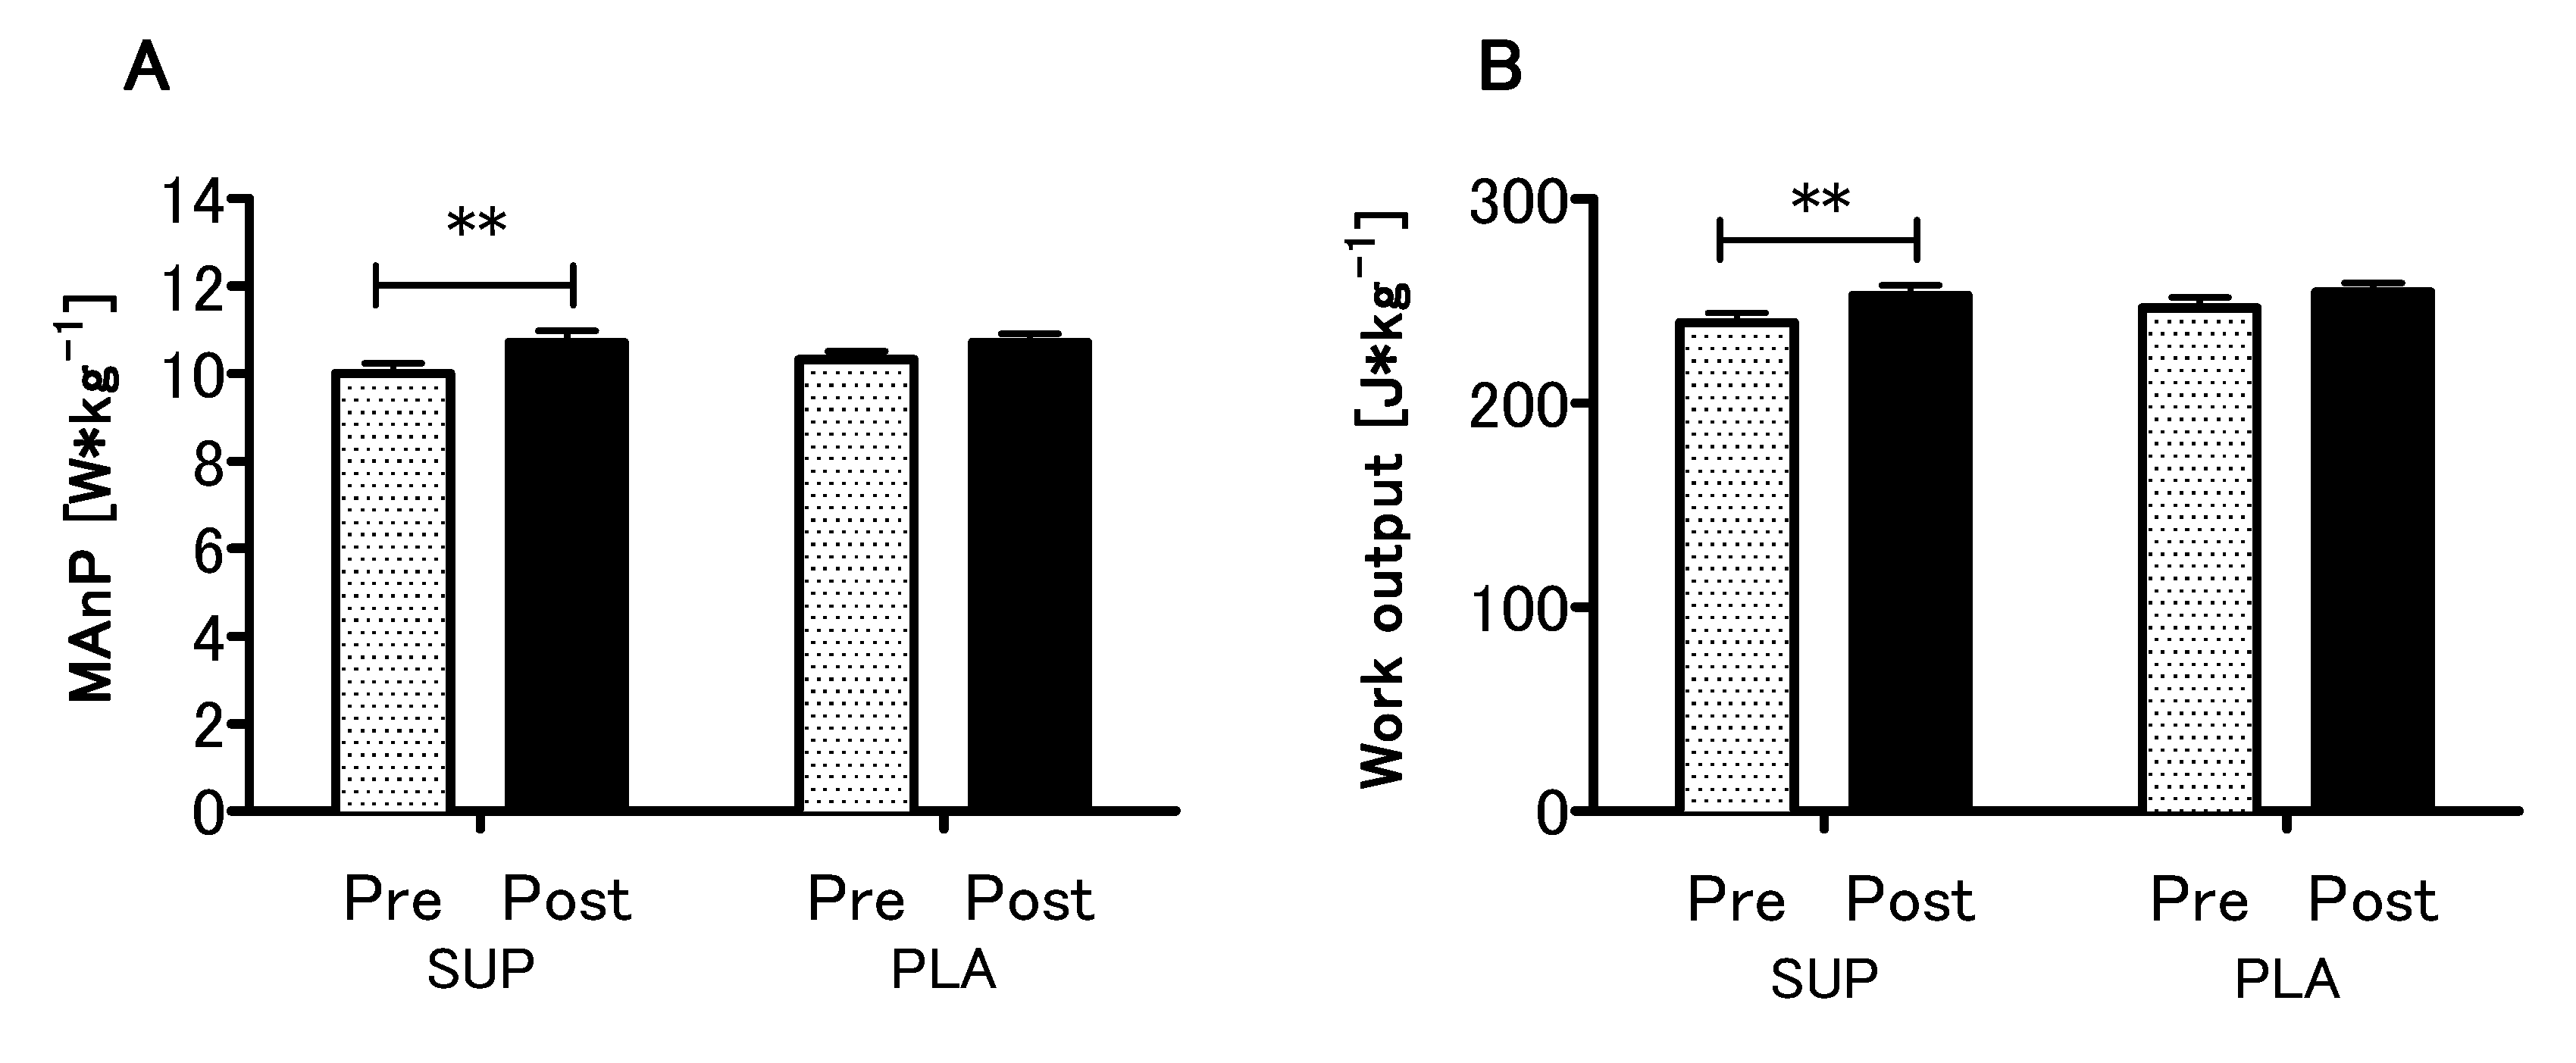
Analyzing the effect of Vitamin D supplementation on anaerobic capacity parameters, a significant main effect of time in the MAnP and Work (p < 0.01, η2 = 0.51; F (1,26) = 28.10 and p < 0.01, η2 = 0.52; F (1,26) = 28.54, respectively) were found, whereas neither main effect of group nor interaction of the factors was significant (Figure 5A,B). Detailed results of the physical capacity tests in the present study are listed in Supplementary Table S1.

3.5. Correlation Analyses

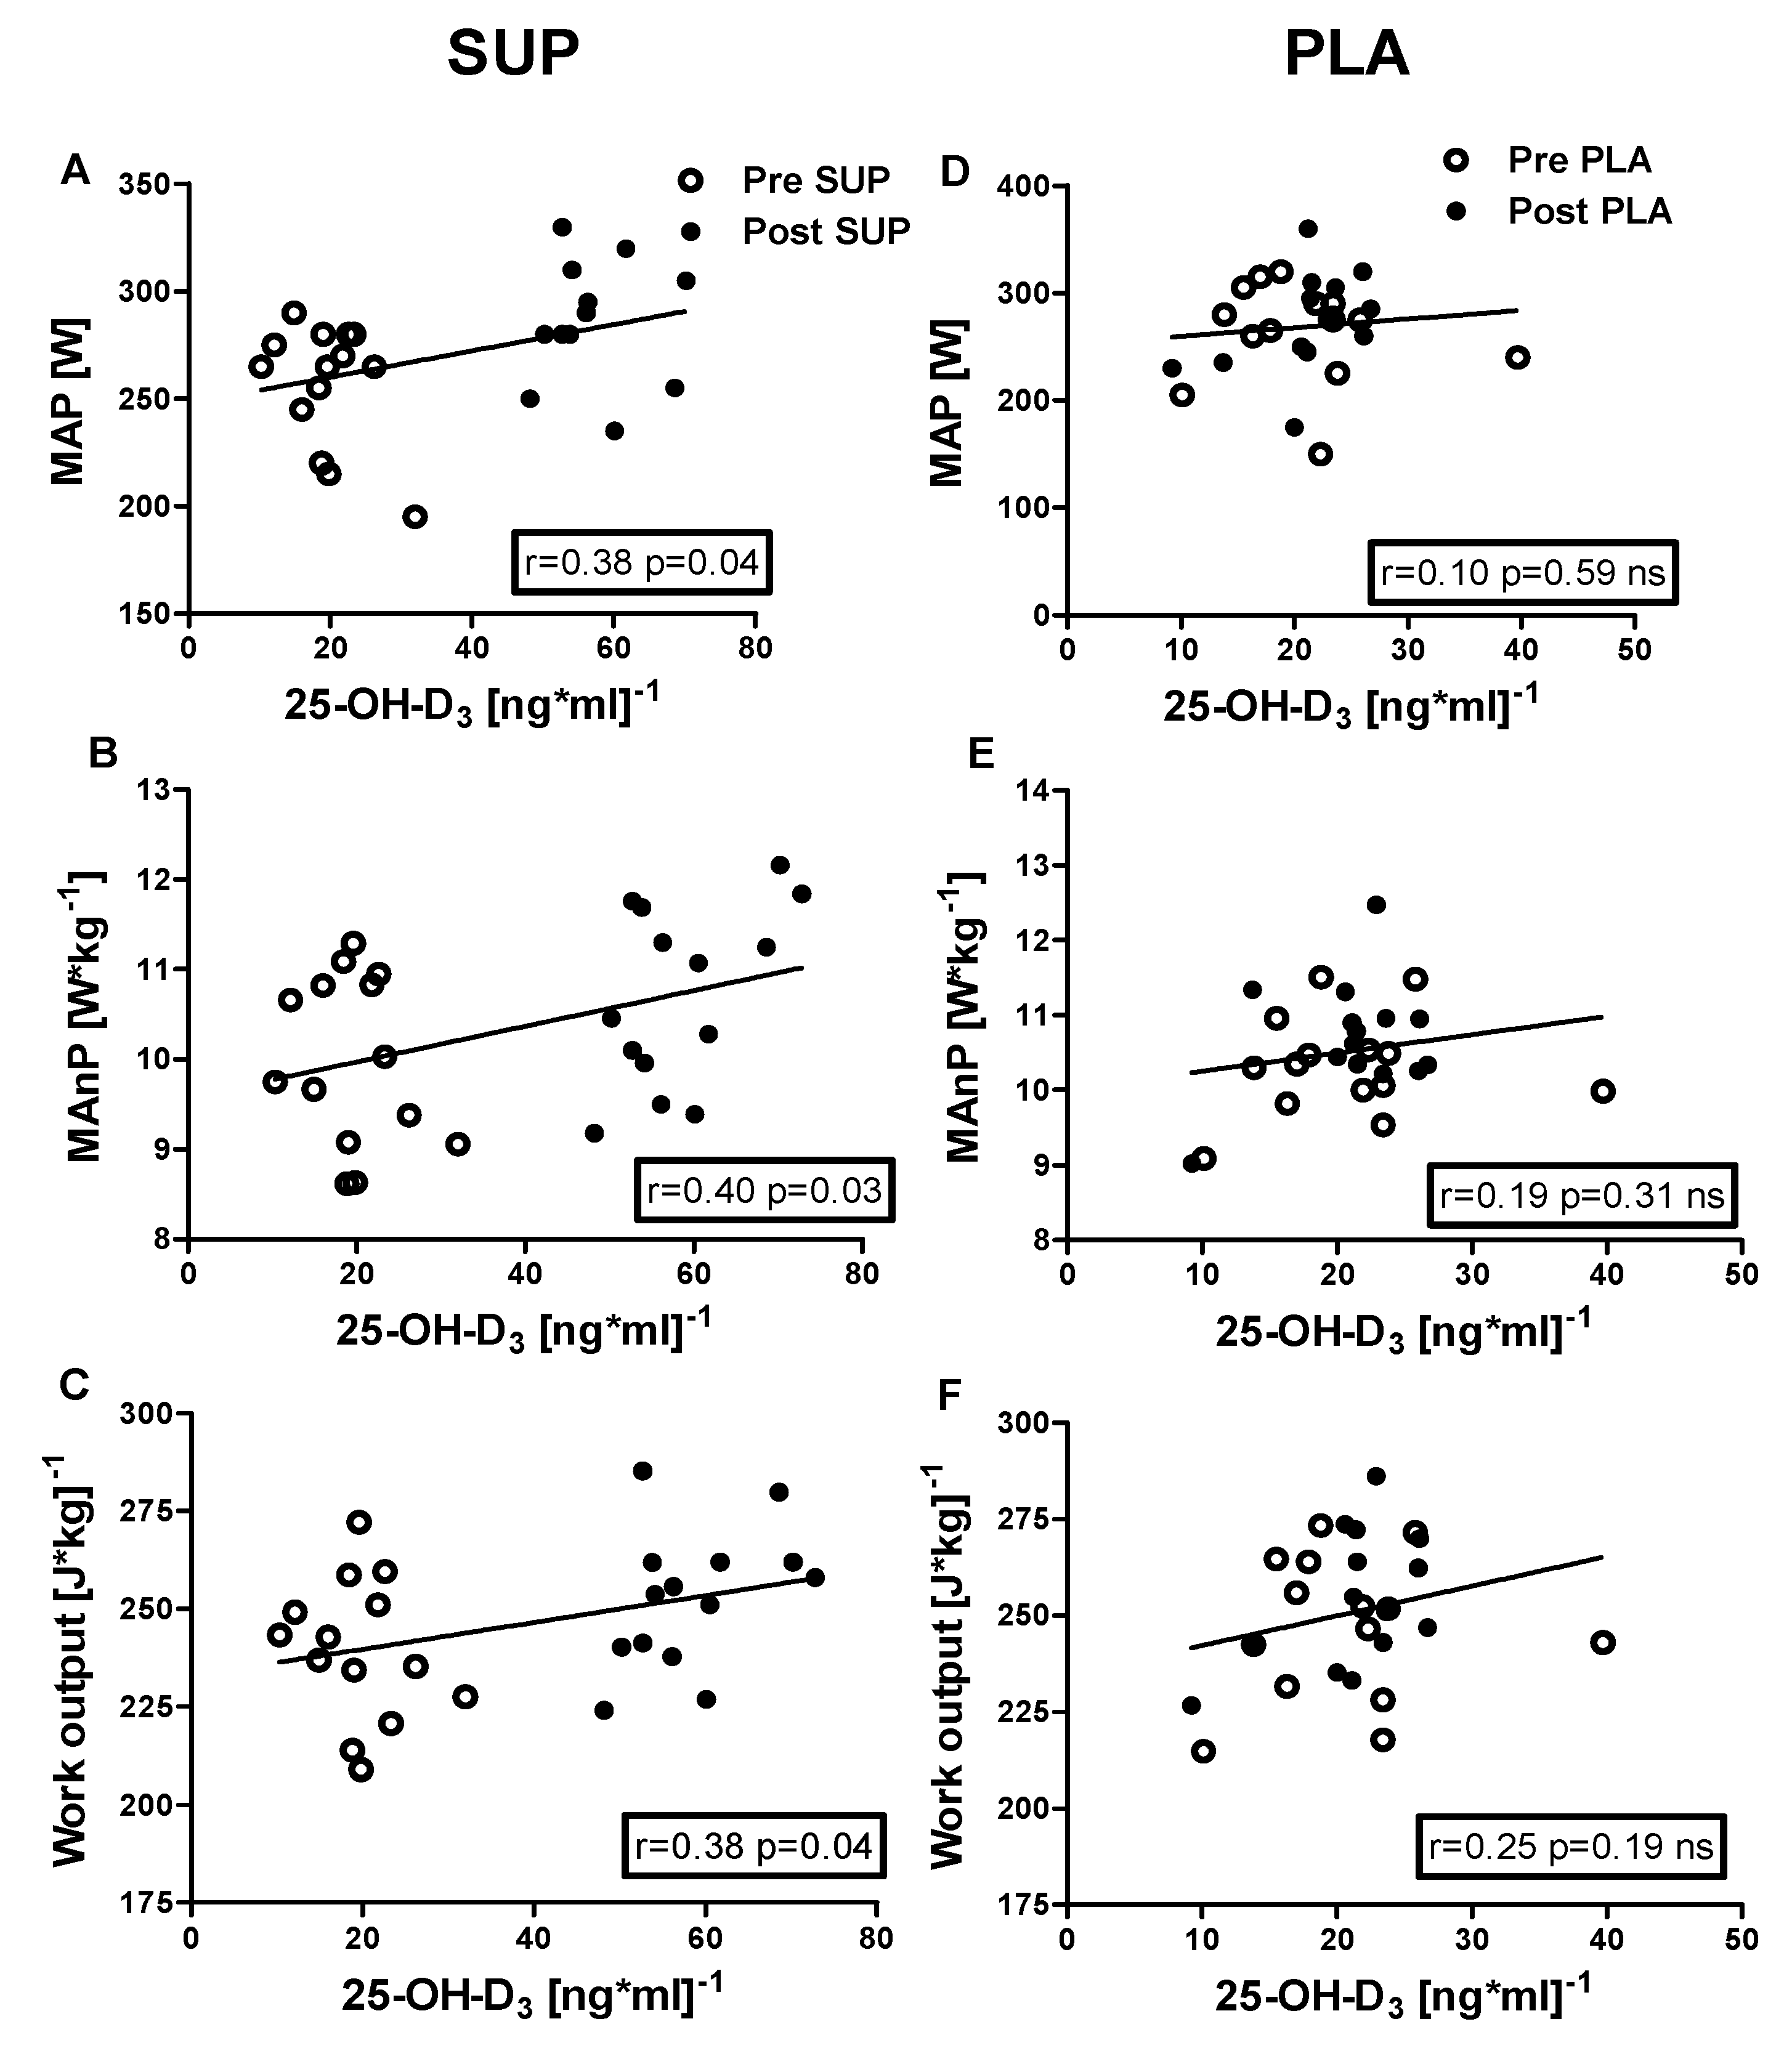
Positive correlations were identified between 25-OH-D3 concentration and the following: VEmax (r = 0.40, p = 0.03); BFmax (r = 0.45, p = 0.02); MAP (r = 0.38, p = 0.04); MAnP (r = 0.40, p = 0.03), and Work output (r = 0.38, p = 0.04) in the pre- and post-intervention measurements in the SUP group. Whereas neither association between 25-OH-D3 and physical capacity parameters was significant in PLA group (Figure 6 and Figure 7).

4. Discussion

In the present study, we demonstrated that supplementation improves vitamin D levels and has a positive impact on aerobic and anaerobic performance. Our data imply that the participants’ low vitamin D status negatively influences their performance despite their young age and the fact that their aerobic physical fitness level was fair. The present data also revealed that aerobic physical capacity can be modulated by 25-OH-D3 concentration. We found an increase in post-intervention pulmonary parameters (VEmax and BFmax) as well as aerobic power. Although we did not observe post supplementation V . O2max increase, when deltas of V . O2max are compared they became significantly different. These data are in agreement with previous studies demonstrating lower aerobic performance which was corrected by UV radiation or vitamin D supplementation [35]. Besides, the winter season diminishes physical activity, which may result in a decrease in aerobic fitness, similar to immobilization [35,36,37] and physical capacity level was shown to be highly seasonal [35]. The results from the maximal bicycle exercise test among Norwegian men showed a peak in August, nadir in winter and decline starting in the autumn [38]. Further, a study of Koch and Raschka (2000) demonstrated the seasonality of physical performance, indicating maximal oxygen uptake peak in the late summer [39]. Also, data from professional athletes displayed maximal oxygen uptake during the summer months [35,40]. The reduced level of V . O2max in the placebo group after the intervention (from January to the beginning of March) seems to confirm these assumptions. Additionally, our results indicate that supplementation can compensate for V . O2max decrease in the season of reduced physical activity, possibly by an improvement of skeletal muscle and respiratory function. However, we did not control physical activity via accelerometers or the GPS devices of our participants during the experiment, which should be considered in future studies. Experiments on cell culture demonstrated that skeletal muscle cells treated with 1α,25(OH)2D3, have shown increased oxygen consumption and increase ATP production [14,18]. Moreover, activity of citrate synthase (40% increase) as well as protein content of PGC-1α, a transcriptional coactivator, was higher in the paraspinal muscle after vitamin D3 supplementation [14]. This data implies that vitamin D supplementation improves the function of mitochondria in our participants. However, we did not observe any association between V . O2max and serum 25-OH-D3 concentration. Accordingly, no associations between 25-OH-D3 concentration and V . O2max were stated by Książek et al. (2016) in professional athletes and resistance-trained participants [26,41]. There was also no significant association between 25-OH-D3 with V . O2max in 52 professional ice hockey players [9]. In contrast to our study, Adrestani et al. (2013) observed a significant positive correlation between 25-OH-D3 concentration and V . O2max in both men and women over a broad range of age (20–73 years) and serum 25-OH-D3 levels (10–82 ng/mL). Interestingly, the effect was greatest among those with low levels of physical activity [25]. Also, Mowry et al. (2009) examined the relation of cardiorespiratory fitness V . O2max and 25-OH-D3 in young healthy women, showing a positive association between both factors [27]. Although we did not find similar results in the literature analyzing the respiratory parameters during graded exercise tests following supplementation with vitamin D, it seems that the changes in VEmax and BFmax are associated with improved lung function and/or structure as well as an increase in respiratory muscle function (strength and/or efficiency) [11]. An increase in VEmax and BFmax are considered as an adaptive response to training and well-trained persons are characterized by higher values of these two parameters compared to untrained. Therefore, the increase in VEmax and BFmax via lung and respiratory muscle function are possibly one of the beneficial effects of vitamin D supplementation.
The mechanisms by which vitamin D modulates aerobic capacity could also be related to cardiac function and structure as it has been observed that vitamin D deficiency is associated with low left ventricle mass and other heart measures [7]. In addition, vitamin D can modulate arterial oxygen content, regulation of muscle blood flow, and oxygen uptake and utilization by exercising muscles, whereas anaerobic capacity may be shifted by the regulation of calcium metabolism, muscle protein synthesis, neuromuscular efficiency and/or insulin signaling [35,42,43,44].
Vitamin D elevated through supplementation is potentially a factor that leads to improved muscle strength and power [45]. It has been demonstrated that vitamin D will interact with calcium in muscle function, plasticity, and insulin signaling [17]. Additionally, the change in vitamin D concentration also modulates its receptors at the expression and activation levels [46,47], thus affecting muscle mass [15,46], the relative number and the cross-sectional area of type II muscle fibers, and neuromuscular coordination [48]. The results of Koundourakis et al. (2014) indicated that serum 25-OH-D3 concentration is positively correlated with anaerobic performance such as 10 and 20 s sprints as well as jumps test [49]. Moreover, Close et al. (2013) have shown a significant elevation in vertical jump, 10 m sprint results, and a trend for improved bench press and back squat [50]. The authors suggest that vitamin D may play a regulatory role in the insulin-like growth factor-1 (IGF-1) pathway via a transcription enhancing role for insulin-like growth factor binding protein-3 IGFBP-3 [51]. We also observed a significant increase in maximal anaerobic power and work output after vitamin D treatment. Furthermore, a significant positive correlation between 25-OH-D3 concentration and both anaerobic parameters in the supplemented group was observed. Thus, we cannot rule out that the improvement in anaerobic capacity resulted from the vitamin D supplementation along with induction in anabolic pathways in skeletal muscle [14].
It is important to note that our participants are characterized by a low baseline 25-OH-D3 concentration. Due to the angle of sunlight, the synthesis of vitamin D is limited in the winter months in latitudes above 35°, causing a clear seasonality of 25-OH-D3 concentrations [35]. The geographical location of Poland (54° N), and associated with it the ultraviolet (UV) radiation, ensure sufficient vitamin D skin synthesis only from April to September [52,53]. Considering that skin synthesis is a source of 80–90% of vitamin D in the body [54,55], there is a risk of its insufficient production in the remaining months of the year [52,53]. This confirms the hypothesis concerning the impact of latitude (54.2° N) and season (winter) on 25-OH-D3 concentration and insufficiency and/or deficiency [56,57]. Moreover, we found that eight weeks of vitamin D3 supplementation (6000 IU·day−1) significantly increases (~200%) 25-OH-D3 serum concentration in young healthy males. It is suggested that skeletal muscle may require higher 25-OH-D3 concentrations, to achieve beneficial changes in physical performance [35]. Through the administration of a higher dose of vitamin D, the concentration of 25-OH-D3 reaches above 40 ng/mL-(autocrine or paracrine effect) in the circulation [34,35,50]. Therefore, we can postulate that the eight weeks of 6000 IU·day−1 vitamin D3 supplementation are sufficient to eliminate the deficiency among young participants. Our data are consistent with other studies showing significant systemic 25-OH-D3 concentration increase (~100%) following 6–8 weeks vitamin D3 supplementation (5000–6000 IU/day) in a similar location/sun exposure among physically active participants [34,54,58]. Recent reports have shown that vitamin D deficiency is widespread across Europe and at prevalence rates that meet the pandemic criteria [59]. Thus, it is possible that if the experiment was performed on subjects with better vitamin D status the beneficial effects of supplementation would not be observed. Although the results of statistical analysis showed a significant effect in time only (MAP., VEmax., BFmax., MAnP., Work output), we did not record any significant changes in physical performance in the placebo group. Therefore, significant changes in the supplemented group and their absence in the placebo group may suggest a mild beneficial effect of Vitamin D in maintaining or even increasing selected indicators of physical fitness in young people.

5. Conclusions

In summary, the current findings indicate that the improvement of aerobic and anaerobic capacity may be associated with vitamin D3 status. Moreover, eight weeks of vitamin D3 supplementation with a dose of 6000 IU per day significantly increases 25-OH-D3 serum concentration and was an efficient treatment of vitamin D3 deficiency among young healthy males.

Supplementary Materials

The following are available online at https://www.mdpi.com/2072-6643/12/7/1936/s1, Table S1: The effect of Vitamin D supplementation on aerobic and anaerobic capacity.

Author Contributions

Conceptualization, D.L., S.K., J.A. and R.L.; Formal analysis, S.K., R.L.; Funding acquisition, D.L.; Investigation, S.K., D.L., M.C., D.B.; Methodology, S.K., M.C., D.B., D.L.; Supervision, S.K., R.L.; Writing—original draft, S.K., D.L., J.A. and R.L.; Writing—review & editing, D.L., R.L., J.A. and S.K. All authors have read and agree to the published version of the manuscript.

Funding

This research received no external funding.

Acknowledgments

The authors would like to thank a group of subjects participating in the study.

Conflicts of Interest

The authors declare no conflict of interest.

References

  1. Radak, Z. The Physiology of Physical Training, 1st ed.; Elsevier: London, UK, 2018; 280p. [Google Scholar]
  2. Wilmore, J.H.; Costill, D.L.; Kenney, W.L. Physiology of Sport and Exercise, 5th ed.; Human Kinetics: Leeds, UK, 2012. [Google Scholar]
  3. Owens, D.J.; Allison, R.; Close, G.L. Vitamin D and the Athlete: Current Perspectives and New Challenges. Sports Med. 2018, 48, 3–16. [Google Scholar] [CrossRef] [PubMed] [Green Version]
  4. Ogan, D.; Pritchett, K. Vitamin D and the athlete: Risks, recommendations, and benefits. Nutrients 2013, 5, 1856–1868. [Google Scholar] [CrossRef] [Green Version]
  5. Wolpowitz, D.; Gilchrest, B.A. The vitamin D questions: How much do you need and how should you get it? J. Am. Acad. Dermatol. 2006, 54, 301–317. [Google Scholar] [CrossRef]
  6. Pludowski, P.; Holick, M.F.; Grant, W.B.; Konstantynowicz, J.; Mascarenhas, M.R.; Haq, A.; Povoroznyuk, V.; Balatska, N.; Barbosa, A.P.; Karonova, T.; et al. Vitamin D supplementation guidelines. J. Steroid Biochem. Mol. Biol. 2018, 175, 125–135. [Google Scholar] [CrossRef] [Green Version]
  7. Allison, R.J.; Close, G.L.; Farooq, A.; Riding, N.R.; Salah, O.; Hamilton, B.; Wilson, M.G. Severely vitamin D-deficient athletes present smaller hearts than sufficient athletes. Eur. J. Prev. Cardiol. 2015, 22, 535–542. [Google Scholar] [CrossRef] [PubMed]
  8. Forney, L.A.; Earnest, C.P.; Henagan, T.M.; Johnson, L.E.; Castleberry, T.J.; Stewart, L.K. Vitamin D status, body composition, and fitness measures in college-aged students. J. Strength Cond. Res. 2014, 28, 814–824. [Google Scholar] [CrossRef]
  9. Fitzgerald, J.S.; Peterson, B.J.; Warpeha, J.M.; Wilson, P.B.; Rhodes, G.S.; Ingraham, S.J. Vitamin D status and V[combining dot above]O2peak during a skate treadmill graded exercise test in competitive ice hockey players. J. Strength Cond. Res. 2014, 28, 3200–3205. [Google Scholar] [CrossRef]
  10. Rafiq, R.; Prins, H.J.; Boersma, W.G.; Daniels, J.M.; den Heijer, M.; Lips, P.; de Jongh, R.T. Effects of daily vitamin D supplementation on respiratory muscle strength and physical performance in vitamin D-deficient COPD patients: A pilot trial. Int. J. Chronic Obstr. Pulm. Dis. 2017, 12, 2583–2592. [Google Scholar] [CrossRef] [Green Version]
  11. Zosky, G.R.; Berry, L.J.; Elliot, J.G.; James, A.L.; Gorman, S.; Hart, P.H. Vitamin D deficiency causes deficits in lung function and alters lung structure. Am. J. Respir. Crit. Care Med. 2011, 183, 1336–1343. [Google Scholar] [CrossRef] [PubMed]
  12. Black, P.N.; Scragg, R. Relationship between serum 25-hydroxyvitamin d and pulmonary function in the third national health and nutrition examination survey. Chest 2005, 128, 3792–3798. [Google Scholar] [CrossRef] [Green Version]
  13. Illi, S.K.; Held, U.; Frank, I.; Spengler, C.M. Effect of respiratory muscle training on exercise performance in healthy individuals: A systematic review and meta-analysis. Sports Med. 2012, 42, 707–724. [Google Scholar] [CrossRef] [PubMed]
  14. Dzik, K.P.; Kaczor, J.J. Mechanisms of vitamin D on skeletal muscle function: Oxidative stress, energy metabolism and anabolic state. Eur. J. Appl. Physiol. 2019, 119, 825–839. [Google Scholar] [CrossRef] [PubMed] [Green Version]
  15. Neal, S.; Sykes, J.; Rigby, M.; Hess, B. A review and clinical summary of vitamin D in regard to bone health and athletic performance. Physician Sportsmed. 2015, 43, 161–168. [Google Scholar] [CrossRef] [PubMed]
  16. Hamilton, B. Vitamin d and athletic performance: The potential role of muscle. Asian J. Sports Med. 2011, 2, 211–219. [Google Scholar] [CrossRef] [Green Version]
  17. Girgis, C.M.; Clifton-Bligh, R.J.; Hamrick, M.W.; Holick, M.F.; Gunton, J.E. The roles of vitamin D in skeletal muscle: Form, function, and metabolism. Endocr. Rev. 2013, 34, 33–83. [Google Scholar] [CrossRef] [Green Version]
  18. Ryan, Z.C.; Craig, T.A.; Folmes, C.D.; Wang, X.; Lanza, I.R.; Schaible, N.S.; Salisbury, J.L.; Nair, K.S.; Terzic, A.; Sieck, G.C.; et al. 1alpha,25-Dihydroxyvitamin D3 Regulates Mitochondrial Oxygen Consumption and Dynamics in Human Skeletal Muscle Cells. J. Biol. Chem. 2016, 291, 1514–1528. [Google Scholar] [CrossRef] [Green Version]
  19. Sinha, A.; Hollingsworth, K.G.; Ball, S.; Cheetham, T. Improving the vitamin D status of vitamin D deficient adults is associated with improved mitochondrial oxidative function in skeletal muscle. J. Clin. Endocrinol. Metab. 2013, 98, E509–E513. [Google Scholar] [CrossRef] [Green Version]
  20. Koundourakis, N.E.; Avgoustinaki, P.D.; Malliaraki, N.; Margioris, A.N. Muscular effects of vitamin D in young athletes and non-athletes and in the elderly. Hormones 2016, 15, 471–488. [Google Scholar] [CrossRef] [Green Version]
  21. Aoki, K.; Sakuma, M.; Endo, N. The impact of exercise and vitamin D supplementation on physical function in community-dwelling elderly individuals: A randomized trial. J. Orthop. Sci. 2018, 23, 682–687. [Google Scholar] [CrossRef]
  22. Girgis, C.M. Vitamin D and muscle function in the elderly: The elixir of youth? Curr. Opin. Clin. Nutr. Metab. Care 2014, 17, 546–550. [Google Scholar] [CrossRef]
  23. Wagatsuma, A.; Sakuma, K. Vitamin D signaling in myogenesis: Potential for treatment of sarcopenia. BioMed Res. Int. 2014, 2014, 121254. [Google Scholar] [CrossRef] [PubMed] [Green Version]
  24. Houston, D.K.; Cesari, M.; Ferrucci, L.; Cherubini, A.; Maggio, D.; Bartali, B.; Johnson, M.A.; Schwartz, G.G.; Kritchevsky, S.B. Association between vitamin D status and physical performance: The InCHIANTI study. J. Gerontol. Ser. A Biol. Sci. Med Sci. 2007, 62, 440–446. [Google Scholar] [CrossRef] [PubMed]
  25. Ardestani, A.; Parker, B.; Mathur, S.; Clarkson, P.; Pescatello, L.S.; Hoffman, H.J.; Polk, D.M.; Thompson, P.D. Relation of vitamin D level to maximal oxygen uptake in adults. Am. J. Cardiol. 2011, 107, 1246–1249. [Google Scholar] [CrossRef] [PubMed] [Green Version]
  26. Ksiazek, A.; Zagrodna, A.; Dziubek, W.; Pietraszewski, B.; Ochmann, B.; Slowinska-Lisowska, M. 25(OH)D3 Levels Relative to Muscle Strength and Maximum Oxygen Uptake in Athletes. J. Hum. Kinet. 2016, 50, 71–77. [Google Scholar] [CrossRef]
  27. Mowry, D.A.; Costello, M.M.; Heelan, K.A. Association among cardiorespiratory fitness, body fat, and bone marker measurements in healthy young females. J. Am. Osteopath. Assoc. 2009, 109, 534–539. [Google Scholar]
  28. Farrokhyar, F.; Sivakumar, G.; Savage, K.; Koziarz, A.; Jamshidi, S.; Ayeni, O.R.; Peterson, D.; Bhandari, M. Effects of Vitamin D Supplementation on Serum 25-Hydroxyvitamin D Concentrations and Physical Performance in Athletes: A Systematic Review and Meta-analysis of Randomized Controlled Trials. Sports Med. 2017, 47, 2323–2339. [Google Scholar] [CrossRef]
  29. Kujach, S.; Olek, R.A.; Byun, K.; Suwabe, K.; Sitek, E.J.; Ziemann, E.; Laskowski, R.; Soya, H. Acute Sprint Interval Exercise Increases Both Cognitive Functions and Peripheral Neurotrophic Factors in Humans: The Possible Involvement of Lactate. Front. Neurosci. 2019, 13, 1455. [Google Scholar] [CrossRef]
  30. Suwabe, K.; Hyodo, K.; Byun, K.; Ochi, G.; Fukuie, T.; Shimizu, T.; Kato, M.; Yassa, M.A.; Soya, H. Aerobic fitness associates with mnemonic discrimination as a mediator of physical activity effects: Evidence for memory flexibility in young adults. Sci. Rep. 2017, 7, 5140. [Google Scholar] [CrossRef] [Green Version]
  31. Ziemann, E.; Grzywacz, T.; Luszczyk, M.; Laskowski, R.; Olek, R.A.; Gibson, A.L. Aerobic and anaerobic changes with high-intensity interval training in active college-aged men. J. Strength Cond. Res. 2011, 25, 1104–1112. [Google Scholar] [CrossRef]
  32. Olek, R.A.; Kujach, S.; Ziemann, E.; Ziolkowski, W.; Waz, P.; Laskowski, R. Adaptive Changes After 2 Weeks of 10-s Sprint Interval Training With Various Recovery Times. Front. Physiol. 2018, 9, 392. [Google Scholar] [CrossRef] [Green Version]
  33. Enko, D.; Kriegshauser, G.; Stolba, R.; Worf, E.; Halwachs-Baumann, G. Method evaluation study of a new generation of vitamin D assays. Biochem. Med. 2015, 25, 203–212. [Google Scholar] [CrossRef] [PubMed]
  34. Close, G.L.; Leckey, J.; Patterson, M.; Bradley, W.; Owens, D.J.; Fraser, W.D.; Morton, J.P. The effects of vitamin D(3) supplementation on serum total 25[OH]D concentration and physical performance: A randomised dose-response study. Br. J. Sports Med. 2013, 47, 692–696. [Google Scholar] [CrossRef] [PubMed]
  35. Cannell, J.J.; Hollis, B.W.; Sorenson, M.B.; Taft, T.N.; Anderson, J.J. Athletic performance and vitamin D. Med. Sci. Sports Exerc. 2009, 41, 1102–1110. [Google Scholar] [CrossRef] [PubMed]
  36. Breen, L.; Stokes, K.A.; Churchward-Venne, T.A.; Moore, D.R.; Baker, S.K.; Smith, K.; Atherton, P.J.; Phillips, S.M. Two weeks of reduced activity decreases leg lean mass and induces “anabolic resistance” of myofibrillar protein synthesis in healthy elderly. J. Clin. Endocrinol. Metab. 2013, 98, 2604–2612. [Google Scholar] [CrossRef] [Green Version]
  37. Wall, B.T.; Snijders, T.; Senden, J.M.; Ottenbros, C.L.; Gijsen, A.P.; Verdijk, L.B.; van Loon, L.J. Disuse impairs the muscle protein synthetic response to protein ingestion in healthy men. J. Clin. Endocrinol. Metab. 2013, 98, 4872–4881. [Google Scholar] [CrossRef] [Green Version]
  38. Erikssen, J.; Rodahl, K. Seasonal variation in work performance and heart rate response to exercise. A study of 1,835 middle-aged men. Eur. J. Appl. Physiol. Occup. Physiol. 1979, 42, 133–140. [Google Scholar] [CrossRef]
  39. Koch, H.; Raschka, C. Circannual period of physical performance analysed by means of standard cosinor analysis: A case report. Rom. J. Physiol. Physiol. Sci. 2000, 37, 51–58. [Google Scholar]
  40. Svedenhag, J.; Sjodin, B. Physiological characteristics of elite male runners in and off-season. Can. J. Appl. Sport Sci. 1985, 10, 127–133. [Google Scholar]
  41. Gregory, S.M.; Parker, B.A.; Capizzi, J.A.; Grimaldi, A.S.; Clarkson, P.M.; Moeckel-Cole, S.; Keadle, J.; Chipkin, S.; Pescatello, L.S.; Simpson, K.; et al. Changes in Vitamin D are Not Associated with Changes in Cardiorespiratory Fitness. Clin. Med. Res. 2013, 2, 68–72. [Google Scholar] [CrossRef] [Green Version]
  42. Moran, D.S.; McClung, J.P.; Kohen, T.; Lieberman, H.R. Vitamin d and physical performance. Sports Med. 2013, 43, 601–611. [Google Scholar] [CrossRef]
  43. Hamilton, B. Vitamin D and human skeletal muscle. Scand. J. Med. Sci. Sports 2010, 20, 182–190. [Google Scholar] [CrossRef] [Green Version]
  44. Bartoszewska, M.; Kamboj, M.; Patel, D.R. Vitamin D, muscle function, and exercise performance. Pediatric Clin. N. Am. 2010, 57, 849–861. [Google Scholar] [CrossRef]
  45. Zhang, L.; Quan, M.; Cao, Z.B. Effect of vitamin D supplementation on upper and lower limb muscle strength and muscle power in athletes: A meta-analysis. PLoS ONE 2019, 14, e0215826. [Google Scholar] [CrossRef] [PubMed] [Green Version]
  46. Bischoff-Ferrari, H.A.; Dietrich, T.; Orav, E.J.; Hu, F.B.; Zhang, Y.; Karlson, E.W.; Dawson-Hughes, B. Higher 25-hydroxyvitamin D concentrations are associated with better lower-extremity function in both active and inactive persons aged > or =60 y. Am. J. Clin. Nutr. 2004, 80, 752–758. [Google Scholar] [CrossRef]
  47. Bischoff-Ferrari, H.A. Relevance of vitamin D in muscle health. Rev. Endocr. Metab. Disord. 2012, 13, 71–77. [Google Scholar] [CrossRef] [Green Version]
  48. Dhesi, J.K.; Jackson, S.H.; Bearne, L.M.; Moniz, C.; Hurley, M.V.; Swift, C.G.; Allain, T.J. Vitamin D supplementation improves neuromuscular function in older people who fall. Age Ageing 2004, 33, 589–595. [Google Scholar] [CrossRef] [PubMed] [Green Version]
  49. Koundourakis, N.E.; Androulakis, N.E.; Malliaraki, N.; Margioris, A.N. Vitamin D and exercise performance in professional soccer players. PLoS ONE 2014, 9, e101659. [Google Scholar] [CrossRef] [PubMed]
  50. Close, G.L.; Russell, J.; Cobley, J.N.; Owens, D.J.; Wilson, G.; Gregson, W.; Fraser, W.D.; Morton, J.P. Assessment of vitamin D concentration in non-supplemented professional athletes and healthy adults during the winter months in the UK: Implications for skeletal muscle function. J. Sports Sci. 2013, 31, 344–353. [Google Scholar] [CrossRef] [PubMed]
  51. Peng, L.; Malloy, P.J.; Feldman, D. Identification of a functional vitamin D response element in the human insulin-like growth factor binding protein-3 promoter. Mol. Endocrinol. 2004, 18, 1109–1119. [Google Scholar] [CrossRef] [PubMed] [Green Version]
  52. Krzyscin, J.W.; Jaroslawski, J.; Sobolewski, P.S. A mathematical model for seasonal variability of vitamin D due to solar radiation. J. Photochem. Photobiol. B Biol. 2011, 105, 106–112. [Google Scholar] [CrossRef]
  53. Holick, M.F. The vitamin D deficiency pandemic and consequences for nonskeletal health: Mechanisms of action. Mol. Asp. Med. 2008, 29, 361–368. [Google Scholar] [CrossRef] [Green Version]
  54. Guillemant, J.; Le, H.T.; Maria, A.; Allemandou, A.; Peres, G.; Guillemant, S. Wintertime vitamin D deficiency in male adolescents: Effect on parathyroid function and response to vitamin D3 supplements. Osteoporos. Int. 2001, 12, 875–879. [Google Scholar] [CrossRef] [PubMed]
  55. Alpert, P.T.; Shaikh, U. The effects of vitamin D deficiency and insufficiency on the endocrine and paracrine systems. Biol. Res. Nurs. 2007, 9, 117–129. [Google Scholar] [CrossRef] [PubMed]
  56. Webb, A.R.; Kline, L.; Holick, M.F. Influence of season and latitude on the cutaneous synthesis of vitamin D3: Exposure to winter sunlight in Boston and Edmonton will not promote vitamin D3 synthesis in human skin. J. Clin. Endocrinol. Metab. 1988, 67, 373–378. [Google Scholar] [CrossRef] [Green Version]
  57. Holick, M.F. Vitamin D deficiency. N. Engl. J. Med. 2007, 357, 266–281. [Google Scholar] [CrossRef] [PubMed]
  58. Jastrzebska, M.; Kaczmarczyk, M.; Michalczyk, M.; Radziminski, L.; Stepien, P.; Jastrzebska, J.; Wakuluk, D.; Suarez, A.D.; Lopez Sanchez, G.F.; Cieszczyk, P.; et al. Can Supplementation of Vitamin D Improve Aerobic Capacity in Well Trained Youth Soccer Players? J. Hum. Kinet. 2018, 61, 63–72. [Google Scholar] [CrossRef] [PubMed] [Green Version]
  59. Cashman, K.D.; Dowling, K.G.; Skrabakova, Z.; Gonzalez-Gross, M.; Valtuena, J.; De Henauw, S.; Moreno, L.; Damsgaard, C.T.; Michaelsen, K.F.; Molgaard, C.; et al. Vitamin D deficiency in Europe: Pandemic? Am. J. Clin. Nutr. 2016, 103, 1033–1044. [Google Scholar] [CrossRef] [PubMed] [Green Version]
Figure 1. Experimental Overview.
Nutrients 12 01936 g001
Figure 2. Effect of Vitamin D supplementation on serum 25-OH-D3 concentration (A), and contrast between supplemented (SUP) versus placebo (PLA) deltas (post-pre) (B). Values are means. Error bars indicate ± SEM. ** = p < 0.01.
Nutrients 12 01936 g002
Figure 3. Effect of vitamin D supplementation on V . O2max (A), and contrast between SUP versus PLA deltas (post-pre) (B). Values are means. Error bars indicate ± SEM. * = p < 0.05.
Nutrients 12 01936 g003
Figure 4. Effect of vitamin D supplementation on maximal minute ventilation VEmax (A) maximal breath frequency BFmax (B) and maximal aerobic power MAP (C) recorded during the V . O2max test. Values are means. Error bars indicate ± SEM (standard error of mean). * = p < 0.05.
Nutrients 12 01936 g004
Figure 5. Effect of vitamin D supplementation on maximal anaerobic power MAnP (A) and work output (B). Values are means. Error bars indicate ± SEM (standard error of mean). ** = p < 0.01.
Nutrients 12 01936 g005
Figure 6. Association between 25-OH-D3 and V . O2max, VEmax, and BFmax, of pre- and post-intervention in the SUP and PLA groups. Significant positive correlations between 25-OH-D3 and VEmax (B), 25-OH-D3, and BFmax (C) were found in the SUP group. Correlations between 25-OH-D3 and V . O2max (D), VEmax (E), and BFmax (F) in PLA group were not found. Data are presented as open circles: pre, and closed circles: post SUP or PLA. ns, non-significant.
Nutrients 12 01936 g006
Figure 7. Association between 25-OH-D3 and MAP, MAnP and Work output, of pre- and post-intervention in the SUP and PLA groups. Significant positive correlations between 25-OH-D3 and MAP (A), 25-OH-D3 and MAnP (B), and between 25-OH-D3 and Work output (C) were found in the SUP group. Correlations between 25-OH-D3 and MAP (D), MAnP (E), and Work output (F) in PLA group were not found. Data are presented as open circles: pre, and closed circles: post SUP or PLA. ns, non-significant.
Nutrients 12 01936 g007
Table 1. Demographic and clinical characteristics.
VariableSUP (n = 14)PLA (n = 14)
PrePostPrePost
Age (y)21.7 ± 1.822.0 ± 1.820.5 ± 1.420.7 ± 1.1
Height (cm)180.3 ± 7.4180.3 ± 7.4183.2 ± 7.1183.3 ± 7.4
Weight (kg)76.7 ± 9.077.1 ± 8.675.9 ± 7.075.5 ± 7.1
Fat (%)14.4 ± 4.414.7 ± 4.413.0 ± 2.712.8 ± 3.2
Fat (kg)11.3 ± 4.311.6 ± 4.29.9 ± 2.99.8 ± 3.3
FFM (kg)65.3 ± 5.865.5 ± 5.865.9 ± 4.865.7 ± 4.7
BMI (kg·m−2)23.6 ± 3.123.8 ± 2.822.6 ± 1.922.4 ± 1.9
TBW (kg)47.8 ± 5.847.9 ± 4.248.3 ± 3.548.1 ± 3.4
SUP: supplemented group; PLA: placebo group; values are mean ± SD expressed in absolute or relative values; Fat (%): fat percentage; Fat (kg): fat mass; FFM: free fat mass; BMI: body mass index; TBW: total body water.