Review

The Effects of Different Degrees of Carbohydrate Restriction and Carbohydrate Replacement on Cardiometabolic Risk Markers in Humans—A Systematic Review and Meta-Analysis

Department of Nutrition and Movement Sciences, NUTRIM School of Nutrition and Translational Research in Metabolism, Maastricht University Medical Center, PO Box 616, 6200 MD Maastricht, The Netherlands
*
Author to whom correspondence should be addressed.
Nutrients 2020, 12(4), 991; https://doi.org/10.3390/nu12040991
Submission received: 26 January 2020 / Revised: 30 March 2020 / Accepted: 31 March 2020 / Published: 2 April 2020

Abstract

:
Low-carbohydrate diets (LCDs) often differ in their diet composition, which may lead to conflicting results between randomized controlled trials. Therefore, we aimed to compare the effects of different degrees of carbohydrate (CHO) restriction on cardiometabolic risk markers in humans. The experimental LCDs of 37 human trials were classified as (1) moderate-low CHO diets (<45–40 E%, n = 13), (2) low CHO diets (<40–30 E%, n = 16), and (3) very-low CHO diets (<30–3 E%; n = 8). Summary estimates of weighted mean differences (WMDs) in selected risk markers were calculated using random-effect meta-analyses. Differences between the LCD groups were assessed with univariate meta-regression analyses. Overall, the LCDs resulted in significant weight loss, reduced diastolic blood pressure BP, and increased total cholesterol and high-density lipoprotein cholesterol (HDL-C), without significant differences between the three LCD groups. Higher low-density lipoprotein cholesterol (LDL-C) concentrations were found with the very-low CHO diets compared to the moderate-low CHO diets. Decreases in triacylglycerol (TAG) concentrations were more pronounced with the low and very-low CHO diets, compared to the moderate-low CHO diets. Substitution of CHO by mainly saturated fatty acids (SFAs) increased total cholesterol, LDL-C, and HDL-C concentrations. Except for LDL-C and TAGs, effects were not related to the degree of CHO restriction. Potential effects of nutrient exchanges should be considered when following LCDs.

1. Introduction

Low-carbohydrate diets (LCDs) have been proposed in the management of obesity, diabetes, and cardiovascular diseases (CVD) [1,2,3]. However, randomized controlled trials (RCTs) have shown conflicting results on the effects of LCDs on weight loss, glycemic control, and serum lipid profiles, while positive effects have mainly been observed in short-term studies [4]. The European Food Safety Authority therefore concluded that scientific evidence is not sufficient to advocate either low or high carbohydrate (CHO) diets and thus recommends a range for CHO-intake between 45% to 60% of total energy (E%), including a daily fiber intake of at least 25 grams [5]. Diets providing less than 45 E% from CHO could therefore be referred to as LCDs [6].
In the human intervention trials performed so far, intakes of CHO differed widely between studies, which also implies varying amounts of fats and proteins. It is well-known that different degrees of CHO restriction may result in different metabolic effects [6]. For example, while LCDs providing more than 50 g of CHO per day prevent dietary ketosis in most people, a very-low carbohydrate ketogenic diet (VLCKD) providing less than 50 grams CHO per day typically leads to the production of measurable amounts of ketone bodies in the urine [7]. The metabolic switch to ketosis may result in immediate side-effects like loss of appetite [8] or in long-term side effects, such as kidney stones [9]. Johnston et al. [10] compared a ketogenic (9 E% CHO) with a non-ketogenic LCD (42 E% CHO) under isocaloric conditions and concluded that a lower CHO content and the initiation of dietary ketosis did not provide a metabolic advantage over the non-ketogenic LCD. In contrast, Saslow et al. [11] found a higher weight loss and improved glycemic control when comparing an energy-restricted VLCKD (14 E% CHO) to an isocaloric energy-restricted LCD (41 E% CHO). More recently, Harvey et al. [12] compared three LCDs containing 5 E%, 15 E%, and 25 E% of CHO. Compared to baseline, significant decreases in body weight and triacylglycerol (TAG) concentrations were observed, while total cholesterol, low-density lipoprotein cholesterol (LDL-C), and high-density lipoprotein cholesterol (HDL-C) concentrations were increased after 12 weeks of CHO restriction. However, changes did not differ between the diet groups. Still, RCTs comparing different types of LCDs are limited and no systematic overviews, evaluating the degree of CHO restriction on metabolic risk markers, have been published yet [12].
The main objective of this systematic review and meta-analysis was therefore to compare the effects of different degrees of CHO restriction on conventional fasting cardiometabolic risk markers and to investigate whether dose-dependent relationships were present. Under isocaloric conditions, reducing CHO intake is accompanied by increases in fat and/or protein intake. In addition, the fatty-acid composition, as well as cholesterol and fiber intakes may change, which can affect glucose and lipid metabolism [13,14,15]. Therefore, not only the amount of CHO was addressed, but also the macronutrients used to substitute CHO. To make studies more comparable and to avoid the comparison to high-carbohydrate diets (HCD)/low fat diets (LFDs), only studies that compared LCDs to moderate-carbohydrate diets (MCDs, 45–55 E%) were included.

2. Methods

The Preferred Reporting Items for Systematic Reviews and Meta-Analyses (PRISMA) checklist and flow-diagram for reporting systematic reviews and meta-analyses [16] were used as tools to structure this review, to describe the used methodology, and to systematically present our findings.

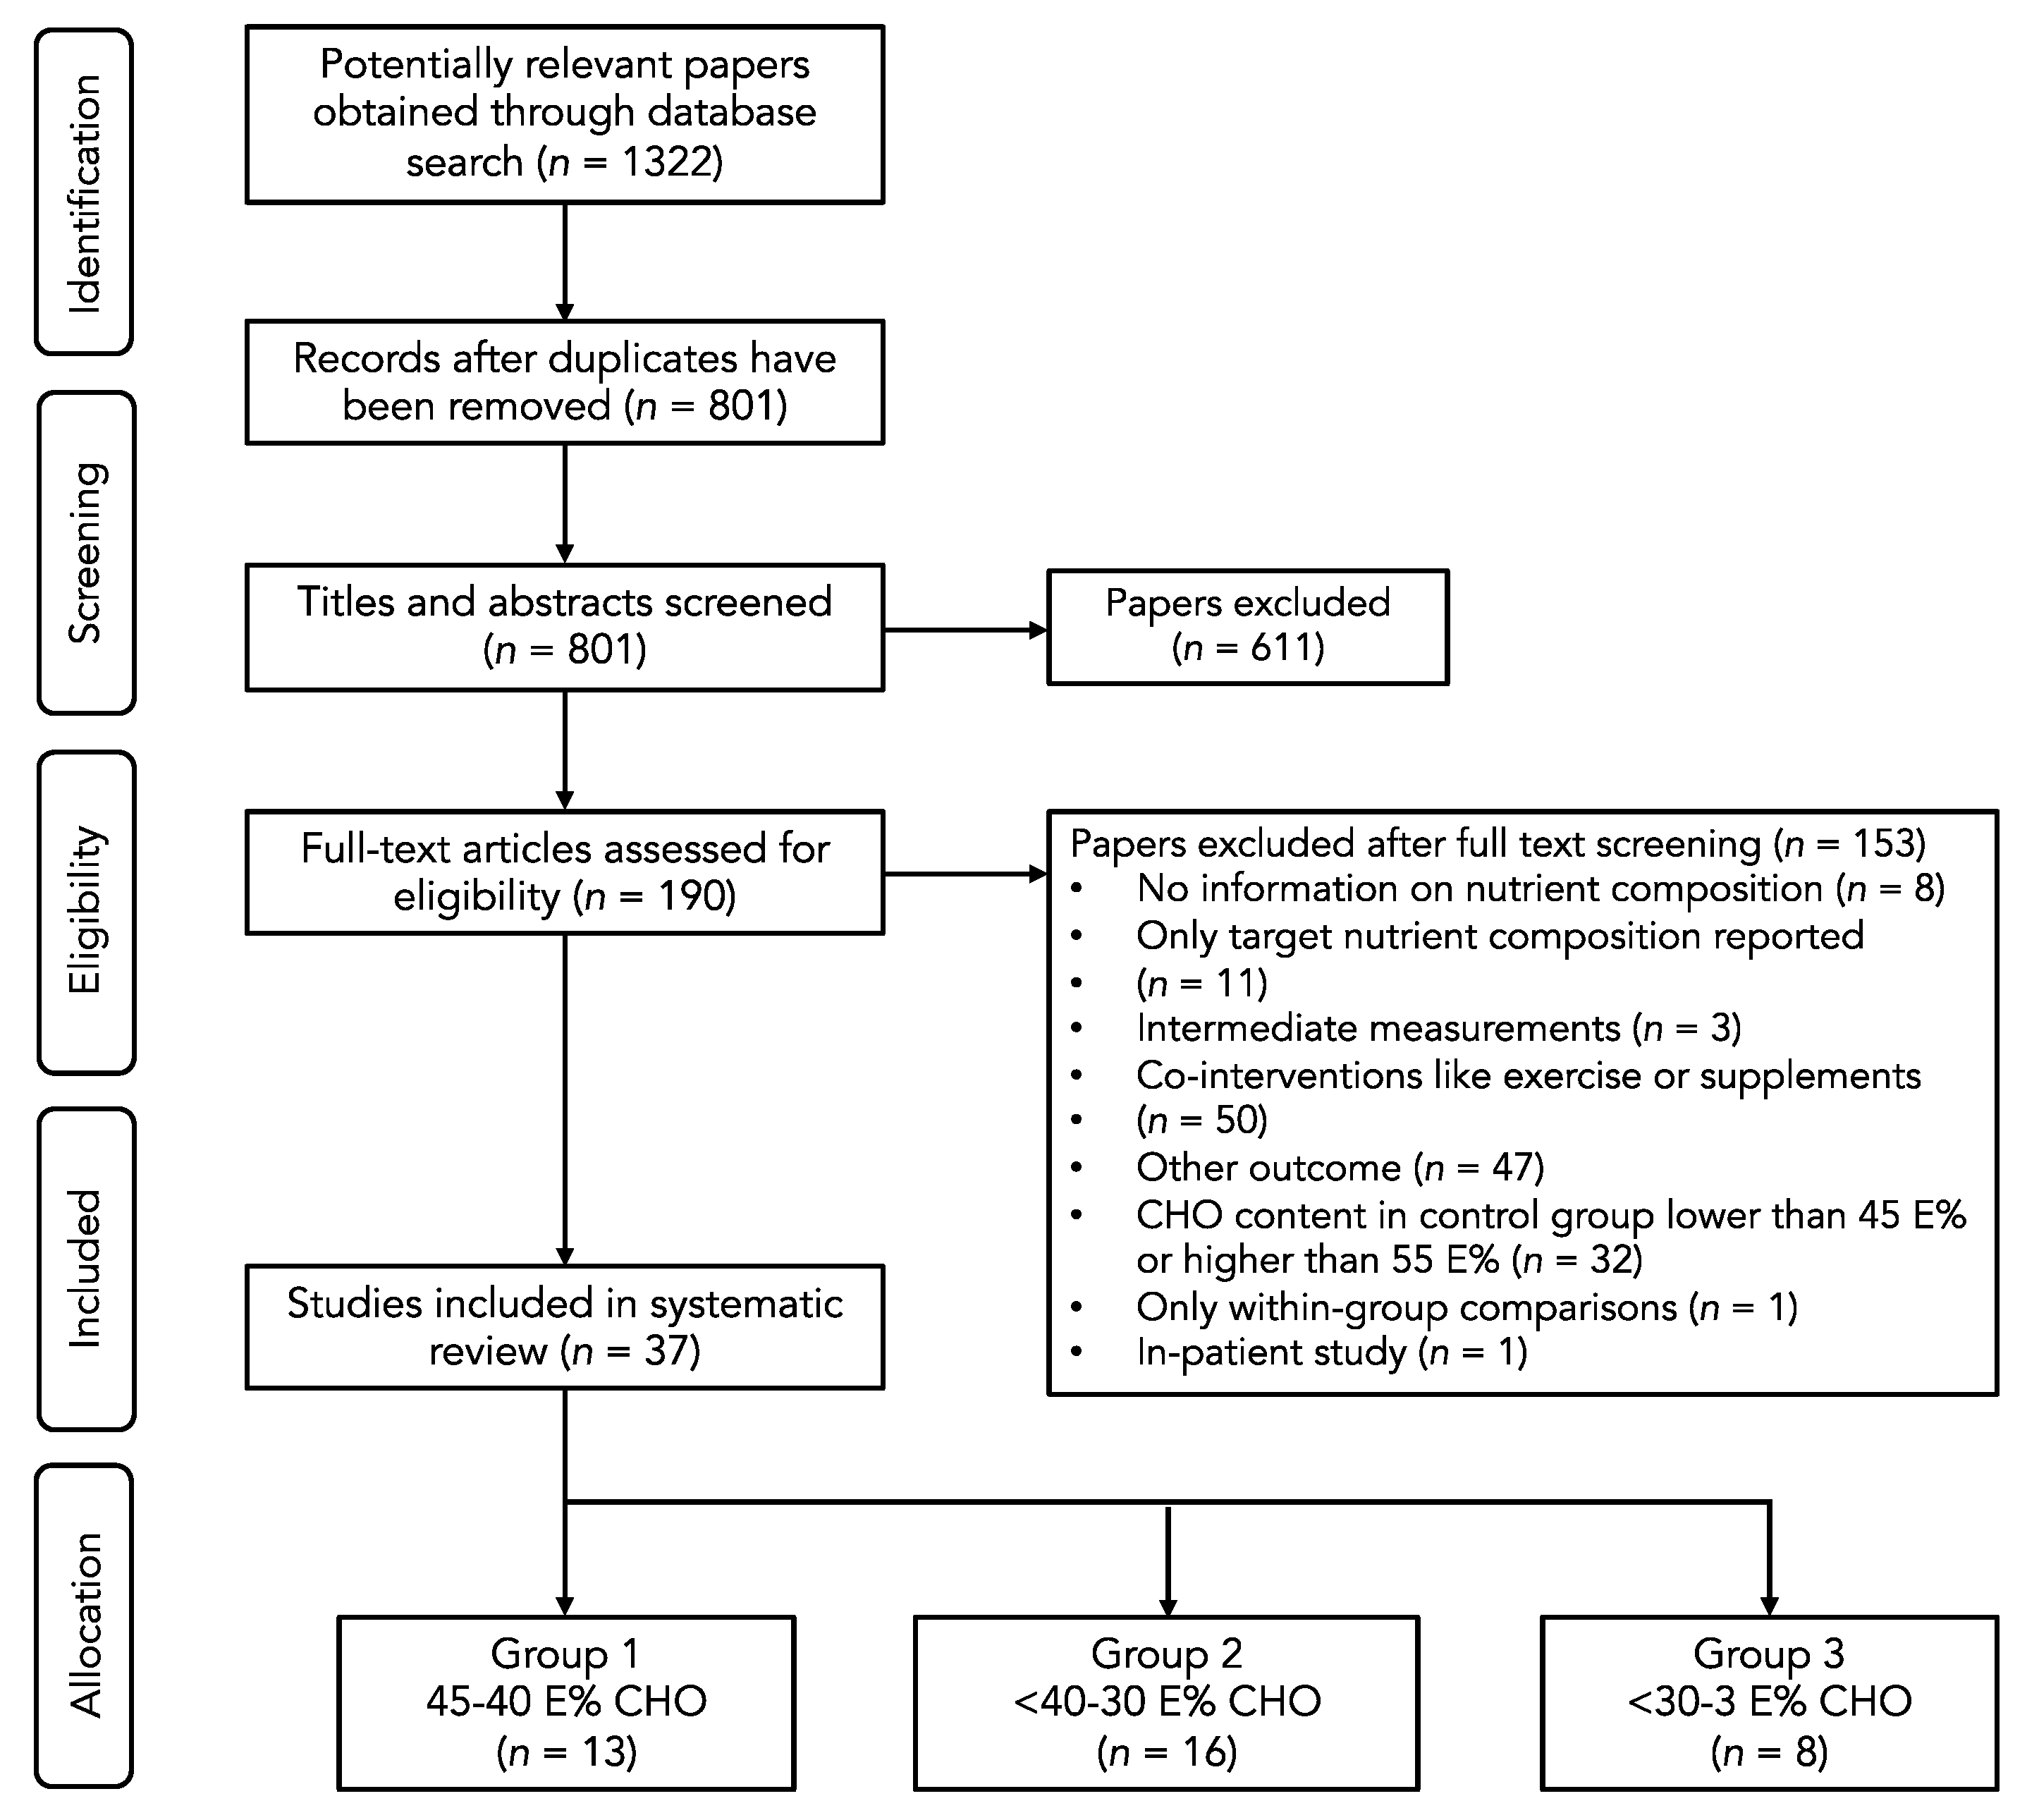
2.1. Search Strategy

Potentially relevant studies were identified in April 2019 by a systematic literature search in three databases (Ovid Medline, Embase, and the Cochrane Central Register of Clinical Trials). The following search terms were used: ‘low carbohydrate diet or carbohydrate restricted diet or very low carbohydrate diet or ketogenic diet or very low carbohydrate ketogenic diet or low glycemic load diet or high fat diet or high protein diet’ (MeSH term) and ‘weight or BMI or glucose or insulin or triacylglycerol or triacylglycerol or cholesterol or HDL or LDL or blood pressure’ (MeSH term) and ‘randomized controlled trial or comparative study or controlled clinical trial’ [publication type] and ‘humans’ [Subjects].

2.2. Study Selection

The selection procedure was divided into two stages. An initial selection was made by screening titles and abstracts only, followed by a second full text selection of the remaining articles. Articles were included when they did meet the following criteria: (a) randomized controlled intervention trial in free-living adult human subjects; (b) comparison of the effects of a LCD (<45 E%) with those of a MCD (45–55 E%); (c) no use of nutritional supplements or meal replacers, or life style changes like exercise; (d) measurement of at least one of the following cardiometabolic risk factors: weight, fasting total cholesterol, HDL-C, LDL-C, TAGs, glucose, insulin, or blood pressure (BP); (e) reported daily nutrient intake based on food diaries or recalls; (f) not intermediate measurements; and (g) full text available in English. The study selection was performed by two authors (EF and RPM). When inconclusive, the eligibility of the studies was discussed until consensus was reached.

2.3. Data Collection

Data was extracted from each of the selected articles and summarized in a spreadsheet. Information regarding study design, duration, participants, diet composition, and the available data on the above-mentioned cardiometabolic risk markers was extracted. Nutrients were expressed as energy percentages (E%), except for intakes of energy, cholesterol, and fiber which were expressed in kcal, milligrams, and grams, respectively. If needed, plasma and serum markers (total cholesterol, LDL-C, HDL-C, TAG, and glucose) were converted to mmol/L and insulin concentrations to μU/mL. Based on CHO intake, studies were allocated to one of the three different groups: moderate-low CHO diets (group 1, <45–40 E% CHO), low CHO diets (group 2, <40–30 E%), and very-low CHO diets (group 3, <30–3 E%). These three groups were defined after inventory of the included studies in order to create comparable group sizes.

2.4. Statistical Analyses

All statistical analyses were performed with Stata 12.1 software (Stata Corporation, College Station, TX, USA). For cross-over studies, diet effects were calculated by subtracting the mean value at the end of the control period from the mean value at the end of the intervention period. For parallel-designed studies, mean changes in the control group were subtracted from the mean changes in the intervention group. Mean changes were defined as the difference between the measurements before and after treatment. The same procedure was followed for calculating the differences in nutrient intakes. Multiple study arms were included when the amounts of CHO in treatment and control groups corresponded to the inclusion criteria.
Summary estimates of weighted mean differences (WMDs) in weight, total cholesterol, LDL-C, HDL-C, TAGs, glucose, insulin, systolic and diastolic BP, and 95% confidence intervals were determined using fixed-effect meta-analyses and visualized using forest plots. As weighing factor, the inverse of the between-subject variance was used (1/SE2). For each outcome parameter, heterogeneity between studies was assessed with the Cochran’s Q test and expressed as the I2 statistic [17]. The I2 statistic is the percentage of variability in the effect estimate caused by heterogeneity. In case of relevant heterogeneity between studies (I2 > 50%), random-effect meta-analyses were performed. Subgroup analyses were performed to evaluate changes in body weight, saturated fatty acid (SFA) and protein intakes, the health status of the study population (healthy, overweight/obese, or metabolically impaired), study design (parallel and cross-over), and study duration (≤1 month, ≤6 months, and >6 months), as potential sources of heterogeneity between studies. For the continuous variables (changes in body weight, SFA and protein intakes), the median effect estimates were used as cut-off values to create two subgroups within each variable, e.g., lower or equal to vs. higher than the median changes.
To assess differences in the selected outcome parameters between the CHO groups, univariate meta-regression analyses were performed. The CHO groups were treated as factor variables and two-sided tests were performed, using the moderate-low CHO group as a reference. A p-value of <0.05 was considered as statistically significant.
For all parameters, publication bias was determined within each CHO group by visual inspection of funnel plots and by assessing funnel plot asymmetry with the Egger’s weighted regression test [18]. Absence of publication bias is indicated by an intercept close to 0 with a corresponding p-value ≥ 0.05. Funnel plot asymmetry was not detected for any of the outcome parameters within the three CHO groups, as shown by insignificant results of the Egger’s test (data not shown). Therefore, it can be assumed that no publication was present based on the selected studies in this review.

3. Results and Discussion

The systematic database search retrieved 1322 potentially relevant papers. After title and abstract screening, 190 papers remained for the full text screening. Finally, 37 papers were included in the systematic review. A flowchart of the study selection process is presented in Figure 1.

3.1. Group 1: Effects of Moderate-Low CHO Diets (<45–40 E%)

Thirteen studies were identified that compared the effects of a moderate-low CHO (<45–40 E%) to an MCD (45–55 E%). Four studies were carried out in type 2 diabetes patients [19,20,21,22], four studies in overweight or obese participants [23,24,25,26], two studies in non-obese men with elevated TAGs [27,28], and three studies in healthy volunteers [29,30,31]. Study durations varied between 3 weeks and 18 months. Study characteristics are shown in Table 1.
Overall, the moderate-low CHO diets resulted in significant weight loss (−0.91 kg, 95% CI −1.59 to −0.23 kg, p = 0.009, Figure 2). In five studies [20,22,23,24,25], energy restriction was intended in both diet groups, while eight studies intended to keep energy intake stable on both diets [19,21,26,27,28,29,30,31]. Of the eleven studies that reported changes in body weight, only two studies showed a significant weight reduction in the moderate-low CHO group compared to the MCD group [19,24]. Six studies [20,22,23,25,26,27] did not find significant differences between both groups, but reported comparable weight losses due to a lower energy intake in both diet groups. Three studies [21,30,31] found no changes in body weight in both intervention groups. These studies kept energy intake stable during the study.
The moderate-low CHO diets did not result in significant changes in total cholesterol (−0.05 mmol/L, 95% CI −0.19 to 0.08 mmol/L, p = 0.413, Supplementary Figure S1A) and LDL-C (0.01 mmol/L, 95% CI −0.16 to 0.17 mmol/L, p = 0.941, Figure 3). Total cholesterol and LDL-C concentrations were measured in eleven studies and increased in two studies [21,29], while decreases were observed in three studies [22,28,31]. Ebbeling et al. [26] only measured LDL-C and reported higher concentrations in the LCD group. Increased LDL-C concentrations were found when CHO was solely exchanged for fat, especially SFA [26,29], or when fiber intake decreased [21]. In two studies [22,31], a decrease in LDL-C was found, when CHO was mainly exchanged by protein. Pieke et al. [28] and Vidon et al. [29] both exchanged 14 E% of CHO by comparable amounts of fat (12 and 13 E% respectively) and protein (1.6 and 1.1 E% respectively). With a 10 E% increase in SFA intake, Vidon et al. [29] found an increase in total cholesterol and LDL-C. Pieke et al. [28] reported a significant decrease in total cholesterol by keeping SFA intake comparable between groups and increasing the intake of unsaturated fatty acids (UFAs). De Natale et al. [21] reported significant increases in total cholesterol and LDL-C, when SFA intake was kept constant and UFA intake was increased. However, daily fiber intake decreased by 36 g on the LCD (Supplementary Table S1).
HDL-C concentrations were not significantly affected by the moderate-low CHO diets (0.06 mmol/L, 95% CI −0.05 to 0.15 mmol/L, p = 0.326, Supplementary Figure S1B). HDL-C increased in five studies [21,26,28,29,30] that all increased SFA intakes. TAG concentrations were significantly lower compared to the MCDs (−0.10 mmol/L, 95% CI −0.14 to −0.06 mmol/L, p < 0.001, Figure 4). In the study of Wolfe et al. [31], TAG concentrations decreased with a 10 E% increase in protein intake, while fat intake remained unchanged. It has been shown that an increase in omega-3 polyunsaturated fatty acids (PUFAs) from fish oil can reduce TAGs [32]. However, only one study that observed lower TAGs with higher PUFA intakes [28] provided information about the marine origin of the PUFAs (Supplementary Table S1).
The moderate-low CHO diets did not affect glucose (0.05 mmol/L, 95% CI −0.22 to 0.31 mmol/L, p = 0.730, Supplementary Figure S1C) and insulin concentrations (−0.31 mmol/L, 95% CI −2.61 to 1.98 mmol/L, p = 0.789, Supplementary Figure S1D). Glucose concentrations were measured in five studies, but no significant decreases were observed. Vidon et al. [29] only found significant increases in both glucose and insulin concentrations, while another study found a reduction in insulin compared to the MCD [23]. No other studies reported significant changes in insulin concentrations.
In two studies, systolic [25] or diastolic [24] BP decreased significantly. Overall, systolic (−4.05 mmHg, 95% CI −4.99 to −3.10 mmHg, p < 0.001, Supplementary Figure S1E). And diastolic (−2.64 mmHg, 95% CI −3.32 to −1.96 mmHg, p < 0.001, Supplementary Figure S1F) BP decreased significantly on the moderate-low CHO diets.

3.2. Group 2: Effects of Low CHO Diets (<40–30 E%)

Sixteen studies were identified that compared a low CHO diet (<40–30 E%) to a MCD in different population groups: type 2 diabetes patients [33,34,35,36], patients with at least one characteristic of the metabolic syndrome [37] or one cardiac risk factor [38], overweight or obese participants [39,40,41,42,43] with or without type 2 diabetes [44] and/or metabolic syndrome [45], and healthy volunteers [46,47,48]. Study durations varied between 2 weeks and 24 months. Study characteristics are shown in Table 2.
Compared to the MCDs, overall weight loss in the low CHO group was significantly more pronounced (−1.52 kg, 95% CI −2.92 to −0.12 kg, p = 0.034, Figure 2). In five of the 16 studies [35,37,40,41,46], energy restriction was intended in both diet groups. Six studies intended to keep energy intake stable on both diets [34,36,38,39,47,48]. In four studies, a non-energy restricted LCD was compared to an energy restricted diet [33,43,44,45]. In only six studies, the LCD groups showed significant weight losses [40,41,42,43,45,46]. Gardner et al. [42] compared an ad libitum LCD to [1] an energy-restricted MCD and to [2] an isocaloric MCD without energy restriction. Significant weight loss was only observed in the first comparison. After a period of six months, Brehm et al. [43] reported the highest weight loss (6.3 kg), although the reported daily energy intake in the LCD group was 154 kcal higher than in the MCD group. Another study [38] showed a higher energy intake in the LCD groups with no significant effects on body weight after 24 weeks.
The low CHO diets significantly increased total cholesterol (0.21 mmol/L, 95% CI 0.03 to 0.39 mmol/L, p = 0.025, Supplementary Figure S1A), LDL-C (0.11 mmol/L, 95% CI 0.02 to 0.20 mmol/L, p = 0.016, Figure 3), and HDL-C concentrations (0.06 mmol/L, 95% CI 0.05 to 0.11 mmol/L, p < 0.001, Supplementary Figure S1B). Seven studies, in which SFA intake was increased, found increased HDL-C concentrations [36,39,40,42,44,47,48]. Two of these studies [39,47], in which also fiber intake decreased, also reported higher total cholesterol and/or LDL-C. Gardner et al. [42] compared an LCD with two different MCDs, which resulted in CHO reductions of 9.4 E% and 16 E%. With the highest decrease in CHO intake and the highest increase in fat intake (13 E%), HDL-C concentrations increased significantly. The lowest CHO reduction resulted in significantly lower TAG concentrations. Five other studies found significantly reduced TAGs [39,40,43,44,45], two of which reported increased PUFA intakes of 1.9 E% [40] and 4.1 E% [43]. Gardner et al. [39] increased fat intake by 15 E% and reported a change in fatty-acid composition of +5 E% SFA and of −2 E% monounsaturated fatty acids (MUFA). Although not reported, it can be assumed that PUFA intake increased as well (Supplementary Table S2). Borkman et al. [48] achieved the highest reduction in CHO (−24 E%) as well as protein intakes (−6.1 E%), which were replaced by SFA (15 E%) and MUFA (13 E%) and did not find significant effects on plasma TAGs (Supplementary Table S1). Overall, TAG concentrations significantly decreased in the low CHO group (−0.18 mmol/L, 95% CI −0.26 to −0.11 mmol/L, p < 0.001, Figure 4).
Glucose (−0.04 mmol/L, 95% CI −0.19 to 0.10 mmol/L, p = 0.556, Supplementary Figure S1C) and insulin concentrations (−0.80 mmol/L, 95% CI −2.06 to 0.46 mmol/L, p = 0.212, Supplementary Figure S1D) were not significantly affected by the low CHO diets. Glucose concentrations were measured in 14 studies, but significant effects were only observed in two studies. One study found a significant decrease in plasma glucose, which was accompanied by a reduction in insulin [45], and another study found a significant increase in glucose without any effects on insulin [47]. No further effects on insulin were reported.
Overall effects on systolic (−0.40 mmHg, 95% CI −2.24 to 1.44 mmHg, p = 0.671, Supplementary Figure S1E) and diastolic BP (−1.31 mmHg, 95% CI −2.79 to 0.17 mmHg, p = 0.082, Supplementary Figure S1F) were not significant in the low CHO group. Straznicky et al. [47] found higher systolic and diastolic BP, while Klemsdaal et al. [37] observed a decrease in diastolic BP. Gardner et al. [42] found significant decreases in systolic BP when CHO intake was reduced by 9.4 E% and decreases in systolic and diastolic BP when CHO intake was decreased by 16 E%.

3.3. Group 3: Effects of Very Low-Carbohydrate Diets (<30–3 E%)

Eight studies were identified that assessed the effect of a very low-carbohydrate diet (<30–3 E%) compared to a MCD in type 2 diabetes patients [49,50], overweight or obese participants [51], patients with abdominal obesity [52] and at least one other metabolic syndrome risk factor [53], participants with elevated TAGs [54], and healthy men [55,56]. Study durations varied between 1 week and 12 months. Study characteristics are shown in Table 3.
Overall weight loss was significantly higher with the very-low CHO diets compared to the MCDs (−1.62 kg, 95% CI −2.64 to −0.60 kg, p = 0.002, Figure 2). In two studies [50,53], energy restriction was intended in both diet groups, while five studies intended to keep energy intake stable on both diets [49,52,54,55,56]. Two studies reported significant weight losses [51,55] without reductions in reported energy intakes. In one of these studies [51], the aim was to compare a non-energy restricted LCD to an energy-restricted MCD.
Total cholesterol was not significantly affected by the very-low CHO diets (0.26 mmol/L, 95% CI −0.02 to 0.54 mmol/L, p = 0.074, Supplementary Figure S1A), while LDL-C (0.32 mmol/L, 95% CI 0.08 to 0.56 mmol/L, p = 0.010, Figure 3) and HDL-C concentrations (0.13 mmol/L, 95% CI 0.11 to 0.16 mmol/L, p < 0.001, Supplementary Figure S1B) were significantly higher. In two studies, total cholesterol, LDL-C, and HDL-C significantly increased with higher SFA and dietary cholesterol intakes in the very-low CHO group [52,53]. Brehm et al. [51] only found increases in HDL-C, but no information on the fatty acid composition of the LCD was given (Supplementary Table S3). Tay et al. [50] replaced CHO mainly by UFAs and proteins, and found increased HDL-C concentrations, as well as decreased TAG concentrations. In contrast, Brinkworth et al. [53] reported significantly lower TAGs with a more pronounced decrease in CHO intake, but much higher increases in SFA and lower increases in PUFA intakes (Supplementary Table S3). Overall, TAG concentrations significantly decreased in the very-low CHO group (−0.27 mmol/L, 95% CI −0.43 to −0.10 mmol/L, p = 0.001, Figure 4).
Glucose was not significantly affected by the very-low CHO diets (0.08 mmol/L, 95% CI −0.11 to 0.26 mmol/L, p = 0.406, Supplementary Figure S1C), while insulin was significantly lower (−0.86 mmol/L, 95% CI −1.61 to −0.11 mmol/L, p = 0.025, Supplementary Figure S1D). One study [52] found significantly increased plasma glucose levels, while insulin was not significantly affected in any of the studies.
No effects on systolic (−0.21 mmHg, 95% CI −3.06 to 2.63 mmHg, p = 0.884, Supplementary Figure S1E) and diastolic BP (1.53 mmHg, 95% CI −1.20 to 4.25 mmHg, p = 0.271, Supplementary Figure S1F) were detected.

3.4. Effects of the Degree of CHO Restriction
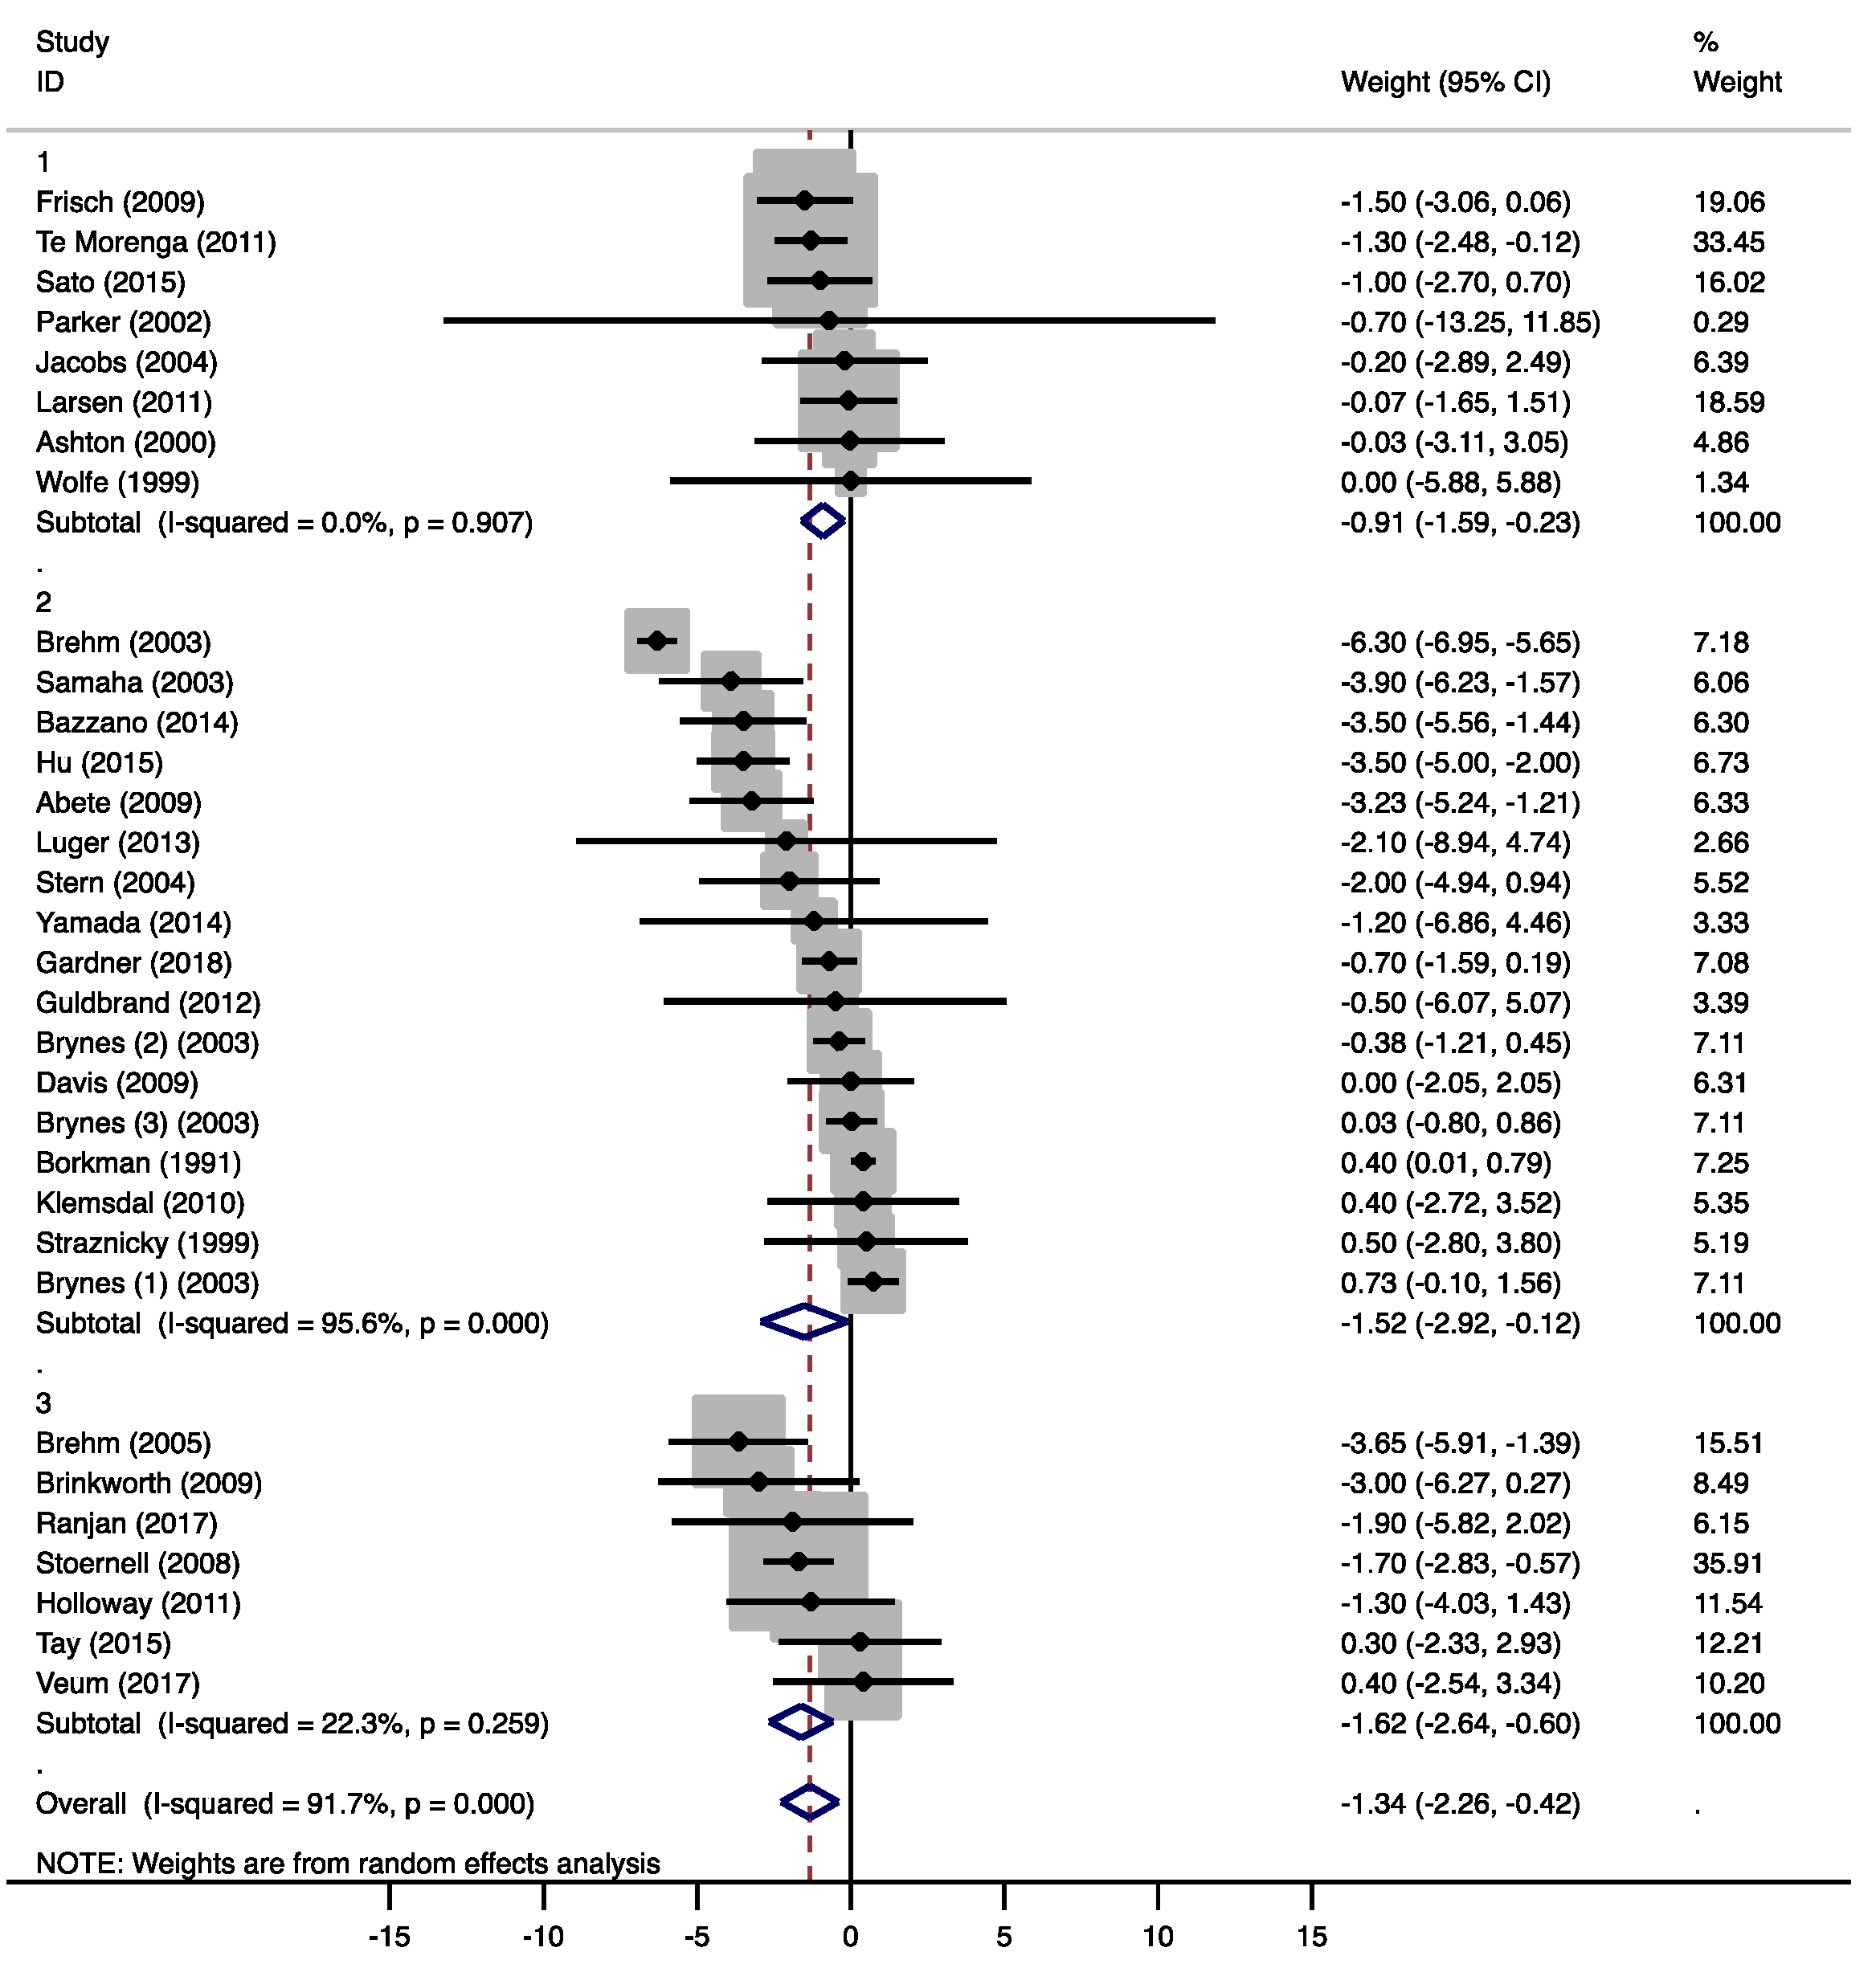
3.4.1. Weight

Combining the results of all LCD groups, a significant weight loss (−1.34 kg, 95% CI −2.26 to −0.42 kg, p = 0.004) was observed. Differences between the groups did not however reach statistical significance (group 2 vs. 1: −0.89 kg, 95% CI −2.35 to 0.58 kg, p = 0.226; group 3 vs. 1: −0.95 kg, 95% CI −2.72 to 0.82 kg, p = 0.280, Figure 2 and Supplementary Figure S2A). A meta-analysis by Johnston et al. [57] also found that significant weight loss was found with any low-carbohydrate diet and that weight loss differences between the diets were small. In most studies, weight loss was due to a lower energy intake, although energy intake was often not explicitly restricted in the LCD groups. The unintended reduction in energy intake can be explained by the satiating effect of fat and protein, an appetite-suppressing effect of ketones, as well as increased attention to dietary behavior [58,59]. However, not all studies that showed a significant weight loss effect of the LCD reported a lower energy intake compared to the MCD. The authors explained these findings by unreliable food records, or an increased energy expenditure caused by physical activity or possible thermogenic effects of the LCD [43,51].

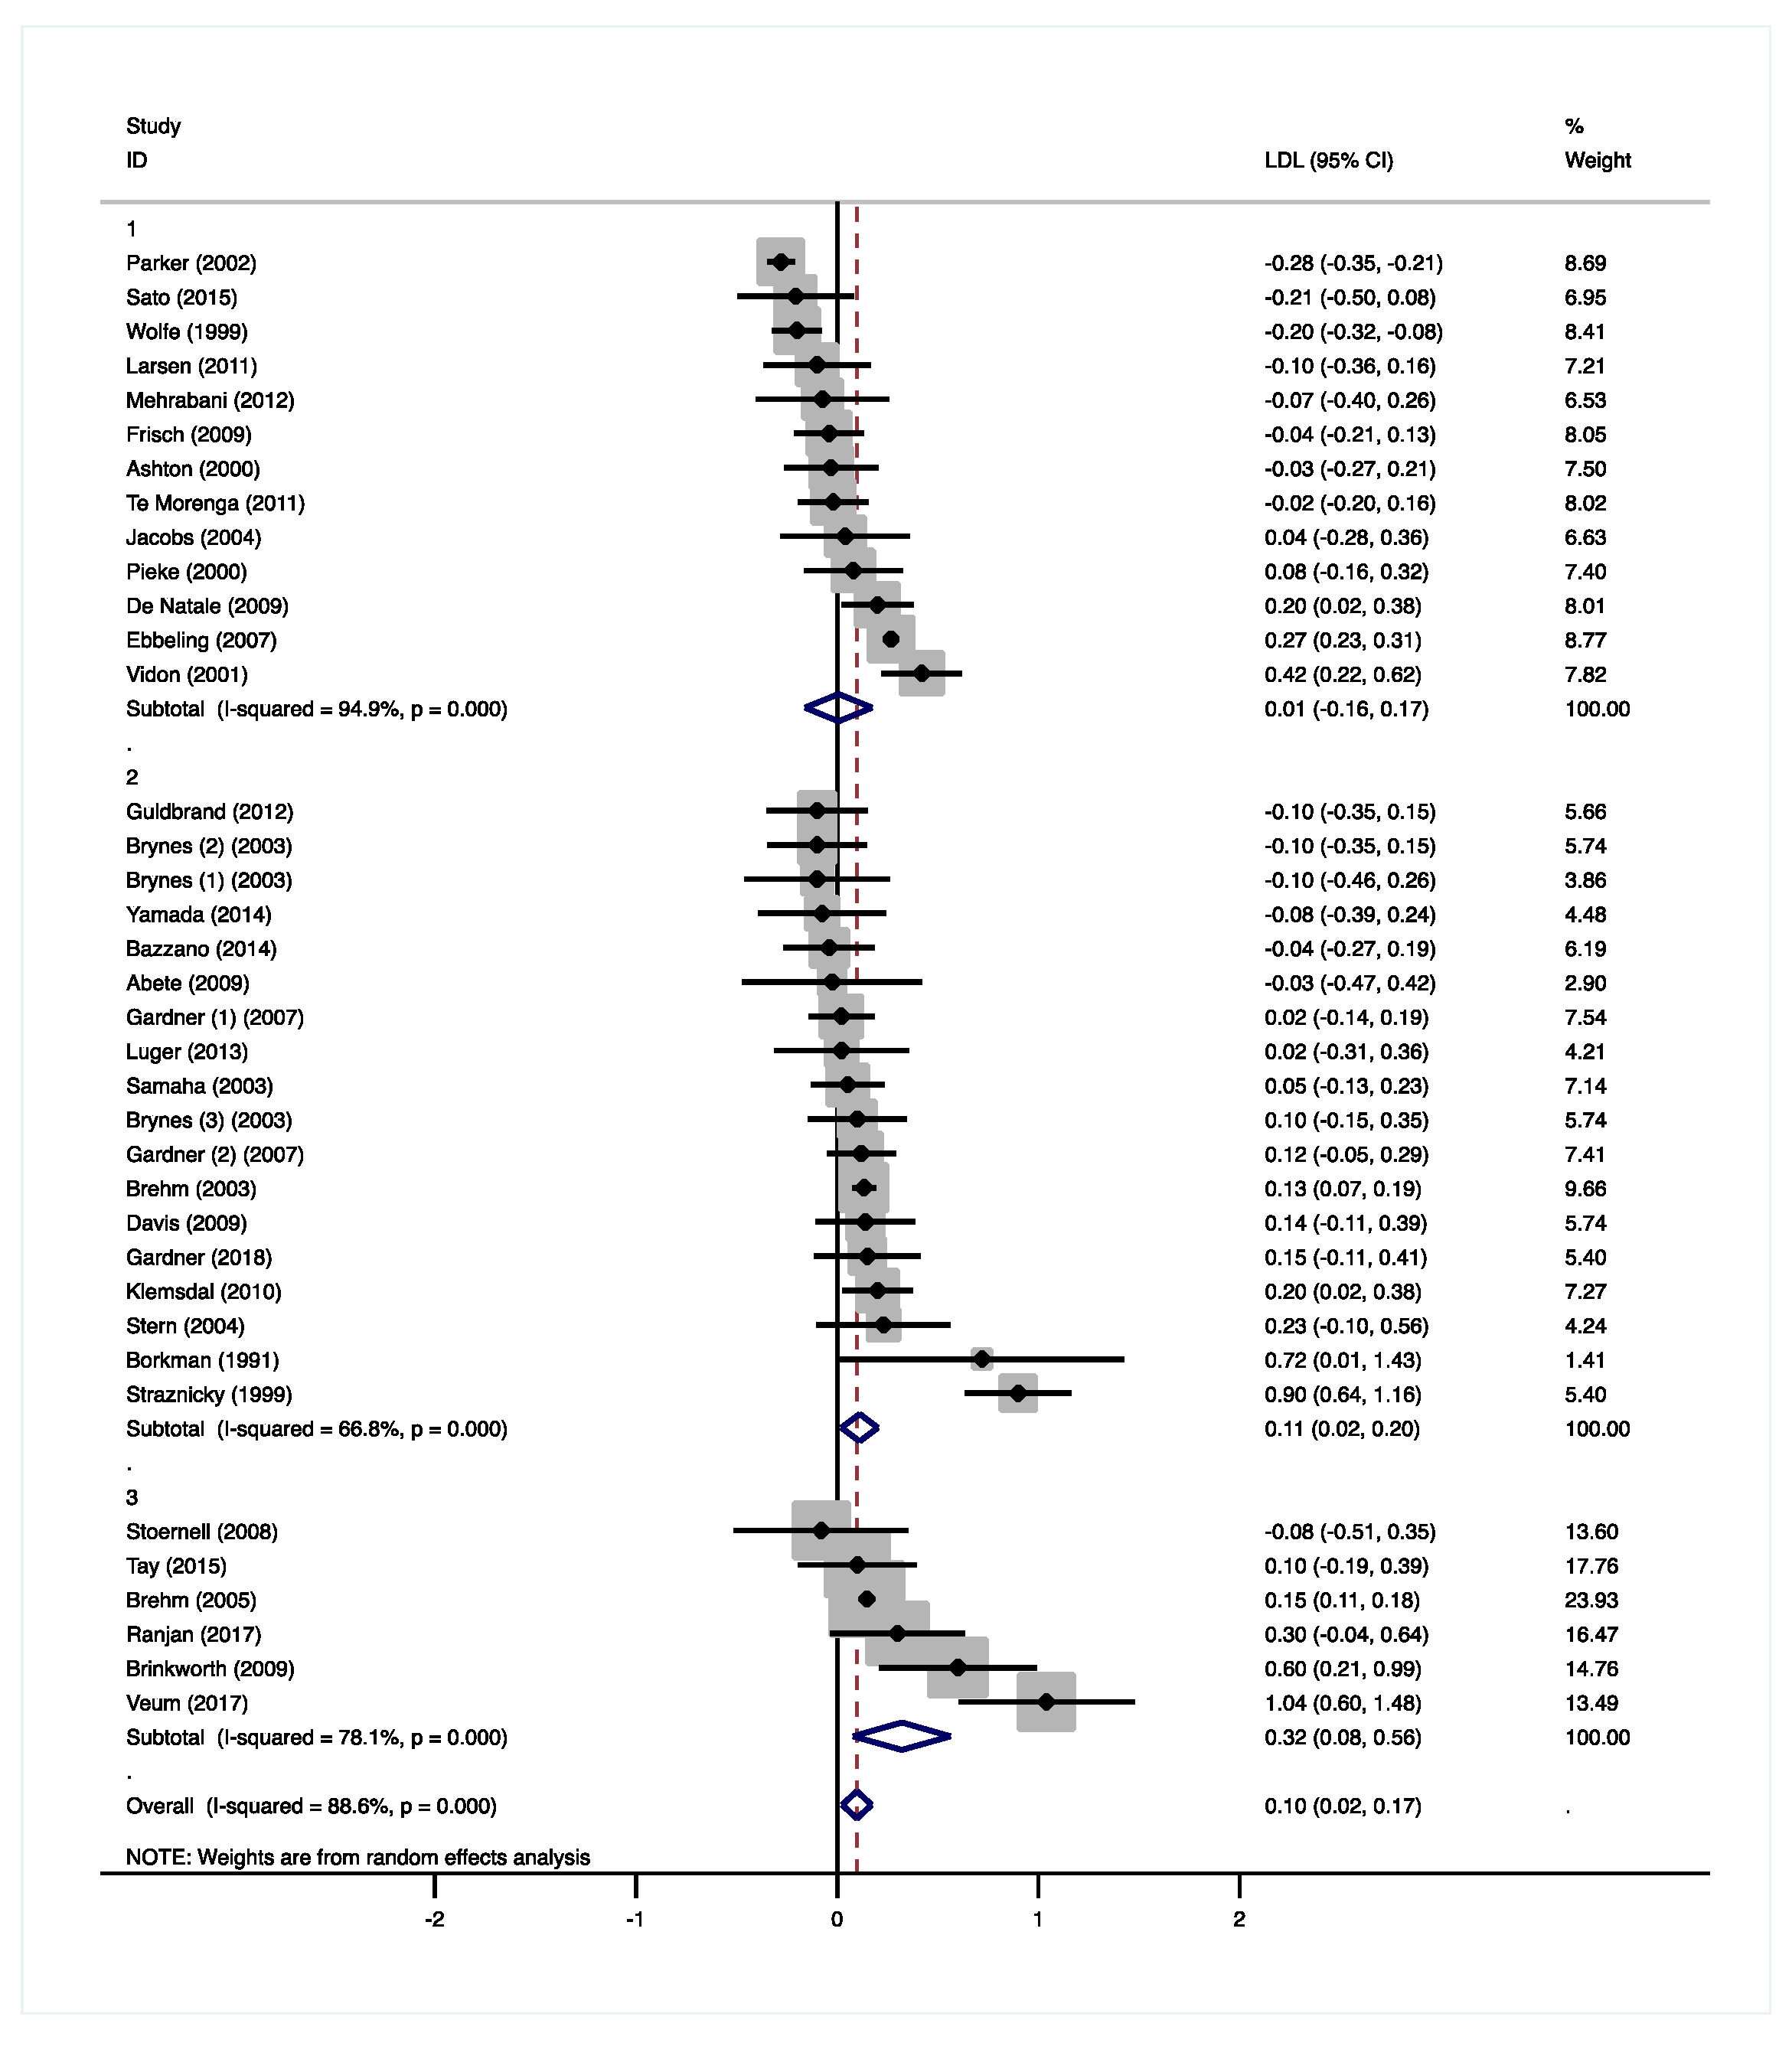
3.4.2. Total Cholesterol and LDL-Cholesterol

Overall, a significant increase in total cholesterol was observed with the LCDs (0.10 mmol/L, 95% CI 0.01 to 0.18 mmol/L, p = 0.029). Differences between the three CHO groups showed a trend towards statistical significance with lower total cholesterol levels in group 1 compared to the other two groups (group 2 vs. 1: 0.28 mmol/L, 95% CI −0.02 to 0.57 mmol/L, p = 0.066; group 3 vs. 1: 0.30 mmol/L, 95% CI −0.05 to 0.65 mmol/L, p = 0.086, Supplementary Figures S1A and S2B).
Compared to the MCDs, significantly higher LDL-C concentrations were observed with the LCDs (0.10 mmol/L, 95% CI 0.02 to 0.17 mmol/L, p = 0.009). These effects were significantly different between the three CHO groups with more pronounced increases in the very-low CHO diet compared to the moderate-low CHO diet (group 3 vs. 1: 0.35 mmol/L, 95% CI 0.07 to 0.62 mmol/L, p = 0.015, Figure 3 and Supplementary Figure S2C). Differences between the moderate-low and the low CHO group did not reach statistical significance (group 2 vs. 1: 0.13 mmol/L, 95% CI −0.08 to 0.33 mmol/L, p = 0.215). It is well-known that SFA [60], dietary cholesterol [61], as well as fiber intakes [13] affect plasma total and LDL-C concentrations. In this review, the studies that found increased total cholesterol and LDL-C concentrations reported increases in SFA intakes, which were often accompanied by increased dietary cholesterol or decreased fiber intakes (Supplementary Tables S1–S3).

3.4.3. HDL Cholesterol

Overall, HDL-C was significantly increased after the LCD interventions (0.08 mmol/L, 95% CI 0.04 to 0.13 mmol/L, p < 0.001). However, no significant differences were detected between the three CHO groups (group 2 vs. 1: 0.05 mmol/L, 95% CI −0.02 to 0.12 mmol/L, p = 0.173; group 3 vs. 1: 0.08 mmol/L, 95% CI −0.01 to 0.18 mmol/L, p = 0.070, Supplementary Figures S1B and S2D). The studies that found significant increases in HDL-C, all increased total fat intake in the form of SFAs or UFAs, or a combination of both (Supplementary Tables S1–S3). Previous research has shown that replacement of CHO for SFAs or UFAs increases HDL-C concentrations [14]. In addition, higher-protein diets are associated with higher HDL-C [62]. In this review, ten of the 15 studies that found increased HDL-C concentrations also reported increased protein intakes. However, it remains uncertain whether increased HDL-C concentrations per se have favorable effects on CVD risk [63], and the unfavorable changes in LDL-C should be considered as well [31,32].

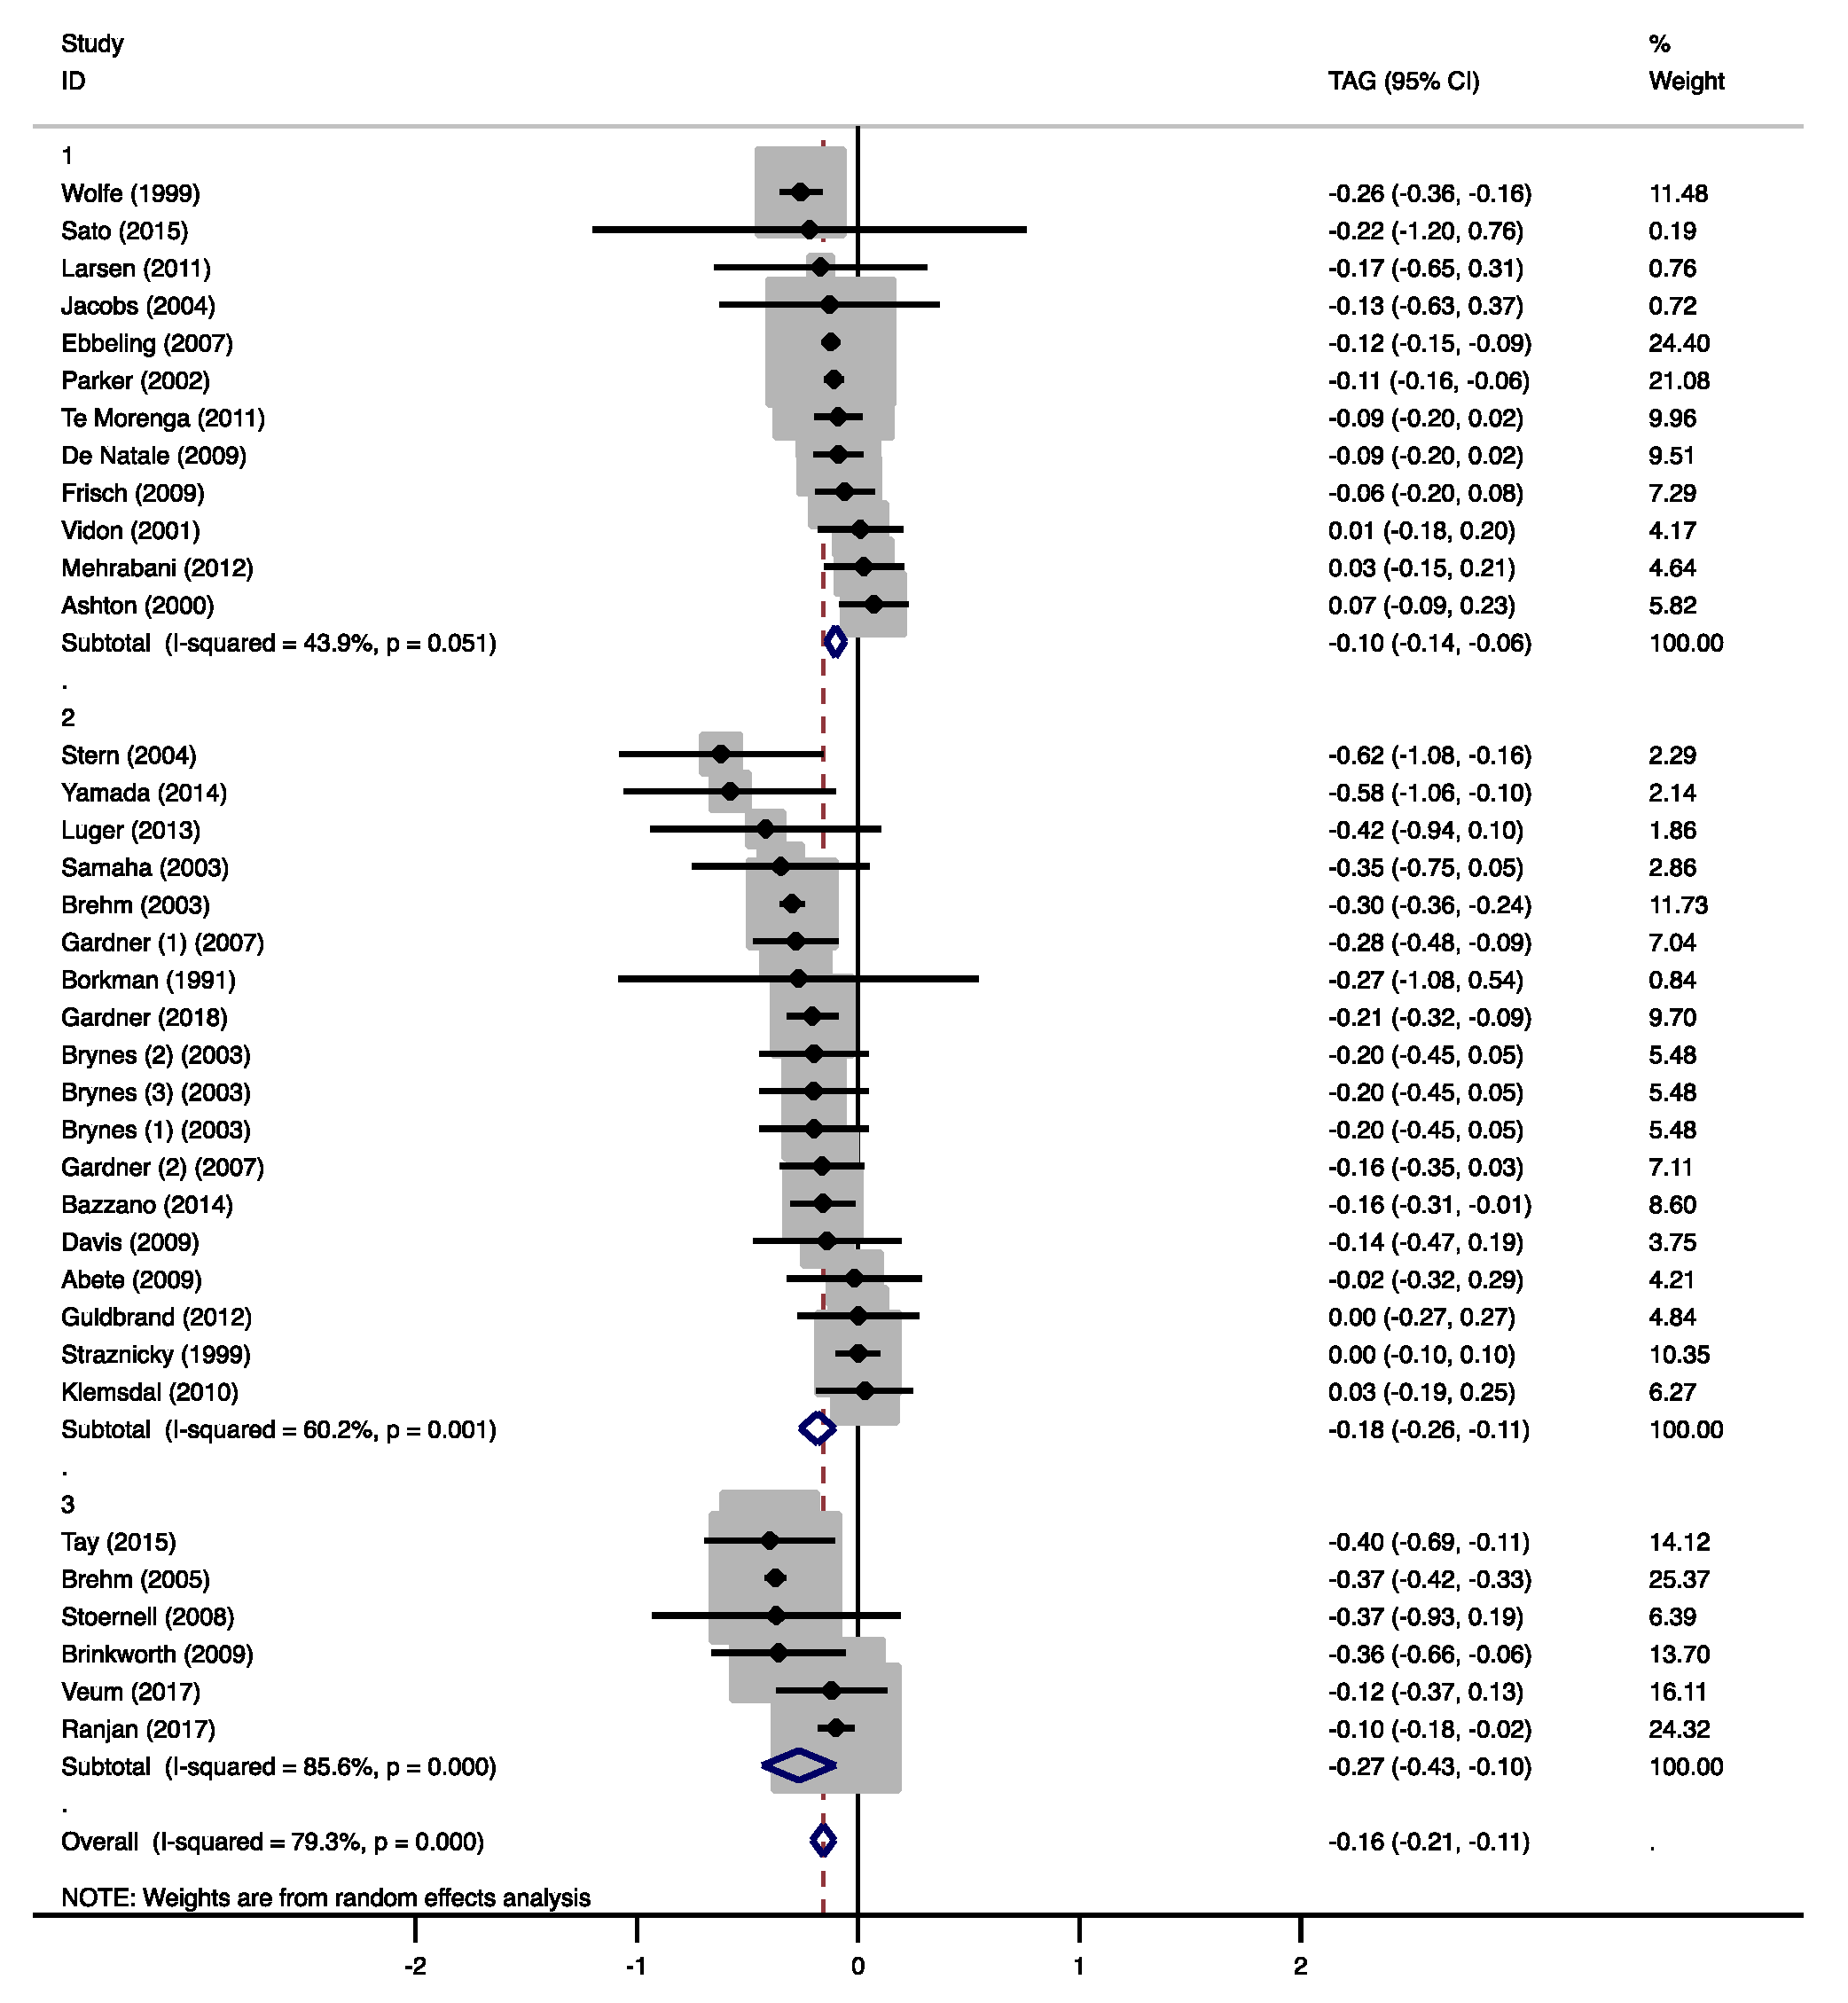
3.4.4. Triacylglycerol

Overall, TAG concentrations significantly decreased with the LCDs (−0.16 mmol/L, 95% CI −0.21 to −0.11 mmol/L, p < 0.001). Based on earlier studies [14,58], it was expected that a more pronounced CHO reduction would result in lower TAG concentrations. Indeed, significant differences between the CHO groups were detected (group 2 vs. 1: −0.13, 95% CI −0.25 to −0.01 mmol/L, p = 0.028; group 3 vs. 1: −0.19, 95% CI −0.35 to −0.04 mmol/L, p = 0.017, Figure 4 and Supplementary Figure S2E). The studies that showed beneficial effects on TAG concentrations and provided information on the fatty-acid composition, also reported an increase in PUFA intake (Supplementary Table S1).

3.4.5. Glucose and Insulin

For glucose (0.00 mmol/L, 95% CI −0.09 to 0.10 mmol/L, p = 0.921) and insulin (−0.60 μU/mL, 95% CI −1.46 to 0.26 μU/mL, p = 0.169), no overall significant effects were observed. There were also no significant differences between the CHO groups for glucose (group 2 vs. 1: −0.28 mmol/L, 95% CI −0.99 to 0.43 mmol/L, p = 0.420; group 3 vs. 1: −0.02, 95% CI −0.83 to 0.79 mmol/L, p = 0.961, Supplementary Figures S1C and S2F) and insulin (group 2 vs. 1: 0.09 μU/mL, 95% CI −3.90 to 4.08 μU/mL, p = 0.961; group 3 vs. 1: −0.02 μU/mL, 95% CI −4.95 to 4.91 μU/mL, p = 0.993, Supplementary Figures S1D and S2G).
LCDs resulted in increased glucose concentrations when compared to MCDs with a higher intake of fiber [47,52]. An increased fiber intake has been shown to improve glycemic control, insulin sensitivity, and plasma glucose levels [64]. A systematic review by Churuangsuk et al. [65] identified five meta-analyses that did not find significant effects of LCDs on glucose, as well as three meta-analyses without significant effects on insulin. The meta-analysis by Naude et al. [66] performed a subgroup analysis in diabetic and non-diabetic participants without finding significant effects on glucose concentrations in neither group.

3.4.6. Blood Pressure

For systolic BP (−1.1 mmHg, 95% CI −2.5 to 0.3 mmHg, p = 0.132), no overall significant effects were observed, whereas an overall significant reduction in diastolic BP (−1.1 mmHg, 95% CI −2.1 to −0.1 mmHg, p = 0.040) was found. The changes in systolic BP (group 2 vs. 1: 1.9 mmHg, 95% CI ‒2.2 to 6.0 mmHg, p = 0.354; group 3 vs. 1: 1.3 mmHg, 95% CI −3.7 to 6.4, p = 0.588 mmHg, Supplementary Figures S1E and S3A) and diastolic BP (group 2 vs. 1: 0.6 mmHg, 95% CI −2.1 to 3.4 mmHg, p = 0.635; group 3 vs. 1: 2.5 mmHg, 95% CI −0.9 to 5.9 mmHg, p = 0.138, Supplementary Figures S1F and S3B) did not depend on the degree of CHO restriction. It should be noted that in the majority of studies that reported BP, the LCD and the MCD both resulted in lower BP, without significant differences between the diets. It remains uncertain whether both diets were evenly effective, or whether BP decreased in both groups due to an acclimatization of the participants to the study environment. Other meta-analyses comparing LCDs with LFDs either found no significant differences between the diets in systolic and diastolic BP [66,67], or a more pronounced decrease in diastolic BP on the LCD [68,69].

3.5. Subgroup Analysis

Subgroup analyses suggested that health status (healthy, overweight/obese, or metabolically impaired) was a source of heterogeneity (Supplementary Table S4). Weight loss was significantly larger in overweight or obese compared to healthy participants (p = 0.039). In the metabolically impaired populations, increases in LDL-C were less pronounced compared to healthy participants (p = 0.033). Larger decreases in systolic BP were observed in the overweight or obese group compared to the healthy participants (p = 0.015).
Changes in weight loss were identified as a source of heterogeneity for TAG concentrations in the low CHO group, showing more pronounced decreases in the subgroup with higher weight loss (p = 0.036, overall effects are shown in Supplementary Table S5). In the subgroup with higher SFA intakes, higher overall increases in total cholesterol (p = 0.011), LDL-C (p = 0.015), and HDL-C (p = 0.037) concentrations were observed (Supplementary Table S6). Protein intake was a source of heterogeneity for overall LDL-C (p = 0.038) and glucose (p = 0.042) concentrations, as shown by less pronounced increases in the subgroups with an increased protein intake (Supplementary Table S7). The study design (parallel vs. cross-over) was related to overall weight loss (p = 0.021, Supplementary Table S8) with higher weight loss in parallel-designed studies. The study design also affected TAG concentrations in the very-low CHO group with less pronounced decreases in the cross-over designed studies (p = 0.038, data not shown). Study duration was associated with total cholesterol, LDL-C, and HDL-C concentrations in the low CHO group, as shown by more pronounced decreases in studies with durations exceeding one month (total cholesterol p < 0.001, LDL p < 0.001, HDL p = 0.007) and six months (total cholesterol p < 0.001, LDL p < 0.001, HDL p = 0.014), compared to studies with durations of less than one month (overall effects are shown in Supplementary Table S9).

4. Limitations

In this systematic review and meta-analysis, we compared the effects of different degrees of CHO reduction on cardiometabolic risk markers, and interpreted our findings by analyzing and discussing potential effects of the nutrients used for CHO substitution. One limitation of our study is that hardly any information was available on the different types of SFAs or PUFAs, which are known to have different metabolic effects [59]. In addition, the type of CHO, the glycemic index (GI), or the glycemic load (GL) of the intervention diets were often not described into detail. These limitations may have been additional sources of heterogeneity that could not be investigated.
Although non-fasting measurements, including the assessment of postprandial dyslipidemia and glycaemia, provide important information on metabolic health and CVD risk, the majorities of studies only reported fasting measurements. Postprandial TAGs have been independently associated with the incident of cardiovascular events [70], while increased postprandial glycemia is related to an increased risk of obesity, type 2 diabetes mellitus, and the metabolic syndrome [71]. The addition of non-fasting measurements is therefore important to fully assess the potential health benefits of dietary interventions.
Due to the large age diversity of the study populations between and within selected studies, and due to the inclusion of both men and women in the majority of studies, subgroup analyses to assess the effect of age and gender on cardiometabolic risk markers were not considered feasible. We recommend performing these subgroup analyses in future studies.

5. Conclusions

This meta-analysis showed that the LCDs resulted in small—but statistically significant—effects on weight loss, increases in HDL-C, and decreases in TAG concentrations and diastolic BP, compared to the MCDs. Decreases in TAG concentrations were more pronounced with lower CHO intakes. However, a higher degree of CHO restriction did not provide additional health benefits on the other CVD risk markers. In fact, LDL-C concentrations were the highest on the very-low CHO diets (<30–3 E%). These increases could be explained by higher intakes of SFA as replacement for CHO, as well as a decreased fiber intake which often accompanies CHO reduction. Therefore, our results suggest that potential benefits and risks of LCDs are rather related to CHO replacement than CHO restriction per se. Future studies should therefore also focus on the types of foods used as CHO substitute.

Supplementary Materials

The following are available online at https://www.mdpi.com/2072-6643/12/4/991/s1. Table S1. Changes in the compositions of the moderate low-carbohydrate diets (<45–40 E%), Table S2. Changes in the compositions of the low-carbohydrate diets (<40–30 E%), Table S3. Changes in the compositions of the very low-carbohydrate diets (<30–3 E%), Table S4. Effect of health status on cardiovascular disease (CVD) risk markers, Table S5. Effect of weight loss on CVD risk markers, Table S6. Effect of SFA-intake on CVD risk markers, Table S7. Effect of protein-intake on CVD risk markers, Table S8. Effect of study design on CVD risk markers, Table S9. Effect of study duration on CVD risk markers, Figure S1A. Forest plots of randomized controlled trials that examined the effects of CHO restriction on total cholesterol concentrations, Figure S1B. Forest plots of randomized controlled trials that examined the effects of CHO restriction on HDL-C concentrations, Figure S1C. Forest plots of randomized controlled trials that examined the effects of CHO restriction on plasma glucose concentrations, Figure S1D. Forest plots of randomized controlled trials that examined the effects of CHO restriction on serum insulin concentrations, Figure S1E. Forest plots of randomized controlled trials that examined the effects of CHO restriction on systolic blood pressure, Figure S1F. Forest plots of randomized controlled trials that examined the effects of CHO restriction on diastolic blood pressure, Figure S2. Comparison of the diet effects of the moderate-low (<45–40 E%), low (<40–30 E%), and very low (<30–3 E%) carbohydrate groups on (A) weight, (B) total cholesterol, (C) LDL-cholesterol, (D) HDL-cholesterol, (E) triacylglycerol, (F) glucose, and (G) insulin, Figure S3. Comparison of the diet effects of the moderate low (<45–40 E%), low (<40–30 E%), and very low (<30–3 E%) carbohydrate groups on (A) systolic and (B) diastolic blood pressure.

Author Contributions

E.F. and R.P.M. designed the study, conducted the literature review, interpreted the data and wrote the manuscript. E.T.H.C.S. performed the statistical analyses. E.T.H.C.S. and P.S. reviewed and edited the manuscript. E.F. and R.P.M. had primary responsibility for the final content of the manuscript. All authors have read and approved the final manuscript.

Funding

This research received no external funding.

Acknowledgments

The authors would like to thank Peter J. Joris for critically reviewing the manuscript.

Conflicts of Interest

The authors declare no conflict of interest.

References

  1. Arora, S.K.; McFarlane, S.I. The case for low carbohydrate diets in diabetes management. Nutr. Metab. 2005, 2, 16. [Google Scholar] [CrossRef] [Green Version]
  2. Hall, K.D.; Chung, S.T. Low-carbohydrate diets for the treatment of obesity and type 2 diabetes. Curr. Opin. Clin. Nutr. Metab. Care 2018, 21, 308–312. [Google Scholar] [CrossRef] [PubMed]
  3. Hu, T.; Bazzano, L.A. The low-carbohydrate diet and cardiovascular risk factors: Evidence from epidemiologic studies. Nutr. Metab. Cardiovasc. Dis. 2014, 24, 337–343. [Google Scholar] [CrossRef] [Green Version]
  4. Bilsborough, S.A.; Crowe, T.C. Low-carbohydrate diets: What are the potential short- and long-term health implications? Asia Pac. J. Clin. Nutr. 2003, 12, 396–404. [Google Scholar] [PubMed]
  5. EFSA (European Food Safety Authority). Dietary Reference Values for nutrients. Summary Report. EFSA Supporting Publ. 2017, 14, e15121. [Google Scholar] [CrossRef] [Green Version]
  6. Brouns, F. Overweight and diabetes prevention: Is a low-carbohydrate-high-fat diet recommendable? Eur. J. Nutr. 2018, 57, 1301–1312. [Google Scholar] [CrossRef] [PubMed] [Green Version]
  7. Westman, E.C.; Feinman, R.D.; Mavropoulos, J.C.; Vernon, M.C.; Volek, J.S.; Wortman, J.A.; Yancy, W.S.; Phinney, S.D. Low-carbohydrate nutrition and metabolism. Am. J. Clin. Nutr. 2007, 86, 276–284. [Google Scholar] [CrossRef]
  8. Johnstone, A.M.; Horgan, G.W.; Murison, S.D.; Bremner, D.M.; Lobley, G.E. Effects of a high-protein ketogenic diet on hunger, appetite, and weight loss in obese men feeding ad libitum. Am. J. Clin. Nutr. 2008, 87, 44–55. [Google Scholar] [CrossRef] [Green Version]
  9. Bergqvist, A.G.C. Long-term monitoring of the ketogenic diet: Do’s and Don’ts. Epilepsy Res. 2012, 100, 261–266. [Google Scholar] [CrossRef]
  10. Johnston, C.S.; Tjonn, S.L.; Swan, P.D.; White, A.; Hutchins, H.; Sears, B. Ketogenic low-carbohydrate diets have no metabolic advantage over nonketogenic low-carbohydrate diets. Am. J. Clin. Nutr. 2006, 83, 1055–1061. [Google Scholar] [CrossRef]
  11. Saslow, L.R.; Kim, S.; Daubenmier, J.J.; Moskowitz, J.T.; Phinney, S.D.; Goldman, V.; Murphy, E.J.; Cox, R.M.; Moran, P.; Hecht, F.M. A randomized pilot trial of a moderate carbohydrate diet compared to a very low carbohydrate diet in overweight or obese individuals with type 2 diabetes mellitus or prediabetes. PLoS ONE 2014, 9, e91027. [Google Scholar] [CrossRef] [PubMed] [Green Version]
  12. Harvey, C.J.D.C.; Schofield, G.M.; Zinn, C.; Thornley, S.J.; Crofts, C.; Merien, F.L.R. Low-carbohydrate diets differing in carbohydrate restriction improve cardiometabolic and anthropometric markers in healthy adults: A randomised clinical trial. Peerj 2019, 7. [Google Scholar] [CrossRef] [PubMed]
  13. Brown, L.; Rosner, B.; Willett, W.W.; Sacks, F.M. Cholesterol-lowering effects of dietary fiber: A meta-analysis. Am. J. Clin. Nutr. 1999, 69, 30–42. [Google Scholar] [CrossRef] [PubMed]
  14. Mensink, R.P.; Zock, P.L.; Kester, A.D.; Katan, M.B. Effects of dietary fatty acids and carbohydrates on the ratio of serum total to HDL cholesterol and on serum lipids and apolipoproteins: A meta-analysis of 60 controlled trials. Am. J. Clin. Nutr. 2003, 77, 1146–1155. [Google Scholar] [CrossRef]
  15. Chandalia, M.; Garg, A.; Lutjohann, D.; von Bergmann, K.; Grundy, S.M.; Brinkley, L.J. Beneficial effects of high dietary fiber intake in patients with type 2 diabetes mellitus. N. Engl. J. Med. 2000, 342, 1392–1398. [Google Scholar] [CrossRef]
  16. Liberati, A.; Altman, D.G.; Tetzlaff, J.; Mulrow, C.; Gotzsche, P.C.; Ioannidis, J.P.A.; Clarke, M.; Devereaux, P.J.; Kleijnen, J.; Moher, D. The PRISMA Statement for Reporting Systematic Reviews and Meta-Analyses of Studies That Evaluate Health Care Interventions: Explanation and Elaboration. Ann. Intern. Med. 2009, 151, W65–W94. [Google Scholar] [CrossRef] [Green Version]
  17. Higgins, J.P.T.; Thompson, S.G. Quantifying heterogeneity in a meta-analysis. Stat. Med. 2002, 21, 1539–1558. [Google Scholar] [CrossRef]
  18. Egger, M.; Smith, G.D.; Schneider, M.; Minder, C. Bias in meta-analysis detected by a simple, graphical test. Bmj-Brit. Med. J. 1997, 315, 629–634. [Google Scholar] [CrossRef] [Green Version]
  19. Sato, J.; Kanazawa, A.; Makita, S.; Hatae, C.; Komiya, K.; Shimizu, T.; Ikeda, F.; Tamura, Y.; Ogihara, T.; Mita, T.; et al. A randomized controlled trial of 130 g/day low-carbohydrate diet in type 2 diabetes with poor glycemic control. Clin. Nutr. 2017, 36, 992–1000. [Google Scholar] [CrossRef]
  20. Larsen, R.N.; Mann, N.J.; Maclean, E.; Shaw, J.E. The effect of high-protein, low-carbohydrate diets in the treatment of type 2 diabetes: A 12 month randomised controlled trial. Diabetologia 2011, 54, 731–740. [Google Scholar] [CrossRef]
  21. De Natale, C.; Annuzzi, G.; Bozzetto, L.; Mazzarella, R.; Costabile, G.; Ciano, O.; Riccardi, G.; Rivellese, A.A. Effects of a plant-based high-carbohydrate/high-fiber diet versus high-monounsaturated fat/low-carbohydrate diet on postprandial lipids in type 2 diabetic patients. Diabetes Care 2009, 32, 2168–2173. [Google Scholar] [CrossRef] [PubMed] [Green Version]
  22. Parker, B.; Noakes, M.; Luscombe, N.; Clifton, P. Effect of a high-protein, high-monounsaturated fat weight loss diet on glycemic control and lipid levels in type 2 diabetes. Diabetes Care 2002, 25, 425–430. [Google Scholar] [CrossRef] [Green Version]
  23. Mehrabani, H.H.; Salehpour, S.; Amiri, Z.; Farahani, S.J.; Meyer, B.J.; Tahbaz, F. Beneficial effects of a high-protein, low-glycemic-load hypocaloric diet in overweight and obese women with polycystic ovary syndrome: A randomized controlled intervention study. J. Am. Coll. Nutr. 2012, 31, 117–125. [Google Scholar] [CrossRef] [Green Version]
  24. Te Morenga, L.A.; Levers, M.T.; Williams, S.M.; Brown, R.C.; Mann, J. Comparison of high protein and high fiber weight-loss diets in women with risk factors for the metabolic syndrome: A randomized trial. Nutr. J. 2011, 10. [Google Scholar] [CrossRef] [PubMed] [Green Version]
  25. Frisch, S.; Zittermann, A.; Berthold, H.K.; Gotting, C.; Kuhn, J.; Kleesiek, K.; Stehle, P.; Kortke, H. A randomized controlled trial on the efficacy of carbohydrate-reduced or fat-reduced diets in patients attending a telemedically guided weight loss program. Cardiovasc. Diabetol. 2009, 8. [Google Scholar] [CrossRef] [PubMed] [Green Version]
  26. Ebbeling, C.B.; Leidig, M.M.; Feldman, H.A.; Lovesky, M.M.; Ludwig, D.S. Effects of a low-glycemic load vs low-fat diet in obese young adults: A randomized trial. JAMA 2007, 297, 2092–2102. [Google Scholar] [CrossRef] [PubMed]
  27. Jacobs, B.; De Angelis-Schierbaum, G.; Egert, S.; Assmann, G.; Kratz, M. Individual serum triglyceride responses to high-fat and low-fat diets differ in men with modest and severe hypertriglyceridemia. J. Nutr. 2004, 134, 1400–1405. [Google Scholar] [CrossRef] [PubMed]
  28. Pieke, B.; von Eckardstein, A.; Gulbahce, E.; Chirazi, A.; Schulte, H.; Assmann, G.; Wahrburg, U. Treatment of hypertriglyceridemia by two diets rich either in unsaturated fatty acids or in carbohydrates: Effects on lipoprotein subclasses, lipolytic enzymes, lipid transfer proteins, insulin and leptin. Int. J. Obes. Relat. Metab. Disord. 2000, 24, 1286–1296. [Google Scholar] [CrossRef] [PubMed]
  29. Vidon, C.; Boucher, P.; Cachefo, A.; Peroni, O.; Diraison, F.; Beylot, M. Effects of isoenergetic high-carbohydrate compared with high-fat diets on human cholesterol synthesis and expression of key regulatory genes of cholesterol metabolism. Am. J. Clin. Nutr. 2001, 73, 878–884. [Google Scholar] [CrossRef] [Green Version]
  30. Ashton, E.L.; Pomeroy, S.; Foster, J.E.; Kaye, R.S.; Nestel, P.J.; Ball, M. Diet high in monounsaturated fat does not have a different effect on arterial elasticity than a low-fat, high-carbohydrate diet. J. Am. Diet. Assoc. 2000, 100, 537–542. [Google Scholar] [CrossRef]
  31. Wolfe, B.M.; Piche, L.A. Replacement of carbohydrate by protein in a conventional-fat diet reduces cholesterol and triglyceride concentrations in healthy normolipidemic subjects. Clin. Investig. Med. 1999, 22, 140–148. [Google Scholar]
  32. Harris, W.S. n-3 fatty acids and serum lipoproteins: Human studies. Am. J. Clin. Nutr. 1997, 65, 1645S–1654S. [Google Scholar] [CrossRef] [PubMed]
  33. Yamada, Y.; Uchida, J.; Izumi, H.; Tsukamoto, Y.; Inoue, G.; Watanabe, Y.; Irie, J.; Yamada, S. A non-calorie-restricted low-carbohydrate diet is effective as an alternative therapy for patients with type 2 diabetes. Intern. Med. 2014, 53, 13–19. [Google Scholar] [CrossRef] [PubMed] [Green Version]
  34. Luger, M.; Holstein, B.; Schindler, K.; Kruschitz, R.; Ludvik, B. Feasibility and efficacy of an isocaloric high-protein vs. standard diet on insulin requirement, body weight and metabolic parameters in patients with type 2 diabetes on insulin therapy. Exp. Clin. Endocrinol. Diabetes 2013, 121, 286–294. [Google Scholar] [CrossRef]
  35. Guldbrand, H.; Dizdar, B.; Bunjaku, B.; Lindstrom, T.; Bachrach-Lindstrom, M.; Fredrikson, M.; Ostgren, C.J.; Nystrom, F.H. In type 2 diabetes, randomisation to advice to follow a low-carbohydrate diet transiently improves glycaemic control compared with advice to follow a low-fat diet producing a similar weight loss. Diabetologia 2012, 55, 2118–2127. [Google Scholar] [CrossRef] [Green Version]
  36. Davis, N.J.; Tomuta, N.; Schechter, C.; Isasi, C.R.; Segal-Isaacson, C.J.; Stein, D.; Zonszein, J.; Wylie-Rosett, J. Comparative study of the effects of a 1-year dietary intervention of a low-carbohydrate diet versus a low-fat diet on weight and glycemic control in type 2 diabetes. Diabetes Care 2009, 32, 1147–1152. [Google Scholar] [CrossRef] [Green Version]
  37. Klemsdal, T.O.; Holme, I.; Nerland, H.; Pedersen, T.R.; Tonstad, S. Effects of a low glycemic load diet versus a low-fat diet in subjects with and without the metabolic syndrome. Nutr. Metab. Cardiovasc. Dis. 2010, 20, 195–201. [Google Scholar] [CrossRef]
  38. Brynes, A.E.; Mark Edwards, C.; Ghatei, M.A.; Dornhorst, A.; Morgan, L.M.; Bloom, S.R.; Frost, G.S. A randomised four-intervention crossover study investigating the effect of carbohydrates on daytime profiles of insulin, glucose, non-esterified fatty acids and triacylglycerols in middle-aged men. Br. J. Nutr. 2003, 89, 207–218. [Google Scholar] [CrossRef]
  39. Gardner, C.D.; Trepanowski, J.F.; Del Gobbo, L.C.; Hauser, M.E.; Rigdon, J.; Ioannidis, J.P.A.; Desai, M.; King, A.C. Effect of Low-Fat vs Low-Carbohydrate Diet on 12-Month Weight Loss in Overweight Adults and the Association With Genotype Pattern or Insulin Secretion: The DIETFITS Randomized Clinical Trial. JAMA 2018, 319, 667–679. [Google Scholar] [CrossRef]
  40. Bazzano, L.A.; Hu, T.; Reynolds, K.; Yao, L.; Bunol, C.; Liu, Y.; Chen, C.S.; Klag, M.J.; Whelton, P.K.; He, J. Effects of low-carbohydrate and low-fat diets: A randomized trial. Ann. Intern. Med. 2014, 161, 309–318. [Google Scholar] [CrossRef]
  41. Abete, I.; Parra, D.; De Morentin, B.M.; Alfredo Martinez, J. Effects of two energy-restricted diets differing in the carbohydrate/protein ratio on weight loss and oxidative changes of obese men. Int. J. Food Sci. Nutr. 2009, 60, 1–13. [Google Scholar] [CrossRef] [PubMed]
  42. Gardner, C.D.; Kiazand, A.; Alhassan, S.; Kim, S.; Stafford, R.S.; Balise, R.R.; Kraemer, H.C.; King, A.C. Comparison of the Atkins, Zone, Ornish, and LEARN diets for change in weight and related risk factors among overweight premenopausal women: The A TO Z Weight Loss Study: A randomized trial. JAMA 2007, 297, 969–977. [Google Scholar] [CrossRef] [PubMed]
  43. Brehm, B.J.; Seeley, R.J.; Daniels, S.R.; D’Alessio, D.A. A randomized trial comparing a very low carbohydrate diet and a calorie-restricted low fat diet on body weight and cardiovascular risk factors in healthy women. J. Clin. Endocrinol. Metab. 2003, 88, 1617–1623. [Google Scholar] [CrossRef] [PubMed] [Green Version]
  44. Stern, L.; Iqbal, N.; Seshadri, P.; Chicano, K.L.; Daily, D.A.; McGrory, J.; Williams, M.; Gracely, E.J.; Samaha, F.F. The effects of low-carbohydrate versus conventional weight loss diets in severely obese adults: One-year follow-up of a randomized trial. Ann. Intern. Med. 2004, 140, 778–785. [Google Scholar] [CrossRef] [PubMed] [Green Version]
  45. Samaha, F.F.; Iqbal, N.; Seshadri, P.; Chicano, K.L.; Daily, D.A.; McGrory, J.; Williams, T.; Williams, M.; Gracely, E.J.; Stern, L. A low-carbohydrate as compared with a low-fat diet in severe obesity. N. Engl. J. Med. 2003, 348, 2074–2081. [Google Scholar] [CrossRef] [Green Version]
  46. Hu, T.; Yao, L.; Reynolds, K.; Whelton, P.K.; Niu, T.; Li, S.; He, J.; Bazzano, L.A. The Effects of a Low-Carbohydrate Diet vs. a Low-Fat Diet on Novel Cardiovascular Risk Factors: A Randomized Controlled Trial. Nutrients 2015, 7, 7978–7994. [Google Scholar] [CrossRef] [Green Version]
  47. Straznicky, N.E.; O’Callaghan, C.J.; Barrington, V.E.; Louis, W.J. Hypotensive effect of low-fat, high-carbohydrate diet can be independent of changes in plasma insulin concentrations. Hypertension 1999, 34, 580–585. [Google Scholar] [CrossRef] [Green Version]
  48. Borkman, M.; Campbell, L.V.; Chisholm, D.J.; Storlien, L.H. Comparison of the effects on insulin sensitivity of high carbohydrate and high fat diets in normal subjects. J. Clin. Endocrinol. Metab. 1991, 72, 432–437. [Google Scholar] [CrossRef]
  49. Ranjan, A.; Schmidt, S.; Damm-Frydenberg, C.; Holst, J.J.; Madsbad, S.; Norgaard, K. Short-term effects of a low carbohydrate diet on glycaemic variables and cardiovascular risk markers in patients with type 1 diabetes: A randomized open-label crossover trial. Diabetes Obes. Metab. 2017, 19, 1479–1484. [Google Scholar] [CrossRef]
  50. Tay, J.; Luscombe-Marsh, N.D.; Thompson, C.H.; Noakes, M.; Buckley, J.D.; Wittert, G.A.; Yancy, W.S., Jr.; Brinkworth, G.D. Comparison of low- and high-carbohydrate diets for type 2 diabetes management: A randomized trial. Am. J. Clin. Nutr. 2015, 102, 780–790. [Google Scholar] [CrossRef]
  51. Brehm, B.J.; Spang, S.E.; Lattin, B.L.; Seeley, R.J.; Daniels, S.R.; D’Alessio, D.A. The role of energy expenditure in the differential weight loss in obese women on low-fat and low-carbohydrate diets. J. Clin. Endocrinol. Metab. 2005, 90, 1475–1482. [Google Scholar] [CrossRef] [PubMed] [Green Version]
  52. Veum, V.L.; Laupsa-Borge, J.; Eng, O.; Rostrup, E.; Larsen, T.H.; Nordrehaug, J.E.; Nygard, O.K.; Sagen, J.V.; Gudbrandsen, O.A.; Dankel, S.N.; et al. Visceral adiposity and metabolic syndrome after very high-fat and low-fat isocaloric diets: A randomized controlled trial. Am. J. Clin. Nutr. 2017, 105, 85–99. [Google Scholar] [CrossRef] [Green Version]
  53. Brinkworth, G.D.; Noakes, M.; Buckley, J.D.; Keogh, J.B.; Clifton, P.M. Long-term effects of a very-low-carbohydrate weight loss diet compared with an isocaloric low-fat diet after 12 mo. Am. J. Clin. Nutr. 2009, 90, 23–32. [Google Scholar] [CrossRef] [PubMed] [Green Version]
  54. Stoernell, C.K.; Tangney, C.C.; Rockway, S.W. Short-term changes in lipoprotein subclasses and C-reactive protein levels of hypertriglyceridemic adults on low-carbohydrate and low-fat diets. Nutr. Res. 2008, 28, 443–449. [Google Scholar] [CrossRef] [PubMed]
  55. Holloway, C.J.; Cochlin, L.E.; Emmanuel, Y.; Murray, A.; Codreanu, I.; Edwards, L.M.; Szmigielski, C.; Tyler, D.J.; Knight, N.S.; Saxby, B.K.; et al. A high-fat diet impairs cardiac high-energy phosphate metabolism and cognitive function in healthy human subjects. Am. J. Clin. Nutr. 2011, 93, 748–755. [Google Scholar] [CrossRef] [PubMed] [Green Version]
  56. Chokkalingam, K.; Jewell, K.; Norton, L.; Littlewood, J.; van Loon, L.J.; Mansell, P.; Macdonald, I.A.; Tsintzas, K. High-fat/low-carbohydrate diet reduces insulin-stimulated carbohydrate oxidation but stimulates nonoxidative glucose disposal in humans: An important role for skeletal muscle pyruvate dehydrogenase kinase 4. J. Clin. Endocrinol. Metab. 2007, 92, 284–292. [Google Scholar] [CrossRef] [Green Version]
  57. Johnston, B.C.; Kanters, S.; Bandayrel, K.; Wu, P.; Naji, F.; Siemieniuk, R.A.; Ball, G.D.; Busse, J.W.; Thorlund, K.; Guyatt, G.; et al. Comparison of weight loss among named diet programs in overweight and obese adults: A meta-analysis. JAMA 2014, 312, 923–933. [Google Scholar] [CrossRef]
  58. Mansoor, N.; Vinknes, K.J.; Veierod, M.B.; Retterstol, K. Effects of low-carbohydrate diets v. low-fat diets on body weight and cardiovascular risk factors: A meta-analysis of randomised controlled trials. Br. J. Nutr. 2016, 115, 466–479. [Google Scholar] [CrossRef]
  59. Hamdy, O.; Tasabehji, M.W.; Elseaidy, T.; Tomah, S.; Ashrafzadeh, S.; Mottalib, A. Fat Versus Carbohydrate-Based Energy-Restricted Diets for Weight Loss in Patients With Type 2 Diabetes. Curr. Diabetes Rep. 2018, 18, 128. [Google Scholar] [CrossRef] [Green Version]
  60. Mensink, R.P. Effects of Saturated Fatty Acids on Serum Lipids and Lipoproteins: A Systematic Review and Regression Analysis; World Health Organization: Geneva, Switzerland, 2016. [Google Scholar]
  61. Fielding, C.J.; Havel, R.J.; Todd, K.M.; Yeo, K.E.; Schloetter, M.C.; Weinberg, V.; Frost, P.H. Effects of dietary cholesterol and fat saturation on plasma lipoproteins in an ethnically diverse population of healthy young men. J. Clin. Investig. 1995, 95, 611–618. [Google Scholar] [CrossRef] [Green Version]
  62. Pasiakos, S.M.; Lieberman, H.R.; Fulgoni, V.L., 3rd. Higher-protein diets are associated with higher HDL cholesterol and lower BMI and waist circumference in US adults. J. Nutr. 2015, 145, 605–614. [Google Scholar] [CrossRef] [PubMed] [Green Version]
  63. Scherer, P.E.; Hill, J.A. Obesity, Diabetes, and Cardiovascular Diseases: A Compendium. Circ. Res. 2016, 118, 1703–1705. [Google Scholar] [CrossRef] [PubMed] [Green Version]
  64. McRae, M.P. Dietary Fiber Intake and Type 2 Diabetes Mellitus: An Umbrella Review of Meta-analyses. J. Chiropr. Med. 2018, 17, 44–53. [Google Scholar] [CrossRef] [PubMed]
  65. Churuangsuk, C.; Kherouf, M.; Combet, E.; Lean, M. Low-carbohydrate diets for overweight and obesity: A systematic review of the systematic reviews. Obes. Rev. 2018, 19, 1700–1718. [Google Scholar] [CrossRef] [Green Version]
  66. Naude, C.E.; Schoonees, A.; Senekal, M.; Young, T.; Garner, P.; Volmink, J. Low carbohydrate versus isoenergetic balanced diets for reducing weight and cardiovascular risk: A systematic review and meta-analysis. PLoS ONE 2014, 9, e100652. [Google Scholar] [CrossRef]
  67. Nordmann, A.J.; Nordmann, A.; Briel, M.; Keller, U.; Yancy, W.S., Jr.; Brehm, B.J.; Bucher, H.C. Effects of low-carbohydrate vs low-fat diets on weight loss and cardiovascular risk factors: A meta-analysis of randomized controlled trials. Arch. Intern. Med. 2006, 166, 285–293. [Google Scholar] [CrossRef] [Green Version]
  68. Van Zuuren, E.J.; Fedorowicz, Z.; Kuijpers, T.; Pijl, H. Effects of low-carbohydrate- compared with low-fat-diet interventions on metabolic control in people with type 2 diabetes: A systematic review including GRADE assessments. Am. J. Clin. Nutr. 2018, 108, 300–331. [Google Scholar] [CrossRef] [Green Version]
  69. Bueno, N.B.; de Melo, I.S.; de Oliveira, S.L.; da Rocha Ataide, T. Very-low-carbohydrate ketogenic diet v. low-fat diet for long-term weight loss: A meta-analysis of randomised controlled trials. Br. J. Nutr. 2013, 110, 1178–1187. [Google Scholar] [CrossRef] [Green Version]
  70. Bansal, S.; Buring, J.E.; Rifai, N.; Mora, S.; Sacks, F.M.; Ridker, P.M. Fasting compared with nonfasting triglycerides and risk of cardiovascular events in women. JAMA 2007, 298, 309–316. [Google Scholar] [CrossRef] [Green Version]
  71. McKeown, N.M.; Meigs, J.B.; Liu, S.; Saltzman, E.; Wilson, P.W.F.; Jacques, P.F. Carbohydrate nutrition, insulin resistance, and the prevalence of the metabolic syndrome in the Framingham Offspring Cohort. Diabetes Care 2004, 27, 538–546. [Google Scholar] [CrossRef] [Green Version]
Figure 1. Flow diagram of the selection process.
Nutrients 12 00991 g001
Figure 2. Forest plots of randomized controlled trials that examined the effects of carbohydrate (CHO) restriction on body weight changes. Studies were categorized in group 1 (moderate-low CHO, 40–45 E%), group 2 (low CHO, 40–30 E%), and group 3 (very-low CHO, 30–3 E%). Solid squares represent the weight of individual studies and diamonds represent the weighted mean difference (WMD) in weight change. Effects were calculated using random-effect meta-analysis. No significant differences in body weight changes were detected between the low-carbohydrate diet (LCD) groups.
Nutrients 12 00991 g002
Figure 3. Forest plots of randomized controlled trials that examined the effects of carbohydrate (CHO) restriction on low-density lipoprotein cholesterol (LDL-C) concentrations. Studies were categorized in group 1 (moderate-low CHO, 40–45 E%), group 2 (low CHO, 40–30 E%), and group 3 (very-low CHO, 30–3 E%). Solid squares represent the weight of individual studies and diamonds represent the weighted mean difference (WMD) in LDL-C. Effects were calculated using random-effect meta-analysis. Decreases in LDL-C were significantly larger in the very-low CHO compared to the moderate-low CHO group.
Nutrients 12 00991 g003
Figure 4. Forest plots of randomized controlled trials that examined the effects of carbohydrate (CHO) restriction on triacylglycerol (TAG) concentrations. Studies were categorized in group 1 (moderate-low CHO, 40–45 E%), group 2 (low CHO, 40–30 E%), and group 3 (very-low CHO, 30–3 E%). Solid squares represent the weight of individual studies and diamonds represent the weighted mean difference (WMD) in TAG. Effects were calculated using random-effect meta-analysis. Decreases in TAGs were significantly lower in the low and very-low CHO group compared to the moderate-low CHO group.
Nutrients 12 00991 g004
Table 1. Overview of the moderate low-carbohydrate diets (<45–40 E%) and their effects on cardiometabolic risk markers.
Study CharacteristicsDiet ChangesDiet Effect
Author And YearStudy DesignLCD vs. MCDDurationParticipantskcalCHOFatProtWeight (kg)TC (mmol/L)LDL−CHDL−CTAGGlucose (mmol/L)Insulin (mU/mL)Systolic/
(mmol/L)(mmol/L)(mmol/L)Diastolic BP (mmHg)
Sato [19]ParallelIsocaloric6 months62 participants with T2D−277−7.35.62.7↓ −1.0 = = =
2017
Larsen [20] 2011ParallelIsocaloric with ER12 months99 participants with T2D75−5.2−0.76.6 = = = = = =/=
Parker [22] 2002ParallelIsocaloric with ER3 months46 participants with T2D244−120.912 = ↓ −0.3↓ −0.3 = = = = =/=
Mehrabani [23] 2012ParallelIsocaloric12 weeks49 overweight/−143−11−3.115 = = = = = ↓ −2.6
obese women with PCOS
Te Morenga [24] 2011ParallelIsocaloric with ER2 months74 overweight/214−946↓ −1.3 = = = = = = =/
obese women↓ −3.7
Frisch [25] 2009ParallelIsocaloric with ER12 months200 overweight participants−64−4.32.51.4 = = = = = = ↓ −4.0/=
Ebbeling [26] 2007ParallelIsocaloric18 months73 obese participants154−1312−0.3 = ↑ 0.3↑ 0.3 = = = =/=
De Natale [21] 2009Cross−Isocaloric4 weeks18 participants with T2D−12−770 = ↑ 0.2↑ 0.2↑ 0.1 =
over
Jacobs [27] 2004Cross−overIsocaloric3 weeks14 non−obese men with elevated TAGs48−1111−0.3 = = = = =
Pieke [28] 2000Cross−overIsocaloric3 weeks19 non−obese men with elevated TAGs81−14121.6 ↓ −0.2 = ↑ 0.1↓ −0.9 =
Vidon [29] 2001Cross−overIsocaloric3 weeks7 healthy participants −14131.1 ↑ 0.6↑ 0.4↑ 0.2 = ↑ 0.6↑ 2.6
Ashton [30] 2000Cross−overIsocaloric3 weeks28 healthy participants300−14160.8 = = = ↓ −0.1 = =/=
Wolfe [31] 1999Cross−overIsocaloric4 weeks10 healthy participants23−10010 = ↓ −0.3↓ −0.2 = ↓ −0.3
Diet changes and diet effects have been calculated as differences between the low-carbohydrate diet (<45–40 E% from CHO) and the moderate-carbohydrate diet (45–55 E% from CHO). ↑ or ↓ or =, indicates a statistically significant (p < 0.05) increase (↑) or decrease (↓) or no difference ( = ). Abbreviations: E%, percent of total energy; LCD, low-carbohydrate diet; MCD, moderate-carbohydrate diet; CHO, carbohydrate; Prot, Protein; TC, total cholesterol; LDL-C: low-density lipoprotein cholesterol; HDL-C, high-density lipoprotein cholesterol; TAG, triacylglycerol; BP, blood pressure; T2DM, type 2 diabetes mellitus; ER, energy restriction.
Table 2. Overview of the low-carbohydrate diets (<40–30 E%) and their effects on cardiometabolic risk markers.
Study CharacteristicsDiet ChangesDiet Effect
Author And YearStudy DesignLCD vs. MCDDurationParticipantskcalCHOFatProtWeight (kg)TC (mmol/L)LDL−CHDL−CTAGGlucose (mmol/L)Insulin (mU/mL)Systolic/
(mmol/L)(mmol/L)(mmol/L)Diastolic BP (mmHg)
Yamada [33] 2014ParallelAd libitum vs. ER6 months24 participants with T2D24−21138.7 = = = = = =/=
Luger [34]ParallelIsocaloric12 weeks42 participants with T2D44−136.75.9 = = = = = =/=
2013
Guldbrand [35] 2012 ParallelIsocaloric with ER24 months61 participants with T2D−189−964 = = = = = =/=
Davis [36]ParallelIsocaloric12 months105 participants with T2D−288−19163.7 = = = ↑ 0.1 = =/=
2009
Klemsdal [37] 2010ParallelIsocaloric with ER12 months164 participants with at least one MetS symptom −8.152.5 = = = = = = = =/
↓ −2.9
Gardner [39] 2018ParallelIsocaloric12 months609 overweight participants−94−18151.9 = ↑ 0.2↑ 0.1↓ −0.2 = = =/=
Bazzano [40] 2014ParallelIsocaloric with ER12 months148 obese participants−43−22135.3↓ −3.5 = = ↑ 0.2↓ −0.2 = = =/=
Abete [41] 2009ParallelIsocaloric with ER8 weeks19 obese men −194.211↓ −3.2 = = = = = = =/=
Gardner [42] 2007 (1)ParallelAd libitum vs. ER12 months311 overwight/obse woman92−9.49.2−0.4↓ −3.1 == −0.3==↓ −4.3/=
Gardner [42] 2007 (2)ParallelIsocaloric12 months311 overwight/obse woman56−16132.0= = ↑ 0.2= = = ↓ −5.7/↓ −3.7
Brehm [43] 2003ParallelAd libitum vs. ER6 months42 obese men154−23184.0↓ −6.3 = = = ↓ −0.3 = = =/=
Stern [44] 2004ParallelAd libitum vs. ER12 months87 obse participants +/− T2D−413−16250.7 = = = ↑ 0.1↓ −0.6 =/=
Samaha [45] 2003ParallelAd libitum vs. ER6 months132 obse participants +/− T2D and MetS−188−128.05.0↓ −3.9 = = = ↓ −0.4↓ −0.5↓ −7.0 =/=
Hu [46]ParallelIsocaloric with ER12 months148 healthy participants−43−22135.3↓ −3.5
2015
Brynes [38] 2003 (1)Cross−overIsocaloric24 weeks17 men with at least one cardiac risk factor449−1111−2.0 = = = = = = =
Brynes [38] 2003 (2)Cross−overIsocaloric24 weeks17 men with at least one cardiac risk factor736−1114−3.0 = = = = = = =
Brynes [38] 2003 (3)Cross−overIsocaloric24 weeks17 men with at least one cardiac risk factor239−1514−1.0 = = = = = = =
Straznicky [47] 1999Cross−overIsocaloric2 weeks148 healthy men449−1822−2.9 = ↑ 1.1↑ 0.9↑ 0.2 = ↑ 0.3=↑ 7.0/ ↑ 3.0
Borkman [48] 1991Cross−overIsocaloric3 weeks8 healthy participants287−2430−6.1 = = = ↑ 0.3 =
Diet changes and diet effects have been calculated as differences between the low-carbohydrate diet (<40–30 E% from CHO) and the moderate-carbohydrate diet (45–55 E% from CHO). ↑ or ↓ or =, indicates a statistically significant (p < 0.05) increase (↑) or decrease (↓) or no difference ( = ). Abbreviations: E%, percent of total energy; LCD, low-carbohydrate diet; MCD, moderate-carbohydrate diet; CHO, carbohydrate; Prot, Protein; TC, total cholesterol; LDL-C: low-density lipoprotein cholesterol; HDL-C, high-density lipoprotein cholesterol; TAG, triacylglycerol; BP, blood pressure; ER, energy restriction; T2DM, type 2 diabetes mellitus; MetS, metabolic syndrome.
Table 3. Overview of the very low-carbohydrate diets (<30–3 E%) and their effects on cardiometabolic risk markers.
Study CharacteristicsDiet ChangesDiet Effect
Author And YearStudy DesignLCD vs. MCDDurationParticipantskcalCHOFatProtWeight (kg)TC (mmol/L)LDL−C
(mmol/L)
HDL−C
(mmol/L)
TAG
(mmol/L)
Glucose (mmol/L)Insulin (μU/mL)Systolic/
Diastolic BP (mmHg)
Tay [50]
2015
ParallelIsocaloric with ER12 months77 participants with T2D−37−32267.2 = = ↑ 0.1↓ −0.4 = = =/=
Brehm [51]
2005
ParallelAd libitum vs. ER4 months40 obese women119−21192.0↓ −3.7 = = ↑ 0.1 = =/=
Veum [52]
2017
ParallelIsocaloric12 weeks38 men with abdominal obesity245−3940−0.6 = ↑ 1.1↑ 1.0↑ 0.2 = ↑ 0.3 = =/=
Brinkworth [53] 2009ParallelIsocaloric with ER12 months107 participants with abdominal obesity and at least one MetS symptom20−382911 = ↑ 0.6↑ 0.6↑ 0.2↓ −0.4 = = =/=
Stoernell [54] 2008ParallelIsocaloric8 weeks23 participants with elevated TAGs−145−27212.0 = = = = =
Ranjan [49]
2017
Cross−
over
Isocaloric1 week10 participants with T2D−160−40319.2 = = = = = = =/=
Holloway [55] 2011Cross−
over
Isocaloric5 days16 healthy men−31−4547−2.0↓ −3.1 = =
Chokkalingam [56] 2007Cross−
over
Isocaloric6 days10 healthy men215−42440 = =
Diet changes and diet effects have been calculated as differences between the low-carbohydrate diet (<30–3 E% from CHO) and the moderate-carbohydrate diet (45–55 E% from CHO). ↑ or ↓ or =, indicates a statistically significant (p < 0.05) increase (↑) or decrease (↓) or no difference ( = ). Abbreviations: E%, percent of total energy; LCD, low-carbohydrate diet; MCD, moderate-carbohydrate diet; CHO, carbohydrate; Prot, Protein; TC, total cholesterol; LDL-C: low-density lipoprotein cholesterol; HDL-C, high-density lipoprotein cholesterol; TAG, triacylglycerol; BP, blood pressure; ER, energy restriction; T2DM, type 2 diabetes mellitus; MetS, metabolic syndrome.

