Article

Spirulina Enhances Bone Modeling in Growing Male Rats by Regulating Growth-Related Hormones

1
Department of Food and Nutrition, Chungnam National University, 99, Daehak-ro, Yuseong-gu, Daejeon 34134, Korea
2
Department of Marine Bio Food Science, College of Fisheries and Ocean Science, Chonnam National University, Yeosu 550-749, Korea
*
Author to whom correspondence should be addressed.
Co-first authors: Authors contributed equally.
Nutrients 2020, 12(4), 1187; https://doi.org/10.3390/nu12041187
Submission received: 25 March 2020 / Revised: 19 April 2020 / Accepted: 22 April 2020 / Published: 24 April 2020
(This article belongs to the Section Nutrition and Public Health)

Abstract

:
In recent years, growth hormone deficiency in children has been treated with hormone therapy despite the possible significant side effects. Therefore, it was deemed beneficial to develop functional foods or dietary supplements for safely improving children’s growth. Spirulina platensis is known for its high antioxidant, anti-aging, anti-cancer, and immunity-enhancing properties, as well as its high digestibility and high protein content, but little has been reported about its influence on bone development in children with a normal supply of protein. In this study, we evaluated the effects of spirulina on the bone metabolism and antioxidant profiles of three-week-old growing male rats. The animals were divided into four groups (n = 17 per group) and were fed AIN93G diets with 0% (control), 30% (SP30), 50% (SP50), and 70% (SP70) of casein protein replaced by spirulina, respectively, for seven weeks. We observed that spirulina enhanced bone growth and bone strength by stimulating parathyroid hormone and growth hormone activities, as well its increased antioxidant activity. These results indicate that spirulina provides a suitable dietary supplement and alternative protein source with antioxidant benefits for growth improvement in early developmental stages.

1. Introduction

Bone modeling is the process by which bone is either formed on an existing bone surface by osteoblasts without prior resorption or removed by osteoclasts (resorption modeling), and is the dominant process during skeletal growth [1]. Bone modeling is thus essential for the proper longitudinal growth, with cells in epiphyseal growth plates responsible for continued elongation of bones until the body’s full size is reached [2,3,4]. Therefore the epiphyseal growth plate of the iliac bone is the most useful indicator of bone growth, which is regulated by the activities of the growth hormone (GH) secreted by the anterior pituitary gland of the brain [5,6].
Insulin-like growth factor 1 (IGF-1) is a single-chain, 70 amino acid polypeptide that is mainly secreted by the liver and acts in an insulin-like manner. IGF-1 is also secreted by osteoblasts, and is considered an auto- or paracrine regulator of osteoblastic cell function [7]. GH, parathyroid hormone, and calcitriol also stimulate IGF-1 production during the growth phase [8]. Therefore, IGF-1 is recognized as a growth factor that has an important role in the maintenance of bone mass. This action eventually stimulates the synthesis of carbohydrates, lipids, and proteins in target tissues [9]. Although GH directly stimulates the proliferation and differentiation of osteoblast cells, IGF-1 also increases osteocalcin and collagen synthesis in osteoblasts, as well as differentiation of osteoblasts, thereby increasing bone formation and inhibiting collagenase expression.
Chronic protein deficiency has been reported to delay skeletal growth and bone maturity and cause fatty infiltration of the liver in infants and young children, conditions that are often associated with chronic malnutrition, a major factor affecting child morbidity and mortality in developing countries [10,11]. It has been reported that a low-protein diet reduces tibia length and diameter, and bone mineral content (BMC) in growing rats [12] and children [13]. Also low levels of circulating IGF-1 and the presence of a fatty liver are conditions frequently observed in children with a protein-deficient diet [14].
Spirulina (Spirulina platensis), a green spiral bacterium classified as a cyanobacterium, has been recognized by international organizations such as the WHO, FAO, and UNICEF as a dietary supplement (FAO Fisheries and Aquaculture Circular. No. 1034, Joint FAO/WHO Expert Committee on Food Additives (JECFA), 86th meeting 2018). Spirulina contains all eight amino acids essential to humans, has a digestibility range of 80–90%, and contains 60–70% protein on a dry weight basis, which is higher than any other natural food [15,16,17,18,19]. Within its 6–9% fat content, spirulina is rich in unsaturated fatty acids such as linoleic acid, docosahexaenoic acid, eicosapentaenoic acid, arachidonic acid, and stearidonic acid. Moreover, spirulina contains moderate amounts of vitamin A, vitamin C, vitamin E, vitamin B12, thiamine, nicotinamide, pyridoxine, riboflavin, and folic acid. In addition, it has many functional bioactive ingredients, including phenolic phytochemicals, phycobiliprotein, and chlorophyll, that have antioxidant and anti-inflammatory properties [20,21]. It has a high content of total phenolic compounds such as catechin hydrate, epicatechin, pyrocatechol, C-phycocyanin and β-carotene, which contribute to the major antioxidant activity of spirulina. The phenolic compounds present in spirulina are primarily involved in the redox mechanism and function to prevent the formation of reactive oxygen species (ROS), eventually inhibiting inflammatory responses via anti-oxidative and anti-inflammatory mechanisms that have protective effects against various human diseases such as mild chronic inflammatory disease [22,23,24,25].
Previous studies have shown that spirulina can be a good protein source for populations in developing countries that are vulnerable to protein malnutrition as it can support body growth, avoid fatty liver development associated with protein deficiency, and improve the nutritional status of malnourished humans [26,27,28,29,30,31,32,33,34]. Spirulina has also been shown to prevent fatty infiltration of the liver in diabetic rats by inhibiting adipogenesis and lipogenesis [35]. In addition, it has been shown to lower blood cholesterol levels associated with a high-cholesterol diet in animal models and to prevent arteriosclerosis [36,37]. However, similar or greater effects on bone growth and bone strength under adequate nutritional conditions, such as an alternative vegetable protein source compared to an animal protein source, have not been reported.
The height of children is rapidly becoming a social issue as there is an increase in the number of people who are concerned about their child’s height. As a result, GH therapy is being indiscriminately used without adequate protection against side effects [38,39,40,41,42,43,44,45,46,47]. This study investigated the beneficial effect of using spirulina as a dietary supplement on skeletal growth and growth-related hormone levels in growing male rats. The results indicated that a spirulina supplement can enhance bone growth and bone strength and provide an antioxidant protective effect against tissue damage.

2. Materials and Methods

2.1. Animal Care and Diets

Three-week-old male Sprague–Dawley rats weighing approximately 50 g were used in this study (Damulscience, Daejeon, Korea). The animals were divided into four groups by applying a randomized design, and each group contained 17 rats (Table 1). All rats were housed in a room with constant temperature (23 ± 1 °C) and relative humidity (50 ± 5%) conditions and under a 12-hour light/dark cycle.
Freeze-dried spirulina (S. platensis) powder obtained from Dainippon Ink and Chemicals, Inc. (Tokyo, Japan) was kindly donated by ES Biotech Co. (Cheonan, Korea) for use in this study. The composition of the spirulina powder is summarized in Table 2. The control group was fed with a normal AIN93G rodent diet while the other groups were fed an AIN93G diet with a portion of the diet replaced by spirulina powder. The protein source in the control group diet was 100% casein. Portions of the casein protein within the AIN93G diet were replaced with spirulina protein; three treatment groups, SP30, SP50, and SP70, were fed AIN93G diets with 30%, 50%, and 70%, respectively, of the casein replaced by spirulina. To ensure that total calorie (kcal) content and total amounts of vitamins, minerals, fiber, carbohydrate, and protein (g) per 100 g of each diet formula were similar among the groups, adjustments were made to the control diet (Table 3). The same amount of food was given to each group and the animals were weighed every 2 days. The food efficiency ratio (FER) was determined by measuring the total increment of animal weight and total diet intake and calculating FER as FER = total weight increment (g)/total diet intake (g).
All animal experiments were approved by the Committee of Animal Care and Experiment of Chungnam National University (Daejeon, Korea) with reference number (CNU-00036) and were carried out in accordance with the National Institutes of Health Guide for the Care and Use of Laboratory Animals (NIH Publications No. 8023, revised 1978).

2.2. Tissue Collection and Preparation

Five animals from each group were fasted overnight before sacrifice at 0, 3, and 7 weeks. Blood samples were taken from the carotid artery and kept in a heparin-treated test tube. Plasma was collected by centrifugation for 15 minutes at 1000 g and then stored at –70 °C until analysis. Liver, heart, kidney, and adipose tissues were extracted, rinsed with 0.9% PBS, and weighed. The femur and lumbar spine were isolated and muscles, fat, and ligaments were removed. The length of the femur and lumbar spine were measured using a Digimatic caliper (Mitutoyo, Japan). Weight, bone strength, and mineral content of the femur and lumbar spine were determined.

2.3. Bone Strength and Bone Mineral Content (BMC) Measurement

The breaking force of the femur and lumbar spine was measured by using a texture analyzer (TA/XT2, Stable Micro System, England). For bone measurement, the plunger of the texture analyzer was arranged appropriately and its placement was adjusted to the middle of the femur. The plunger was then dropped in order to fracture the bone. The plunger drop conditions used for breaking the femur and lumbar spine were: distance time 80%, pre-test speed 2.0 mm/s, test speed 1.0 mm/s, and post-test speed 5.0 mm/s.
For analysis of mineral content of the bones, 0.5–1 g of femur and lumbar spine were placed in a container and 7 mL 65% HNO3 and 1 mL 30% H2O2 were added. The calcium and magnesium were diluted by LaCl3 and the potassium was diluted by distilled water. The mineral content in the diluted solutions was measured by an atomic absorption spectrophotometer (ICP Microphone).

2.4. Biochemical Analysis

Several serum factors were measured by using analysis kits as follows: GH (Rat Growth Hormone ELISA; acceptable range 50% blank/maximum binding: 3.6 ng/mL, Cayman, MI, USA); IGFBP-3 (Rat IGFBP-3 ELISA; sensitivity: 0.09 ng/mL, BioVendor, Brno, Czech); IGF-1 (Rat IGF-1 ELISA; assay range: 10~1200 ng/mL, IDS Ltd. Bolden, UK); Osteocalcin-3 (ELISA; sensitivity: 1 ng/mL, BTI, NM, USA); Parathyroid hormone (Intact-PTH Rat EIA; sensitivity: 1.57 pg/mL, DRG. Inc., NJ, USA); total cholesterol, HDL, and LDL kit (Enzyme kit; accuracy, r = 0.987, YD Diagnostics, Yongin, Korea); alanine aminotransferase (ALT) kit (AM 101-K Kit, Asan Pharm. Co. Ltd., Hwaseong, Korea). Calcium, phosphorus, lactate dehydrogenase (LDH), and glucose concentration in plasma were measured by using a blood chemistry analyzer (ARCO-PC, Biotecnica Ins., Italy). The concentration of deoxypyridinoline (DPD) in urine was analyzed by using a deoxypyridinoline assay kit, and creatinine was analyzed by using a creatinine assay kit (QUIDEL; creatinine accuracy: r = 0.993; DPD sensitivity: 1.1 nM/L, CA, USA).

2.5. Antioxidant Enzyme Activities and Lipid Peroxide Measurement

Glutathione (GSH), 5,5’-dithio-bis-nitrobenzoic acid (DTNB), Trizma (Tris base), glutathione reductase (GR), and oxidized glutathione (GSSG) were purchased from Sigma-Aldrich Chemical (Sigma-Aldrich Chemical Co., St. Louis, USA). The antioxidant enzyme activities were calculated to 1 g protein content by applying the method of Bradford and using BSA as a standard. The quinone reductase (QR), Glutathione S-transferase (GST), GR, and GSH concentrations of liver tissue were measured by applying the following methods. The QR activity in the tissues was measured with 25 mM Tris-HCl buffer supplemented with BSA, FAD, 0.1 mM NADPH, and 10% PMS. The mixture was measured at 600 nm with a spectrophotometer. The GST activity was determined by mixing the tissue homogenate with 1-chloro-2,4-dinitrobezene and measuring activity at 340 nm with a spectrophotometer. The tissue homogenate for GR activity was reacted with 26.98 mM EDTA in 0.1 M Tris-HCl buffer supplemented with 66.0 mM GSSG and 9.18 mM NADPH and measured by determining the absorbance by spectrophotometer at 340 nm. The GSH activity was determined by mixing the tissue homogenate with 0.1 M potassium phosphate buffer with 10 mM DTNB, and 5 mM NADPH, equilibrated for 1 min by adding one unit of GR and measuring the absorbance at 412 nm with a spectrophotometer. A 0.04 mM GSH was used to obtain a standard curve.
For lipid peroxide measurement, the blood and organs (liver, kidney, heart) were placed on ice, and homogenized with 50 mM sodium phosphate buffer using a tissue homogenizer with a Teflon pestle (Dupont, Wilmington, DE, USA). One mL of homogenate was mixed with 1 mL 8.1% SDS, 2 mL 20% acetic acid, and 1 mL 0.75% TBA and the mixture then boiled for 30 min. The absorbance of the malondialdehyde (MDA)-TBA adduct formed in the supernatant was measured colorimetrically at 532 nm. The value of MDA was calculated from a standard curve prepared using tetramethoxypropane (TMP) and is expressed as a thiobar–bituric acid reactive substance (TBARS) value.

2.6. Statistics

All results were expressed as mean ± SEM and analyzed one-way ANOVA or t-test using SPSS 24.0 (Statistical Package for Social Science, SPSS Inc., Chicago, IL, USA) software package program and GraphPad Prism 8 (GraphPad Software Inc., CA, USA) software. T-test was used to compare a treatment group with the control group. Biochemical changes between the groups within the same week or between weeks within the same group were investigated using ANOVA analysis, with which a post-hoc comparison was made with Least Significant Difference (LSD) and Duncan’s multiple-range test. Statistical significance refers to results where * p < 0.05, ** p < 0.01, or *** p < 0.001 for the comparison between the weeks within a group and # p < 0.05, ## p < 0.01, or ### p < 0.001 for the comparison between the groups in the same week were obtained.

3. Results

3.1. Body Weight, Food Intake, Tissue Damage, and Blood Lipid Profile

The body weight, food intake, and dietary efficiency of rats fed the experimental diets for 7 weeks were measured. Figure 1A shows that average body weight increased significantly over 7 weeks in each group. However, there were no significant differences between the groups at 0, 3, and 7 weeks (Table 4). In addition, there was no significant difference in the amount of food intake or the FER among the groups after 3 and 7 weeks (Table 4).
Since spirulina was used as a substitute protein source, levels of urinary creatinine and DPD as kidney damage markers were examined. As shown in Figures S1A,B, both markers showed significant dose-dependent decreases with the SP70 group having the lowest levels of both markers, suggesting that the protein excretion effect is relieved by a spirulina-supplemented diet. Blood albumin (Figure S1C) and blood glucose level (Figure S1D) showed no significant difference between the spirulina substitution diets and the control diet at 7 weeks, suggesting that there were no influences on protein homeostasis in the circulatory system or on insulin resistance.
Alanine aminotransferase (ALT) assessment for liver damage showed no significant difference between the spirulina substitution diets and the control diet at 7 weeks (Figure S1E). Elevated lactate dehydrogenase (LDH) can indicate tissue damage by disease or stress related to organ growth. In this study, plasma LDH levels increased over time in all groups as expected, but compared to the other groups, the SP70 group showed a significant LDH reduction after 7 weeks of treatment, suggesting that spirulina supplementation might protect the body against tissue stress due to growth (Figure S1F).
Blood lipid analyses, including total cholesterol, HDL, and LDL, revealed no significant differences between the spirulina substitution diet and the control diet (Figure S2).
In conclusion, the results suggest that spirulina has potential as a candidate protein substitute as there were no indications of toxic effects related to kidney damage, liver damage, blood glucose changes, or changes in lipid profiles.

3.2. Change of Organ Growth

The effect of spirulina on organ weight of the growing rats over the 7-week treatment period was investigated. Liver (Figure 1B), kidney (Figure 1C), and heart (Figure 1D) weights increased significantly over time in each group, as expected. At 7 weeks, there were no differences in weight gains in the liver, kidney, and heart tissues between the control group and the SP70 group; however, the SP30 and SP50 groups showed significantly less growth than that of the control group, suggesting that 70% of protein source replaced with spirulina might be the most effective spirulina supplementation level.

3.3. Fat Accumulation during the Growth

The effect of spirulina on the weight change of adipose tissues in the growing rats was also examined. Adipose tissues in all groups showed significant increases during the experimental period (p < 0.001). Interestingly, the weight gain of mesenteric fat (Figure 1E), retroperitoneal fat (Figure 1F), epididymal fat (Figure 1G), and total fat (Figure 1H) decreased significantly in a spirulina dose-dependent manner. In particular, the weight increase of epididymal fat was notably low in the third measurement week. At 7 weeks, SP70 showed the lowest weight gains in all fat tissues, and the gains were significantly lower than those in the other groups. These observations suggest that a high level of spirulina substitution can prevent the accumulation of fat without interfering with the weight gain of the rest of the body during growth.

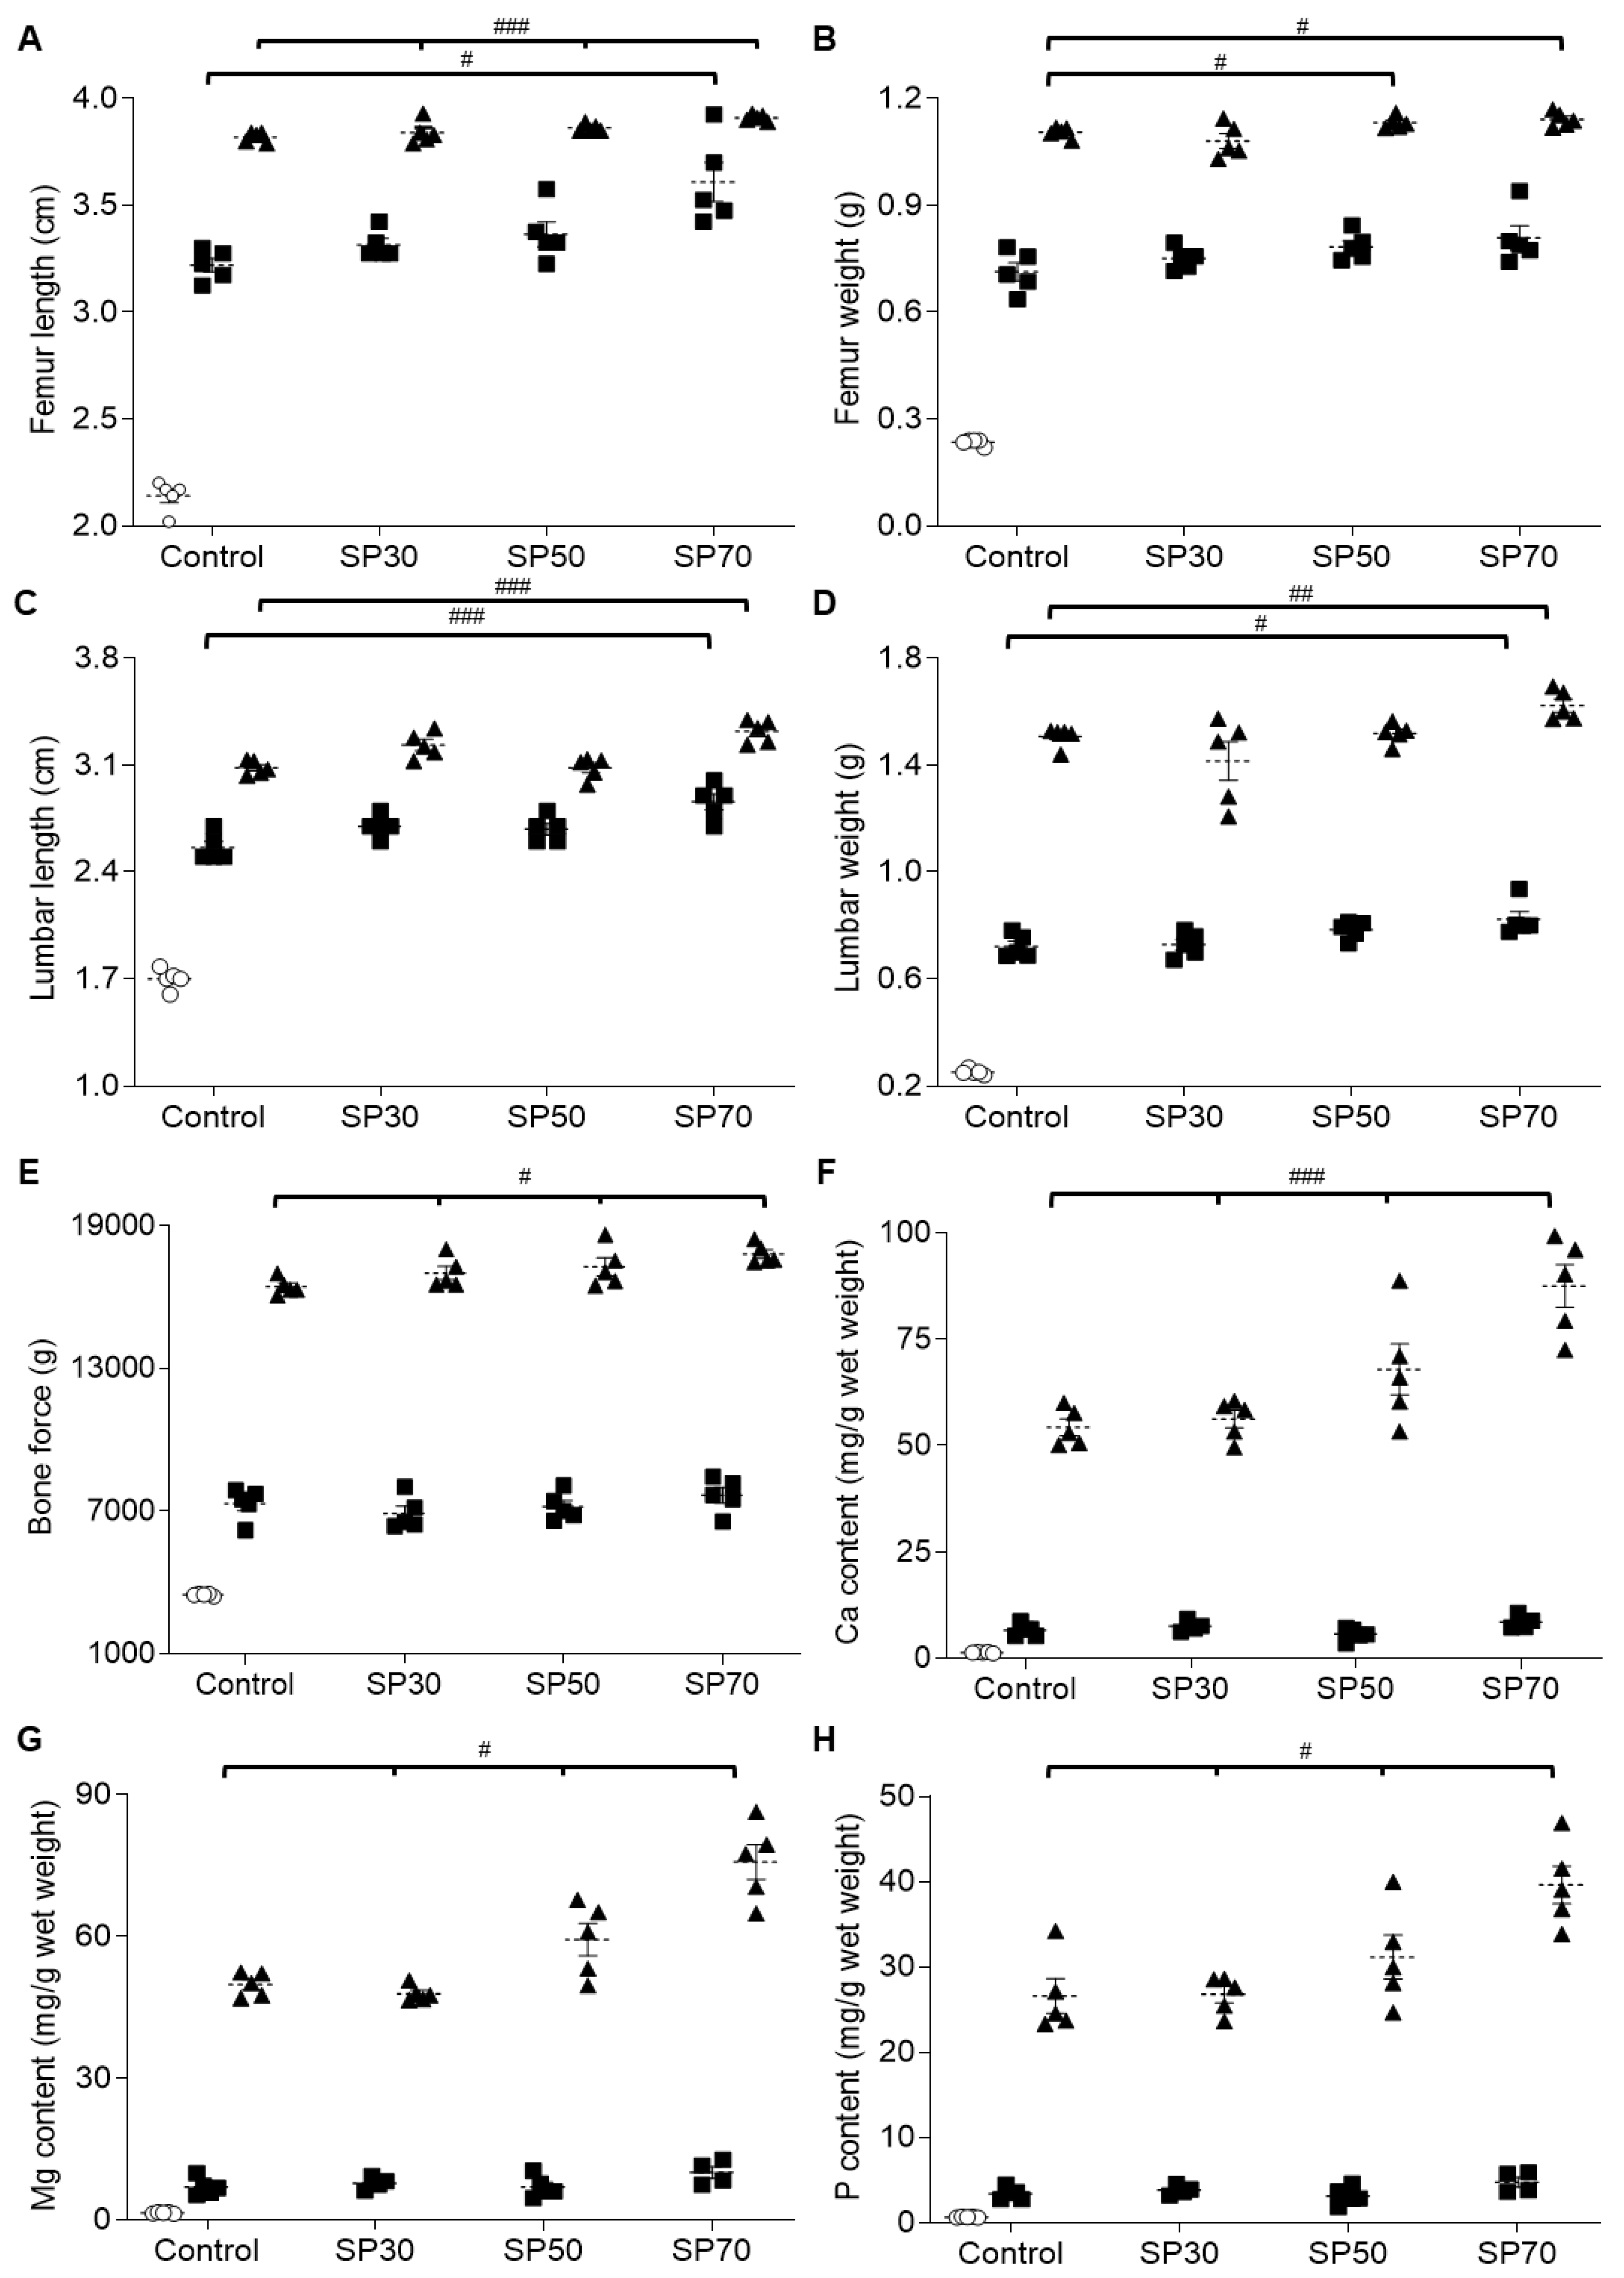
3.4. Improvement of Length and Weight of Femur and Lumbar Spine by Spirulina

Next, the lengths and weights of the femur and lumbar spine were measured. As expected, the lengths and weights of the femur and lumbar spine increased significantly over the 7-week growth period in each group. At 7 weeks, the femur lengths (Figure 2A) and weights (Figure 2B) of the SP50 and SP70 groups increased significantly compared to those of the control group. However, even at 3 weeks, the femurs of the SP70 group were significantly longer than those of the control group. Also, the lumbar length (Figure 2C) and weight (Figure 2D) of the SP70 group were significantly greater than those of the control group after both 3 weeks and 7 weeks of treatment. These results indicate that the high spirulina content in the SP70 group significantly increased the weight and length of both femur and lumbar spine bones consistently over a 7-week period, resulting in enhanced bone development in growing male rats.

3.5. Enhanced Bone Strength via Higher Bone Mineral Content by Spirulina

The femur bending strengths of the rats are shown in Figure 2E. Although bone strength was increased significantly over time in all groups, the SP-substituted groups showed significantly greater bone strength at 7 weeks. Moreover, the increases were SP dose-dependent. The bone strength of the SP70 group was significantly higher (5.3% higher) than that of the control group at 7 weeks (p < 0.05). The results indicate the enhancing effect of spirulina on bone strength.
Next, the mineral content of the femur bones was measured. The Ca (Figure 2F), Mg (Figure 2G), and P (Figure 2H) content in the femurs significantly increased during the experiment period in all groups, as expected. However, at 7 weeks, the mineral contents of all three SP substitution groups were significantly higher than that of the control group, and the BMCs changed in a dose-dependent manner, suggesting a positive effect of spirulina on bone strength.

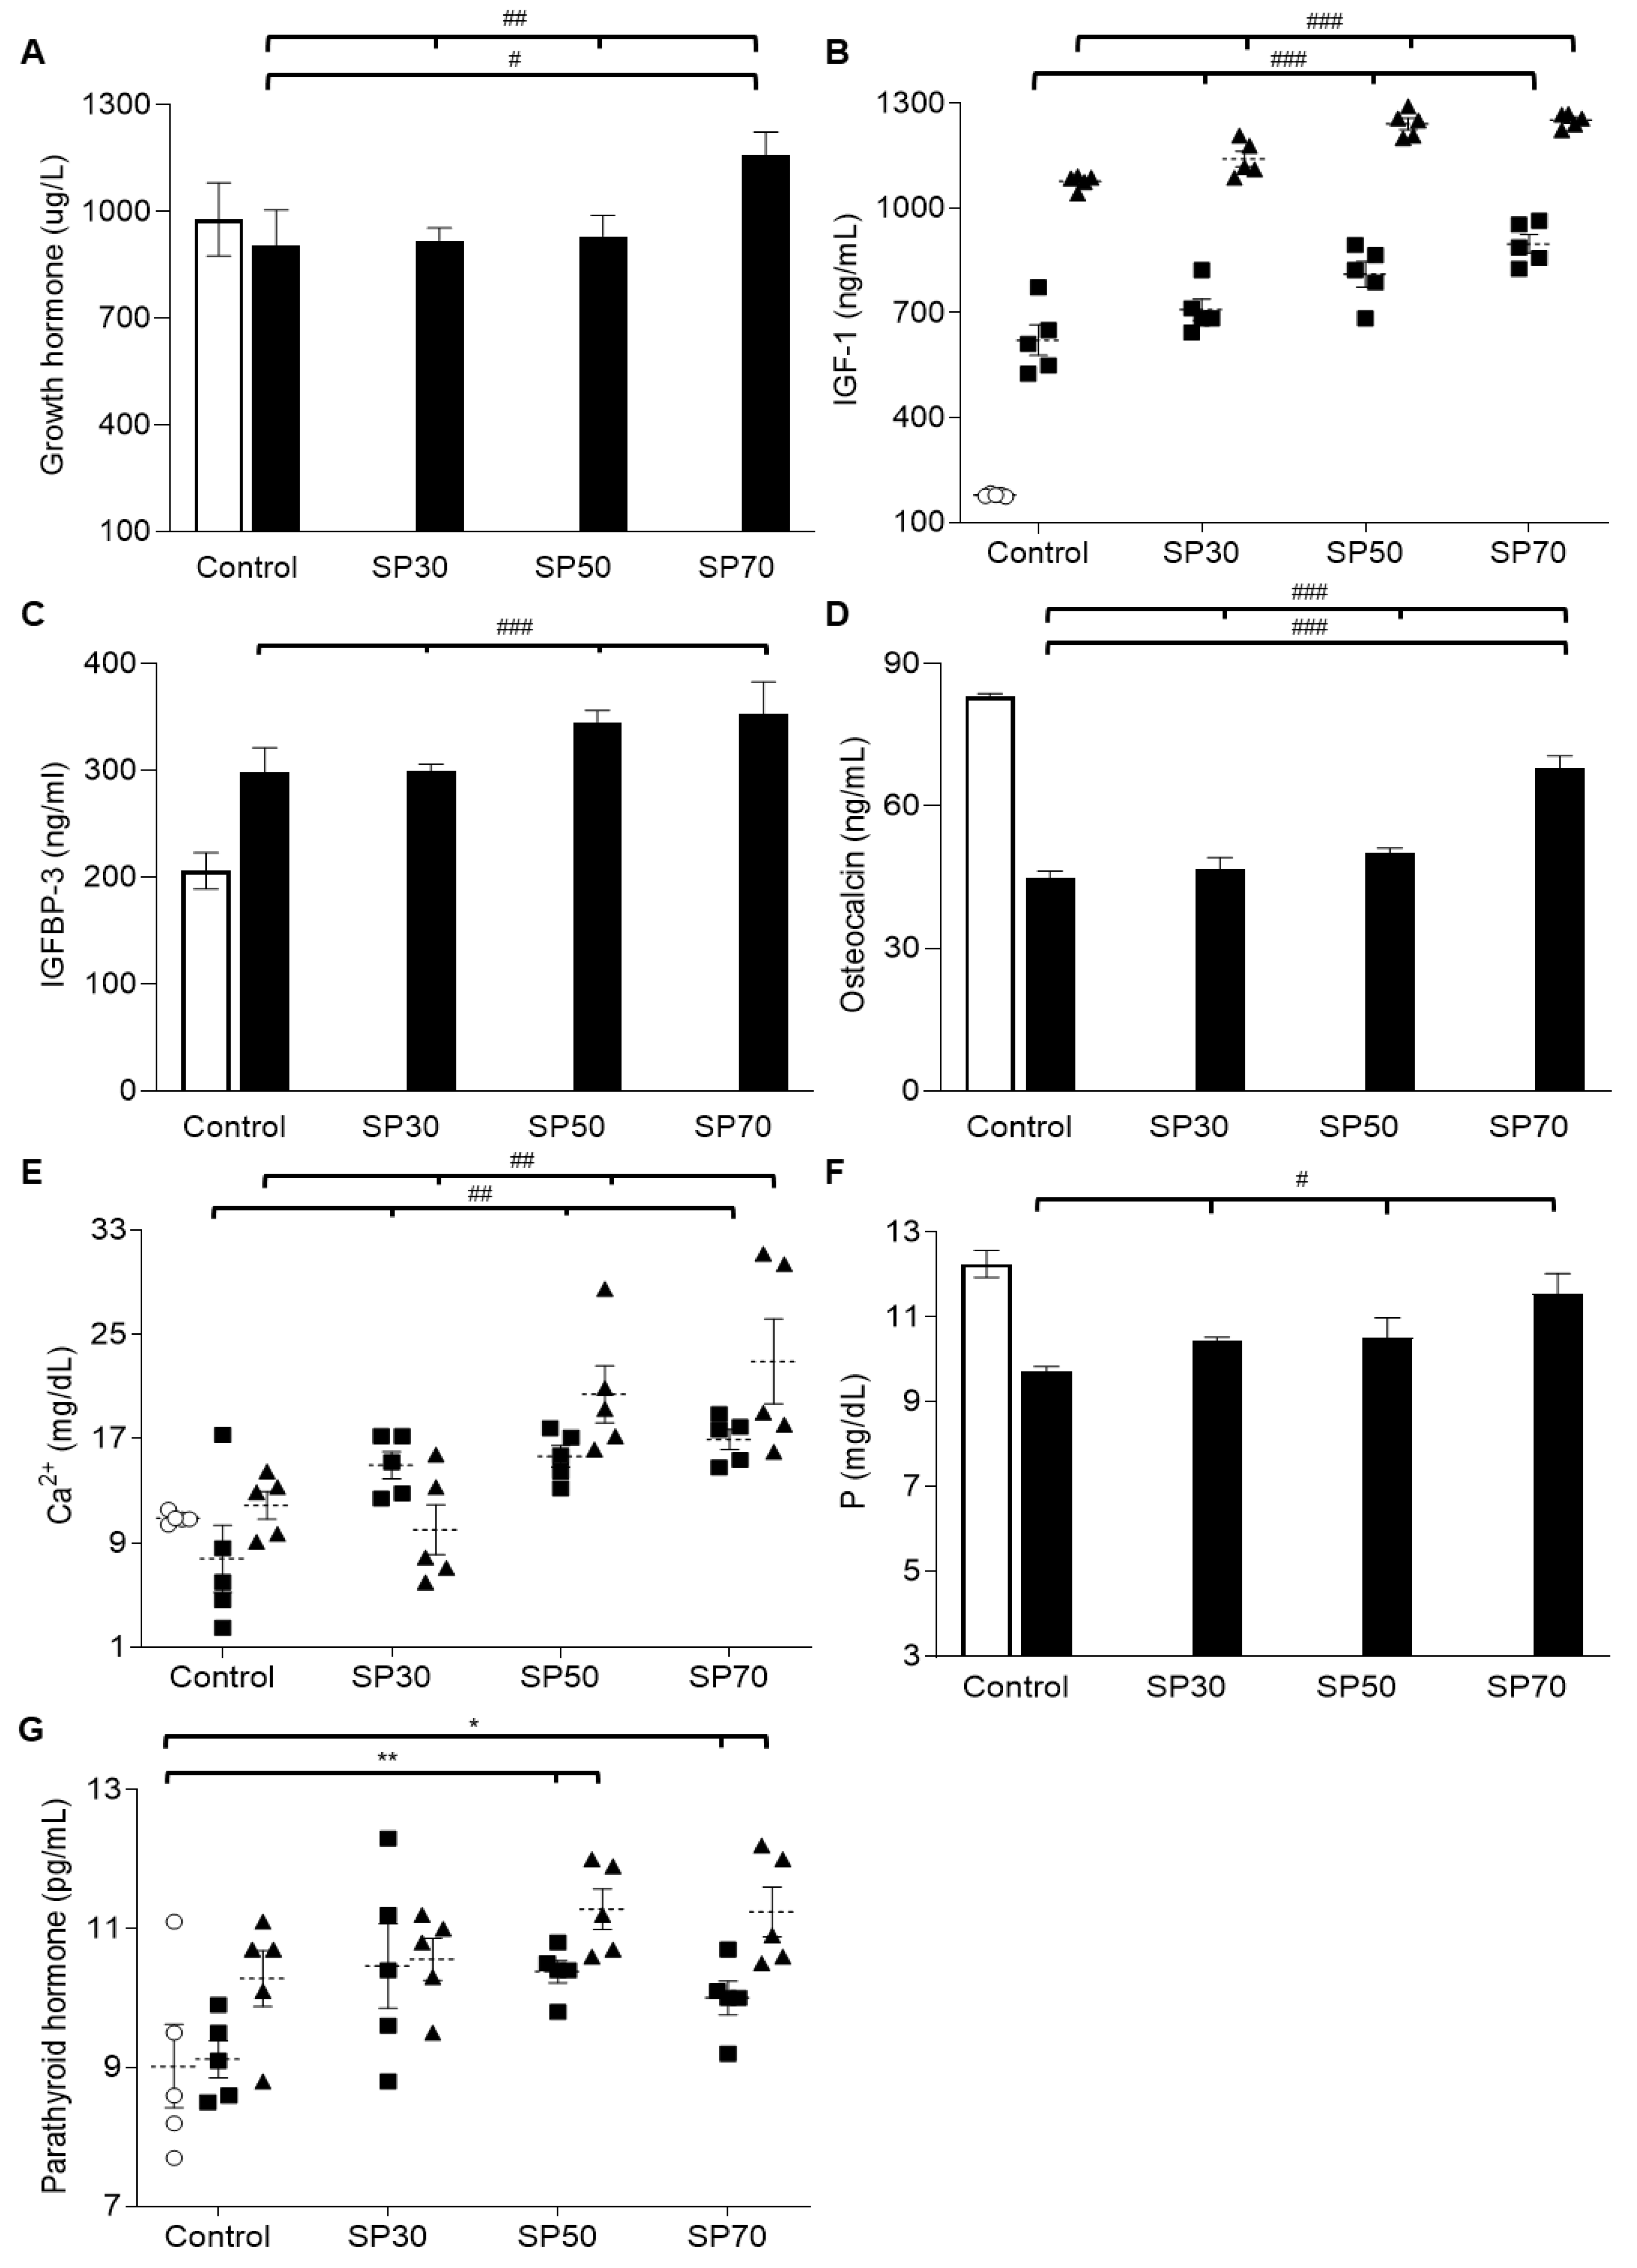
3.6. Increased plasma Growth Hormone, IGF-1, and IGFBP-3 Levels by Spirulina

Since we observed enhancement of bone growth and bone strength by spirulina treatment, we investigated whether the growth-regulating hormonea level was influenced by spirulina (Figure 3). Although the GH level was steady throughout the experiment in the control group, the spirulina-fed groups showed continuous increases in GH level over the 7-week study in a dose-dependent manner (Figure 3A). This result suggests that spirulina treatment can increase GH levels over time, potentially allowing bones to grow continuously.
IGF-1 is an anabolic hormone with a structure similar to that of insulin and regulates the linear and microarchitectural growth of bones, in particular in osteoblasts. Therefore, we examined the plasma level of IGF-1 (Figure 3B). Plasma IGF-1 levels increased significantly during the experiment period in each group, as expected. However, plasma IGF-1 levels in the spirulina-fed groups were significantly higher than those of the control group after both 3 weeks (p < 0.001) and 7 weeks (p < 0.001) of treatment.
Insulin-like growth factor binding protein 3 (IGFBP-3) is the main IGF transport protein in the blood and most dependent on IGF-1. Therefore, in this study, we examined the IGFBP-3 level in plasma. As shown in Figure 3C, IGFBP-3 levels in each of the SP groups were significantly higher than those of the control group at 7 weeks, mirroring the IGF-1 results.
These results suggest that spirulina, especially in high amounts (SP70), enhances the release of GH, followed by a continuing increase in the release of IGF-1, ultimately resulting in the SP-related bone growth enhancements observed above.

3.7. Increased Plasma Osteocalcin, Mineral, and Parathyroid Hormone (PTH) Levels Dose-Dependently

Osteocalcin is a noncollagenous calcium-binding protein hormone secreted by osteoblasts. High plasma osteocalcin levels correlate relatively well with increases in bone mineral density during bone formation, which can be used as a preliminary biomarker of bone formation. Therefore, we examined the effect of spirulina on plasma osteocalcin (Figure 3D). While the osteocalcin level decreased significantly in the control group over the experimental period, spirulina treatment significantly increased the osteocalcin level over time compared to the control group (p < 0.001); moreover, the increases were dose-dependent. These data suggest that spirulina increases the levels of osteocalcin in plasma, resulting in enhanced bone mineral density and bone strength in growing rats, as observed above.
Next, we examined the effect of spirulina on blood mineral concentrations in growing rats. The spirulina-fed groups had significantly higher levels of free calcium concentrations (p < 0.01) compared to the control group (Figure 3E). The increases were dose-dependent.The serum phosphorus (P) level decreased over 7 weeks in the control group, but the spirulina-fed groups showed continuous increases in P level dose-dependently (Figure 3F).
Parathyroid hormones (PTHs) regulate the plasma calcium level through its effects on bone, kidney, and intestine [48]. Therefore, we examined PTH levels to determine whether spirulina affects calcium level via PTH activities. Interestingly, plasma PTH level only increased significantly in the SP50 and SP70 groups over the course of the study; there was no significant increase in PTH level in either the control or SP30 groups (Figure 3G). Overall, these data suggest that higher doses of spirulina can increase the PTH level, which is associated with an increase in the free calcium available for bone mineralization in plasma.

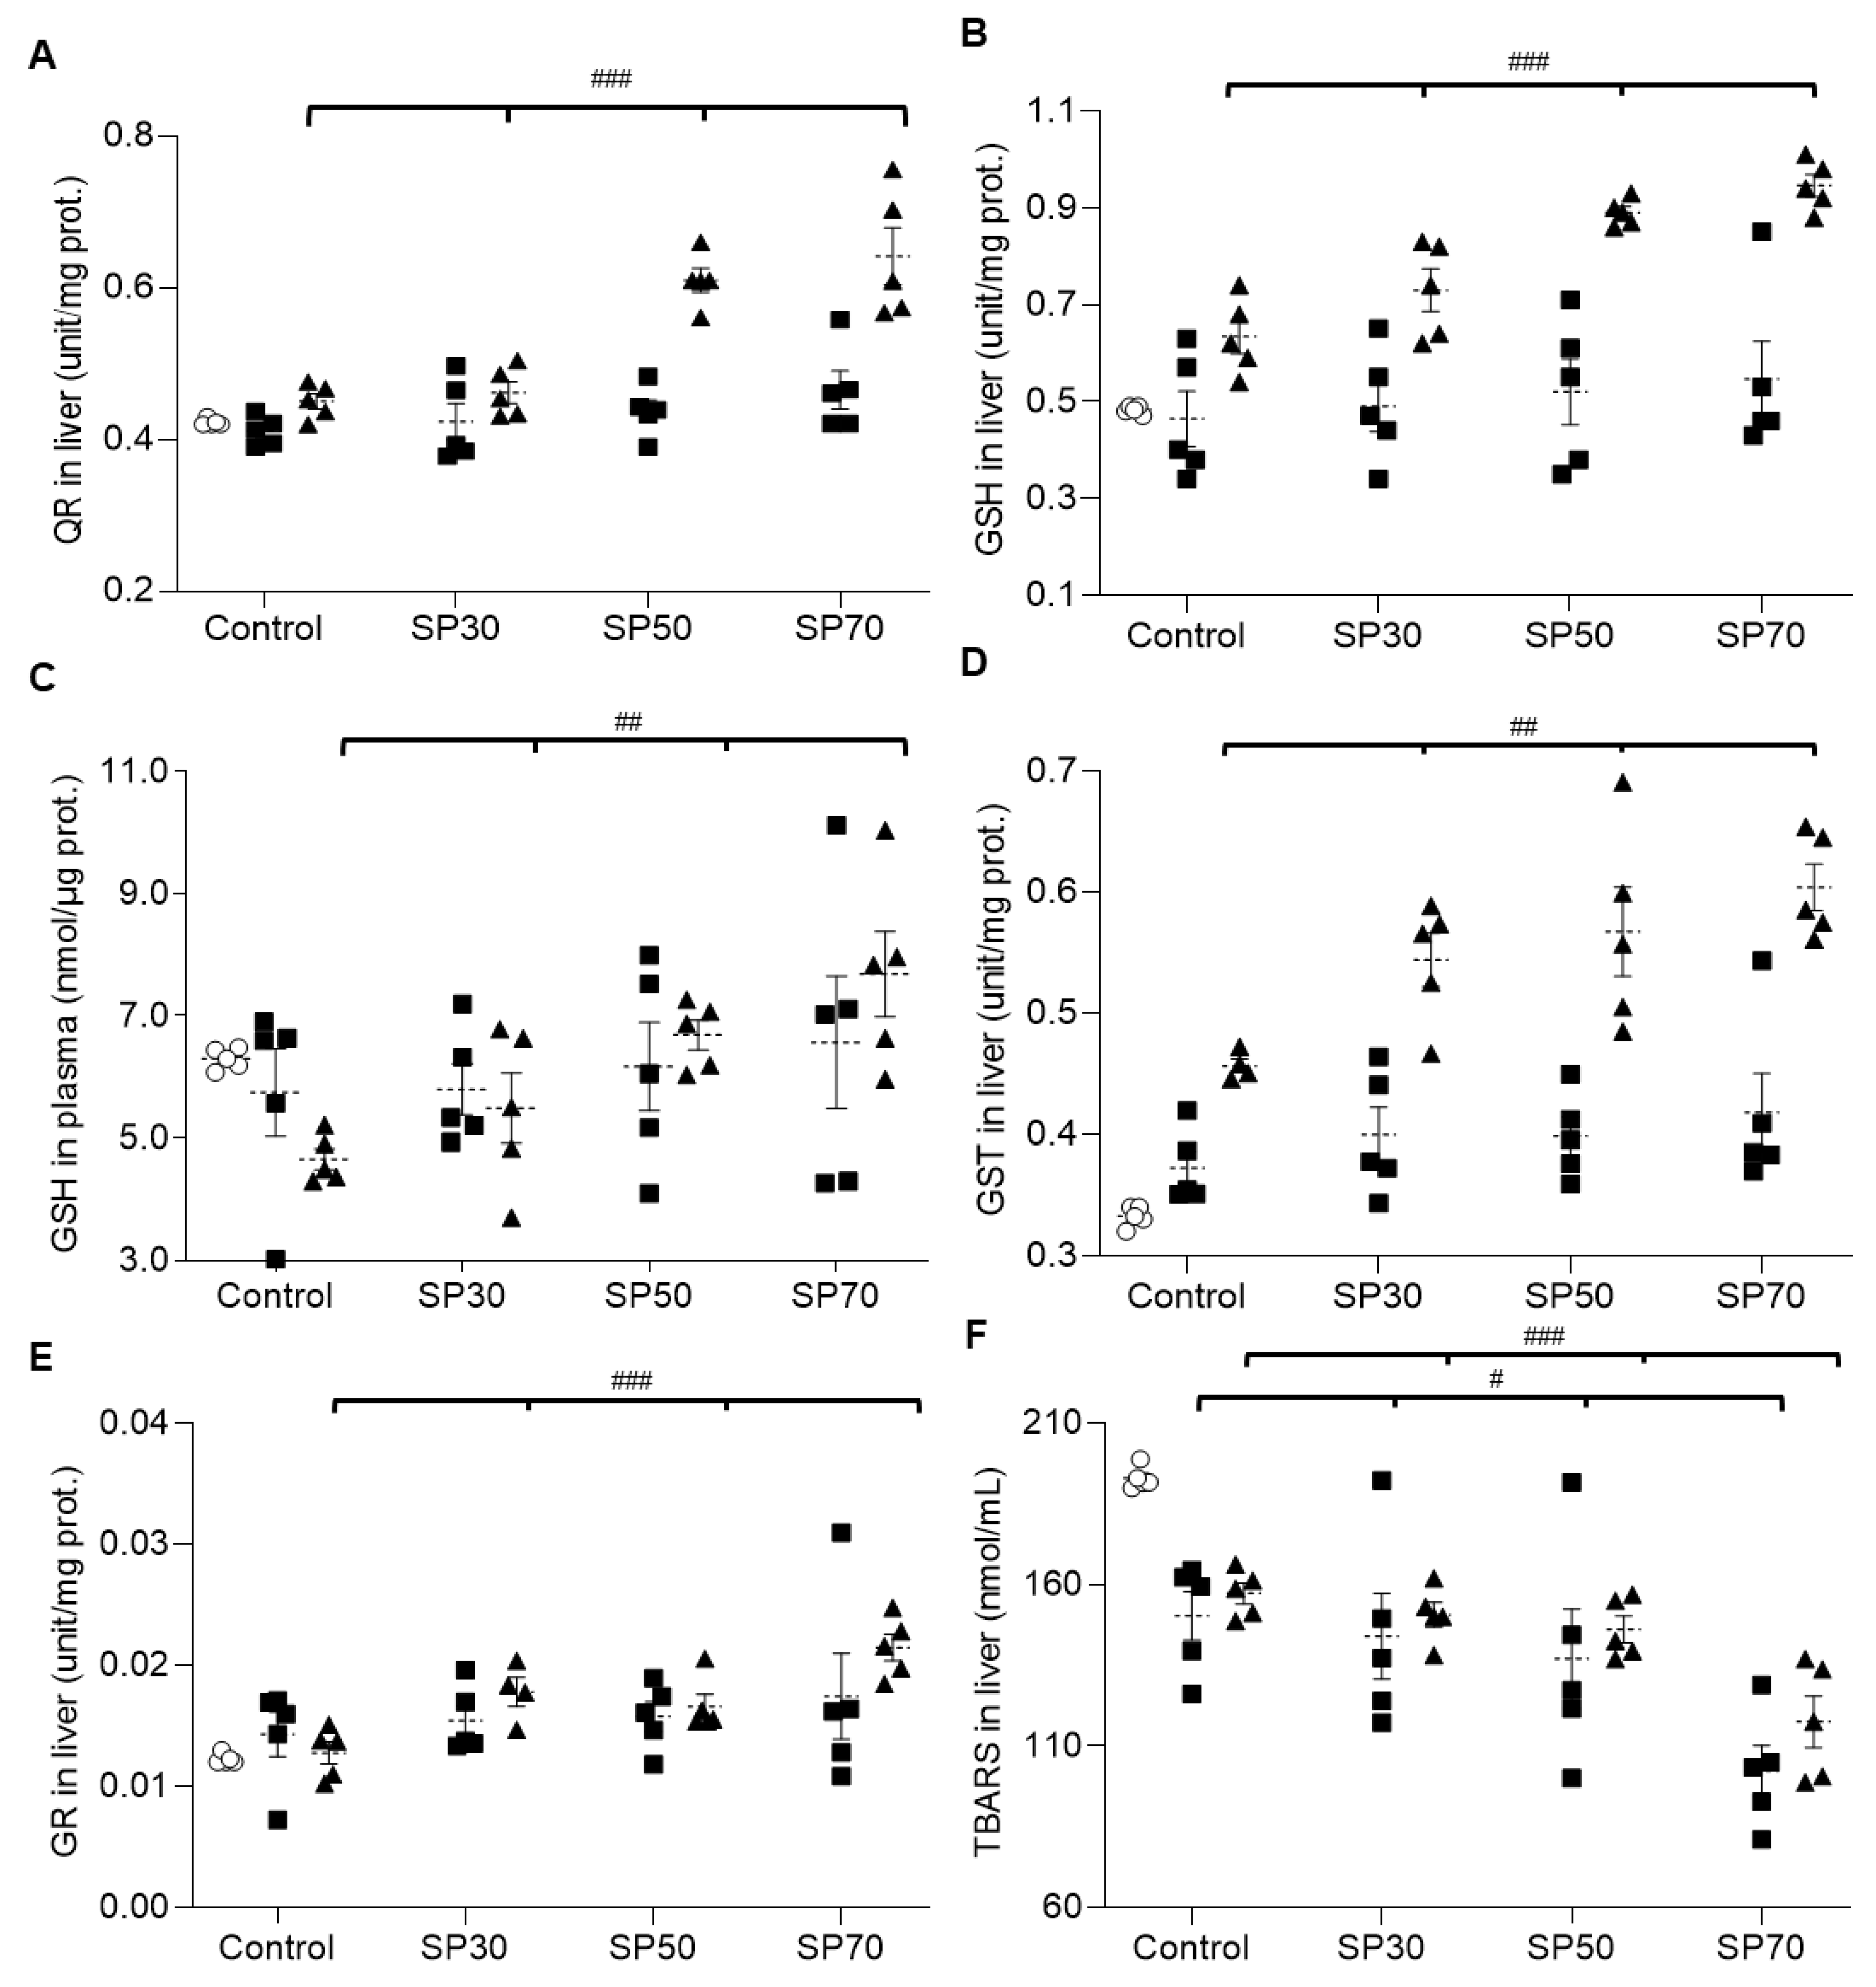
3.8. Increased Antioxidant Enzyme Activities and Reduced Lipid Peroxidation by Spirulina

Figure 4 shows the effect of spirulina on antioxidant enzyme activities in growing rat tissues. While quinone reductase (QR) and glutathione (GSH) levels in the liver did not change significantly over time in the control group, the SP50 and SP70 groups showed significant increases in QR and GSH over time (Figure 4A,B). Then, we looked at the plasma GSH level to determine whether it reflected the level of GSH released from the liver. As shown in Figure 4C, there was no statistically significant change in plasma GSH level over the 7 weeks in each group. However, at 7 weeks there were significantly higher GSH levels in the spirulina-fed groups, especially in the SP70 group, than in the control group.
Glutathione S-transferase (GST) (Figure 4D) and glutathione reductase (GR) (Figure 4E) levels in the liver also increased over time even in the control group, but at 7 weeks the GST levels in the spirulina-fed groups were significantly higher, in a dose-dependent manner, than that in the control group, thus indicating that spirulina enhances antioxidant activities in the liver and plasma.
TBARSs are formed as a by-product of lipid peroxidation. Therefore, lipid peroxidation was examined by measuring TBARS levels in various tissues of the growing rats. TBARS in the liver decreased significantly over the experimental periods (Figure 4F). However, at both 3 and 7 weeks, TBARS levels in the spirulina-fed groups decreased significantly in a dose-dependent manner from that of the control group. The TBARS levels in heart, kidney, and plasma showed the same patterns as those of TBARS levels in the liver (Figure 4G–I) at 7 weeks.
Overall, these data suggest that a higher content of spirulina is more effective in enhancing antioxidant activities and inhibiting lipid peroxidation in various tissues.

4. Discussion

Spirulina has been well considered an excellent protein source for malnourished children since it contains all eight essential amino acids and is composed of 60–70% protein (based on dry weight). However, no studies so far have reported on the effect of spirulina as a protein substitute on growth under normal dietary conditions. Therefore, we hypothesized that spirulina, a plant-origin protein, could be a functional substitution for animal protein, in our case, casein protein.
Our results show, for the first time, that spirulina was able to enhance bone growth, bone strength, BMC, and antioxidant activities by regulating GH, IGF-1, osteocalcin, and PTH in normal nutritional conditions; moreover, the higher the spirulina content, the greater the positive effect. These results indicate that, compared to the control and low concentration of spirulina substitution, a 50% or 70% spirulina protein substitution may provide more favorable effects on osteogenesis.
In addition, the blood lipid profile, liver function, and kidney function were not affected by the spirulina diet. Interestingly, lactate dehydrogenase (LDH) levels in the blood, a marker of tissue damage, were significantly lower in the SP70 group than in the other SP and control groups, suggesting that a high dietary content of spirulina might protect the body from tissue damage.
The hormonal changes observed in our model confirmed that IGF-1 is a key endocrine factor involved in bone growth modulation that can be altered by nutritional challenge. However, these hormonal alterations did not fully explain how spirulina supplementation could enhance the biomechanical properties of bones and should be studied further.
Surprisingly, there was less accumulation of epididymal, retroperitoneal, and mesenteric fat in rats fed a spirulina-supplemented diet than in those fed the control diet, suggesting that spirulina could inhibit fat accumulation without interfering with normal body and organ growth.
It was shown that a low protein diet decreases the expression of the Sirt1 gene, followed by reduced PPARα signaling, resulting in fatty liver [49]. Also, a recent study demonstrated that liver-specific disruption in GH signaling leads to a fatty liver [50]. Another study showed that spirulina could prevent the negative effects associated with reduced circulating IGF-1 levels and high hepatic fat content in a protein deficiency model [51] as well as animal models of diabetes and non-alcoholic steatohepatitis [32].
Another player in the hormonal regulation caused by spirulina would be osteocalcin. Osteocalcin, also stimulates pancreatic -cells to release more insulin, increasing insulin sensitivity [52,53,54,55,56]. Our data show that while osteocalcin levels decreased significantly in the control group over the experimental period, spirulina treatment significantly increased osteocalcin levels over time (p < 0.001); moreover, the increases were dose-dependent. Also, blood glucose levels in our study decreased dose-dependently by spirulina, but not significantly. Therefore, our data might help explain the mechanism through which spirulina prevents the development of hepatic GH resistance, followed by the reduction of fatty infiltration into the liver via regulating osteocalcin and growth hormones.
We also examined whether spirulina can protect the growing body from tissue damage caused by oxidation. The antioxidant enzyme activities of the liver, the Glutathione (GSH), glutathione reductase (GR), Glutathione S-transferase (GST), and quinone reductase (QR) activities were observed to be positively dependent on the amount of spirulina supplementation. Although plasma GSH did not show a marked increase with spirulina treatment, GSH levels in the liver were significantly increased by spirulina feeding in a dose-dependent manner. Moreover, lipid peroxidation in the liver, plasma, kidney, and heart tissues was significantly lower in spirulina-fed groups than in the control group at 7 weeks of treatment.
It was reported that spirulina exhibits antioxidant properties due to containing various phenolic compounds [57]. Although an analysis study revealed that the distributions of the total phenolic compounds varied between commercial products [23], it was claimed that chlorogenic acid, synaptic acid, salicylic acid, trans-cinnamic acid, and caffeic acid were commonly present in spirulina [58]. The antioxidant compounds in spirulina, such as phycobilins and phycocyanins, also inhibit the activities of catalytic enzymes, such as lipoxygenase and cyclooxygenase, or enhance the activity of enzymes, such as glutathione peroxidase, catalase, and superoxide dismutase [59,60]. These polyphenols were reported to have anti-inflammatory, antiviral, antioxidant, antithrombotic, vasodilatory, antidiabetic, neuroprotective, hepatoprotective, and anticarcinogenic properties [21,22,24,28,29,32,35,36,37,59,60,61,62,63]. However, the metabolic pathways for the formation of phenolic compounds in spirulina and their importance are still unknown [64].
Another beneficial component of spirulina is γ-linolenic acid. It was discovered that the amounts of γ-linolenic acid ranged from 0.16 g/100 g to 1.24 g/100 g and accounted for an average of 14% of the total polyunsaturated fatty acids in spirulina [65]. Many in vitro studies confirmed that γ-linolenic acid can be used to effectively lower cholesterol and treat atopic eczema, breast cancer, and premenstrual disorder [66,67,68].
In humans, longitudinal growth occurs until the epiphyseal plate becomes ossified in the late teens and early twenties [69]. However, rat skeleton is considered fully mature only after the age of 10 months. At the age of 10 months, peak bone mass is achieved, and the total longitudinal bone growth stops. Bone growth in the proximal tibia and distal tibia epiphysis stops at the age of 15 and 3 months, respectively, whereas lumbar vertebrae continues to grow for up to 21 months [14]. However, similar to the human skeleton, the rat skeleton shows a gradual transition from modeling to remodeling that is related to age progression and cessation of longitudinal bone growth in both cancellous and cortical bone [70,71,72,73,74].
The Food and Drug Administration requires that novel therapies in bone research must be tested both in rodents (preferably rats) and in a large animal model [75,76]. The reason for using a second species in preclinical skeletal research is the lack of the Haversian system in rodents. A potential drawback of our study to be implicated into the human is the lack of Haversian remodeling in the rat skeleton. Therefore, this difference might affect our finding when applied to the clinical setting.
For the first time, our results showed that growing rats fed a 70%/30% spirulina/casein protein diet instead of a 100% casein protein diet enhanced bone development, antioxidant activities, and minimal fat accumulation in adipose tissues without toxicity, suggesting that substitution of an animal protein source with a plant protein source such as spirulina can be beneficial. It implies that long-term dietary supplementation with spirulina from infancy to early childhood might help promote growth and lengthen the growth period.
Recently, it was found that human gut bacteria can synthesize proteinogenic amino acids and produce a range of metabolites via protein fermentation, some known to exert beneficial or harmful physiological effects on the host [77,78,79,80,81,82,83]. It is still in an early stage whether the type and amount of dietary protein consumed affect the diversity and composition of the intestinal microbiota, and the luminal environment of the intestinal epithelium and peripheral tissues on the host health. However, major progress is expected in the near future. Therefore, it would be interesting to know how spirulina supplementation affects gut microbiome profiles and what beneficial metabolites from spirulina protein could be produced, and whether, ultimately, these improve gut health as well as systemic immunity.

Supplementary Materials

The following are available online at https://www.mdpi.com/2072-6643/12/4/1187/s1, Figure S1: Effect of spirulina on kidney function, liver function, or blood glucose level; Figure S2: Effect of spirulina on blood lipid profile.

Author Contributions

Conceptualization, J.A.C., S.Y.B., S.H.C., and M.R.K.; methodology, S.Y.B., S.H.C.; software, S.Y.B.; writing—original draft preparation, J.A.C., S.Y.B., S.H.C., and M.R.K.; writing—review and editing, J.A.C., S.Y.B., M.R.K.; project administration, S.H.C.; funding acquisition, J.A.C., M.R.K. All authors have read and agreed to the published version of the manuscript.

Funding

This research was supported by the Basic Science Research Program through the National Research Foundation of Korea (NRF) funded by the Ministry of Education (2017R1D1A3B03027867: M.R.K.; NRF-2019R1A2B5B01070133: J.A.C.) and Chungnam National University Research grant (J.A.C.).

Conflicts of Interest

The authors declare no conflict of interest.

References

  1. Barak, M.M. Bone modeling or bone remodeling: That is the question. Am. J. Phys. Anthropol. 2019. [Google Scholar] [CrossRef] [PubMed]
  2. Boivin, G.; Meunie, P.J. Changes in bone remodeling rate influence the degree of mineralization of bone which is a determinant of bone strength: Therapeutic implications. Adv. Exp. Med. Biol. 2001, 496, 123–127. [Google Scholar] [CrossRef] [PubMed]
  3. Boivin, G.; Meunier, P.J. Changes in bone remodeling rate influence the degree of mineralization of bone. Connect. Tissue Res. 2002, 43, 535–537. [Google Scholar] [CrossRef] [PubMed]
  4. Bagi, C.M.; Berryman, E.; Moalli, M.R. Comparative bone anatomy of commonly used laboratory animals: Implications for drug discovery. Comp. Med. 2011, 61, 76–85. [Google Scholar] [PubMed]
  5. Oberbauer, A.M.; Peng, R. Growth hormone and IGF-I stimulate cell function in distinct zones of the rat epiphyseal growth plate. Connect. Tissue Res. 1995, 31, 189–195. [Google Scholar] [CrossRef]
  6. Medill, N.J.; Praul, C.A.; Ford, B.C.; Leach, R.M. Parathyroid hormone-related peptide expression in the epiphyseal growth plate of the juvenile chicken: Evidence for the origin of the parathyroid hormone-related peptide found in the epiphyseal growth plate. J. Cell. Biochem. 2001, 80, 504–511. [Google Scholar] [CrossRef]
  7. Canalis, E. Growth factor control of bone mass. J. Cell. Biochem. 2009, 108, 769–777. [Google Scholar] [CrossRef] [Green Version]
  8. Yuan, R.; Tsaih, S.W.; Petkova, S.B.; De Evsikova, C.M.; Xing, S.; Marion, M.A.; Bogue, M.A.; Mills, K.D.; Peters, L.L.; Bult, C.J.; et al. Aging in inbred strains of mice: Study design and interim report on median lifespans and circulating IGF1 levels. Aging Cell 2009, 8, 277–287. [Google Scholar] [CrossRef] [Green Version]
  9. Denley, A.; Cosgrove, L.J.; Booker, G.W.; Wallace, J.C.; Forbes, B.E. Molecular interactions of the IGF system. Cytokine Growth Factor Rev. 2005, 16, 421–439. [Google Scholar] [CrossRef]
  10. Bennis-Taleb, N.; Remacle, C.; Hoet, J.J.; Reusens, B. A low-protein isocaloric diet during gestation affects brain development and alters permanently cerebral cortex blood vessels in rat offspring. J. Nutr. 1999, 129, 1613–1619. [Google Scholar] [CrossRef] [Green Version]
  11. Reichling, T.D.; German, R.Z. Bones, muscles and visceral organs of protein-malnourished rats (Rattus norvegicus) grow more slowly but for longer durations to reach normal final size. J. Nutr. 2000, 130, 2326–2332. [Google Scholar] [CrossRef] [PubMed] [Green Version]
  12. Fournier, C.; Rizzoli, R.; Ammann, P. Low calcium-phosphate intakes modulate the low-protein diet-related effect on peak bone mass acquisition: A hormonal and bone strength determinants study in female growing rats. Endocrinology 2014, 155, 4305–4315. [Google Scholar] [CrossRef] [PubMed] [Green Version]
  13. Chevalley, T.; Bonjour, J.P.; Ferrari, S.; Rizzoli, R. High-protein intake enhances the positive impact of physical activity on BMC in prepubertal boys. J. Bone Miner. Res. 2008, 23, 131–142. [Google Scholar] [CrossRef] [PubMed]
  14. Frenk, S.; Gomez, F.; Ramos-Galvan, R.; Cravioto, J. Fatty liver in children; kwashiorkor. Am. J. Clin. Nutr. 1958, 6, 298–309. [Google Scholar] [CrossRef]
  15. Omstedt, P.T.; von der Decken, A.; Hedenskog, G.; Mogren, H. Nutritive value of processed Saccharomyces cerevisiae, Scenedesmus obliquus and Spirulina platensis as measured by protein synthesis in vitro in rat skeletal muscle. J. Sci. Food Agric. 1973, 24, 1103–1113. [Google Scholar] [CrossRef]
  16. Al'bitskaia, O.N.; Zaitseva, G.N.; Rogozhin, S.V.; Pakhomova, M.V.; Oshanina, N.P. [Comparative evaluation of methods for isolating total protein from the biomass of Spirulina platensis]. Prikladnaia Biokhimiia I Mikrobiologiia 1979, 15, 612–617. [Google Scholar]
  17. Volkmann, H.; Imianovsky, U.; Oliveira, J.L.; Sant’anna, E.S. Cultivation of Arthrospira (spirulina) platensis in desalinator wastewater and salinated synthetic medium: Protein content and amino-acid profile. Braz. J. Microbiol. 2008, 39, 98–101. [Google Scholar] [CrossRef] [Green Version]
  18. Senachak, J.; Cheevadhanarak, S.; Hongsthong, A. SpirPro: A Spirulina proteome database and web-based tools for the analysis of protein-protein interactions at the metabolic level in Spirulina (Arthrospira) platensis C1. BMC Bioinform. 2015, 16, 233. [Google Scholar] [CrossRef] [Green Version]
  19. Maranesi, M.; Barzanti, V.; Carenini, G.; Gentili, P. Nutritional studies on Spirulina maxima. Acta Vitaminol. Enzymol. 1984, 6, 295–304. [Google Scholar]
  20. Padyana, A.K.; Bhat, V.B.; Madyastha, K.M.; Rajashankar, K.R.; Ramakumar, S. Crystal structure of a light-harvesting protein C-phycocyanin from Spirulina platensis. Biochem. Biophys. Res. Commun. 2001, 282, 893–898. [Google Scholar] [CrossRef]
  21. Sun, J.Y.; Hou, Y.J.; Fu, X.Y.; Fu, X.T.; Ma, J.K.; Yang, M.F.; Sun, B.L.; Fan, C.D.; Oh, J. Selenium-Containing Protein From Selenium-Enriched Spirulina platensis Attenuates Cisplatin-Induced Apoptosis in MC3T3-E1 Mouse Preosteoblast by Inhibiting Mitochondrial Dysfunction and ROS-Mediated Oxidative Damage. Front. Physiol. 2018, 9, 1907. [Google Scholar] [CrossRef] [PubMed]
  22. Zhao, B.; Cui, Y.; Fan, X.; Qi, P.; Liu, C.; Zhou, X.; Zhang, X. Anti-obesity effects of Spirulina platensis protein hydrolysate by modulating brain-liver axis in high-fat diet fed mice. PLoS ONE 2019, 14, e0218543. [Google Scholar] [CrossRef] [PubMed] [Green Version]
  23. Al-Dhabi, N.A.; Valan Arasu, M. Quantification of Phytochemicals from Commercial Spirulina Products and Their Antioxidant Activities. Evid. Based Complement. Altern. Med. 2016, 2016, 7631864. [Google Scholar] [CrossRef] [PubMed] [Green Version]
  24. Pinero Estrada, J.E.; Bermejo Bescos, P.; Villar del Fresno, A.M. Antioxidant activity of different fractions of Spirulina platensis protean extract. Farmaco 2001, 56, 497–500. [Google Scholar] [CrossRef]
  25. Park, H.J.; Lee, Y.J.; Ryu, H.K.; Kim, M.H.; Chung, H.W.; Kim, W.Y. A randomized double-blind, placebo-controlled study to establish the effects of spirulina in elderly Koreans. Ann. Nutr. Metab. 2008, 52, 322–328. [Google Scholar] [CrossRef]
  26. Simpore, J.; Kabore, F.; Zongo, F.; Dansou, D.; Bere, A.; Pignatelli, S.; Biondi, D.M.; Ruberto, G.; Musumeci, S. Nutrition rehabilitation of undernourished children utilizing Spiruline and Misola. Nutr. J. 2006, 5, 3. [Google Scholar] [CrossRef] [Green Version]
  27. Tranquille, N.; Emeis, J.J.; de Chambure, D.; Binot, R.; Tamponnet, C. Spirulina acceptability trials in rats. A study for the “MELISSA” life-support system. Adv. Space Res. 1994, 14, 167–170. [Google Scholar] [CrossRef] [Green Version]
  28. Salazar, M.; Chamorro, G.A.; Salazar, S.; Steele, C.E. Effect of Spirulina maxima consumption on reproduction and peri- and postnatal development in rats. Food Chem. Toxicol. 1996, 34, 353–359. [Google Scholar] [CrossRef]
  29. Voltarelli, F.A.; de Mello, M.A. Spirulina enhanced the skeletal muscle protein in growing rats. Eur. J. Nutr. 2008, 47, 393–400. [Google Scholar] [CrossRef]
  30. Lupatini, A.L.; Colla, L.M.; Canan, C.; Colla, E. Potential application of microalga Spirulina platensis as a protein source. J. Sci. Food Agric. 2017, 97, 724–732. [Google Scholar] [CrossRef]
  31. Azabji-Kenfack, M.; Dikosso, S.E.; Loni, E.G.; Onana, E.A.; Sobngwi, E.; Gbaguidi, E.; Kana, A.L.; Nguefack-Tsague, G.; Von der Weid, D.; Njoya, O.; et al. Potential of Spirulina Platensis as a Nutritional Supplement in Malnourished HIV-Infected Adults in Sub-Saharan Africa: A Randomised, Single-Blind Study. Nutr. Metab. Insights 2011, 4, 29–37. [Google Scholar] [CrossRef] [PubMed] [Green Version]
  32. Moura, L.P.; Puga, G.M.; Beck, W.R.; Teixeira, I.P.; Ghezzi, A.C.; Silva, G.A.; Mello, M.A. Exercise and spirulina control non-alcoholic hepatic steatosis and lipid profile in diabetic Wistar rats. Lipids Health Dis. 2011, 10, 77. [Google Scholar] [CrossRef] [PubMed] [Green Version]
  33. Laib, A.; Barou, O.; Vico, L.; Lafage-Proust, M.H.; Alexandre, C.; Rugsegger, P. 3D micro-computed tomography of trabecular and cortical bone architecture with application to a rat model of immobilisation osteoporosis. Med. Biol. Eng. Comput. 2000, 38, 326–332. [Google Scholar] [CrossRef] [PubMed]
  34. Jiang, S.D.; Shen, C.; Jiang, L.S.; Dai, L.Y. Differences of bone mass and bone structure in osteopenic rat models caused by spinal cord injury and ovariectomy. Osteoporos. Int. 2007, 18, 743–750. [Google Scholar] [CrossRef] [PubMed]
  35. Fournier, C.; Rizzoli, R.; Bouzakri, K.; Ammann, P. Selective protein depletion impairs bone growth and causes liver fatty infiltration in female rats: Prevention by Spirulina alga. Osteoporos. Int. 2016, 27, 3365–3376. [Google Scholar] [CrossRef]
  36. Cheong, S.H.; Kim, M.Y.; Sok, D.E.; Hwang, S.Y.; Kim, J.H.; Kim, H.R.; Lee, J.H.; Kim, Y.B.; Kim, M.R. Spirulina prevents atherosclerosis by reducing hypercholesterolemia in rabbits fed a high-cholesterol diet. J. Nutr. Sci. Vitaminol. (Tokyo) 2010, 56, 34–40. [Google Scholar] [CrossRef] [Green Version]
  37. Kim, M.Y.; Cheong, S.H.; Lee, J.H.; Kim, M.J.; Sok, D.E.; Kim, M.R. Spirulina improves antioxidant status by reducing oxidative stress in rabbits fed a high-cholesterol diet. J. Med. Food 2010, 13, 420–426. [Google Scholar] [CrossRef]
  38. Nyberg, F.; Burman, P. Growth hormone and its receptors in the central nervous system--location and functional significance. Horm. Res. Paediatr. 1996, 45, 18–22. [Google Scholar] [CrossRef]
  39. Forshee, B.A. The aging brain: Is function dependent on growth hormone/insulin-like growth factor-1 signaling? Age 2006, 28, 173–180. [Google Scholar] [CrossRef] [Green Version]
  40. Laron, Z. Childhood-onset growth hormone deficiency, cognitive function and brain N-acetylaspartate. Psychoneuroendocrinology 2006, 31, 680. [Google Scholar] [CrossRef]
  41. Lazurova, I.; Pura, M.; Wagnerova, H.; Tajtakova, M.; Sedlakova, M.; Tomas, L.; Payer, J.; Hruzikova, P.; Vanuga, P.; Podoba, J.; et al. Effect of growth hormone replacement therapy on plasma brain natriuretic peptide concentration, cardiac morphology and function in adults with growth hormone deficiency. Exp. Clin. Endocrinol. Diabetes 2010, 118, 172–176. [Google Scholar] [CrossRef] [PubMed]
  42. Nashiro, K.; Guevara-Aguirre, J.; Braskie, M.N.; Hafzalla, G.W.; Velasco, R.; Balasubramanian, P.; Wei, M.; Thompson, P.M.; Mather, M.; Nelson, M.D.; et al. Brain Structure and Function Associated with Younger Adults in Growth Hormone Receptor-Deficient Humans. J. Neurosci. 2017, 37, 1696–1707. [Google Scholar] [CrossRef] [PubMed] [Green Version]
  43. van Dam, P.S.; de Winter, C.F.; de Vries, R.; van der Grond, J.; Drent, M.L.; Lijffijt, M.; Kenemans, J.L.; Aleman, A.; de Haan, E.H.; Koppeschaar, H.P. Childhood-onset growth hormone deficiency, cognitive function and brain N-acetylaspartate. Psychoneuroendocrinology 2005, 30, 357–363. [Google Scholar] [CrossRef] [PubMed]
  44. Webb, E.A.; O’Reilly, M.A.; Clayden, J.D.; Seunarine, K.K.; Chong, W.K.; Dale, N.; Salt, A.; Clark, C.A.; Dattani, M.T. Effect of growth hormone deficiency on brain structure, motor function and cognition. Brain 2012, 135, 216–227. [Google Scholar] [CrossRef] [Green Version]
  45. Zhang, H.; Han, M.; Zhang, X.; Sun, X.; Ling, F. The effect and mechanism of growth hormone replacement on cognitive function in rats with traumatic brain injury. PLoS ONE 2014, 9, e108518. [Google Scholar] [CrossRef] [Green Version]
  46. Baumann, G. Genetic characterization of growth hormone deficiency and resistance: Implications for treatment with recombinant growth hormone. Am. J. Pharmacogenomics 2002, 2, 93–111. [Google Scholar] [CrossRef]
  47. Juul, A.; Kastrup, K.W.; Pedersen, S.A.; Skakkebaek, N.E. Growth hormone (GH) provocative retesting of 108 young adults with childhood-onset GH deficiency and the diagnostic value of insulin-like growth factor I (IGF-I) and IGF-binding protein-3. J. Clin. Endocrinol. Metab. 1997, 82, 1195–1201. [Google Scholar] [CrossRef] [Green Version]
  48. Coetzee, M.; Kruger, M.C. Osteoprotegerin-receptor activator of nuclear factor-kappaB ligand ratio: A new approach to osteoporosis treatment? South. Med. J. 2004, 97, 506–511. [Google Scholar] [CrossRef]
  49. Xu, F.; Gao, Z.; Zhang, J.; Rivera, C.A.; Yin, J.; Weng, J.; Ye, J. Lack of SIRT1 (Mammalian Sirtuin 1) activity leads to liver steatosis in the SIRT1+/- mice: A role of lipid mobilization and inflammation. Endocrinology 2010, 151, 2504–2514. [Google Scholar] [CrossRef] [Green Version]
  50. Barclay, J.L.; Nelson, C.N.; Ishikawa, M.; Murray, L.A.; Kerr, L.M.; McPhee, T.R.; Powell, E.E.; Waters, M.J. GH-dependent STAT5 signaling plays an important role in hepatic lipid metabolism. Endocrinology 2011, 152, 181–192. [Google Scholar] [CrossRef]
  51. Bao, Y.; Ma, X.; Yang, R.; Wang, F.; Hao, Y.; Dou, J.; He, H.; Jia, W. Inverse relationship between serum osteocalcin levels and visceral fat area in Chinese men. J. Clin. Endocrinol. Metab. 2013, 98, 345–351. [Google Scholar] [CrossRef] [PubMed]
  52. Addai, D.; Zarkos, J.; Tolekova, A. The bone hormones and their potential effects on glucose and energy metabolism. Endocr. Regul. 2019, 53, 268–273. [Google Scholar] [CrossRef] [Green Version]
  53. Bae, S.J.; Choe, J.W.; Chung, Y.E.; Kim, B.J.; Lee, S.H.; Kim, H.Y.; Koh, J.M.; Kim, H.K.; Kim, G.S. The association between serum osteocalcin levels and metabolic syndrome in Koreans. Osteoporos. Int. 2011, 22, 2837–2846. [Google Scholar] [CrossRef] [PubMed]
  54. Buday, B.; Kulcsar, E.; Literati Nagy, B.; Horvath, T.; Vitai, M.; Vecsei, I.; Bezzegh, K.; Kiss, J.; Peterfai, E.; Koltay, L.; et al. [The role of osteocalcin in the connection of bone and glucose metabolism in humans]. Orv. Hetil. 2008, 149, 2453–2461. [Google Scholar] [CrossRef] [PubMed]
  55. Chen, L.; Li, Q.; Yang, Z.; Ye, Z.; Huang, Y.; He, M.; Wen, J.; Wang, X.; Lu, B.; Hu, J.; et al. Osteocalcin, glucose metabolism, lipid profile and chronic low-grade inflammation in middle-aged and elderly Chinese. Diabet. Med. 2013, 30, 309–317. [Google Scholar] [CrossRef] [PubMed]
  56. Guedes, J.A.C.; Esteves, J.V.; Morais, M.R.; Zorn, T.M.; Furuya, D.T. Osteocalcin improves insulin resistance and inflammation in obese mice: Participation of white adipose tissue and bone. Bone 2018, 115, 68–82. [Google Scholar] [CrossRef]
  57. Wu, L.C.; Ho, J.A.; Shieh, M.C.; Lu, I.W. Antioxidant and antiproliferative activities of Spirulina and Chlorella water extracts. J. Agric. Food Chem. 2005, 53, 4207–4212. [Google Scholar] [CrossRef]
  58. Miranda, M.S.; Cintra, R.G.; Barros, S.B.; Mancini Filho, J. Antioxidant activity of the microalga Spirulina maxima. Braz. J. Med. Biol. Res. 1998, 31, 1075–1079. [Google Scholar] [CrossRef]
  59. Bhat, V.B.; Madyastha, K.M. Scavenging of peroxynitrite by phycocyanin and phycocyanobilin from Spirulina platensis: Protection against oxidative damage to DNA. Biochem. Biophys. Res. Commun. 2001, 285, 262–266. [Google Scholar] [CrossRef]
  60. Chaiklahan, R.; Chirasuwan, N.; Triratana, P.; Loha, V.; Tia, S.; Bunnag, B. Polysaccharide extraction from Spirulina sp. and its antioxidant capacity. Int. J. Biol. Macromol. 2013, 58, 73–78. [Google Scholar] [CrossRef]
  61. Koh, E.J.; Kim, K.J.; Song, J.H.; Choi, J.; Lee, H.Y.; Kang, D.H.; Heo, H.J.; Lee, B.Y. Spirulina maxima Extract Ameliorates Learning and Memory Impairments via Inhibiting GSK-3beta Phosphorylation Induced by Intracerebroventricular Injection of Amyloid-beta 1-42 in Mice. Int. J. Mol. Sci. 2017, 18, 2401. [Google Scholar] [CrossRef] [Green Version]
  62. Khan, M.; Shobha, J.C.; Mohan, I.K.; Naidu, M.U.; Sundaram, C.; Singh, S.; Kuppusamy, P.; Kutala, V.K. Protective effect of Spirulina against doxorubicin-induced cardiotoxicity. Phytother. Res. 2005, 19, 1030–1037. [Google Scholar] [CrossRef] [PubMed]
  63. Khan, M.; Shobha, J.C.; Mohan, I.K.; Rao Naidu, M.U.; Prayag, A.; Kutala, V.K. Spirulina attenuates cyclosporine-induced nephrotoxicity in rats. J. Appl. Toxicol. 2006, 26, 444–451. [Google Scholar] [CrossRef] [PubMed]
  64. Colla, L.M.; Oliveira Reinehr, C.; Reichert, C.; Costa, J.A. Production of biomass and nutraceutical compounds by Spirulina platensis under different temperature and nitrogen regimes. Bioresour. Technol. 2007, 98, 1489–1493. [Google Scholar] [CrossRef] [PubMed]
  65. Reddy, D.R.; Prassad, V.S.; Das, U.N. Intratumoural injection of gamma leinolenic acid in malignant gliomas. J. Clin. Neurosci. 1998, 5, 36–39. [Google Scholar] [CrossRef]
  66. Jenkins, A.P.; Thompson, R.P. Trophic effect of Efamol on the rat small-intestinal mucosa. Clin. Sci. (Lond.) 1989, 77, 555–559. [Google Scholar] [CrossRef]
  67. Uccella, R.; Contini, A.; Sartorio, M. [Action of evening primrose oil on cardiovascular risk factors in insulin-dependent diabetics]. La Clinica Terapeutica 1989, 129, 381–388. [Google Scholar]
  68. Ishikawa, T.; Fujiyama, Y.; Igarashi, O.; Morino, M.; Tada, N.; Kagami, A.; Sakamoto, T.; Nagano, M.; Nakamura, H. Effects of gammalinolenic acid on plasma lipoproteins and apolipoproteins. Atherosclerosis 1989, 75, 95–104. [Google Scholar] [CrossRef]
  69. Maggioli, C.; Stagi, S. Bone modeling, remodeling, and skeletal health in children and adolescents: Mineral accrual, assessment and treatment. Ann. Pediatr. Endocrinol. Metab. 2017, 22, 1–5. [Google Scholar] [CrossRef] [Green Version]
  70. Buck, D.W., 2nd; Dumanian, G.A. Bone biology and physiology: Part II. Clinical correlates. Plast. Reconstr. Surg. 2012, 129, 950e–956e. [Google Scholar] [CrossRef]
  71. Buck, D.W., 2nd; Dumanian, G.A. Bone biology and physiology: Part I. The fundamentals. Plast. Reconstr. Surg. 2012, 129, 1314–1320. [Google Scholar] [CrossRef] [PubMed]
  72. Spangler, J.G. Bone biology and physiology: Implications for novel osteoblastic osteosarcoma treatments? Med. Hypotheses 2008, 70, 281–286. [Google Scholar] [CrossRef] [PubMed]
  73. Iwaniec, U.T.; Yuan, D.; Power, R.A.; Wronski, T.J. Strain-dependent variations in the response of cancellous bone to ovariectomy in mice. J. Bone Miner. Res. 2006, 21, 1068–1074. [Google Scholar] [CrossRef] [PubMed]
  74. Turner, C.H. Bone strength: Current concepts. Ann. N. Y. Acad. Sci. 2006, 1068, 429–446. [Google Scholar] [CrossRef]
  75. Thompson, D.D.; Simmons, H.A.; Pirie, C.M.; Ke, H.Z. FDA Guidelines and animal models for osteoporosis. Bone 1995, 17, 125S–133S. [Google Scholar] [CrossRef]
  76. Bagi, C.M.; Wilkie, D.; Georgelos, K.; Williams, D.; Bertolini, D. Morphological and structural characteristics of the proximal femur in human and rat. Bone 1997, 21, 261–267. [Google Scholar] [CrossRef]
  77. Beaumont, M.; Portune, K.J.; Steuer, N.; Lan, A.; Cerrudo, V.; Audebert, M.; Dumont, F.; Mancano, G.; Khodorova, N.; Andriamihaja, M.; et al. Quantity and source of dietary protein influence metabolite production by gut microbiota and rectal mucosa gene expression: A randomized, parallel, double-blind trial in overweight humans. Am. J. Clin. Nutr. 2017, 106, 1005–1019. [Google Scholar] [CrossRef] [Green Version]
  78. Wang, Z.; Bergeron, N.; Levison, B.S.; Li, X.S.; Chiu, S.; Jia, X.; Koeth, R.A.; Li, L.; Wu, Y.; Tang, W.H.W.; et al. Impact of chronic dietary red meat, white meat, or non-meat protein on trimethylamine N-oxide metabolism and renal excretion in healthy men and women. Eur. Heart J. 2019, 40, 583–594. [Google Scholar] [CrossRef]
  79. Pi, Y.; Gao, K.; Peng, Y.; Mu, C.L.; Zhu, W.Y. Antibiotic-induced alterations of the gut microbiota and microbial fermentation in protein parallel the changes in host nitrogen metabolism of growing pigs. Animal 2019, 13, 262–272. [Google Scholar] [CrossRef]
  80. Mafra, D.; Barros, A.F.; Fouque, D. Dietary protein metabolism by gut microbiota and its consequences for chronic kidney disease patients. Future Microbiol. 2013, 8, 1317–1323. [Google Scholar] [CrossRef]
  81. Nakatani, A.; Li, X.; Miyamoto, J.; Igarashi, M.; Watanabe, H.; Sutou, A.; Watanabe, K.; Motoyama, T.; Tachibana, N.; Kohno, M.; et al. Dietary mung bean protein reduces high-fat diet-induced weight gain by modulating host bile acid metabolism in a gut microbiota-dependent manner. Biochem. Biophys. Res. Commun. 2018, 501, 955–961. [Google Scholar] [CrossRef] [PubMed]
  82. Liu, C.W.; Chi, L.; Tu, P.; Xue, J.; Ru, H.; Lu, K. Quantitative proteomics reveals systematic dysregulations of liver protein metabolism in sucralose-treated mice. J. Proteom. 2019, 196, 1–10. [Google Scholar] [CrossRef] [PubMed]
  83. Hua, P.; Xiong, Y.; Yu, Z.; Liu, B.; Zhao, L. Effect of Chlorella Pyrenoidosa Protein Hydrolysate-Calcium Chelate on Calcium Absorption Metabolism and Gut Microbiota Composition in Low-Calcium Diet-Fed Rats. Mar. Drugs 2019, 17, 348. [Google Scholar] [CrossRef] [PubMed] [Green Version]
Figure 1. Effect of spirulina on the weight of body, organs, and fat tissues. Weights of (A) body, (B) liver (g/100 g BW), (C) kidney (g/100 g BW), (D) heart (g/100 g BW), (E) mesenteric fat (g/100 g BW), (F) retroperitoneal fat (g/100 g BW), (G) epididymal fat (g/100 g BW), and (H) total fat (g/100 g BW) were measured in growing male rats over the 7-week course of the study. Data are mean ± SEM values. Significant differences were determined using t-tests or one-way ANOVA with post hoc Duncan’s multiple-range test comparisons. *** p < 0.001 between weeks within a group and # p < 0.05, ## p < 0.01, or ### p< 0.001 between groups in the same week. Control: AIN 93G diet; SP30: 30% of protein source replaced with spirulina; SP50: 50% of protein source replaced with spirulina; SP70: 70% of protein source replaced with spirulina. The week of the treatment is represented by O: 0 weeks; ■: 3 weeks; ▲: 7 weeks in each group.
Nutrients 12 01187 g001
Figure 2. Effect of spirulina on bone growth, bone strength, and bone mineral content (BMC). (A) Femur length, (B) femur weight, (C) lumbar spine length, (D) lumbar spine weight, (E) breaking force of femur, (F) Ca content of femur, (G) Mg content of femur, and (H) phosphate content of femur were measured in growing male rats over the 7-week course of the study. Data are mean ± SEM values. Significant differences were determined using t-tests or one-way ANOVA with post hoc Duncan’s multiple-range test comparisons. # p < 0.05, ## p < 0.01, or ### p < 0.001 between groups in the same week. Control: AIN 93G diet; SP30: 30% of protein source replaced with spirulina; SP50: 50% of protein source replaced with spirulina; SP70: 70% of protein source replaced with spirulina. The week of the treatment is represented by O: 0 weeks; ■: 3 weeks; ▲: 7 weeks in each group.
Nutrients 12 01187 g002
Figure 3. Effect of spirulina on growth hormones and related hormones in blood. Plasma (A) Growth hormone (GH), (B) insulin-like growth factor 1 (IGF-1), (C) insulin-like growth factor binding protein 3 (IGFBP-3), (D) osteocalcin, (E) free calcium, (F) free phosphate, and (G) parathyroid hormones (PTHs) were measured in growing male rats over the 7-week course of study. Data are mean ± SEM values. Significant differences were determined using t-tests or one-way ANOVA with post hoc Duncan’s multiple-range test comparisons. * p < 0.05, ** p < 0.01 between weeks within a group and # p < 0.05, ## p < 0.01, or ### p < 0.001 between groups in the same week. Control: AIN 93G diet; SP30: 30% of protein source replaced with spirulina; SP50: 50% of protein source replaced with spirulina; SP70: 70% of protein source replaced with spirulina. The week of the treatment is represented by O: 0 weeks; ■: 3 weeks; ▲: 7 weeks in each group. White bar: 0 weeks; black bar: 7 weeks.
Nutrients 12 01187 g003
Figure 4. Effect of spirulina on antioxidant activities and lipid peroxidation. (A) quinone reductase (QR) in liver, (B) glutathione (GSH) in liver, (C) GSH in plasma, (D) glutathione S-transferase (GST) in liver, (E) glutathione reductase (GR) in liver, (F) thiobar–bituric acid reactive substance (TBARS) in liver, (G) TBARS in heart, (H) TBARS in kidney, and (I) TBARS in plasma were measured in growing male rats fed with control, SP30, SP50, and SP70 diet over the 7-week course of the study. Data are mean ± SEM values. Significant differences were determined using one-way ANOVA with post hoc Duncan’s multiple-range test comparisons. # p < 0.05, ## p < 0.01, or ### p < 0.001 between groups in the same week. Control: AIN 93G diet; SP30: 30% of protein source replaced with spirulina; SP50: 50% of protein source replaced with spirulina; SP70: 70% of protein source replaced with spirulina. The week of the treatment is represented by O: 0 weeks; ■: 3 weeks; ▲: 7 weeks in each group. White bar: 0 weeks; black bar: 7 weeks.
Nutrients 12 01187 g004aNutrients 12 01187 g004b
Table 1. Experimental design of the study.
Experimental GroupDietNumber of Mice
ControlAIN93G 17
SP3030% of AIN93G replaced by spirulina 17
SP5050% of AIN93G replaced by spirulina 17
SP7070% of AIN93G replaced by spirulina 17
Total 68
Table 2. Composition of freeze-dried powder of spirulina.
Composition
Macronutrients (g/100 g)Phytonutrients (mg/100 g)
Calories (kcal/100 g)360.70Phycocyanin8000.00
Moisture (%/100 g)8.70Chlorophyll a1300.00
Carbohydrate17.50
Fat4.30
Protein63.00
Dietary fiber6.50
Vitamins (mg/100 g)Minerals (mg/100 g)
Vitamin A2.95Calcium98.80
β-Carotene177.00Iron40.90
Vitamin B13.08Phosphorus859.00
Vitamin B23.74Magnesium319.00
Vitamin B60.83Zinc1.28
Vitamin B120.18Copper0.32
Vitamin E12.70Manganese3.77
α-Tocopherol12.50Chromium0.06
β-Tocopherol0.50Potassium1560.00
Vitamin K11.59
Vitamin K20.08
Folic acid0.08
Niacin23.50
Table 3. Composition of experimental diets.
Components (g/kg Diet)Group
ControlSP30SP50SP70
Casein200.00140.00100.0060.00
Corn starch397.49377.28363.81350.34
Dyetrose132.00132.00132.00132.00
Sucrose100.00100.00100.00100.00
Cellulose50.0043.8139.6835.56
Soybean oil70.0065.9163.1860.45
t-Butylhydroquinone0.010.010.010.01
Salt mix35.0031.0628.4325.80
Vitamin mix10.009.208.668.13
L-cystine3.003.003.003.00
Choline bitartrate2.502.502.502.50
Spirulina0.0095.24158.73222.22
TOTAL1000.001000.001000.001000.00
Total energy (kcal)3948.073945.633944.003942.29
Nutrition from spirulina
Energy (kcal)0355.24592.06828.81
Protein 060.00100.00139.99
Fat 04.106.839.56
Carbohydrate 016.6727.7838.89
Fiber 06.1910.3214.44
Total vitamin 00.801.341.87
Total mineral 03.956.579.20
Table 4. Body weight, food intake, and food efficiency ratio of the rats fed with spirulina.
ControlSP30SP50SP70
3 weeksWeight (g)179.1 ± 11.0 NS188.7 ± 2.2180.4 ± 5.3176.9 ± 6.1
Food intake (g/d)24.6 ± 0.6 NS24.6 ± 0.424.4 ± 0.424.6 ± 0.4
FER (%)13.9 ± 0.6 NS13.0 ± 0.313.6 ± 0.213.9 ± 0.3
7 weeksWeight (g)378.9 ± 12.2 NS356.6 ± 11.8341.8 ± 2.5369.4 ± 13.4
Food intake (g/d)30.0 ± 1.0 NS 28.3 ± 0.827.5 ± 0.626.7 ± 1.7
FER (%)8.0 ± 0.3 NS7.9 ± 0.28.1 ± 0.28.2 ± 0.3
All values are mean ± SEM. One-way ANOVA test at p < 0.05 by Duncan’s multiple-range test. NS: not significant. g/d: gram per day, FER (food efficiency ratio).

