Saccharin Supplementation Inhibits Bacterial Growth and Reduces Experimental Colitis in Mice

 ,
,  and
and 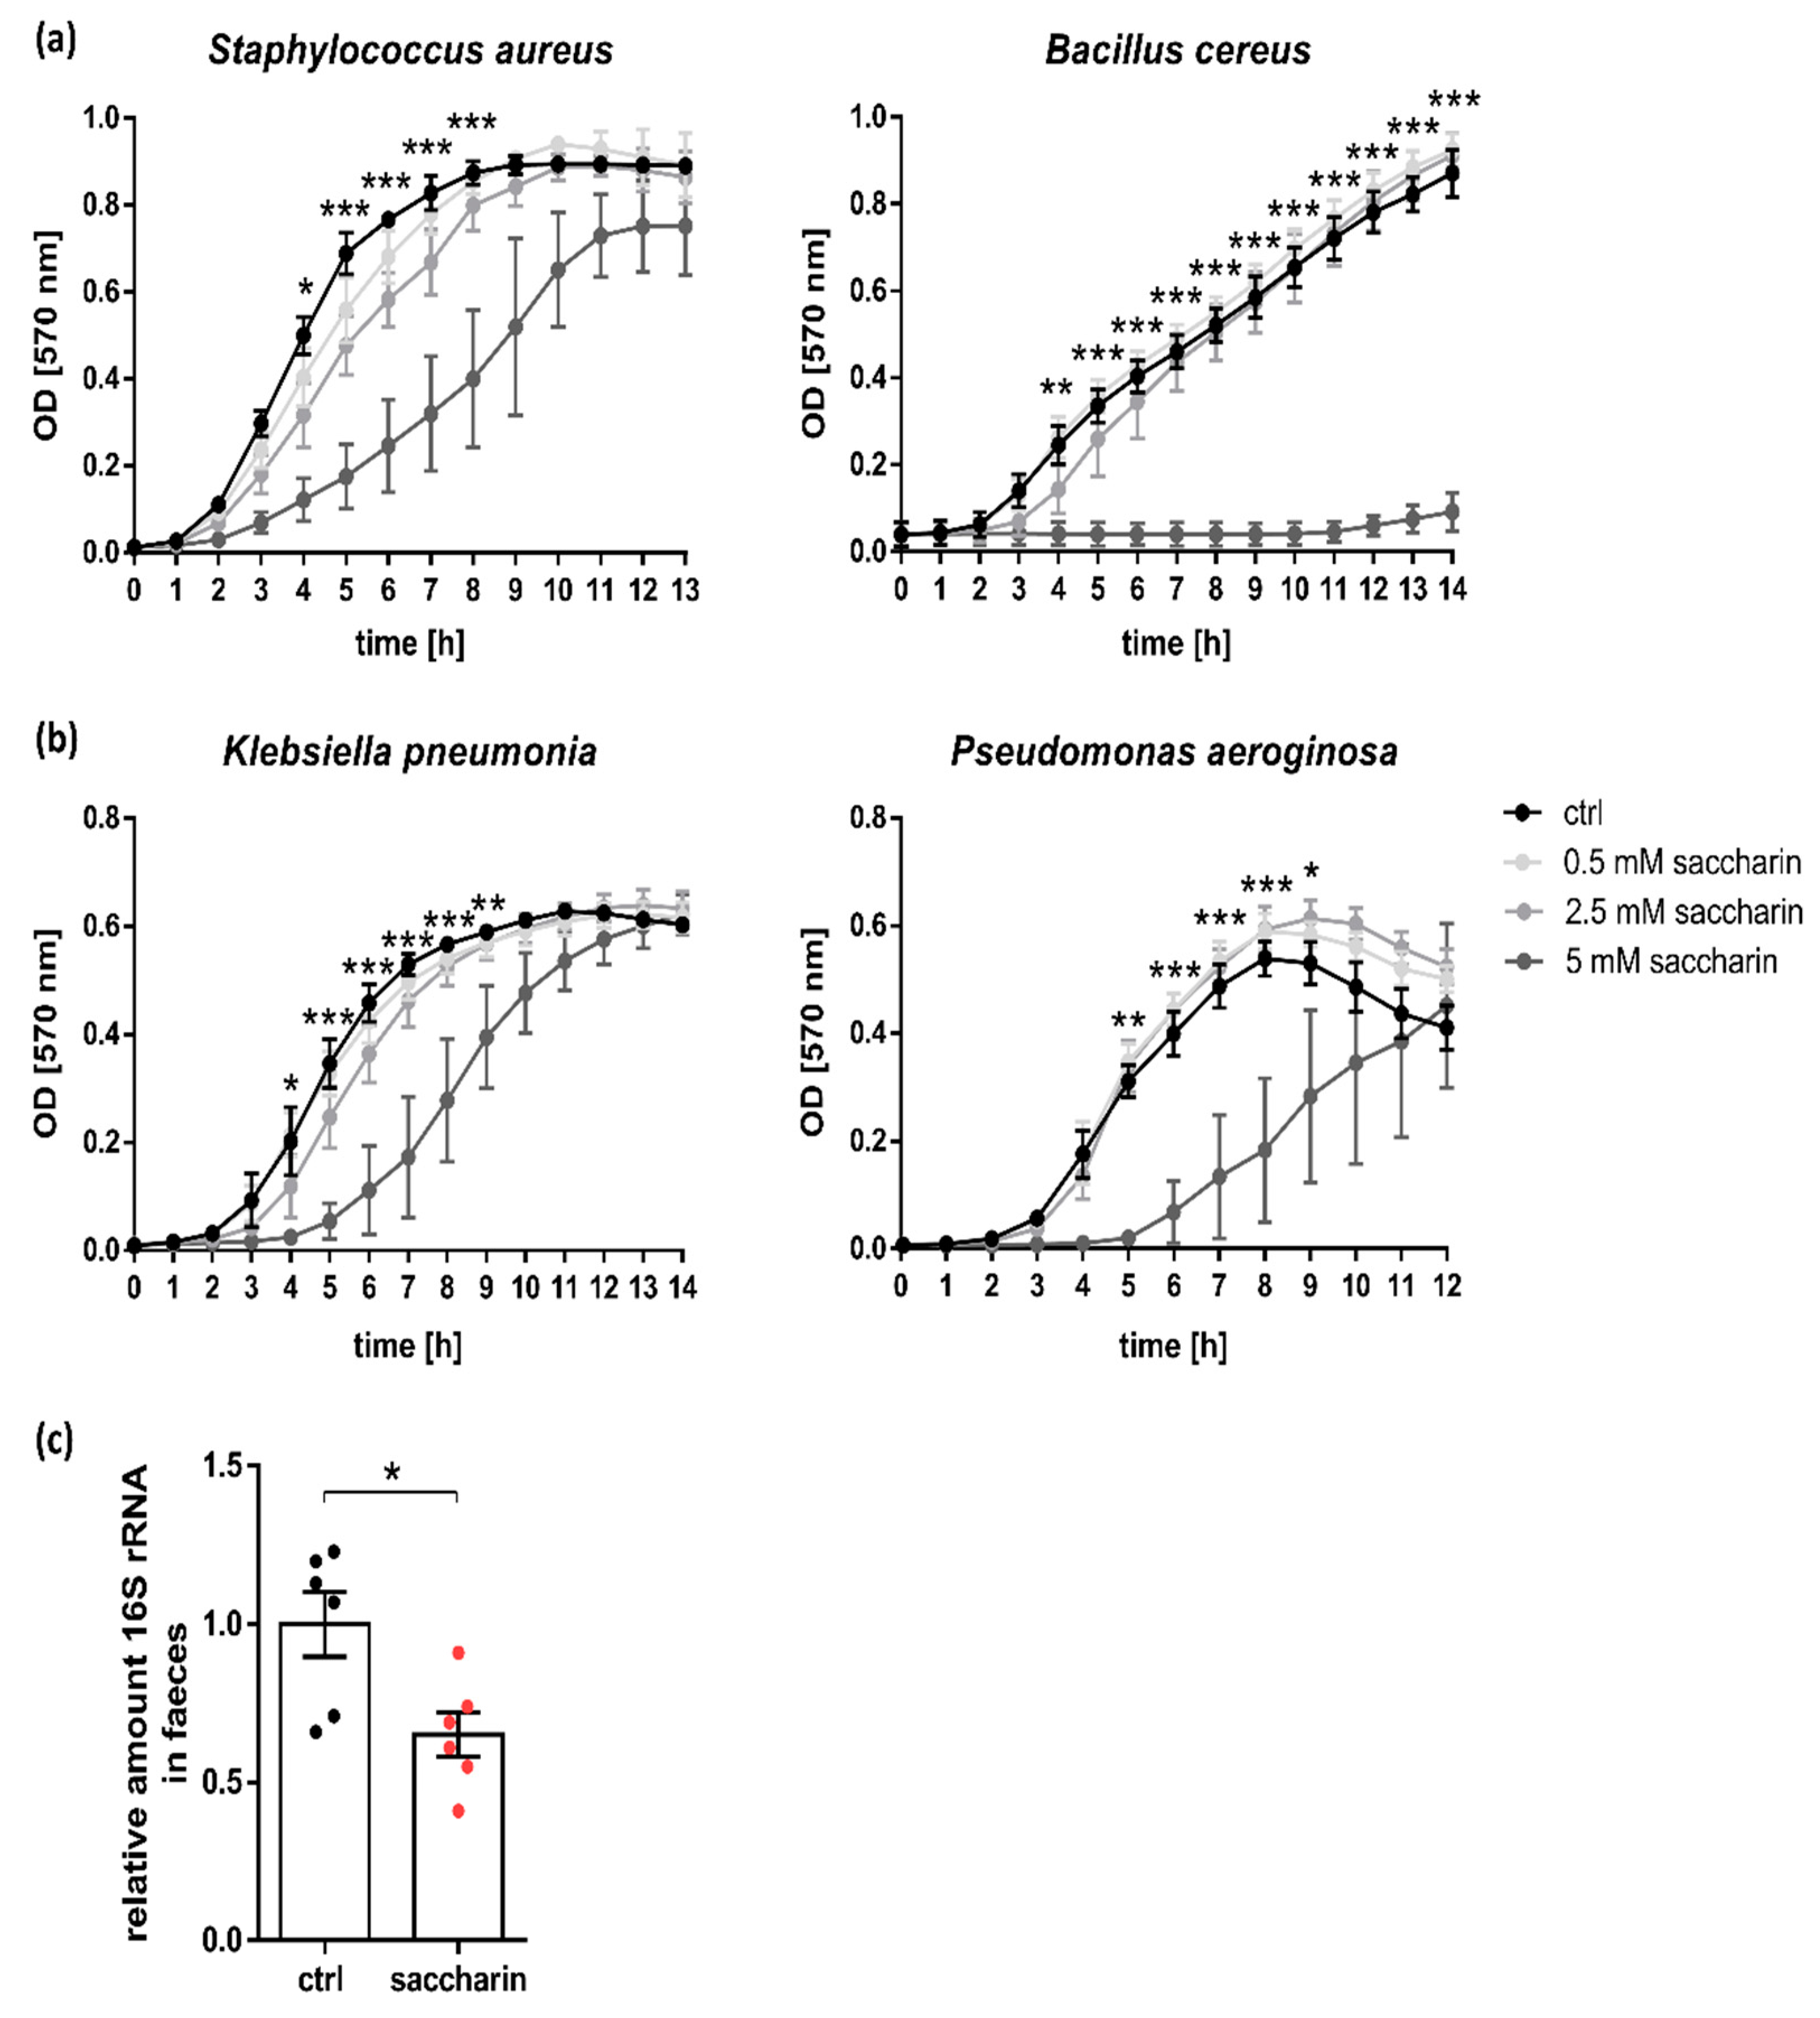
Abstract
1. Introduction
2. Materials and Methods
2.1. Bacterial Growth Assays
2.2. Animal Housing and Saccharin Supplementation
2.3. Quantification of Fecal Bacterial Load
2.4. Induction of Experimental DSS-Colitis and Assessment of Clinical Scores
2.5. Colonoscopy and Histology
2.6. RNA Extraction and Quantitative Real-Time PCR
2.7. Murine Cxcl1/Kc Enzyme Linked Immunosorbent Assay (ELISA)
2.8. Intestinal Microbiota Analysis
2.9. Protein Extraction, SDS-PAGE and Immunoblotting
2.10. Statistical Analysis
3. Results
3.1. Saccharin Reduces Bacterial Growth In Vitro and In Vivo
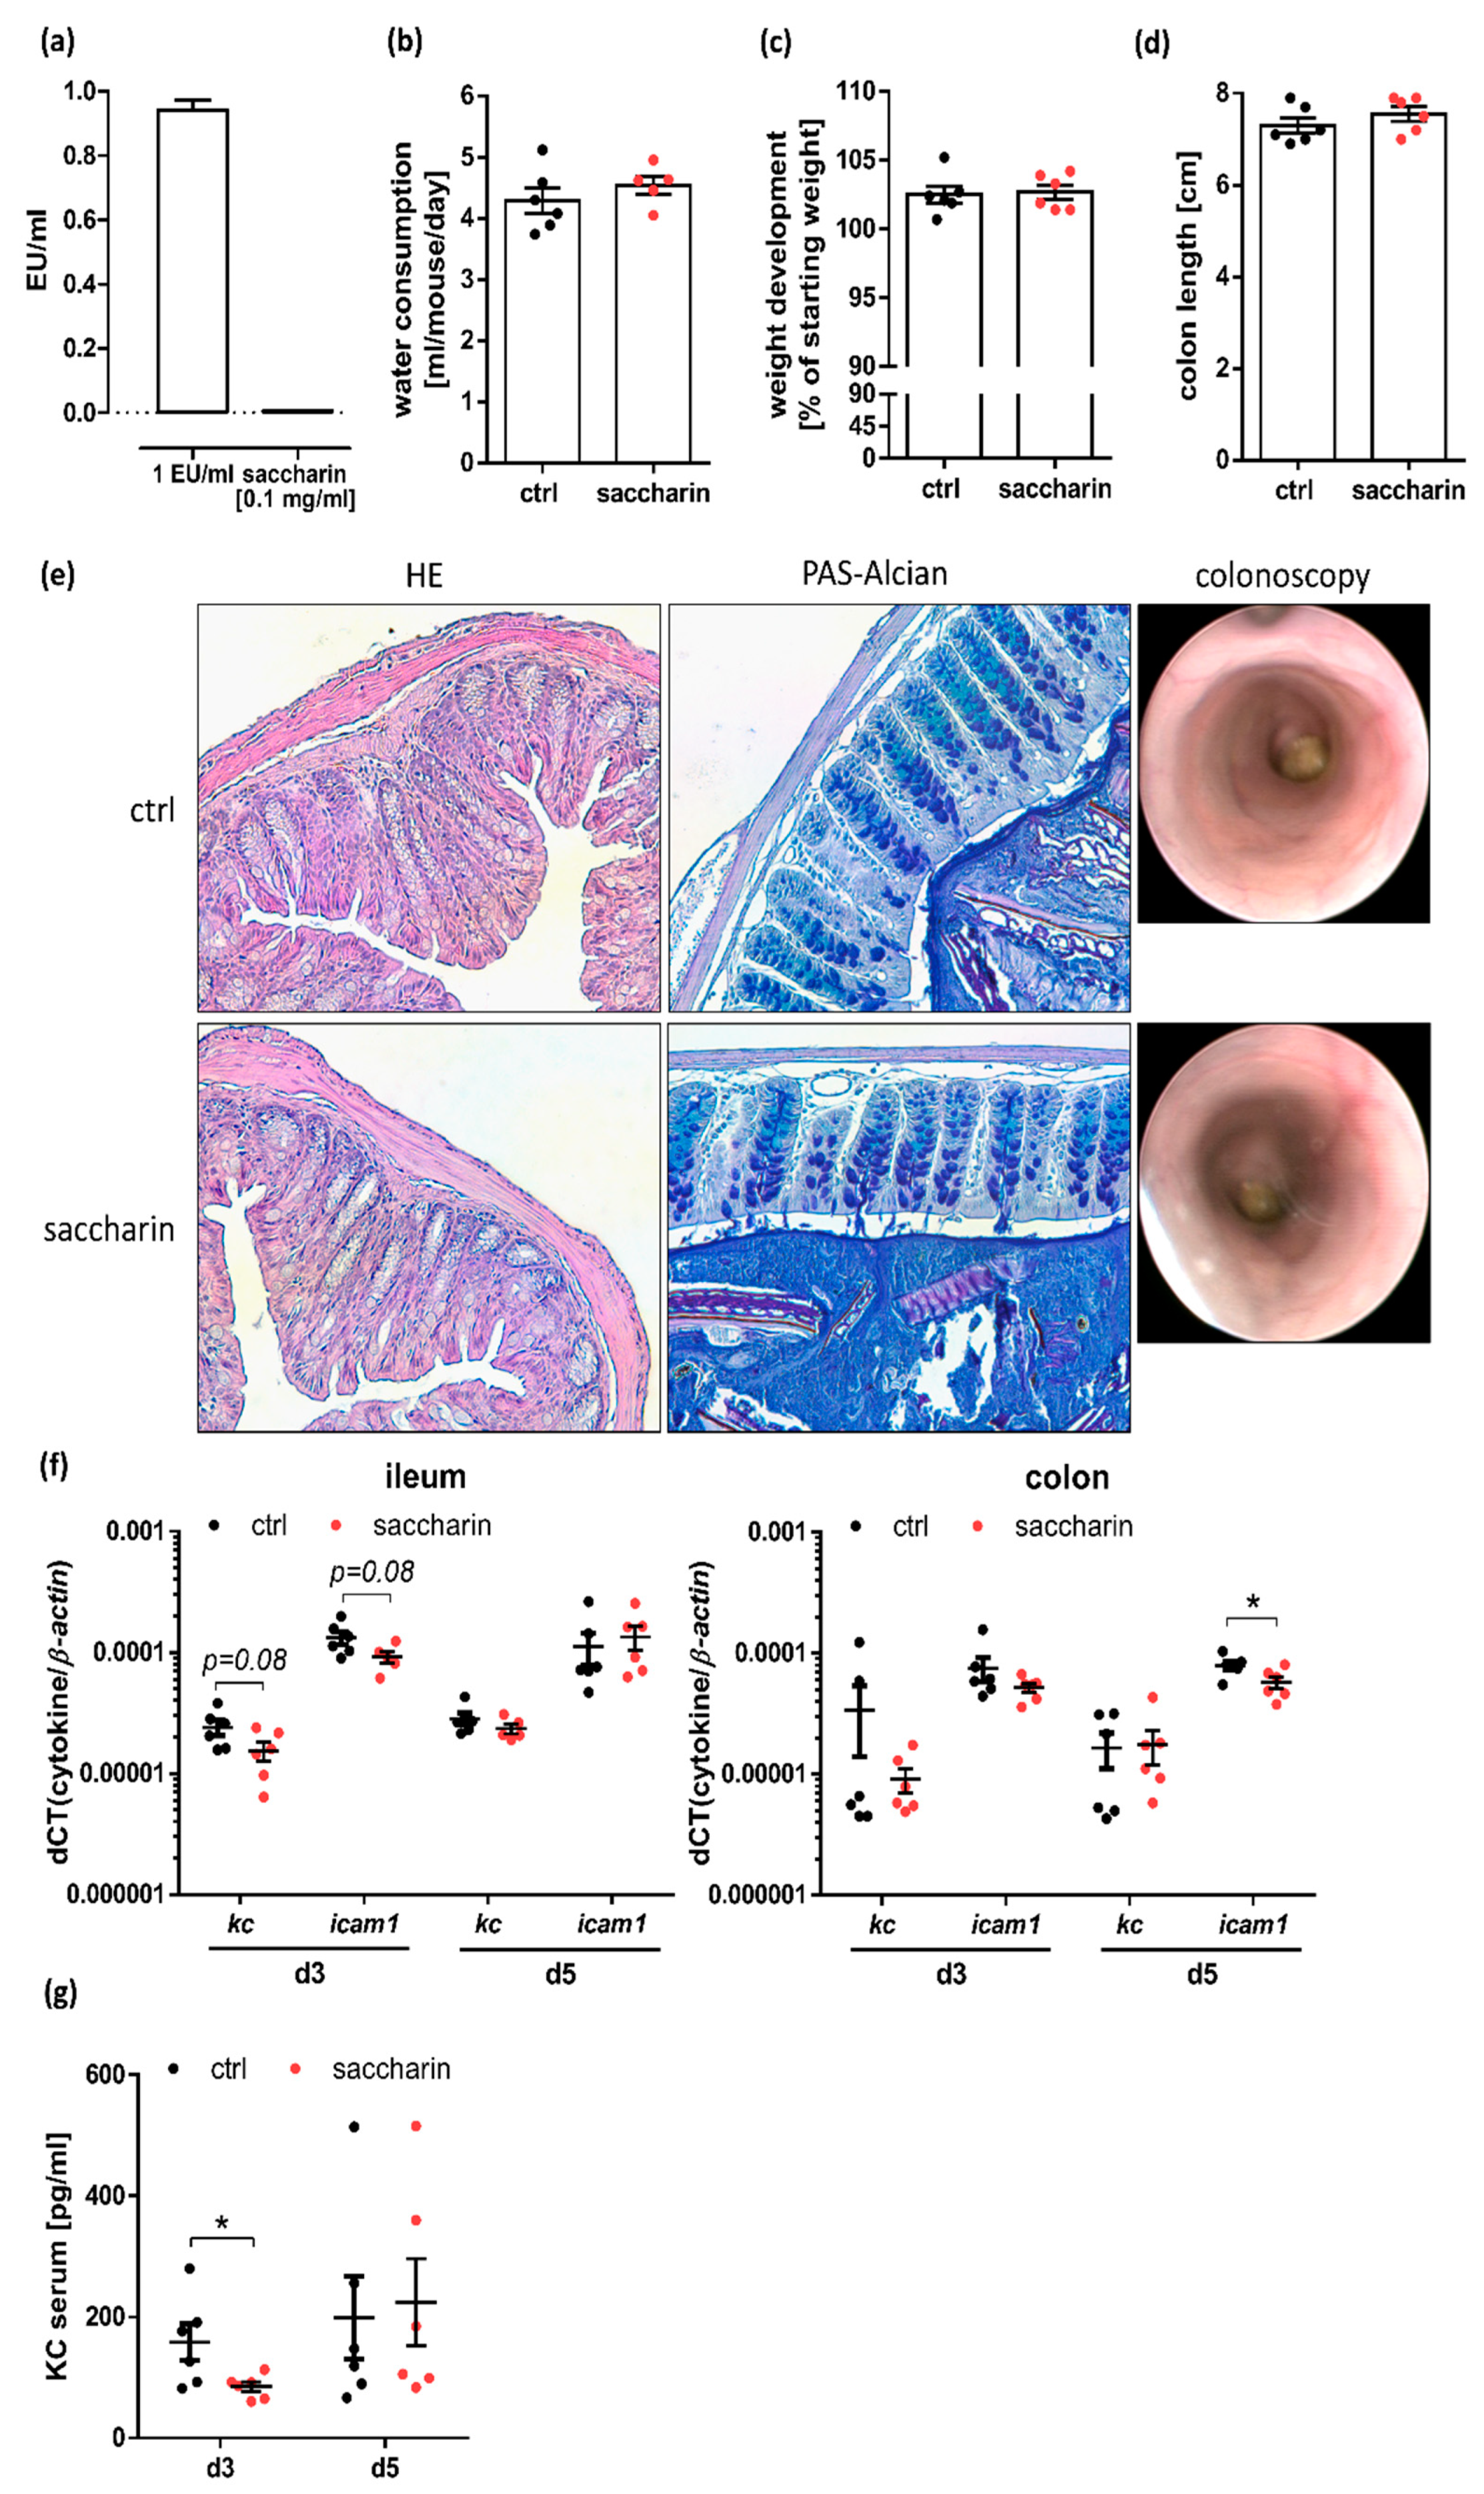
3.2. Saccharin Supplementation Does Not Substantially Alter the Intestinal Barrier
3.3. Saccharin Treatment after Induction of Experimental Colitis Improves Intestinal Inflammation in Mice
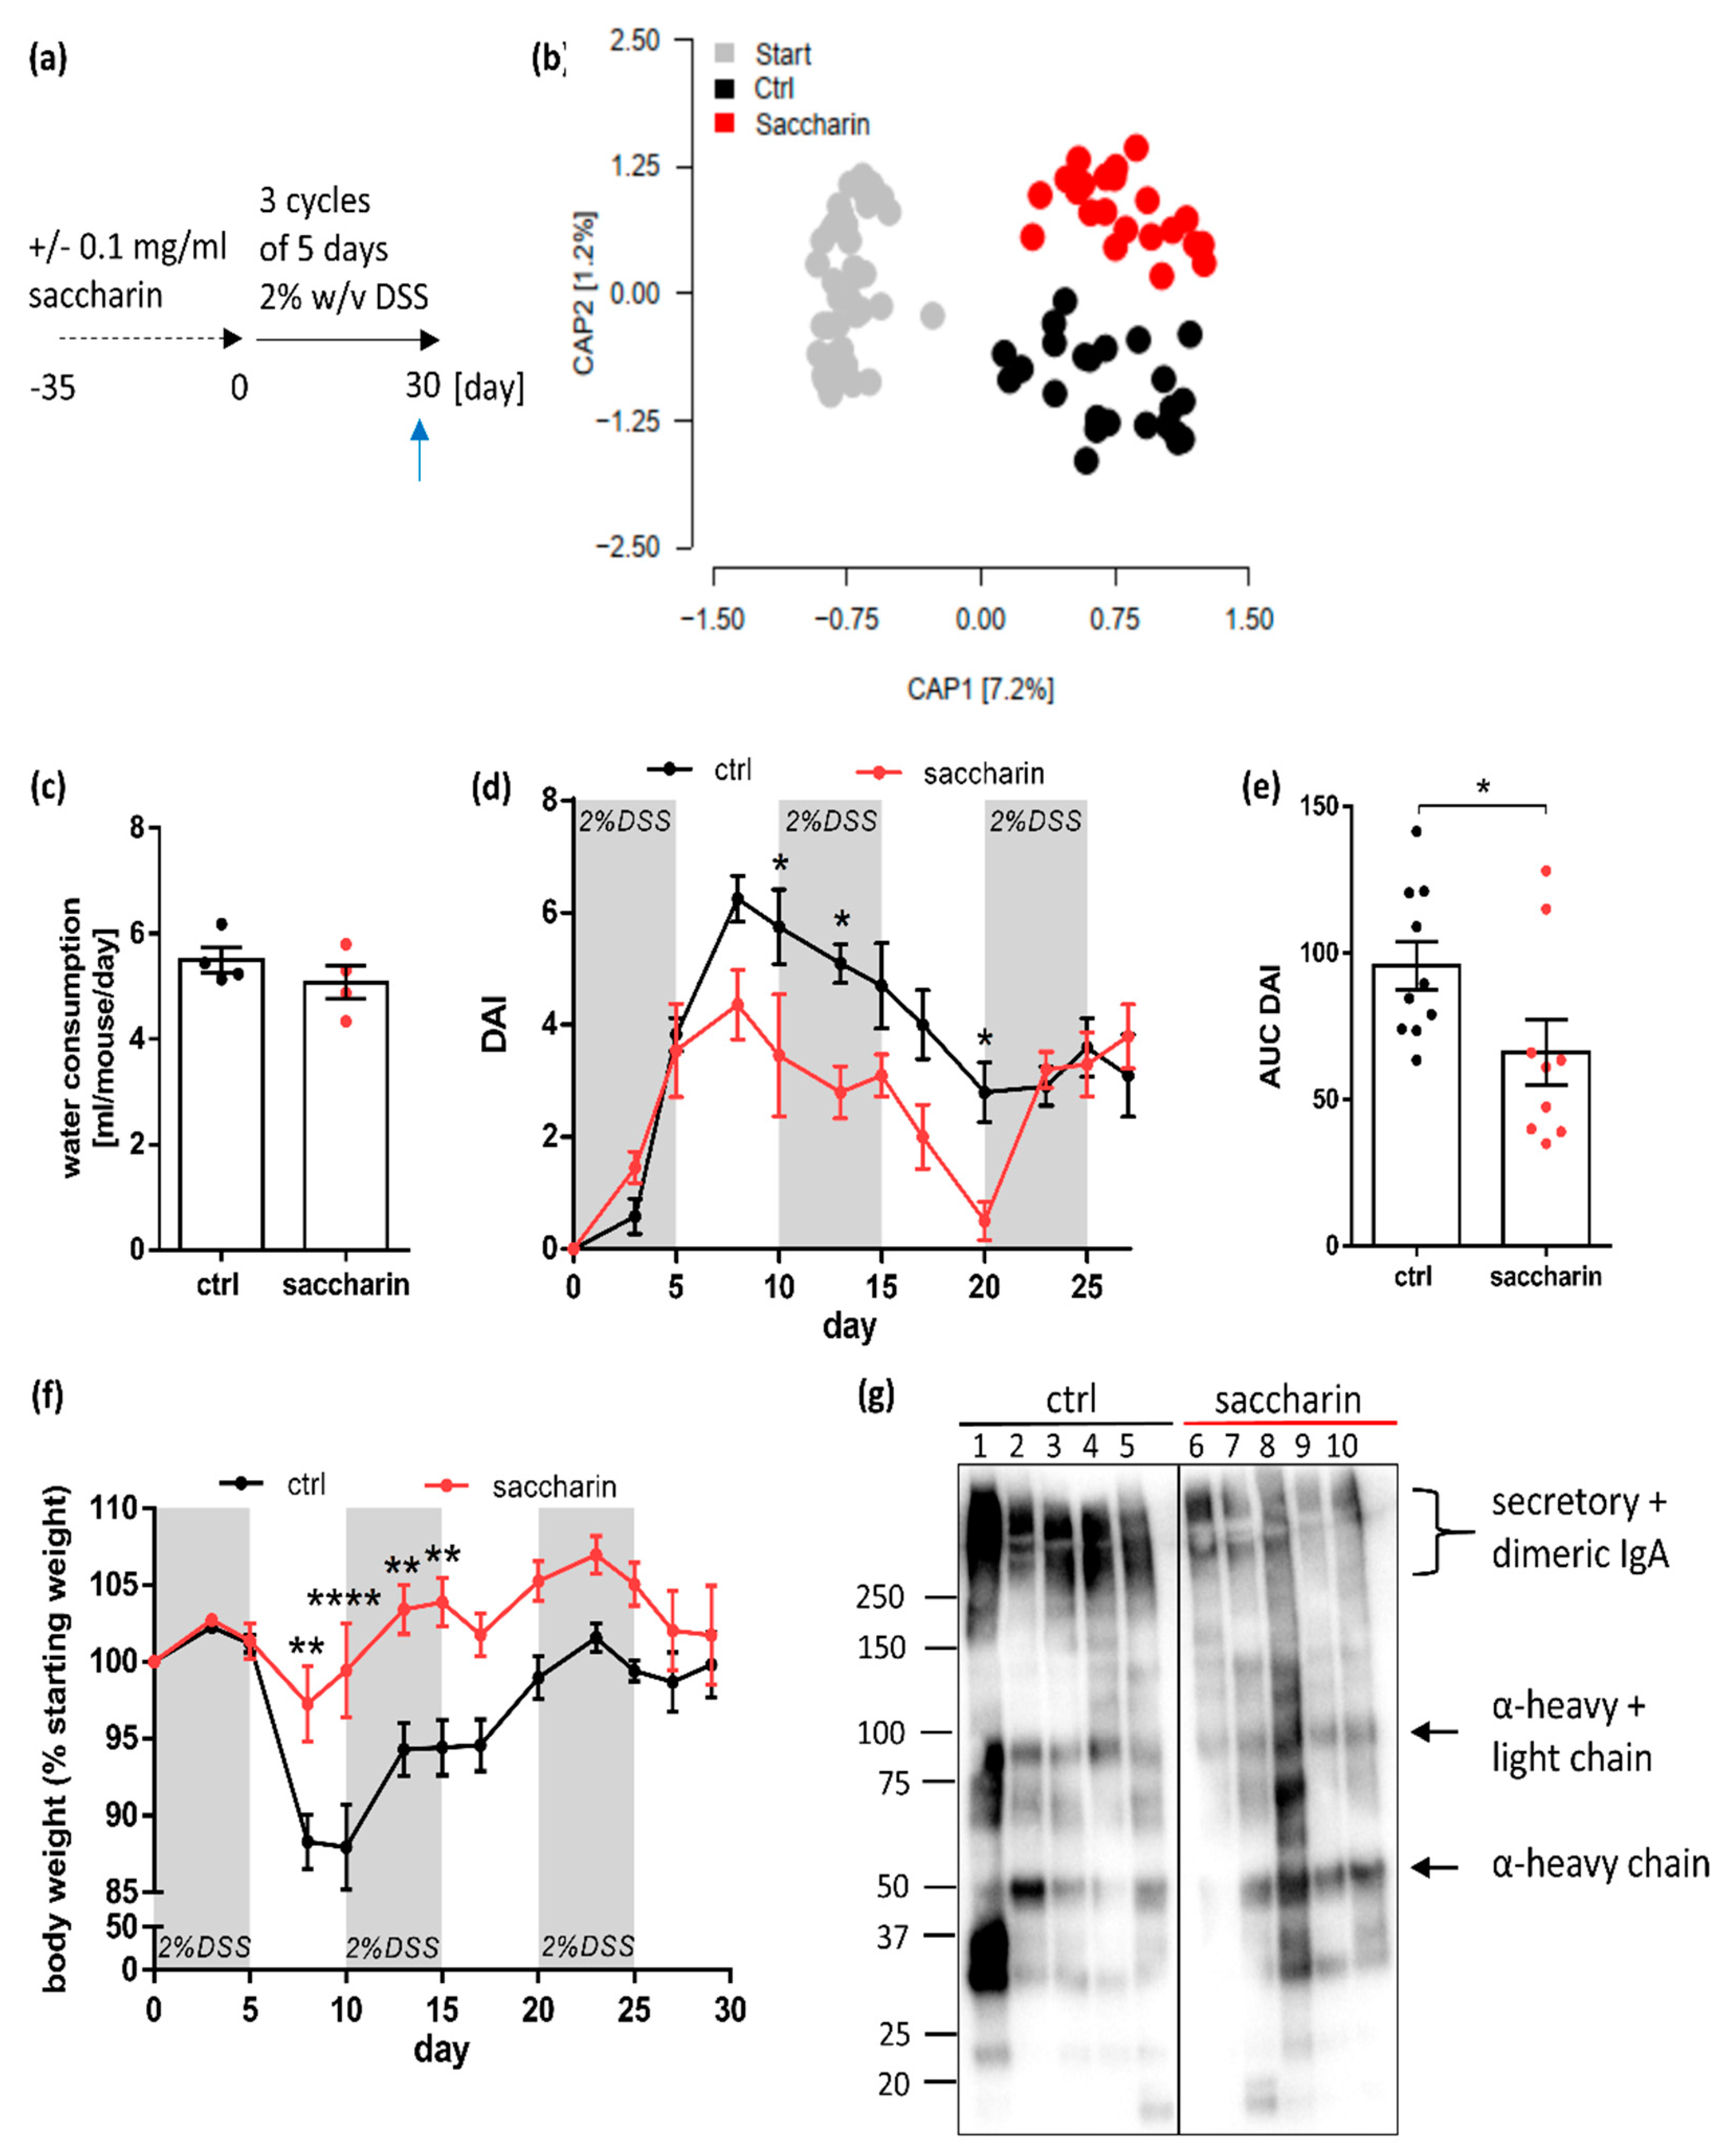
3.4. Saccharin Is Protective in a Prophylactic Mouse Model of Experimental Colitis
4. Discussion
Supplementary Materials
Author Contributions
Funding
Acknowledgments
Conflicts of Interest
References
- Khor, B.; Gardet, A.; Xavier, R.J. Genetics and pathogenesis of inflammatory bowel disease. Nature 2011, 474, 307–317. [Google Scholar] [CrossRef] [PubMed]
- Chassaing, B.; Koren, O.; Goodrich, J.K.; Poole, A.C.; Srinivasan, S.; Ley, R.E.; Gewirtz, A.T. Dietary emulsifiers impact the mouse gut microbiota promoting colitis and metabolic syndrome. Nature 2015, 519, 92–96. [Google Scholar] [CrossRef] [PubMed]
- Pagel, R.; Bar, F.; Schroder, T.; Sunderhauf, A.; Kunstner, A.; Ibrahim, S.M.; Autenrieth, S.E.; Kalies, K.; Konig, P.; Tsang, A.H.; et al. Circadian rhythm disruption impairs tissue homeostasis and exacerbates chronic inflammation in the intestine. FASEB J. 2017, 31, 4707–4719. [Google Scholar] [CrossRef] [PubMed]
- Kim, K.A.; Gu, W.; Lee, I.A.; Joh, E.H.; Kim, D.H. High fat diet-induced gut microbiota exacerbates inflammation and obesity in mice via the TLR4 signaling pathway. PLoS ONE 2012, 7, e47713. [Google Scholar] [CrossRef]
- Nishida, A.; Inoue, R.; Inatomi, O.; Bamba, S.; Naito, Y.; Andoh, A. Gut microbiota in the pathogenesis of inflammatory bowel disease. Clin. J. Gastroenterol. 2018, 11, 1–10. [Google Scholar] [CrossRef]
- Qin, X. Etiology of inflammatory bowel disease: A unified hypothesis. World J. Gastroenterol. 2012, 18, 1708–1722. [Google Scholar] [CrossRef]
- U.S. Food and Drug Administration. Additional Information about High-Intensity Sweeteners Permitted for Use in Food in the United States. Available online: https://www.fda.gov/food/ingredientspackaginglabeling/foodadditivesingredients/ucm397725.htm (accessed on 19 December 2017).
- Bryan, G.T.; Erturk, E.; Yoshida, O. Production of urinary bladder carcinomas in mice by sodium saccharin. Science (New York, N.Y.) 1970, 168, 1238–1240. [Google Scholar] [CrossRef]
- Kessler, I.I.; Clark, J.P. Saccharin, cyclamate, and human bladder cancer. No evidence of an association. JAMA 1978, 240, 349–355. [Google Scholar] [CrossRef]
- Byard, J.L.; Goldberg, L. The metabolism of saccharin in laboratory animals. Food Cosmet. Toxicol. 1973, 11, 391–402. [Google Scholar] [CrossRef]
- Renwick, A.G. The disposition of saccharin in animals and man—A review. Food Chem. Toxicol. 1985, 23, 429–435. [Google Scholar] [CrossRef]
- Magnuson, B.A.; Carakostas, M.C.; Moore, N.H.; Poulos, S.P.; Renwick, A.G. Biological fate of low-calorie sweeteners. Nutr. Rev. 2016, 74, 670–689. [Google Scholar] [CrossRef] [PubMed]
- Nelson, G.; Hoon, M.A.; Chandrashekar, J.; Zhang, Y.; Ryba, N.J.; Zuker, C.S. Mammalian sweet taste receptors. Cell 2001, 106, 381–390. [Google Scholar] [CrossRef]
- Li, X.; Staszewski, L.; Xu, H.; Durick, K.; Zoller, M.; Adler, E. Human receptors for sweet and umami taste. Proc. Natl. Acad. Sci. USA 2002, 99, 4692–4696. [Google Scholar] [CrossRef] [PubMed]
- Kuhn, C.; Bufe, B.; Winnig, M.; Hofmann, T.; Frank, O.; Behrens, M.; Lewtschenko, T.; Slack, J.P.; Ward, C.D.; Meyerhof, W. Bitter taste receptors for saccharin and acesulfame K. J. Neurosci. 2004, 24, 10260–10265. [Google Scholar] [CrossRef]
- Depoortere, I. Taste receptors of the gut: Emerging roles in health and disease. Gut 2014, 63, 179–190. [Google Scholar] [CrossRef]
- Jang, H.J.; Kokrashvili, Z.; Theodorakis, M.J.; Carlson, O.D.; Kim, B.J.; Zhou, J.; Kim, H.H.; Xu, X.; Chan, S.L.; Juhaszova, M.; et al. Gut-expressed gustducin and taste receptors regulate secretion of glucagon-like peptide-1. Proc. Natl. Acad. Sci. USA 2007, 104, 15069–15074. [Google Scholar] [CrossRef]
- Geraedts, M.C.; Troost, F.J.; Saris, W.H. Addition of sucralose enhances the release of satiety hormones in combination with pea protein. Mol. Nutr. Food Res. 2012, 56, 417–424. [Google Scholar] [CrossRef]
- Gerspach, A.C.; Steinert, R.E.; Schonenberger, L.; Graber-Maier, A.; Beglinger, C. The role of the gut sweet taste receptor in regulating GLP-1, PYY, and CCK release in humans. Am. J. Physiol. Endocrinol. Metab. 2011, 301, E317–E325. [Google Scholar] [CrossRef]
- Linke, H.A.; Doyle, G.A. Effect of saccharin on growth and acid production of glucose-grown pathogenic and oral bacteria. Microbios 1985, 42, 163–173. [Google Scholar]
- Oldacay, M.; Erdem, G. The effect of sodium saccharin on the growth of Escherichia coli, Proteus, Pseudomonas aeruginosa, Staphylococcus epidermidis, Staphylococcus aureus and Enterococcus faecalis. Turk Mikrobiyol. Cem. Derg. 2000, 30, 35–37. [Google Scholar]
- Anderson, R.L.; Kirkland, J.J. The effect of sodium saccharin in the diet on caecal microflora. Food Cosmet. Toxicol. 1980, 18, 353–355. [Google Scholar] [CrossRef]
- Suez, J.; Korem, T.; Zeevi, D.; Zilberman-Schapira, G.; Thaiss, C.A.; Maza, O.; Israeli, D.; Zmora, N.; Gilad, S.; Weinberger, A.; et al. Artificial sweeteners induce glucose intolerance by altering the gut microbiota. Nature 2014, 514, 181–186. [Google Scholar] [CrossRef] [PubMed]
- Daly, K.; Darby, A.C.; Hall, N.; Nau, A.; Bravo, D.; Shirazi-Beechey, S.P. Dietary supplementation with lactose or artificial sweetener enhances swine gut Lactobacillus population abundance. Br. J. Nutr. 2014, 111 (Suppl. S1), S30–S35. [Google Scholar] [CrossRef] [PubMed]
- Rigottier-Gois, L. Dysbiosis in inflammatory bowel diseases: The oxygen hypothesis. ISME J. 2013, 7, 1256–1261. [Google Scholar] [CrossRef] [PubMed]
- Qin, X.F. Impaired inactivation of digestive proteases by deconjugated bilirubin: The possible mechanism for inflammatory bowel disease. Med. Hypotheses 2002, 59, 159–163. [Google Scholar] [CrossRef]
- Suez, J.; Korem, T.; Zilberman-Schapira, G.; Segal, E.; Elinav, E. Non-caloric artificial sweeteners and the microbiome: Findings and challenges. Gut Microbes 2015, 6, 149–155. [Google Scholar] [CrossRef]
- Perse, M.; Cerar, A. Dextran sodium sulphate colitis mouse model: Traps and tricks. J. Biomed Biotechnol. 2012, 2012, 718617. [Google Scholar] [CrossRef]
- Bar, F.; Bochmann, W.; Widok, A.; von Medem, K.; Pagel, R.; Hirose, M.; Yu, X.; Kalies, K.; Konig, P.; Bohm, R.; et al. Mitochondrial gene polymorphisms that protect mice from colitis. Gastroenterology 2013, 145, 1055–1063.e1053. [Google Scholar] [CrossRef]
- Siegmund, B.; Lehr, H.A.; Fantuzzi, G.; Dinarello, C.A. IL-1 beta -converting enzyme (caspase-1) in intestinal inflammation. Proc. Natl. Acad. Sci. USA 2001, 98, 13249–13254. [Google Scholar] [CrossRef]
- Sunderhauf, A.; Skibbe, K.; Preisker, S.; Ebbert, K.; Verschoor, A.; Karsten, C.M.; Kemper, C.; Huber-Lang, M.; Basic, M.; Bleich, A.; et al. Regulation of epithelial cell expressed C3 in the intestine—Relevance for the pathophysiology of inflammatory bowel disease? Mol. Immunol. 2017, 90, 227–238. [Google Scholar] [CrossRef]
- Edgar, R.C. Search and clustering orders of magnitude faster than BLAST. Bioinformatics 2010, 26, 2460–2461. [Google Scholar] [CrossRef] [PubMed]
- Edgar, R.C.; Haas, B.J.; Clemente, J.C.; Quince, C.; Knight, R. UCHIME improves sensitivity and speed of chimera detection. Bioinformatics 2011, 27, 2194–2200. [Google Scholar] [CrossRef] [PubMed]
- Schloss, P.D.; Westcott, S.L.; Ryabin, T.; Hall, J.R.; Hartmann, M.; Hollister, E.B.; Lesniewski, R.A.; Oakley, B.B.; Parks, D.H.; Robinson, C.J.; et al. Introducing mothur: Open-source, platform-independent, community-supported software for describing and comparing microbial communities. Appl. Environ. Microbiol. 2009, 75, 7537–7541. [Google Scholar] [CrossRef] [PubMed]
- Price, M.N.; Dehal, P.S.; Arkin, A.P. FastTree 2—Approximately maximum-likelihood trees for large alignments. PLoS ONE 2010, 5, e9490. [Google Scholar] [CrossRef]
- Morpheus. Available online: https://software.broadinstitute.org/morpheus (accessed on 10 December 2018).
- Shah, A.; Morrison, M.; Burger, D.; Martin, N.; Rich, J.; Jones, M.; Koloski, N.; Walker, M.M.; Talley, N.J.; Holtmann, G.J. Systematic review with meta-analysis: The prevalence of small intestinal bacterial overgrowth in inflammatory bowel disease. Aliment. Pharmacol. Ther. 2019, 49, 624–635. [Google Scholar] [CrossRef]
- Song, F.; Ito, K.; Denning, T.L.; Kuninger, D.; Papaconstantinou, J.; Gourley, W.; Klimpel, G.; Balish, E.; Hokanson, J.; Ernst, P.B. Expression of the neutrophil chemokine KC in the colon of mice with enterocolitis and by intestinal epithelial cell lines: Effects of flora and proinflammatory cytokines. J. Immunol. 1999, 162, 2275–2280. [Google Scholar]
- Ohmori, Y.; Hamilton, T.A. IFN-gamma selectively inhibits lipopolysaccharide-inducible JE/monocyte chemoattractant protein-1 and KC/GRO/melanoma growth-stimulating activity gene expression in mouse peritoneal macrophages. J. Immunol. 1994, 153, 2204–2212. [Google Scholar]
- Jobin, C.; Hellerbrand, C.; Licato, L.L.; Brenner, D.A.; Sartor, R.B. Mediation by NF-kappa B of cytokine induced expression of intercellular adhesion molecule 1 (ICAM-1) in an intestinal epithelial cell line, a process blocked by proteasome inhibitors. Gut 1998, 42, 779–787. [Google Scholar] [CrossRef]
- Woting, A.; Blaut, M. The Intestinal Microbiota in Metabolic Disease. Nutrients 2016, 8, 202. [Google Scholar] [CrossRef]
- Bueno-Hernandez, N.; Vazquez-Frias, R.; Abreu, Y.A.A.T.; Almeda-Valdes, P.; Barajas-Nava, L.A.; Carmona-Sanchez, R.I.; Chavez-Saenz, J.; Consuelo-Sanchez, A.; Espinosa-Flores, A.J.; Hernandez-Rosiles, V.; et al. Review of the scientific evidence and technical opinion on noncaloric sweetener consumption in gastrointestinal diseases. Rev. Gastroenterol. Mex. 2019, 84, 492–510. [Google Scholar] [CrossRef]
- Bian, X.; Tu, P.; Chi, L.; Gao, B.; Ru, H.; Lu, K. Saccharin induced liver inflammation in mice by altering the gut microbiota and its metabolic functions. Food Chem. Toxicol. 2017, 107, 530–539. [Google Scholar] [CrossRef] [PubMed]
- Walker, A.W.; Duncan, S.H.; McWilliam Leitch, E.C.; Child, M.W.; Flint, H.J. pH and peptide supply can radically alter bacterial populations and short-chain fatty acid ratios within microbial communities from the human colon. Appl. Environ. Microbial. 2005, 71, 3692–3700. [Google Scholar] [CrossRef] [PubMed]
- Klampfer, L.; Huang, J.; Sasazuki, T.; Shirasawa, S.; Augenlicht, L. Inhibition of interferon gamma signaling by the short chain fatty acid butyrate. Mol. Cancer Res. MCR 2003, 1, 855–862. [Google Scholar] [PubMed]
- Ceriello, A.; Novials, A.; Canivell, S.; La Sala, L.; Pujadas, G.; Esposito, K.; Testa, R.; Bucciarelli, L.; Rondinelli, M.; Genovese, S. Simultaneous GLP-1 and insulin administration acutely enhances their vasodilatory, antiinflammatory, and antioxidant action in type 2 diabetes. Diabetes Care 2014, 37, 1938–1943. [Google Scholar] [CrossRef] [PubMed]
- Miyamoto, S.; Shikata, K.; Miyasaka, K.; Okada, S.; Sasaki, M.; Kodera, R.; Hirota, D.; Kajitani, N.; Takatsuka, T.; Kataoka, H.U.; et al. Cholecystokinin plays a novel protective role in diabetic kidney through anti-inflammatory actions on macrophage: Anti-inflammatory effect of cholecystokinin. Diabetes 2012, 61, 897–907. [Google Scholar] [CrossRef]
- Bozkurt, A.; Cakir, B.; Ercan, F.; Yegen, B.C. Anti-inflammatory effects of leptin and cholecystokinin on acetic acid-induced colitis in rats: Role of capsaicin-sensitive vagal afferent fibers. Regul. Pept. 2003, 116, 109–118. [Google Scholar] [CrossRef]


© 2020 by the authors. Licensee MDPI, Basel, Switzerland. This article is an open access article distributed under the terms and conditions of the Creative Commons Attribution (CC BY) license (http://creativecommons.org/licenses/by/4.0/).
Share and Cite
Sünderhauf, A.; Pagel, R.; Künstner, A.; Wagner, A.E.; Rupp, J.; Ibrahim, S.M.; Derer, S.; Sina, C. Saccharin Supplementation Inhibits Bacterial Growth and Reduces Experimental Colitis in Mice. Nutrients 2020, 12, 1122. https://doi.org/10.3390/nu12041122
Sünderhauf A, Pagel R, Künstner A, Wagner AE, Rupp J, Ibrahim SM, Derer S, Sina C. Saccharin Supplementation Inhibits Bacterial Growth and Reduces Experimental Colitis in Mice. Nutrients. 2020; 12(4):1122. https://doi.org/10.3390/nu12041122
Chicago/Turabian StyleSünderhauf, Annika, René Pagel, Axel Künstner, Anika E. Wagner, Jan Rupp, Saleh M. Ibrahim, Stefanie Derer, and Christian Sina. 2020. "Saccharin Supplementation Inhibits Bacterial Growth and Reduces Experimental Colitis in Mice" Nutrients 12, no. 4: 1122. https://doi.org/10.3390/nu12041122
APA StyleSünderhauf, A., Pagel, R., Künstner, A., Wagner, A. E., Rupp, J., Ibrahim, S. M., Derer, S., & Sina, C. (2020). Saccharin Supplementation Inhibits Bacterial Growth and Reduces Experimental Colitis in Mice. Nutrients, 12(4), 1122. https://doi.org/10.3390/nu12041122