Sales of Sugar-Sweetened Beverages in Australia: A Trend Analysis from 1997 to 2018


Abstract
1. Introduction
2. Materials and Methods
Statistical Considerations
3. Results
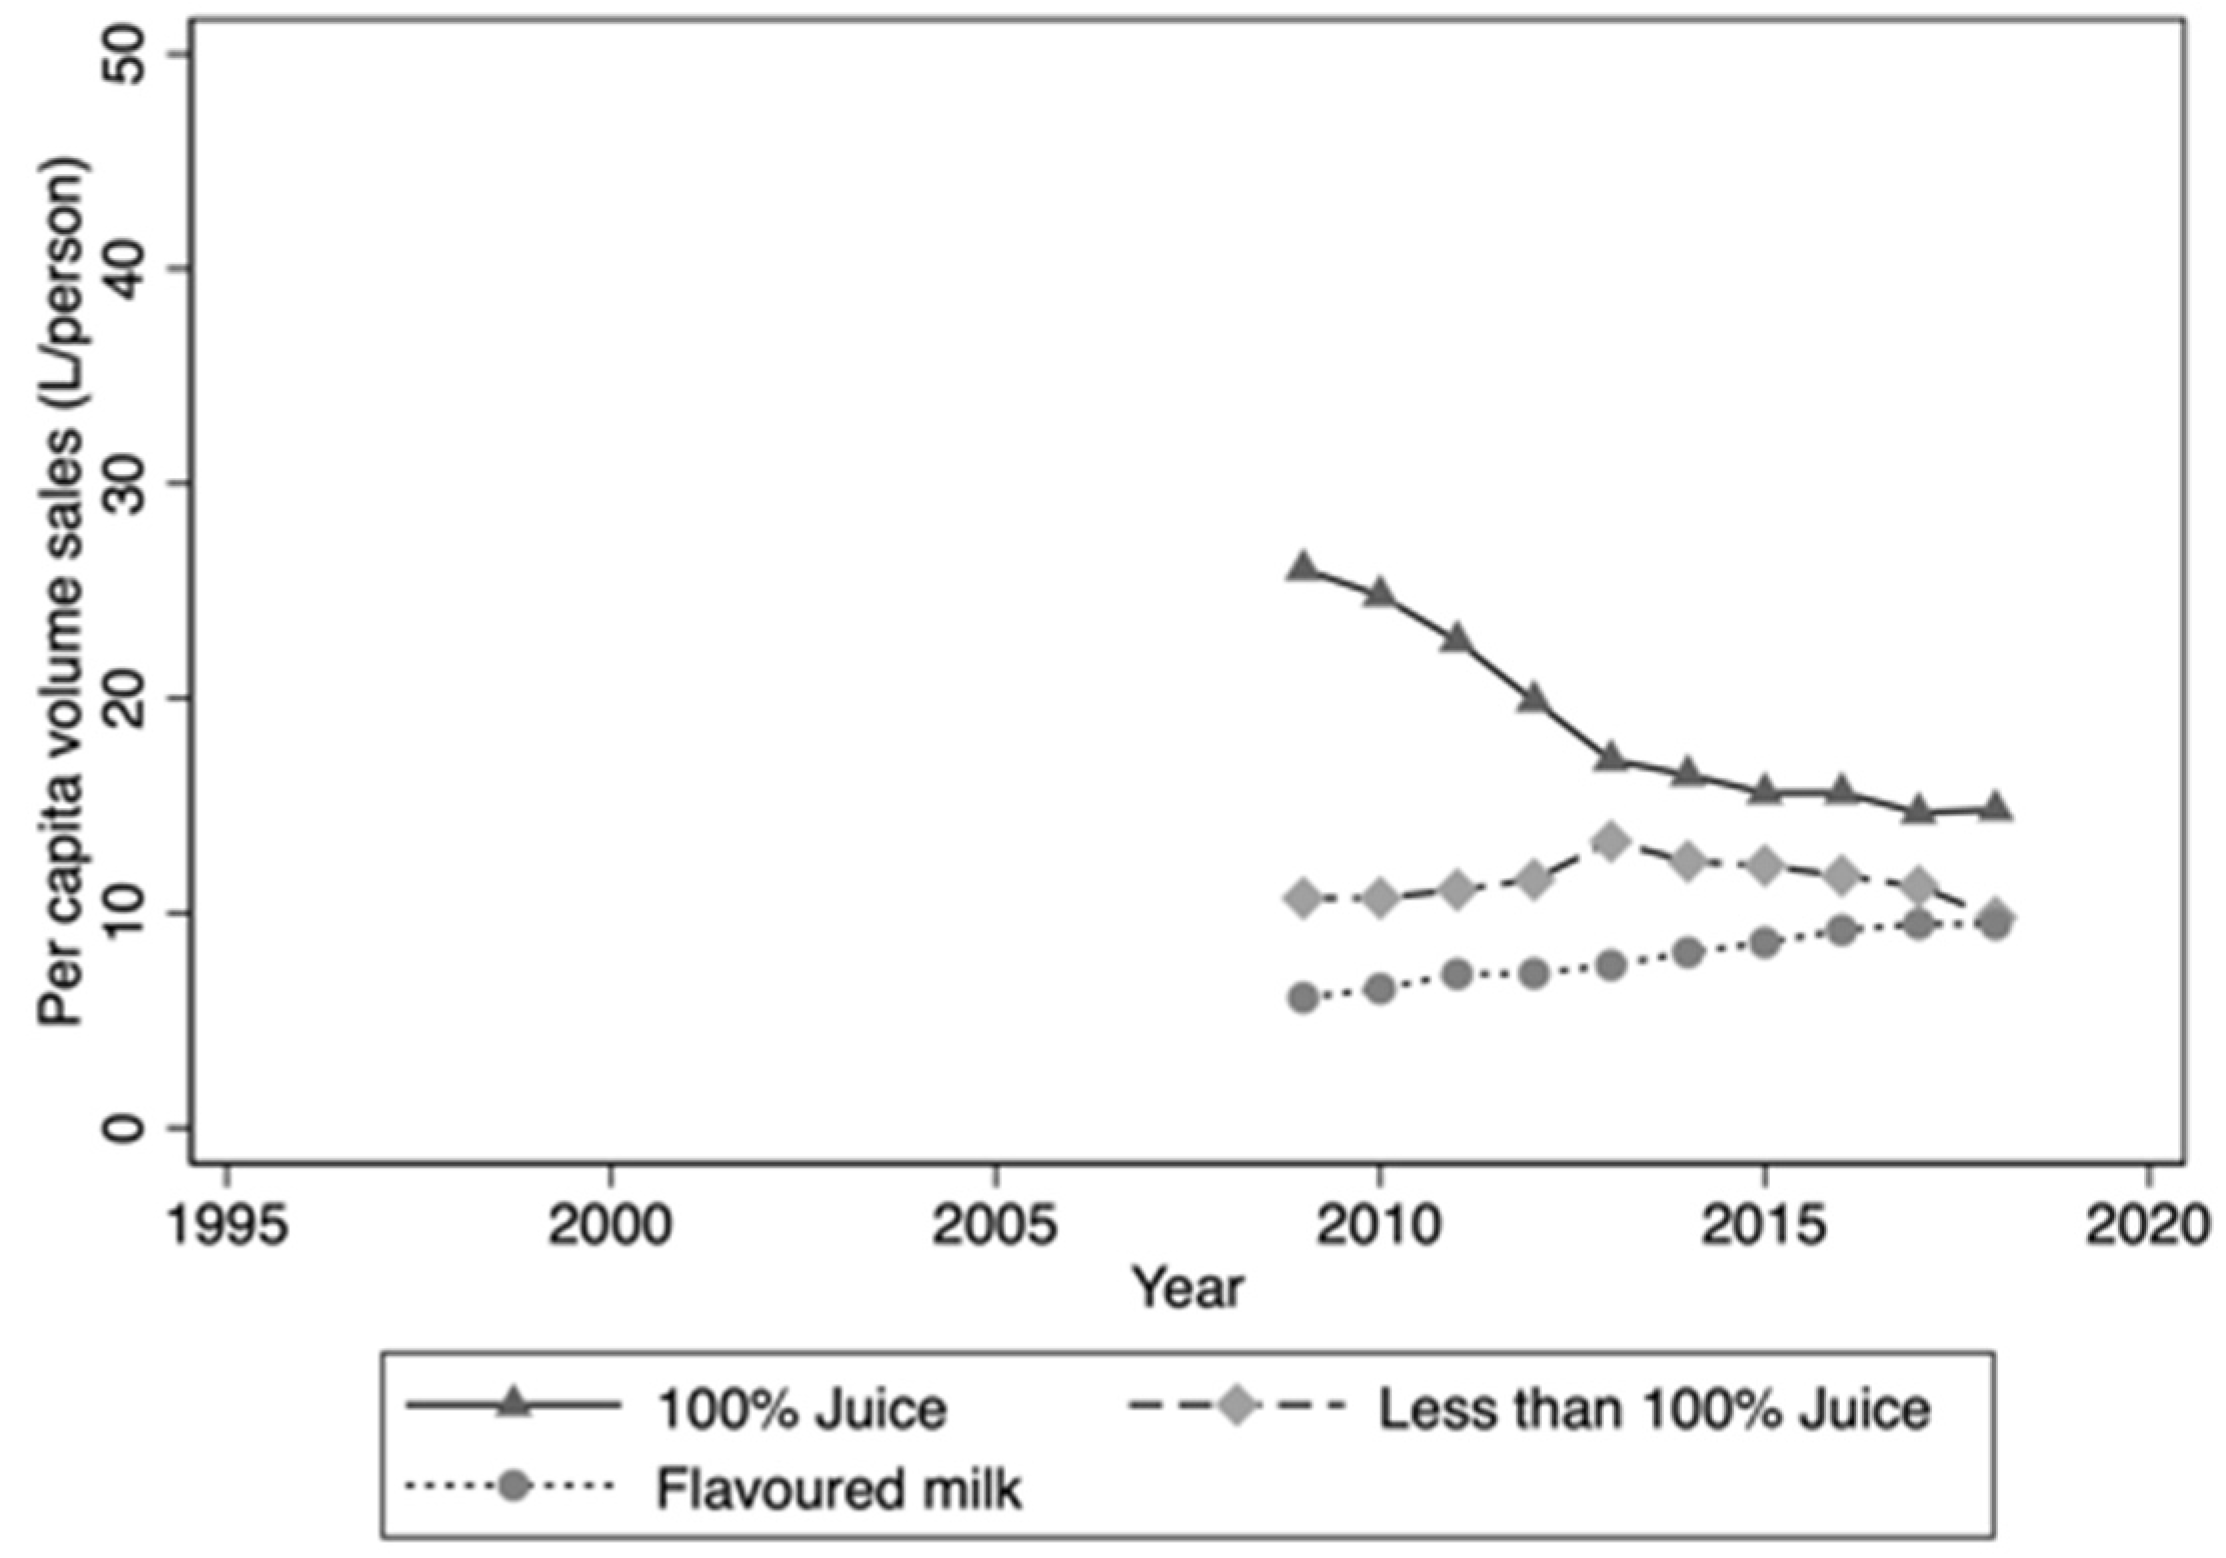
3.1. Trends in Volume Sales
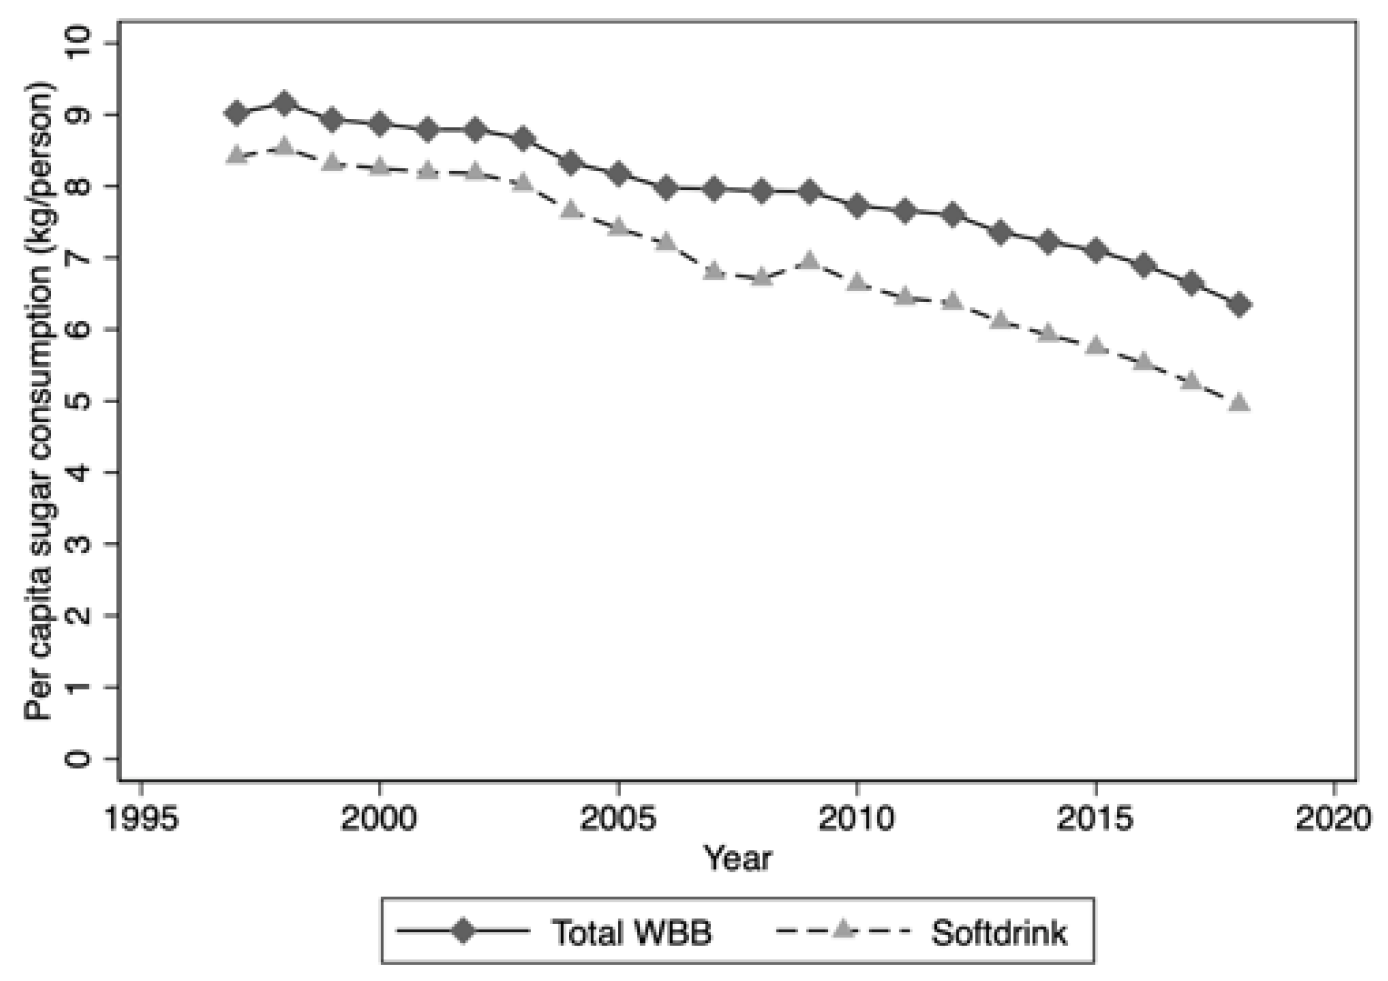
3.2. Trends in Sugar Contribution
4. Discussion
5. Conclusions
Author Contributions
Funding
Conflicts of Interest
References
- National Health and Medical Research Council. Australian Dietary Guidelines; National Health and Medical Research Council: Canberra, Australian, 2013.
- Trumbo, P.; Schlicker, S.; Yates, A.A.; Poos, M.; Food and Nutrition Board of the Institute of Medicine; The National Academies. Dietary reference intakes for energy, carbohydrate, fiber, fat, fatty acids, cholesterol, protein and amino acids. J. Am. Diet. Assoc. 2002, 102, 1621–1630. [Google Scholar] [CrossRef]
- ESFA Panel of Dietetic Products Nutrition and Allergies. Scientific Opinion on Dietary Reference Values for carbohydrates and dietary fibre. EFSA J. 2010, 8, 1462. [Google Scholar] [CrossRef]
- Malik, V.S.; Pan, A.; Willett, W.C.; Hu, F.B. Sugar-sweetened beverages and weight gain in children and adults: a systematic review and meta-analysis. Am. J. Clin. Nutr. 2013, 98, 1084–1102. [Google Scholar] [CrossRef] [PubMed]
- Imamura, F.; O’Connor, L.; Ye, Z.; Mursu, J.; Hayashino, Y.; Bhupathiraju, S.N.; Forouhi, N.G. Consumption of sugar sweetened beverages, artificially sweetened beverages, and fruit juice and incidence of type 2 diabetes: systematic review, meta-analysis, and estimation of population attributable fraction. BMJ 2015, 351, 3576. [Google Scholar] [CrossRef] [PubMed]
- Xi, B.; Huang, Y.; Reilly, K.H.; Li, S.; Zheng, R.; Barrio-Lopez, M.T.; Martinez-Gonzalez, M.A.; Zhou, D. Sugar-sweetened beverages and risk of hypertension and CVD: a dose-response meta-analysis. Br. J. Nutr. 2015, 113, 709–717. [Google Scholar] [CrossRef] [PubMed]
- Huang, C.; Huang, J.; Tian, Y.; Yang, X.; Gu, D. Sugar sweetened beverages consumption and risk of coronary heart disease: a meta-analysis of prospective studies. Atherosclerosis 2014, 234, 11–16. [Google Scholar] [CrossRef]
- Malik, V.S.; Li, Y.; Pan, A.; De Koning, L.; Schernhammer, E.; Willett, W.C.; Hu, F.B. Long-Term Consumption of Sugar-Sweetened and Artificially Sweetened Beverages and Risk of Mortality in US Adults. Circulation 2019, 139, 2113–2125. [Google Scholar] [CrossRef]
- Hoare, E.; Varsamis, P.; Owen, N.; Dunstan, D.W.; Jennings, G.L.; Kingwell, B.A. Sugar- and Intense-Sweetened Drinks in Australia: A Systematic Review on Cardiometabolic Risk. Nutrients 2017, 9, 1075. [Google Scholar] [CrossRef]
- Brownell, K.D.; Farley, T.; Willett, W.C.; Popkin, B.M.; Chaloupka, F.J.; Thompson, J.W.; Ludwig, D.S. The public health and economic benefits of taxing sugar-sweetened beverages. N. Engl. J. Med. 2009, 361, 1599–1605. [Google Scholar] [CrossRef]
- Obesity Policy Coalition. A Comprehensive Program to Reduce Consumption of Sugar-Sweetened Beverages in Australia; Obesity Policy Coalition: Melbourne, Australian, 2018; Available online: https://www.opc.org.au/downloads/policy-briefs/reduce-sugary-drinks-in-australia.pdf (accessed on 14 July 2019).
- Duffey, K.J.; Popkin, B.M. Shifts in patterns and consumption of beverages between 1965 and 2002. Obesity (Silver Spring) 2007, 15, 2739–2747. [Google Scholar] [CrossRef]
- Bleich, S.N.; Vercammen, K.A.; Koma, J.W.; Li, Z. Trends in Beverage Consumption Among Children and Adults, 2003–2014. Obesity (Silver Spring) 2018, 26, 432–441. [Google Scholar] [CrossRef] [PubMed]
- Brand-Miller, J.C.; Barclay, A.W. Declining consumption of added sugars and sugar-sweetened beverages in Australia: A challenge for obesity prevention. Am. J. Clin. Nutr. 2017, 105, 854–863. [Google Scholar] [CrossRef] [PubMed]
- Levy, G.; Tapsell, L. Shifts in purchasing patterns of non-alcoholic, water-based beverages in Australia, 1997–2006. Nutr. Diet. 2007, 64, 268–279. [Google Scholar] [CrossRef]
- Levy, G.S.; Shrapnel, W.S. Quenching Australia’s thirst: A trend analysis of water-based beverage sales from 1997 to 2011. Nutr. Diet. 2014, 71, 193–200. [Google Scholar] [CrossRef]
- Australian Bureau of Statistics. 4364.0.55.007—Australian Health Survey: Nutrition First Results—Foods and Nutrients, 2011-12; Australian Bureau Of Statistics: Melbourne, Australian, 2014.
- Brisbois, T.D.; Marsden, S.L.; Anderson, G.H.; Sievenpiper, J.L. Estimated intakes and sources of total and added sugars in the Canadian diet. Nutrients 2014, 6, 1899–1912. [Google Scholar] [CrossRef] [PubMed]
- Rodwan, J.G. Bottled Water. 2017 Staying Strong. US and International Developments and Statistics. 2018. Available online: https://www.bottledwater.org/public/BMC2017_BWR_StatsArticle.pdf (accessed on 24 February 2020).
- Langlois, K.; Garriguet, D.; Gonzalez, A.G.; Sinclair, S.; Colapinto, C.K. Change in total sugars consumption among Canadian children and adults. Catalogue no. 82-003-X. Health Rep. 2019, 30, 10–19. [Google Scholar] [PubMed]
- Garriguet, D. Accounting for misreporting when comparing energy intake across time in Canada. Health Rep. 2018, 29, 3–12. [Google Scholar]
- British Soft Drink Association. Making it happen. Annual report 2017. 2017. Available online: https://www.britishsoftdrinks.com/write/MediaUploads/Publications/BSDA_Drinks_Report_2017.pdf (accessed on 24 February 2020).
- Public Health England. Sugar reduction programme. Profress made by industry in the first year. Available online: https://publichealthengland.exposure.co/sugar-reduction-programme (accessed on 24 February 2020).
- Euromonitor. Soft drinks in Australia. 2019. Available online: https://www.euromonitor.com/soft-drinks-in-australia/report (accessed on 24 February 2020).
- Block, L.G.; Grier, S.A.; Childers, T.L.; Davis, B.; Ebert, J.E.J.; Kumanyika, S.; Laczniak, R.N.; Machin, J.E.; Motley, C.M.; Peracchio, L.; et al. From Nutrients to Nurturance: A Conceptual Introduction to Food Well-Being. J. Public Policy Mark. 2011, 30, 5–13. [Google Scholar] [CrossRef]
- Grunert, K.G.; Rohenkohl do Canto, N.; Liu, R.; Salnikova, E. Well-being as a global food trend: Health, sustainability and authenticity. 2011. Available online: https://danishfoodinnovation.dk/wp-content/uploads/2019/03/DFI-short-paper-finalwithrefs.pdf (accessed on 26 August 2019).
- McMahon, A.T.; Williams, P.; Tapsell, L. Reviewing the meanings of wellness and well-being and their implications for food choice. Perspect Public Health 2010, 130, 282–286. [Google Scholar] [CrossRef]
- Rozin, P.; Fischler, C.; Shields-Argeles, C. European and American perspectives on the meaning of natural. Appetite 2012, 59, 448–455. [Google Scholar] [CrossRef]
- US Food and Drug Administration. Use of the term natural on food labeling. Available online: https://www.fda.gov/food/food-labeling-nutrition/use-term-natural-food-labeling (accessed on 31 August 2019).
- Román, S.; Sánchez-Siles, L.M.; Siegrist, M. The importance of food naturalness for consumers: Results of a systematic review. Trends Food Sci. Technol. 2017, 67, 44–57. [Google Scholar] [CrossRef]
- Euromonitor International. New Lifestyles System Data: Global Consumer Trends Survey 2017. Available online: https://blog.euromonitor.com/global-consumer-trends-2017/ (accessed on 31 August 2019).
- Smith, M.A.; Wells, M.H.; Scarbecz, M.; Vinall, C.V.; Woods, M.A. Parents’ preferences and perceptions of their children’s consumption of sugar and non-nutritive sugar substitutes. Pediatr Dent. 2019, 41, 119–128. [Google Scholar] [PubMed]
- EFSA Panel on Food Additives and Nutrient Sources added to Food (ANS). Scientific Opinion on the re-evaluation of aspartame (E 951) as a food additive. EFSA J. 2013, 11, 3496. [Google Scholar] [CrossRef]
- Beverage Marketing Corporation. Beverages 2017. The Shifting Beverage Landscape And What It Means for Packaging. In Proceedings of the Packaging Conference, Tampa, FL, USA, 6 February 2017. [Google Scholar]
- Riley, M.D.; Hendrie, G.A.; Baird, D.L. Drink Choice is Important: Beverages Make a Substantial Contribution to Energy, Sugar, Calcium and Vitamin C Intake among Australians. Nutrients 2019, 11, 1389. [Google Scholar] [CrossRef] [PubMed]
- Livingston, M.; Callinan, S.; Raninen, J.; Pennay, A.; Dietze, P.M. Alcohol consumption trends in Australia: Comparing surveys and sales-based measures. Drug Alcohol. Rev. 2018, 37, S9–S14. [Google Scholar] [CrossRef]


| Beverage Category | Per capita Volume Sales 1997 (L/person) | Per capita Volume Sales 2009 (L/person) | Per capita Volume Sales 2018 (L/person) | Volume Share 1997 (%) * | Volume Share 2018 (%) * | Percentage Change per Capita Volume Sales 2009–2018 (%) | Annual Growth Rate 2009–2018 (%) | Percentage Change per Capita Volume sales 1997–2018 (%) | Annual Growth Rate 1997–2018 (%) |
|---|---|---|---|---|---|---|---|---|---|
| All water-based beverages * | |||||||||
| Total | 130.86 | 129.61 | 149.42 | 100.00 | 100.00 | 0.67 | 1.53 | 14.18 | 0.64 |
| SSB | 83.16 | 74.40 | 61.04 | 63.54 | 40.85 | −0.82 | −1.80 | −26.59 | −1.21 |
| Non-SSB | 47.71 | 55.21 | 88.38 | 36.45 | 59.15 | 3.27 | 6.01 | 85.26 | 3.88 |
| Carbonated soft drinks | |||||||||
| Total | 98.54 | 91.62 | 70.58 | 75.30 | 47.24 | −0.79 | −2.30 | −28.37 | −1.29 |
| SSB | 75.78 | 62.51 | 44.62 | 57.91 | 29.86 | −1.69 | −2.86 | −41.13 | −1.87 |
| Non-SSB | 22.76 | 29.12 | 25.97 | 17.39 | 17.37 | 2.21 | −1.08 | 14.08 | 0.64 |
| Energy drinks | |||||||||
| Total | 0.14 | 3.56 | 6.36 | 0.11 | 1.33 | 81.39 | 7.86 | 4374.72 | 198.85 |
| SSB | 0.14 | 3.30 | 5.44 | 0.11 | 1.16 | 73.61 | 6.50 | 3728.39 | 169.47 |
| Non-SSB | 0.00 | 0.26 | 0.92 | 0.00 | 0.17 | NC | 25.07 | NC | NC |
| Sports drinks | |||||||||
| Total | 1.48 | 2.79 | 3.97 | 1.13 | 2.66 | 7.29 | 4.24 | 168.25 | 7.65 |
| SSB | 1.48 | 2.70 | 3.78 | 1.13 | 2.53 | 7.18 | 4.03 | 156.05 | 7.09 |
| Non-SSB | 0.00 | 0.09 | 0.19 | 0.00 | 0.13 | 61.48 | 10.57 | 6478.99 | 294.50 |
| Iced tea | |||||||||
| Total | 0.15 | 1.30 | 1.99 | 0.16 | 1.26 | 44.84 | 5.30 | 1217.43 | 55.34 |
| SSB | 0.15 | 1.15 | 1.73 | 0.16 | 0.78 | 39.36 | 5.09 | 1043.63 | 47.44 |
| Non-SSB | 0.00 | 0.16 | 0.26 | 0 | 0.56 | NC | 6.88 | NC | NC |
| Mineral waters | |||||||||
| Total | 5.00 | 4.49 † | 9.02 † | 3.82 | 6.03 † | −0.58 | 10.08 | 80.47 | 3.66 |
| SSB | 2.17 | 1.49 | 1.88 | 1.66 | 1.26 | −2.27 | 2.61 | −13.47 | −0.61 |
| Non-SSB | 2.82 | 0.80 | 1.17 | 2.61 | 2.01 | −6.02 | 4.51 | −58.65 | −2.67 |
| Mixers | |||||||||
| Total | 7.97 | 7.24 | 8.36 | 6.09 | 5.59 | −0.07 | 1.55 | 4.89 | 0.22 |
| SSB | 3.41 | 2.48 | 3.01 | 2.61 | 2.01 | 9.14 | 2.11 | −11.88 | −0.54 |
| Non-SSB | 4.55 | 4.75 | 5.35 | 3.48 | 3.58 | −6.98 | 1.25 | 17.47 | 0.79 |
| Unflavoured pure waters | |||||||||
| Total | 11.81 | 20.02 | 53.88 | 9.02 | 36.06 | 4.32 | 16.91 | 356.33 | 16.20 |
| Still | 5.76 | 17.83 | 47.91 | 4.41 | 32.57 | 14.32 | 16.88 | 732.37 | 33.29 |
| Sparkling | - | 2.19 | 5.97 | - | 3.99 | NC | 17.21 | NC | NC |
| Flavoured Milks | |||||||||
| Total | - | 6.06 | 9.48 | - | - | 56.42 | 5.64 | NC | NC |
| Juice | |||||||||
| Total | - | 36.70 | 24.62 | - | - | −32.92 | −3.29 | NC | NC |
| 100% Juice | - | 26.0 | 18.82 | - | - | −43.02 | −4.30 | NC | NC |
| Less than 100% Juice | - | 10.69 | 9.80 | - | - | −8.34 | −0.83 | NC | NC |
| Kombucha | |||||||||
| Total | - | 0.00 | 0.47 | - | - | NC | NC | NC | NC |
© 2020 by the authors. Licensee MDPI, Basel, Switzerland. This article is an open access article distributed under the terms and conditions of the Creative Commons Attribution (CC BY) license (http://creativecommons.org/licenses/by/4.0/).
Share and Cite
Shrapnel, W.S.; Butcher, B.E. Sales of Sugar-Sweetened Beverages in Australia: A Trend Analysis from 1997 to 2018. Nutrients 2020, 12, 1016. https://doi.org/10.3390/nu12041016
Shrapnel WS, Butcher BE. Sales of Sugar-Sweetened Beverages in Australia: A Trend Analysis from 1997 to 2018. Nutrients. 2020; 12(4):1016. https://doi.org/10.3390/nu12041016
Chicago/Turabian StyleShrapnel, William S., and Belinda E. Butcher. 2020. "Sales of Sugar-Sweetened Beverages in Australia: A Trend Analysis from 1997 to 2018" Nutrients 12, no. 4: 1016. https://doi.org/10.3390/nu12041016
APA StyleShrapnel, W. S., & Butcher, B. E. (2020). Sales of Sugar-Sweetened Beverages in Australia: A Trend Analysis from 1997 to 2018. Nutrients, 12(4), 1016. https://doi.org/10.3390/nu12041016