The Healthy Cooking Index does not Predict the Carotenoid Content of Home-Cooked Meals


Abstract
1. Introduction
2. Materials and Methods
2.1. Participants
2.2. Data Collection
2.3. Analysis
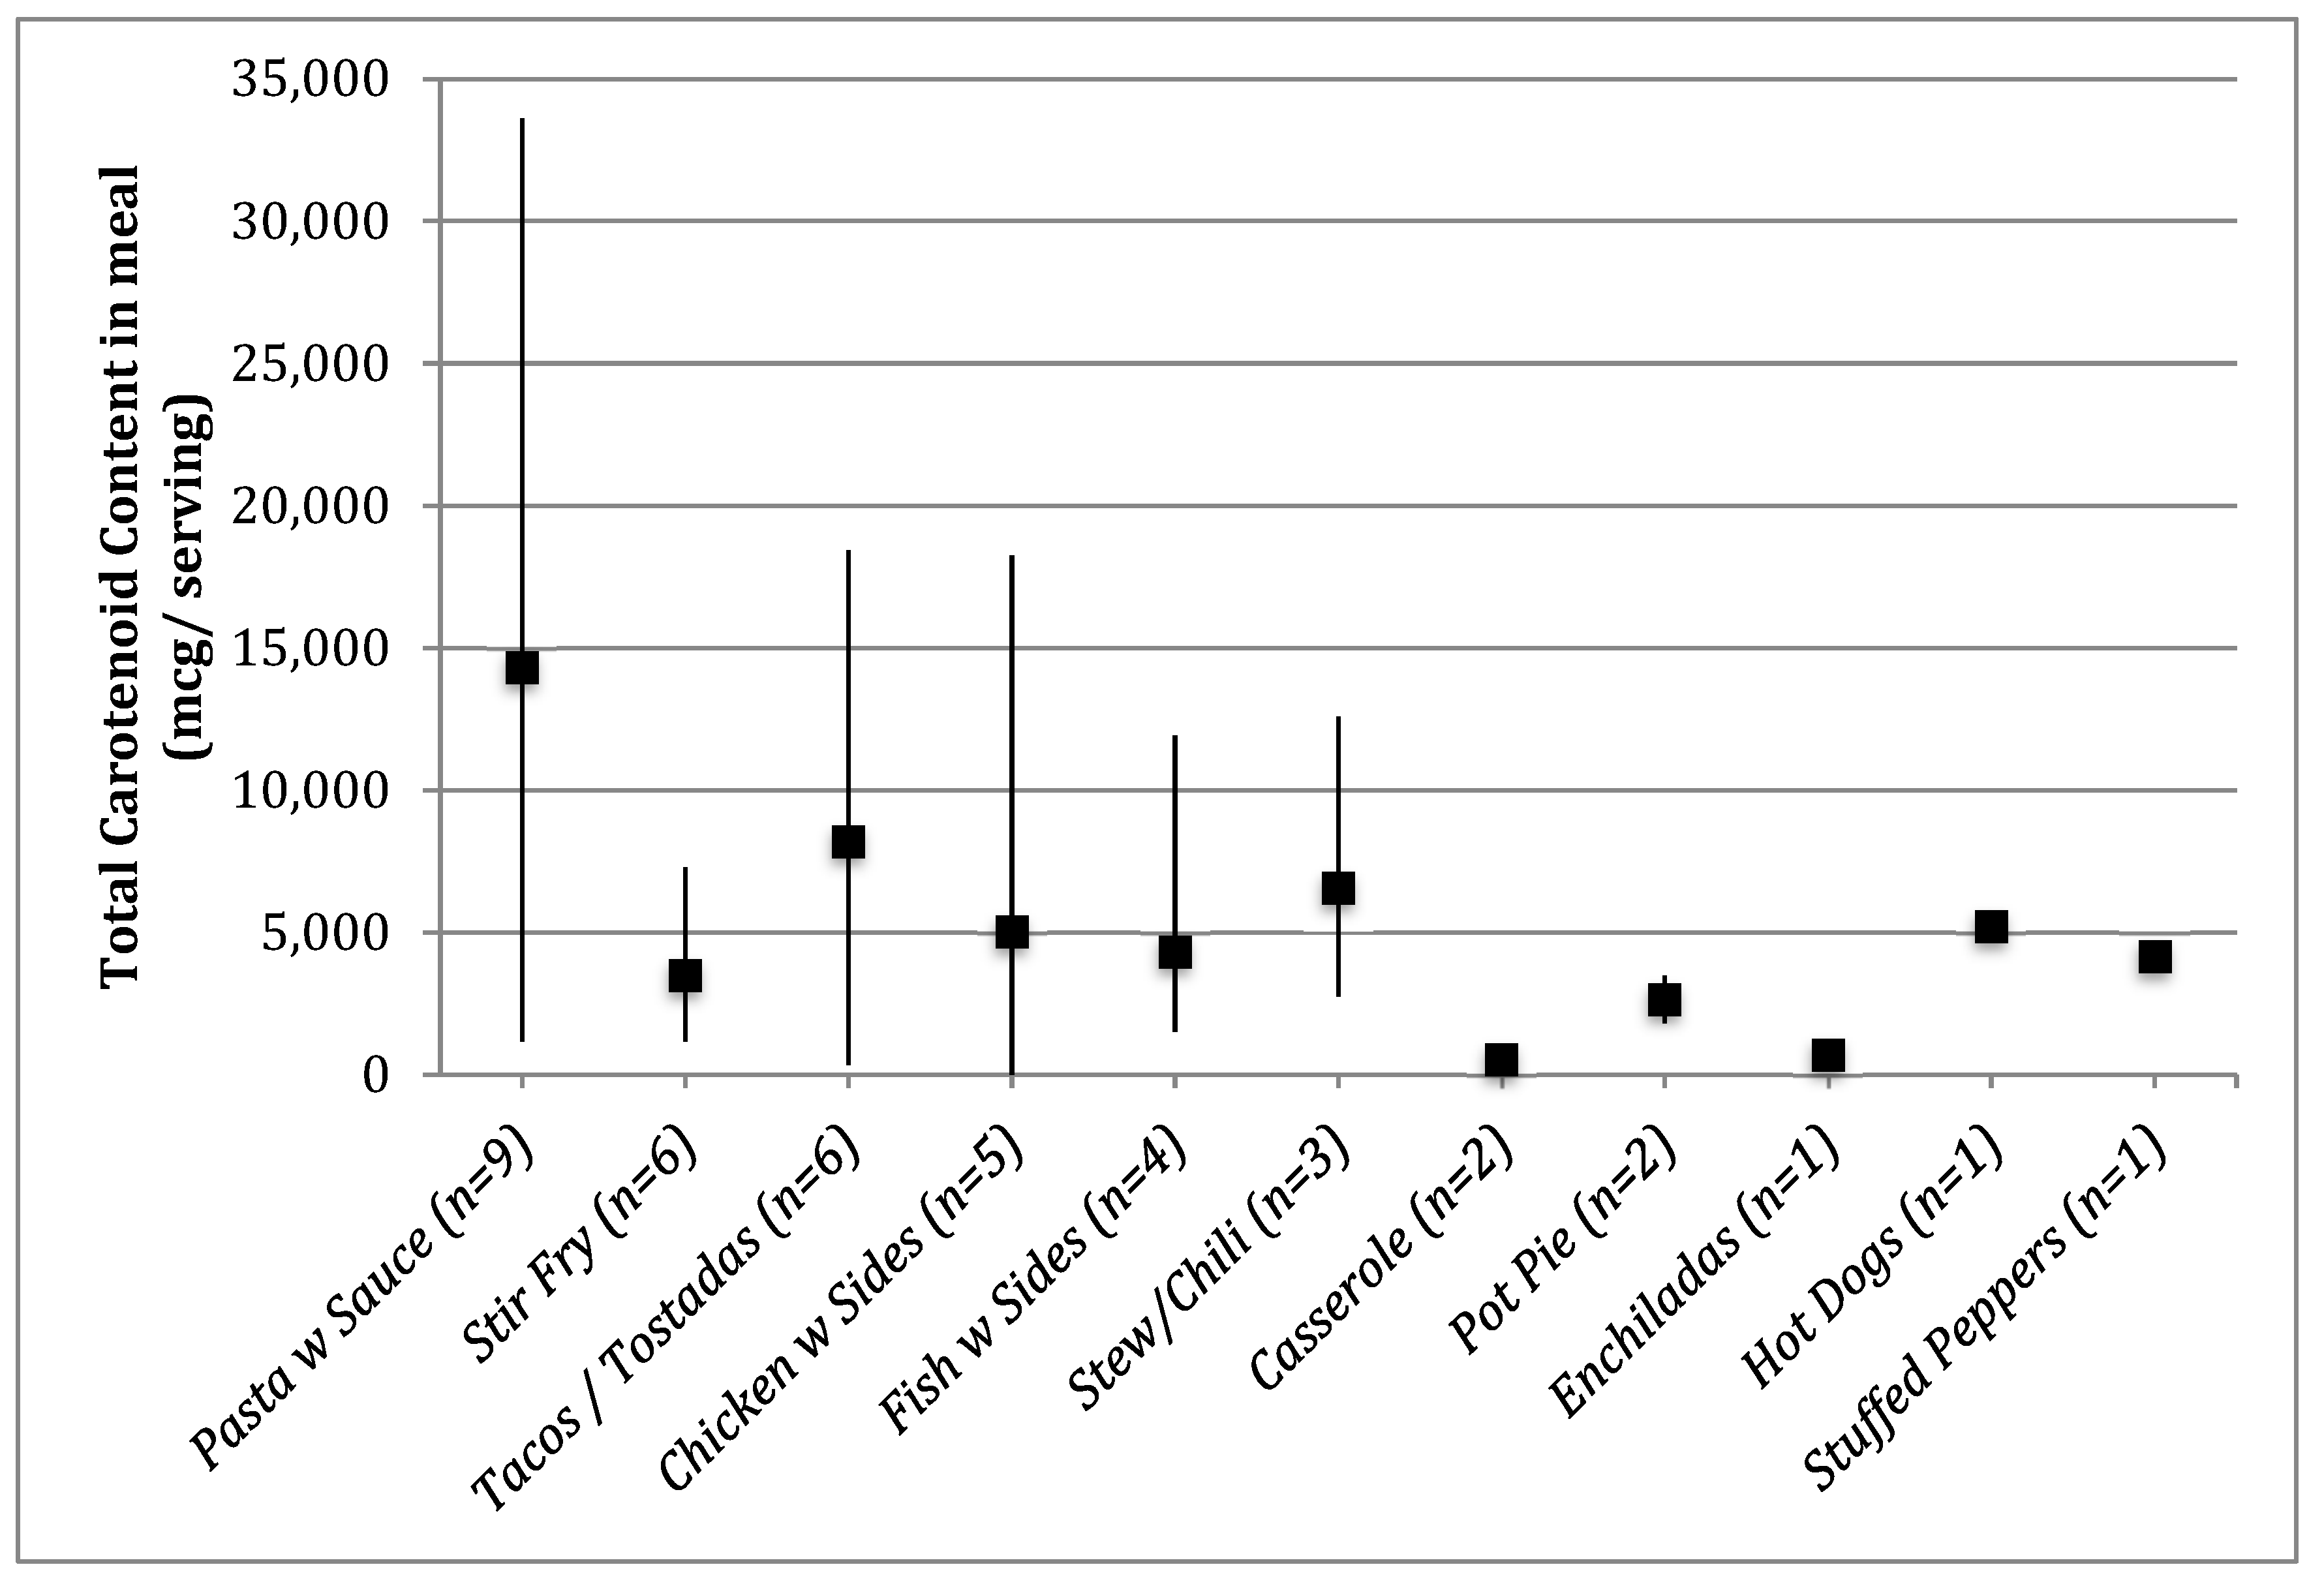
3. Results
4. Discussion
Author Contributions
Funding
Acknowledgments
Conflicts of Interest
References
- Mayne, S.T.; Playdon, M.C.; Rock, C.L. Diet, nutrition, and cancer: Past, present and future. Nat. Rev. Clin. Oncol. 2016, 13, 504. [Google Scholar] [CrossRef]
- Diller, L.; Chow, E.J.; Gurney, J.G.; Hudson, M.M.; Kadin-Lottick, N.S.; Kawashima, T.I.; Leisenring, W.M.; Meacham, L.R.; Mertens, A.C.; Mulrooney, D.A.; et al. Chronic disease in the Childhood Cancer Survivor Study cohort: A review of published findings. J. Clin. Oncol. 2009, 27, 2339–2355. [Google Scholar] [CrossRef]
- Oeffinger, K.C.; Mertens, A.C.; Sklar, C.A.; Yasui, Y.; Fears, T.; Stovall, M.; Vik, T.A.; Inskip, P.D.; Robison, L.L. Childhood Cancer Survivor Study Obesity in adult survivors of childhood acute lymphoblastic leukemia: A report from the Childhood Cancer Survivor Study. J. Clin. Oncol. 2003, 21, 1359–1365. [Google Scholar] [CrossRef]
- Zhang, F.F.; Saltzman, E.; Kelly, M.J.; Liu, S.; Must, A.; Parsons, S.K.; Roberts, S.B. Comparison of childhood cancer survivors’ nutritional intake with US dietary guidelines. Pediatric Blood Cancer 2015, 62, 1461–1467. [Google Scholar] [CrossRef]
- Robien, K.; Ness, K.K.; Klesges, L.M.; Baker, K.S.; Gurney, J.G. Poor adherence to dietary guidelines among adult survivors of childhood acute lymphoblastic leukemia. J. Pediatr. Hematol. Oncol. 2008, 30, 815–822. [Google Scholar] [CrossRef] [PubMed]
- Cohen, J.; Wakefield, C.E.; Fleming, C.A.; Gawthorne, R.; Tapsell, L.C.; Cohn, R.J. Dietary intake after treatment in child cancer survivors. Pediatric Blood Cancer 2012, 58, 752–757. [Google Scholar] [CrossRef] [PubMed]
- Guenther, P.M.; Casavale, K.O.; Reedy, J.; Kirkpatrick, S.I.; Hiza, H.A.; Kuczynski, K.J.; Kahle, L.L.; Krebs-Smith, S.M. Update of the healthy eating index: HEI-2010. J. Acad. Nut. Diet. 2013, 113, 569–580. [Google Scholar] [CrossRef] [PubMed]
- Banfield, E.C.; Liu, Y.; Davis, J.S.; Chang, S.; Frazier-Wood, A.C. Poor Adherence to US Dietary Guidelines for Children and Adolescents in the National Health and Nutrition Examination Survey Population. J. Acad. Nut. Diet. 2016, 116, 21–27. [Google Scholar] [CrossRef] [PubMed]
- Nicosia, R.; Lanzoni, G.; Eisenberg, D. “Teaching Kitchens”: From Nutrition and Lifestyle Coaching to Culinary Medicine. CellR4 2017, 5, e2236. Available online: http://www.cellr4.org/wp-content/uploads/sites/2/2017/02/Teaching-Kitchens-from-nutrition-to-culinary-medicine.pdf (accessed on 12 July 2019).
- Raber, M.; Crawford, K.; Chandra, J. Healthy cooking classes at a children’s cancer hospital and patient/survivor summer camps: Initial reactions and feasibility. Public Health Nutr. 2017, 20, 1650–1656. [Google Scholar] [CrossRef]
- Chaput, C.; Beaulieu-Gagnon, S.; Belanger, V.; Drouin, S.; Bertout, L.; Lafrance, L.; Olivier, C.; Robitaille, M.; Laverdiere, C.; Sinnett, D.; et al. Research- and Practice-Based Nutrition Education and Cooking Workshops in Pediatric Oncology: Protocol for Implementation and Development of Curriculum. JMIR Res. Protoc. 2018, 7, e2. [Google Scholar] [CrossRef]
- Raber, M.; Chandra, J.; Upadhyaya, M.; Schick, V.; Strong, L.L.; Durand, C.; Sharma, S. An evidence-based conceptual framework of healthy cooking. Prev. Med. Rep. 2016, 4, 23–28. [Google Scholar] [CrossRef]
- Moran, N.E.; Mohn, E.S.; Hason, N.; Erdman, J.W., Jr.; Johnson, E.J. Intrinsic and extrinsic factors impacting absorption, metabolism, and health effects of dietary carotenoids. Adv. Nutr. 2018, 9, 465–492. [Google Scholar] [CrossRef] [PubMed]
- Zuniga, K.E.; Moran, N.E. Low Serum Carotenoids Are Associated with Inflammatory Markers and Subjective Cognitive Impairments in Breast Cancer Survivors. Nutrients 2018, 10, 260. [Google Scholar] [CrossRef]
- Butalla, A.C.; Crane, T.E.; Patil, B.; Wertheim, B.C.; Thompson, P.; Thomson, C.A. Effects of a carrot juice intervention on plasma carotenoids, oxidative stress, and inflammation in overweight breast cancer survivors. Nutr. Cancer 2012, 64, 331–341. [Google Scholar] [CrossRef] [PubMed]
- Spees, C.K.; Hill, E.B.; Grainger, E.M.; Buell, J.L.; White, S.E.; Kleinhenz, M.D.; Clinton, S.K. Feasibility, preliminary efficacy, and lessons learned from a garden-based lifestyle intervention for cancer survivors. Cancer Control 2016, 23, 302–310. [Google Scholar] [CrossRef] [PubMed]
- Zick, S.M.; Colacino, J.; Cornellier, M.; Khabir, T.; Surnow, K.; Djuric, Z. Fatigue reduction diet in breast cancer survivors: A pilot randomized clinical trial. Breast Cancer Res. Treat. 2017, 161, 299–310. [Google Scholar] [CrossRef]
- U.S. Department of Health and Human Services and U.S. Department of Agriculture. 2015–2020 Dietary Guidelines for Americans, 8th ed.; US Government Printing Office: Washington, DC, USA, 2015.
- Pitts, S.B.J.; Jahns, L.; Wu, Q.; Moran, N.E.; Bell, R.A.; Truesdale, K.P.; Laska, M.N. A non-invasive assessment of skin carotenoid status through reflection spectroscopy is a feasible, reliable and potentially valid measure of fruit and vegetable consumption in a diverse community sample. Public Health Nutr. 2018, 21, 1664–1670. [Google Scholar] [CrossRef]
- Ermakov, I.V.; Ermakova, M.; Sharifzadeh, M.; Gorusupudi, A.; Farnsworth, K.; Bernstein, P.S.; Stookey, J.; Evans, J.; Arana, T.; Tao-Lew, L. Optical assessment of skin carotenoid status as a biomarker of vegetable and fruit intake. Arch. Biochem. Biophys. 2018, 646, 46–54. [Google Scholar] [CrossRef]
- Jahns, L.; Johnson, L.K.; Mayne, S.T.; Cartmel, B.; Picklo Sr, M.J.; Ermakov, I.V.; Gellermann, W.; Whigham, L.D. Skin and plasma carotenoid response to a provided intervention diet high in vegetables and fruit: Uptake and depletion kinetics. Am. J. Clin. Nutr. 2014, 100, 930–937. [Google Scholar] [CrossRef]
- Mayne, S.T.; Cartmel, B.; Scarmo, S.; Jahns, L.; Ermakov, I.V.; Gellermann, W. Resonance Raman spectroscopic evaluation of skin carotenoids as a biomarker of carotenoid status for human studies. Arch. Biochem. Biophys. 2013, 539, 163–170. [Google Scholar] [CrossRef] [PubMed]
- Scarmo, S.; Henebery, K.; Peracchio, H.; Cartmel, B.; Lin, H.; Ermakov, I.; Gellermann, W.; Bernstein, P.; Duffy, V.; Mayne, S. Skin carotenoid status measured by resonance Raman spectroscopy as a biomarker of fruit and vegetable intake in preschool children. Eur. J. Clin. Nutr. 2012, 66, 555. [Google Scholar] [CrossRef] [PubMed]
- United States Department of Agriculture What We Eat in America, NHANES 2009–2010, Individuals 2 Years and over (Excluding Pregnant and/or Lactating Females and Breast-Fed Children), Day 1 Food and Supplement Intake Data, Weighted. Available online: www.ars.usda.gov/ba/bhnrc/fsrg (accessed on 12 July 2019).
- Story, E.N.; Kopec, R.E.; Schwartz, S.J.; Harris, G.K. An update on the health effects of tomato lycopene. Annu. Rev. Food Sci. Technol. 2010, 1, 189–210. [Google Scholar] [CrossRef] [PubMed]
- Zhou, Y.E.; Buchowski, M.S.; Liu, J.; Schlundt, D.G.; Ukoli, F.A.; Blot, W.J.; Hargreaves, M.K. Plasma lycopene is associated with pizza and pasta consumption in middle-aged and older African American and white adults in the southeastern USA in a cross-sectional study. PLoS ONE 2016, 11, e0161918. [Google Scholar] [CrossRef]
- United States Department of Agriculture Economic Research Service Potatoes and Tomatoes Are the Most Commonly Consumed Vegetables. Available online: http://www.ers.usda.gov/data-products/chart-gallery/gallery/chart-detail/?chartId=58340 (accessed on 15 September 2019).
- Monteiro, C.A.; Cannon, G.; Moubarac, J.; Levy, R.B.; Louzada, M.L.C.; Jaime, P.C. The UN Decade of Nutrition, the NOVA food classification and the trouble with ultra-processing. Public Health Nutr. 2018, 21, 5–17. [Google Scholar] [CrossRef]
- Raber, M.; Crawford, K.; Baranowski, T.; Sharma, S.V.; Schick, V.; Markham, C.; Roth, M.; Wakefield, C.E.; Chandra, J. Meal planning values impacted by the cancer experience in families with school-aged survivors—A qualitative exploration and recommendations for intervention development. Supportive Care Cancer 2019, 3, 1–9. [Google Scholar] [CrossRef]
- Pitt, C.E. Cutting through the Paleo hype: The evidence for the Palaeolithic diet. Aust. Fam. Physician 2016, 45, 35. [Google Scholar]
- Barnea, D.; Raghunathan, N.; Friedman, D.N.; Tonorezos, E.S. Obesity and Metabolic Disease after Childhood Cancer. Oncology 2015, 29, 849–855. [Google Scholar]
- Berdan, C.A.; Tangney, C.C.; Scala, C.; Stolley, M. Childhood cancer survivors and adherence to the American Cancer Society Guidelines on Nutrition and Physical Activity. J. Cancer Surviv. 2014, 8, 671–679. [Google Scholar] [CrossRef]
- Ness, A.R.; Maynard, M.; Frankel, S.; Smith, G.D.; Frobisher, C.; Leary, S.D.; Emmett, P.M.; Gunnell, D. Diet in childhood and adult cardiovascular and all cause mortality: The Boyd Orr cohort. Heart 2005, 91, 894–898. [Google Scholar] [CrossRef]
- Wang, Y.; Chung, S.; McCullough, M.L.; Song, W.O.; Fernandez, M.L.; Koo, S.I.; Chun, O.K. Dietary Carotenoids Are Associated with Cardiovascular Disease Risk Biomarkers Mediated by Serum Carotenoid Concentrations1, 2. J. Nutr. 2014, 144, 1067–1074. [Google Scholar] [CrossRef] [PubMed]
- Bakker, M.F.; Peeters, P.H.; Klaasen, V.M.; Bueno-de-Mesquita, H.B.; Jansen, E.H.; Ros, M.M.; Travier, N.; Olsen, A.; Tjønneland, A.; Overvad, K. Plasma carotenoids, vitamin C, tocopherols, and retinol and the risk of breast cancer in the European Prospective Investigation into Cancer and Nutrition cohort, 2. Am. J. Clin. Nutr. 2016, 103, 454–464. [Google Scholar] [CrossRef] [PubMed]
- Schoeller, D.A. Limitations in the assessment of dietary energy intake by self-report. Metab. Clin. Exp. 1995, 44, 18–22. [Google Scholar] [CrossRef]
- Schoeller, D.A.; Thomas, D.; Archer, E.; Heymsfield, S.B.; Blair, S.N.; Goran, M.I.; Hill, J.O.; Atkinson, R.L.; Corkey, B.E.; Foreyt, J.; et al. Self-report-based estimates of energy intake offer an inadequate basis for scientific conclusions. Am. J. Clin. Nutr. 2013, 97, 1413–1415. [Google Scholar] [CrossRef]
- Desmarchelier, C.; Borel, P. Overview of carotenoid bioavailability determinants: From dietary factors to host genetic variations. Trends Food Sci. Technol. 2017, 69, 270–280. [Google Scholar] [CrossRef]


| Variable | % (n) | |
|---|---|---|
| Child age (years) | 5 to 8 | 42.5 (17) |
| 9 to 13 | 45.0 (18) | |
| 14 to 18 | 12.5 (5) | |
| Child sex | Male | 35.0 (14) |
| Female | 65.0 (26) | |
| Child race/ethnicity | Non-Hispanic white | 40 (16) |
| Hispanic white | 27.5 (11) | |
| Non-Hispanic black | 17.5 (7) | |
| Other | 10.0 (4) | |
| Asian | 5.0 (2) | |
| Parent female | 95.0 (38) | |
| Parent age mean, SD (range) | 39.9, 6.4 (28–56) | |
| # Children in home mean, SD (range) | 2.28, 0.99 (1–5) | |
| Fruit/Veg servings per serving of prepared meal mean +/− SD (range) | 2.74 +/− 2.07 (0–9.47) | |
| Carotenoid content per serving of prepared meal mcg mean +/−SD (range) | Beta carotene | 1867 +/− 2275 (0–11,233) |
| Alpha carotene | 255 +/− 346 (0–1345) | |
| Beta cryptoxanthin | 50 +/− 75 (0–308) | |
| Lutein + zeaxanthin | 1219 +/− 2270 (0–13,866) | |
| Lycopene | 3416 +/− 267 (0–17,156) | |
| Total carotenoids | 6807 +/− 7329 (9–33,624) | |
| Dark Green Vegetables | Tomato | Deep Yellow Vegetables | |
|---|---|---|---|
| Beta-carotene | 0.459 ** | 0.109 | 0.738 ** |
| Alpha-carotene | 0.324 * | −0.137 | 0.252 |
| Beta-cryptoxanthin | 0.053 | 0.083 | −0.057 |
| Lutein + zeaxanthin | 0.473 ** | 0.128 | −0.006 |
| Lycopene | −0.163 | 0.865 ** | −0.165 |
| Total F/V | Vegetables a | Fruits | Total Carotenoid-Rich Vegetables | |
|---|---|---|---|---|
| Total Carotenoids | 0.14 | 0.16 | −0.07 | 0.55 ** |
| Dish Category | Carotenoid Content, High/Low | Description | Total Carotenoids | Beta- Carotene | Alpha- Carotene | Beta-Cryptoxanthin | Lutein and Zeaxanthin | Lycopene | Calories | Total Fat | Protein | Carb | HCI |
|---|---|---|---|---|---|---|---|---|---|---|---|---|---|
| Pasta | High | Regular spaghetti with ground beef, jarred spaghetti sauce (with cheese) and green peppers + side of canned spinach and frozen garlic bread | 33,624 | 8111 | 13 | 1 | 13,866 | 11,633 | 949 | 44.4 | 53.1 | 85.5 | −1 |
| Low | Protein-enhanced spaghetti with garlic, fresh shrimp and olive oil + side of roasted broccoli | 1182 | 412 | 13 | 1 | 756 | 0 | 833 | 39.8 | 48.0 | 81.5 | 6 | |
| Stir Fry | High | Multi-vegetable stir fry including pork sausage, fresh orange/yellow bell pepper and garlic, flavored with ginger and soy sauce + side of white rice | 7289 | 3693 | 1345 | 1 | 2250 | 0 | 595 | 22.0 | 17.5 | 83.1 | 1 |
| Low | Multi-vegetable stir fry with skinless chicken breast, frozen broccoli-carrot-cauliflower-pepper blend, and fresh green beans flavored with stir fry sauce + side of brown rice | 1183 | 547 | 148 | 9 | 479 | 0 | 304 | 12.4 | 16.0 | 32.9 | 5 | |
| Tacos | High | “Paleo” [30] tacos with ground beef, canned tomatoes, black beans and guacamole (premade) on cassava tortillas | 18,434 | 1177 | 174 | 34 | 490 | 16,559 | 734 | 31.5 | 44.2 | 72.3 | −1 |
| Low | Fish tacos with swai fish, lettuce, cilantro, jarred salsa and sour cream on plain flour tortillas | 355 | 166 | 3 | 20 | 166 | 0 | 694 | 48.9 | 25.6 | 38.4 | 0 | |
| Chicken | High | Chicken breast sautéed with fresh cherry tomatoes + side of kale/strawberry salad and side of green pasta with butter and cheese | 3228 | 1377 | 63 | 16 | 283 | 1489 | 472 | 20.3 | 31.4 | 42.2 | 6 |
| Low | Deep-fried skinless chicken breast + side of boudin sausage | 9 | 0 | 0 | 0 | 9 | 0 | 936 | 54.1 | 69.6 | 38.2 | −4 | |
| Fish | High | Roasted salmon with salt and pepper + side of microwaved sweet potatoes and steamed broccoli | 11,918 | 11,233 | 21 | 0 | 664 | 0 | 309 | 11.3 | 22.6 | 29.3 | 4 |
| Low | Roasted catfish with bread crumbs and aioli sauce + side of frozen broccoli–carrot–squash blend, chicken bouillon and butter | 1508 | 808 | 264 | 14 | 440 | 0 | 613 | 37.4 | 29.9 | 39.7 | 4 | |
| Stew/Chili | High | Packaged chili mix made from spice packets, ground beef, diced tomatoes, tomato sauce and canned beans + side of white rice | 12,597 | 1580 | 183 | 308 | 45 | 10,481 | 744 | 25.1 | 39.5 | 89.9 | −2 |
| Low | Shrimp stew made from sinigang spice packet mix, fresh eggplant, fresh tomato, long beans, ginger and taro root + side of white rice | 2760 | 794 | 101 | 10 | 661 | 1194 | 479 | 1.7 | 47.1 | 71.2 | 6 |
| Nutrition Variable | Total Carotenoids | Total Carotenoid Rich Fruit/Vegetables | Total Fruit/Vegetables a |
|---|---|---|---|
| Energy density (calories/grams) | −0.235 | −0.278 | −0.592 ** |
| Sugar (g) | 0.324 * | 0.127 | 0.462 ** |
| Fiber (g) | 0.149 | 0.032 | 0.580 ** |
| Meal servings of refined grains | 0.497 ** | 0.199 | −0.081 |
| Meal servings of whole grains | −0.293 | −0.315 * | −0.164 |
| Meal servings of sweets | 0.449 ** | 0.087 | 0.163 |
| Sodium (mg) | 0.099 | 0.116 | 0.348 * |
| Vegetable protein (g) | 0.483 ** | 0.171 | 0.343 * |
| Vitamin A (mcg)b | 0.539 ** | 0.616 ** | 0.215 |
| Vitamin K (mcg) | 0.509 ** | 0.445 ** | 0.347 * |
| Vitamin C (mcg) | −0.026 | 0.330 * | 0.704 ** |
| Vitamin B6 (mcg) | 0.222 | 0.166 | 0.328 * |
| Folate (mcg) | 0.723 ** | 0.388 * | 0.312 |
| Vitamin B12 (mcg) | 0.189 | 0.034 | 0.170 |
| Calcium (mg) | 0.041 | −0.120 | 0.450 ** |
| Magnesium (mg) | 0.179 | 0.174 | 0.560 ** |
| Iron (mg) | 0.658 ** | 0.258 | 0.388 * |
| Copper (mg) | 0.303 | 0.408 ** | 0.577 ** |
| Selenium (mcg) | 0.373 * | −0.020 | 0.082 |
| Potassium (mg) | 0.293 | 0.168 | 0.783 ** |
| Choline (mg) | −0.108 | −0.199 | 0.347 * |
© 2020 by the authors. Licensee MDPI, Basel, Switzerland. This article is an open access article distributed under the terms and conditions of the Creative Commons Attribution (CC BY) license (http://creativecommons.org/licenses/by/4.0/).
Share and Cite
Raber, M.; Basen-Engquist, K.; Moran, N.E.; Chandra, J. The Healthy Cooking Index does not Predict the Carotenoid Content of Home-Cooked Meals. Nutrients 2020, 12, 524. https://doi.org/10.3390/nu12020524
Raber M, Basen-Engquist K, Moran NE, Chandra J. The Healthy Cooking Index does not Predict the Carotenoid Content of Home-Cooked Meals. Nutrients. 2020; 12(2):524. https://doi.org/10.3390/nu12020524
Chicago/Turabian StyleRaber, Margaret, Karen Basen-Engquist, Nancy E. Moran, and Joya Chandra. 2020. "The Healthy Cooking Index does not Predict the Carotenoid Content of Home-Cooked Meals" Nutrients 12, no. 2: 524. https://doi.org/10.3390/nu12020524
APA StyleRaber, M., Basen-Engquist, K., Moran, N. E., & Chandra, J. (2020). The Healthy Cooking Index does not Predict the Carotenoid Content of Home-Cooked Meals. Nutrients, 12(2), 524. https://doi.org/10.3390/nu12020524