Food-Related Attentional Bias in Individuals with Normal Weight and Overweight: A Study with a Flicker Task


Abstract
1. Introduction
2. Methods
2.1. Participants
2.2. Apparatus
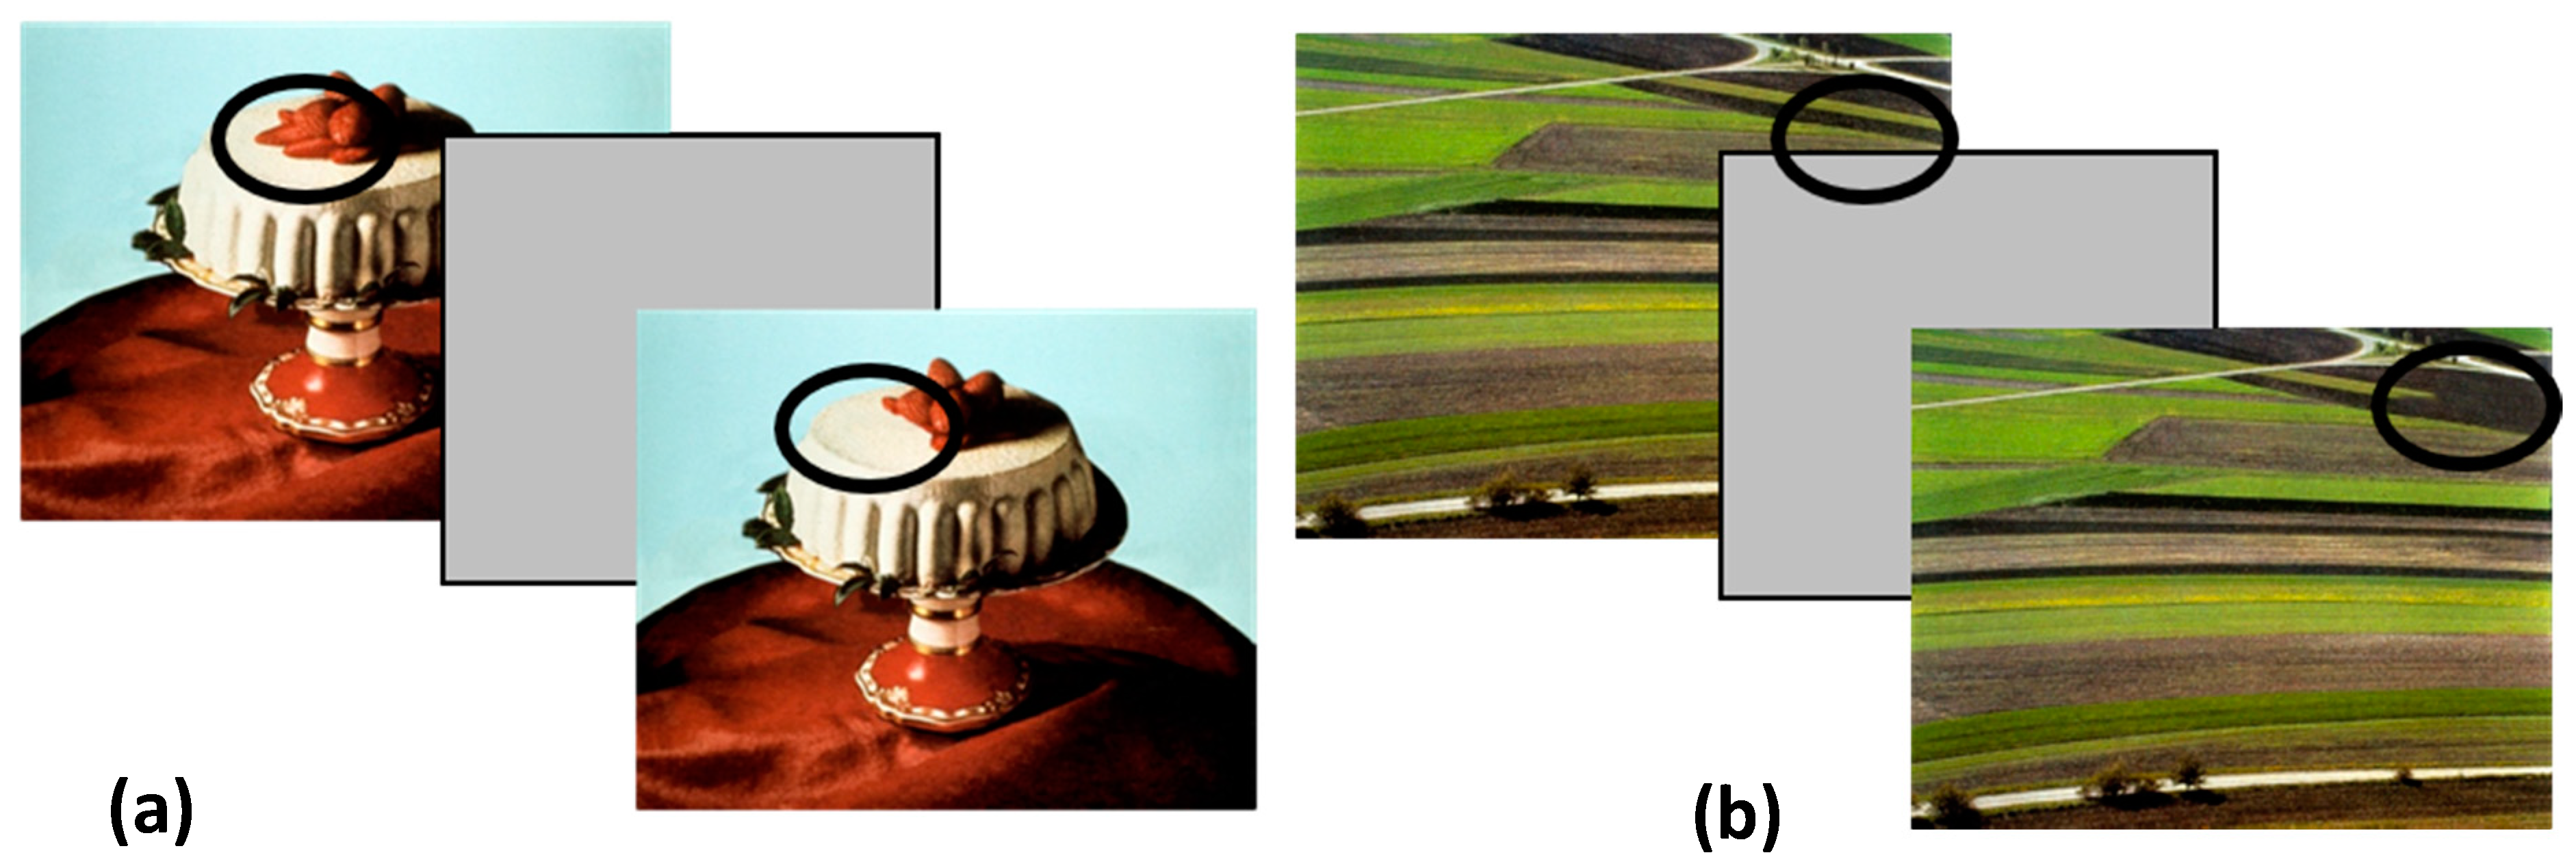
2.3. Visual Stimuli
2.4. Procedure
2.5. Data Analysis
3. Results
3.1. Characteristics of the Groups
3.2. Food Flicker Task
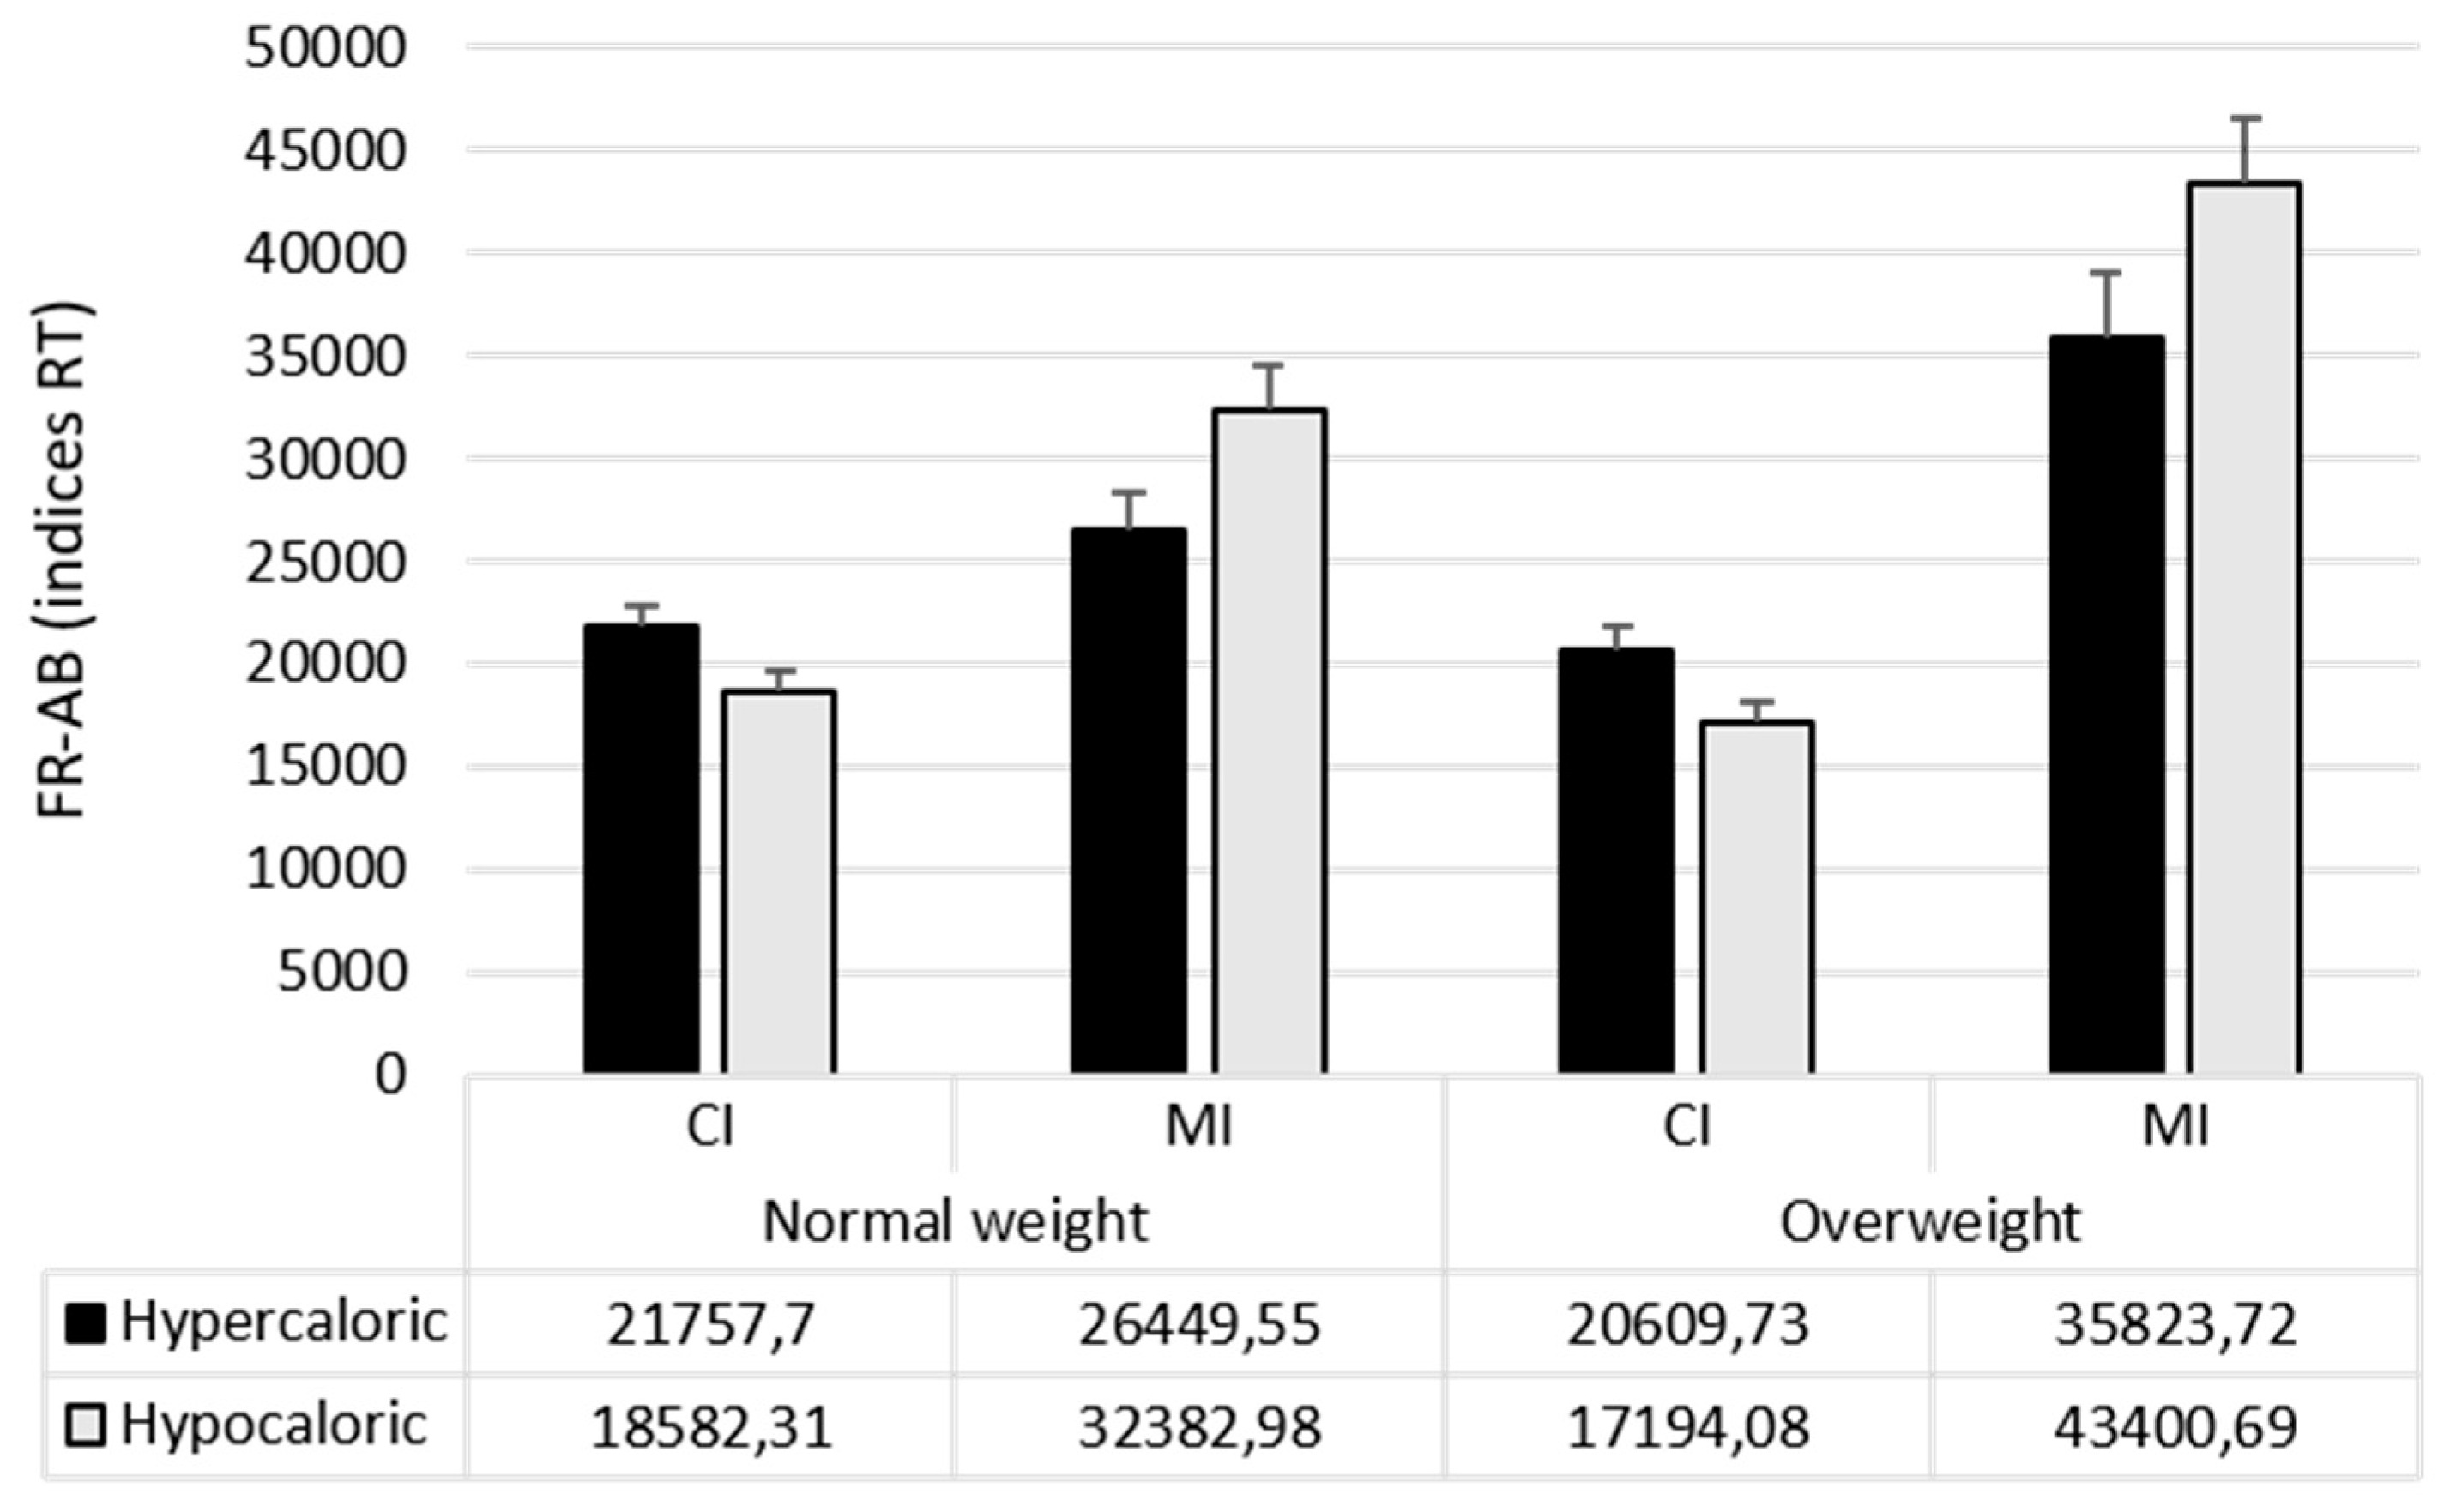
Detection Response Times
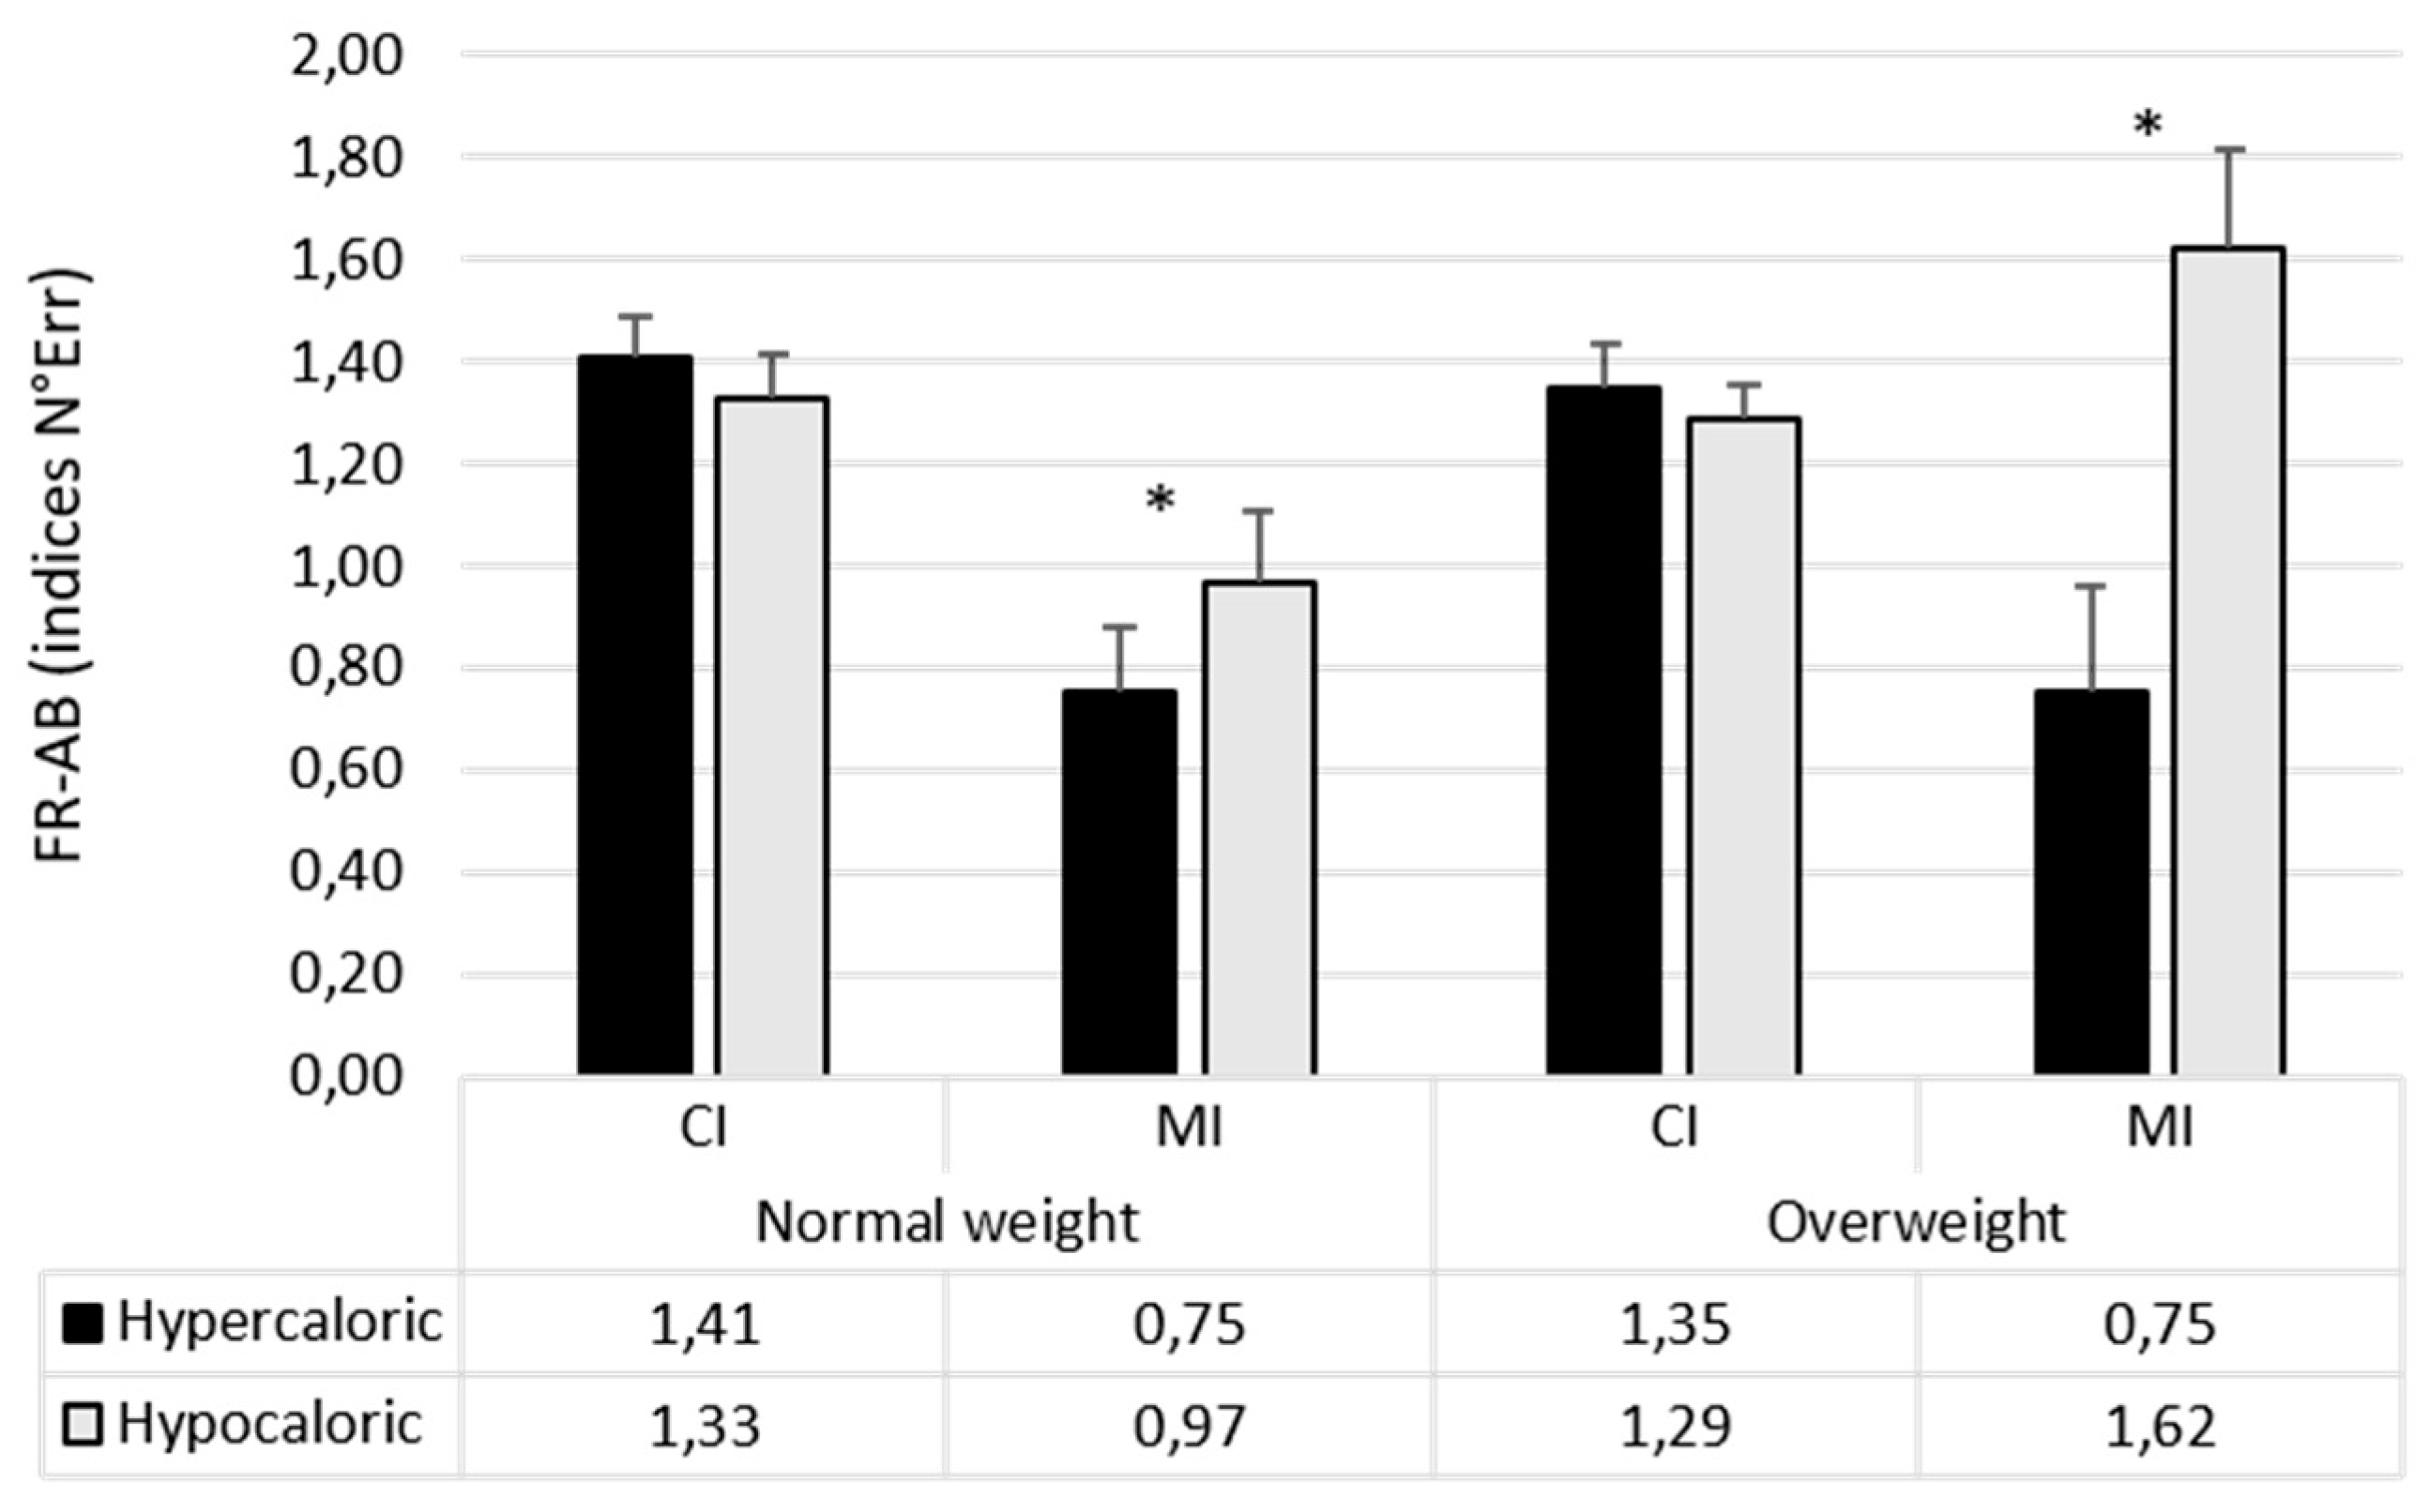
3.3. Accuracy
4. Discussion
Limits
5. Conclusions
Author Contributions
Funding
Acknowledgments
Conflicts of Interest
References
- World Health Organization. Body Mass Index—BMI. Available online: http://www.euro.who.int/en/health-topics/disease-prevention/nutrition/a-healthy-lifestyle/body-mass-index-bmi (accessed on 28 May 2019).
- Polivy, J.; Herman, C.P.; Coelho, J.S. Caloric restriction in the presence of attractive food cues: External cues, eating, and weight. Phys. Behav. 2008, 94, 729–733. [Google Scholar] [CrossRef] [PubMed]
- Hill, J.O.; Peters, J.C. Environmental contributions to the obesity epidemic. Science 1998, 280, 1371–1374. [Google Scholar] [CrossRef] [PubMed]
- Havermans, R.C. Pavlovian craving and overeating: A conditioned incentive model. Curr. Obes. Rep. 2013, 2, 165–170. [Google Scholar] [CrossRef]
- Rapee, R.M.; Heimberg, R.G. A cognitive-behavioral model of anxiety in social phobia. Behav. Res. Ther. 1997, 35, 741–756. [Google Scholar] [CrossRef]
- Dédovic Bar-Haim, Y.; Lamy, D.; Pergamin, L.; Bakermans-Kranenburg, M.J.; Van Ijzendoorn, M.H. Threat-Related attentional bias in anxious and nonanxious individuals: A meta-analytic study. Psychol. Bull. 2007, 133, 1. [Google Scholar] [CrossRef] [PubMed]
- Dedovic, K.; Slavich, G.M.; Muscatell, K.A.; Irwin, M.R.; Eisenberger, N.I. Dorsal anterior cingulate cortex responses to repeated social evaluative feedback in young women with and without a history of depression. Front. Behav. Neurosci. 2016, 10, 64. [Google Scholar] [CrossRef] [PubMed]
- Sharma, D.; Albery, I.P.; Cook, C. Selective attentional bias to alcohol related stimuli in problem drinkers and non-problem drinkers. Addiction 2001, 96, 285–295. [Google Scholar] [CrossRef]
- Berridge, K.C. ‘Liking’ and ‘wanting’ food rewards: Brain substrates and roles in eating disorders. Physiol. Behav. 2009, 97, 537–550. [Google Scholar] [CrossRef]
- Castellanos, E.H.; Charboneau, E.; Dietrich, M.S.; Park, S.; Bradley, B.P.; Mogg, K.; Cowan, R.L. Obese adults have visual attention bias for food cue images: Evidence for altered reward system function. Int. J. Obes. 2009, 33, 1063. [Google Scholar] [CrossRef]
- Brignell, C.; Griffiths, T.; Bradley, B.P.; Mogg, K. Attentional and approach biases for pictorial food cues. Influence of external eating. Appetite 2009, 52, 299–306. [Google Scholar] [CrossRef]
- Beaver, J.D.; Lawrence, A.D.; van Ditzhuijzen, J.; Davis, M.H.; Woods, A.; Calder, A.J. Individual differences in reward drive predict neural responses to images of food. J. Neurosci. 2006, 26, 5160–5166. [Google Scholar] [CrossRef] [PubMed]
- Franken, I.H.; Muris, P. Individual differences in reward sensitivity are related to food craving and relative body weight in healthy women. Appetite 2005, 45, 198–201. [Google Scholar] [CrossRef] [PubMed]
- Tetley, A.; Brunstrom, J.; Griffiths, P. Individual differences in food-cue reactivity. The role of BMI and everyday portion-size selections. Appetite 2009, 52, 614–620. [Google Scholar] [CrossRef] [PubMed]
- Hume, D.J.; Howells, F.M.; Rauch, H.L.; Kroff, J.; Lambert, E.V. Electrophysiological indices of visual food cue-reactivity. Differences in obese, overweight and normal weight women. Appetite 2015, 85, 126–137. [Google Scholar] [CrossRef]
- Berridge, K.C. The debate over dopamine’s role in reward: The case for incentive salience. Psychopharmacology 2007, 191, 391–431. [Google Scholar] [CrossRef]
- Wardle, J. Conditioning processes and cue exposure in the modification of excessive eating. Addict. Behav. 1990, 15, 387–393. [Google Scholar] [CrossRef]
- Hou, R.; Mogg, K.; Bradley, B.P.; Moss-Morris, R.; Peveler, R.; Roefs, A. External eating, impulsivity and attentional bias to food cues. Appetite 2011, 56, 424–427. [Google Scholar] [CrossRef]
- Nijs, I.M.; Franken, I.H.; Muris, P. Food-Related stroop interference in obese and normal-weight individuals: Behavioral and electrophysiological indices. Eat. Behav. 2010, 11, 258–265. [Google Scholar] [CrossRef]
- Werthmann, J.; Jansen, A.; Roefs, A. Make up your mind about food: A healthy mindset attenuates attention for high-calorie food in restrained eaters. Appetite 2016, 105, 53–59. [Google Scholar] [CrossRef]
- Deluchi, M.; Costa, F.S.; Friedman, R.; Gonçalves, R.; Bizarro, L. Attentional bias to unhealthy food in individuals with severe obesity and binge eating. Appetite 2017, 108, 471–476. [Google Scholar] [CrossRef]
- Soetens, B.; Braet, C. Information processing of food cues in overweight and normal weight adolescents. Br. J. Health Psychol. 2007, 12, 285–304. [Google Scholar] [CrossRef] [PubMed]
- Nummenmaa, L.; Hietanen, J.K.; Calvo, M.G.; Hyönä, J. Food catches the eye but not for everyone: A BMI-contingent attentional bias in rapid detection of nutriments. PLoS ONE 2011, 6, e19215. [Google Scholar] [CrossRef] [PubMed]
- Doolan, K.J.; Breslin, G.; Hanna, D.; Gallagher, A.M. Attentional bias to food-related visual cues: Is there a role in obesity? Proc. Nutr. Soc. 2015, 74, 37–45. [Google Scholar] [CrossRef] [PubMed]
- Jansen, A.; Houben, K.; Roefs, A. A cognitive profile of obesity and its translation into new interventions. Front. Psychol. 2015, 6, 1807. [Google Scholar] [CrossRef] [PubMed]
- Nijs, I.M.; Franken, I.H. Attentional processing of food cues in overweight and obese individuals. Curr. Obes. Rep. 2012, 1, 106–113. [Google Scholar] [CrossRef] [PubMed]
- Nijs, I.M.; Muris, P.; Euser, A.S.; Franken, I.H. Differences in attention to food and food intake between overweight/obese and normal-weight females under conditions of hunger and satiety. Appetite 2010, 54, 243–254. [Google Scholar] [CrossRef] [PubMed]
- Werthmann, J.; Roefs, A.; Nederkoorn, C.; Mogg, K.; Bradley, B.P.; Jansen, A. Can (not) take my eyes off it: Attention bias for food in overweight participants. Health Psychol. 2011, 30, 561. [Google Scholar] [CrossRef]
- Stojek, M.; Shank, L.M.; Vannucci, A.; Bongiorno, D.M.; Nelson, E.E.; Waters, A.J.; Engel, S.G.; Boutelle, K.N.; Pine, D.S.; Yanovski, J.A.; et al. A systematic review of attentional biases in disorders involving binge eating. Appetite 2018, 123, 367–389. [Google Scholar] [CrossRef]
- Bradley, B.P.; Mogg, K.; Miller, N.H. Covert and overt orientating of attention to emotional faces in anxiety. Cogn. Emot. 2000, 14, 789–808. [Google Scholar] [CrossRef]
- Brooks, S.J.; Owen, G.O.; Uher, R.; Friederich, H.C.; Giampietro, V.; Brammer, M.; Williams, S.C.; Schiöth, H.B.; Treasure, J.; Campbell, I.C. Differential neural responses to food images in women with bulimia versus anorexia nervosa. PLoS ONE 2011, 6, e22259. [Google Scholar] [CrossRef]
- Dobson, K.S.; Dozois, D.J. Attentional biases in eating disorders: A meta-analytic review of Stroop performance. Clin. Psychol. Rev. 2004, 23, 1001–1022. [Google Scholar] [CrossRef] [PubMed]
- Johansson, L.; Ghaderi, A.; Andersson, G. Stroop interference for food-and body-related words: A meta-analysis. Eat. Behav. 2005, 6, 271–281. [Google Scholar] [CrossRef] [PubMed]
- Jones, G.V.; Stacey, H.; Martin, M. Exploring the intensity paradox in emotional Stroop interference. Cogn. Ther. Res. 2002, 26, 831–839. [Google Scholar] [CrossRef]
- Miller, M.A.; Fillmore, M.T. The effect of image complexity on attentional bias towards alcohol-related images in adult drinkers. Addiction 2010, 105, 883–890. [Google Scholar] [CrossRef] [PubMed]
- Simons, D.J.; Levin, D.T. Change blindness. Trends Cogn. Sci. 1997, 1, 261–267. [Google Scholar] [CrossRef]
- Jones, B.T.; Bruce, G.; Livingstone, S.; Reed, E. Alcohol-Related attentional bias in problem drinkers with the flicker change blindness paradigm. Psychol. Addict. Behav. 2006, 20, 171. [Google Scholar] [CrossRef]
- McGlynn, F.D.; Wheeler, S.A.; Wilamowska, Z.A.; Katz, J.S. Detection of change in threat-related and innocuous scenes among snake-fearful and snake-tolerant participants: Data from the flicker task. J. Anxiety Disord. 2008, 22, 515–523. [Google Scholar] [CrossRef]
- Rensink, R.A. How much of a scene is seen? The role of attention in scene perception. Investig. Ophthalmol. Vis. Sci. 1997, 38, S707. [Google Scholar]
- Jonides, J.; Irwin, D.E. Capturing attention. Cognition 1981, 10, 145–150. [Google Scholar] [CrossRef][Green Version]
- Posner, M.I.; Snyder, C.R.; Davidson, B.J. Attention and the detection of signals. J. Exp. Psychol. Gen. 1980, 109, 160. [Google Scholar] [CrossRef]
- Làdavas, E.; Monica, C.; Guido, G. Automatic and voluntary orienting of attention in patients with visual neglect: Horizontal and vertical dimensions. Neuropsychologia 1994, 32, 1195–1208. [Google Scholar] [CrossRef]
- Turatto, M.; Galfano, G. Color, form and luminance capture attention in visual search. Vis. Res. 2000, 40, 1639–1643. [Google Scholar] [CrossRef]
- Calitri, R.; Pothos, E.M.; Tapper, K.; Brunstrom, J.M.; Rogers, P.J. Cognitive biases to healthy and unhealthy food words predict change in BMI. Obesity 2010, 18, 2282–2287. [Google Scholar] [CrossRef]
- Hollitt, S.; Kemps, E.; Tiggemann, M.; Smeets, E.; Mills, J.S. Components of attentional bias for food cues among restrained eaters. Appetite 2010, 54, 309–313. [Google Scholar] [CrossRef] [PubMed]
- Phelan, S.; Hassenstab, J.; McCaffery, J.M.; Sweet, L.; Raynor, H.A.; Cohen, R.A.; Wing, R.R. Cognitive interference from food cues in weight loss maintainers, normal weight and obese individuals. Obesity 2011, 19, 69–73. [Google Scholar] [CrossRef]
- Yokum, S.; Ng, J.; Stice, E. Attentional bias to food images associated with elevated weight and future weight gain: An fMRI study. Obesity 2011, 19, 1775–1783. [Google Scholar] [CrossRef]
- Gearhardt, A.N.; Boswell, R.G.; White, M.A. The association of “food addiction” with disordered eating and body mass index. Eat. Behav. 2014, 15, 427–433. [Google Scholar] [CrossRef]
- Loeber, S.; Grosshans, M.; Korucuoglu, O.; Vollmert, C.; Vollstädt-Klein, S.; Schneider, S.; Wiers, R.W.; Mann, K.; Kiefer, F. Impairment of inhibitory control in response to food-associated cues and attentional bias of obese participants and normal-weight controls. Int. J. Obes. 2012, 36, 1334. [Google Scholar] [CrossRef]
- Nathan, P.J.; O’Neill, B.V.; Mogg, K.; Bradley, B.P.; Beaver, J.; Bani, M.; Merlo-Pich, E.; Fletcher, P.C.; Swirski, B.; Koch, A.; et al. The effects of the dopamine D3 receptor antagonist GSK598809 on attentional bias to palatable food cues in overweight and obese subjects. Int. J. Neuropsychopharmacol. 2012, 15, 149–161. [Google Scholar] [CrossRef][Green Version]
- Kemps, E.; Tiggemann, M. Approach bias for food cues in obese individuals. Psychol. Health 2015, 30, 370–380. [Google Scholar] [CrossRef]
- Schmitz, F.; Naumann, E.; Trentowska, M.; Svaldi, J. Attentional bias for food cues in binge eating disorder. Appetite 2014, 80, 70–80. [Google Scholar] [CrossRef] [PubMed]
- Shank, L.M.; Tanofsky-Kraff, M.; Nelson, E.E.; Shomaker, L.B.; Ranzenhofer, L.M.; Hannallah, L.M.; Field, S.E.; Vannucci, A.; Bongiorno, D.M.; Brady, S.M.; et al. Attentional bias to food cues in youth with loss of control eating. Appetite 2015, 87, 68–75. [Google Scholar] [CrossRef] [PubMed]
- Schmidt, R.; Lüthold, P.; Kittel, R.; Tetzlaff, A.; Hilbert, A. Visual attentional bias for food in adolescents with binge-eating disorder. J. Psychiatr. Res. 2016, 80, 22–29. [Google Scholar] [CrossRef] [PubMed]
- Svaldi, J.; Naumann, E.; Trentowska, M.; Schmitz, F. General and food-specific inhibitory deficits in binge eating disorder. Int. J. Eat. Disord. 2014, 47, 534–542. [Google Scholar] [CrossRef]
- Lang, P.; Bradley, M.M. The International Affective Picture System (IAPS) in the study of emotion and attention. In Handbook of Emotion Elicitation and Assessment; Oxford University Press: Oxford, UK, 2007; p. 29. [Google Scholar]
- Maccari, L.; Casagrande, M.; Martella, D.; Anolfo, M.; Rosa, C.; Fuentes, L.J.; Pasini, A. Change blindness in children with ADHD: A selective impairment in visual search? JAD 2013, 17, 620–627. [Google Scholar] [CrossRef]
- Shore, D.I.; Burack, J.A.; Miller, D.; Joseph, S.; Enns, J.T. The development of change detection. Dev. Sci. 2006, 9, 490–497. [Google Scholar] [CrossRef]
- Fletcher-Watson, S.; Leekam, S.R.; Benson, V.; Frank, M.C.; Findlay, J.M. Eye-Movements reveal attention to social information in autism spectrum disorder. Neuropsychologia 2009, 47, 248–257. [Google Scholar] [CrossRef]
- Rensink, R.A. Change blindness: Implications for the nature of visual attention. In Vision and Attention; Springer: New York, NY, USA, 2001; pp. 169–188. [Google Scholar]
- Caplovitz, G.P.; Fendrich, R.; Hughes, H.C. Failures to see: Attentive blank stares revealed by change blindness. Conscious. Cogn. 2008, 17, 877–886. [Google Scholar] [CrossRef]
- Derryberry, D. Attention and voluntary self-control. Self Identity 2002, 1, 105–111. [Google Scholar] [CrossRef]
- Turatto, M.; Sandrini, M.; Miniussi, C. The role of the right dorsolateral prefrontal cortex in visual change awareness. Neuroreport 2004, 15, 2549–2552. [Google Scholar] [CrossRef][Green Version]
- Beck, D.M.; Rees, G.; Frith, C.D.; Lavie, N. Neural correlates of change detection and change blindness. Nat. Neurosci. 2001, 4, 645. [Google Scholar] [CrossRef]
- Beck, D.M.; Muggleton, N.; Walsh, V.; Lavie, N. Right parietal cortex plays a critical role in change blindness. Cereb. Cortex 2005, 16, 712–717. [Google Scholar] [CrossRef] [PubMed]
- Yuan, J.; Xu, S.; Yang, J.; Liu, Q.; Chen, A.; Zhu, L.; Chen, J.; Li, H. Pleasant mood intensifies brain processing of cognitive control: ERP correlates. Biol. Psychol. 2011, 87, 17–24. [Google Scholar] [CrossRef] [PubMed]
- Alvarez, J.A.; Emory, E. Executive function and the frontal lobes: A meta-analytic review. Neuropsychol. Rev. 2006, 16, 17–42. [Google Scholar] [CrossRef]
- Diamond, A. Executive functions. Annu. Rev. Psychol. 2013, 64, 135–168. [Google Scholar] [CrossRef]
- Favieri, F.; Forte, G.; Casagrande, M. The executive functions in overweight and obesity: A systematic review of neuropsychological cross-sectional and longitudinal studies. Front. Psychol. 2019, 10, 2126. [Google Scholar] [CrossRef]
- Ikeda, M.; Brown, J.; Holland, A.J.; Fukuhara, R.; Hodges, J.R. Changes in appetite, food preference, and eating habits in frontotemporal dementia and Alzheimer’s disease. J. Neurol. Neurosurg. Psychiatry 2002, 73, 371–376. [Google Scholar] [CrossRef]
- Allom, V.; Mullan, B. Individual differences in executive function predict distinct eating behaviours. Appetite 2014, 80, 123–130. [Google Scholar] [CrossRef]
- Hendrikse, J.J.; Cachia, R.L.; Kothe, E.J.; McPhie, S.; Skouteris, H.; Hayden, M.J. Attentional biases for food cues in overweight and individuals with obesity: A systematic review of the literature. Obes. Rev. 2015, 16, 424–432. [Google Scholar] [CrossRef]
- Fairburn, C.G. Cognitive Behavior Therapy and Eating Disorders; Guilford Press: New York, NY, USA, 2008. [Google Scholar]
- Puhl, R.M.; Heuer, C.A. The stigma of obesity: A review and update. Obesity 2009, 17, 941–964. [Google Scholar] [CrossRef]
- Aspen, V.; Darcy, A.M.; Lock, J. A review of attention biases in women with eating disorders. Cogn. Emot. 2013, 27, 820–838. [Google Scholar] [CrossRef] [PubMed]
- Casagrande, M.; Boncompagni, I.; Forte, G.; Guarino, A.; Favieri, F. Emotion and overeating behaviour: Effects of alexithymia and emotion regulation on overweight and obesity. Eat. Weight Disord. 2019, 1–13. [Google Scholar] [CrossRef]


| Authors; Year of Publication | Participants | Task | Stimuli Type | Stimuli Duration | Bias | Results |
|---|---|---|---|---|---|---|
| Soetens & Braet [28] | Adolescents with overweight vs. adolescents with normal weight | Imbedded word task | WORDS related to Food or No Food stimuli | N/S * | Attentional Interference | No difference between groups. |
| Castellanos et al. [10] | Women with normal weight vs. women with obesity (fasting and feeding condition). | Visual Probe Task [Eye tracking] | PICTURES of Food vs. No Food stimuli | 2000 ms | Gaze direction bias Gaze duration bias Reaction time bias | Fasting Condition: no differences between groups. Feeding condition: individuals with obesity showed a higher bias than individuals with normal weight. |
| Calitri et al. [44] | Graduate Students | Food Stroop Task | WORDS related to Healthy Food vs. Unhealthy Food vs. No Food stimuli | Until Participant Response | Cognitive Bias | Cognitive bias predicted the increase in BMI. |
| Calitri et al. [44] | Graduate Students | Dot Probe Task | WORDS related to Food vs. No Food stimuli | 500 ms or 1250 ms | Orienting Attention Sustained Attention | No effects. |
| Hollitt et al. [45] | Undergraduate student women: Restraint eaters vs. unrestrained eaters | Odd-one-out visual search task | WORDS related to food vs. word relate to neutral stimuli | Until participant response | Speed Detection Disengagement | Higher speed detection of food words in restrained eaters. No differences in the disengagement of attention. |
| Nijs et al. [27] | Women with overweight/obesity vs. women with normal weight (hunger and satiety conditions) | Visual Probe Task [Eye tracking] | PICTURES of Food vs. No Food stimuli | 100 ms or 500 ms | Orienting Attention Maintained Attention Attentional Bias Size | Individuals with normal weight faster than individuals with overweight. Orienting: higher in hunger condition. No differences in Maintained attention or attentional bias between groups. |
| Phelan et al. [46] | Women with normal weight vs. women with obesity vs. women maintaining weight-loss | Food Stroop Task | WORDS related to hypercaloric food vs. hypocaloric food vs. no food | N/S | Reaction time and Interference-Ratio | Higher reaction time toward hypercaloric food in individuals maintaining weight loss than in the other groups. |
| Nummenmaa et al. [23] | Graduate students (higher number of females than males) | Visual Search Task [Eye tracking] | PICTURES of hypercaloric food vs. hypocaloric food vs. No food | Until participant response | Orienting Decision Time (after fixation until response) | No association BMI-AB. |
| Yokum et al. [47] | Adolescent girls (BMI range: 17.3–28.8) 1-year-followup | Food Attentional Network Task | PICTURES of Appetising food vs. Unappetising food vs. No Food | 3000 ms | Orienting Reallocation | Faster RTs toward food cue in individuals with higher BMI. Greater AB is associated with a higher increase in weight. |
| Werthmann et al. [28] | Young women with normal weight vs. young women with overweight/obesity | Visual Probe Task [Eye Tracking] | PICTURES of Highly Palatable Foods vs. No Food | 2000 ms | Gaze direction bias; Initial fixation duration bias; Gaze dwell time bias. | Individuals with overweight showed significant Gaze direction bias and shorter Initial fixation duration bias than individuals with normal weight. No differences in Gaze dwell time. |
| Gearhardt et al. [48] | Women with overweight/obesity | Visual Search Task | PICTURES of Food Low in Fat and/or Sugar vs. Food High in Fat and/or Sugar | N/S | Vigilance Dwell-Time | BMI not related to Dwell-Time. BMI predictor of decreased vigilance. |
| Loeber et al. [49] | Adults with obesity vs. healthy control | Dot Probe Task | PICTURES of Food vs. No Food | 50 ms | Attentional allocation toward stimuli | No differences between groups. |
| Nathan et al. [50] | Adults with overweight/obesity, assuming placebo vs. adults with overweight/obesity, assuming D2 antagonists | Visual Probe Task | PICTURES of Food vs. No Food | 500 ms or 2000 ms | Attentional Bias Toward Food (RTs Probe in no-food-RTs Probe in food) | No differences between groups. |
| Kemps et al. [51] | Women with obesity vs. women with normal weight | Dot Probe Task | WORDS related to hypercaloric Food vs. hypocaloric Food vs. No Food | 500 ms | Attentional Bias | Women with obesity showed higher attentional bias toward food stimuli (faster Reaction time) than women with normal weight Women with obesity showed higher Attentional Bias toward hypercaloric food. |
| Kemps et al. [51] | Women with obesity (BMI > 30) | Dot Probe Task | PICTURES of Hypercaloric Food vs. hypocaloric Food vs. No Food | 500 ms | Attentional Bias | Attentional bias for food cue (faster reaction time). |
| Schmidt et al. [52] | Adult women with obesity, with or without BED | Spatial Cueing Task | PICTURES of Food vs. No Food | 100 ms | Stimulus engagement Stimulus disengagement | Women with BED showed higher engagement than women without BED. No differences in disengagement between groups. |
| Shank et al. [53] | Children and Adolescents (M/F) with loss of Control of Eating (higher number of participants with obesity) vs. Children and Adolescents with No Loss of Control of Eating (higher number of individuals with normal weight) | Visual Probe Task | PICTURES of High palatable food vs. Low palatable food vs. No Food | 2000 ms | Attentional Bias for sustained attention | No relationship between loss of controls eating AB. No relationship between BMI and AB. Loss of Control Eating x BMI: positive relation with AB toward palatable food. |
| Schmidt et al. [54] | Adolescents with obesity, with and without BED (in both groups the number of females was higher than the number of males) | Visual Search Task | PICTURES of Food vs. No Food | Until participant response | Food detection bias scores | AB higher in individuals with BED than in those without-BED. |
| Deluchi et al. [21] | Adult individuals with obesity with and without BED (BMI > 35) | Visual Probe Task | PICTURES of Unhealthy Food vs. No Food | SOA: 100, 500, 2000 ms | Orienting Maintenance Disengaging | Orienting AB in both groups; Disengaging AB in individuals with obesity and BED. |
| Normal Weight | Overweight | F | p | pƞ2 | |
|---|---|---|---|---|---|
| N (M/F) | 60 (25/35) | 53 (25/28) | |||
| Age | 24.53 (1.66) | 25.02 (2.32) | 1.67 | 0.20 | 0.01 |
| BMI | 20.40 (1.22) | 29.41 (4.40) | 236.78 | 0.0001 | 0.68 |
| Hungry Level (0–100 visual-analogue scale) | 27.65 | 30.19 | 0.39 | 0.53 |
| Normal Weight | Overweight | ||||
|---|---|---|---|---|---|
| Response Time (ms) | Accuracy (n° Errors) | Response Time (ms) | Accuracy (n° Errors) | ||
| Central Interest Changes | Neutral cues | 26,317 (7710) | 1.49 (0.51) | 25,014 (8367) | 1.46 (0.47) |
| Hypercaloric cues | 4560 (1824) | 0.08 (0.28) | 4404 (2202) | 0.11 (0.37) | |
| Hypocaloric cues | 7735 (3922) | 0.17 (0.42) | 7820 (3785) | 0.17 (0.43) | |
| Marginal Interest Changes | Neutral cues | 44,263 (17,030) | 1.27 (1.12) | 54,878 (23,218) | 2.09 (1.48) |
| Hypercaloric cues | 17,813 (7082) | 0.52 (0.68) | 19,054 (9172) | 0.81 (0.88) | |
| Hypocaloric cues | 11,880 (5382) | 0.30 (0.59) | 11,477 (4923) | 0.47 (0.72) | |
| Normal Weight | Overweight | ||
|---|---|---|---|
| Attentional Bias Index (RT) | Food Bias CI | 20,170 (7629) | 18,902 (7825) |
| Food Bias MI | 29,416 (15,376) | 39,612 (22,797) | |
| Hypercaloric Bias CI | 21,758 (7891) | 20,610 (8683) | |
| Hypercaloric Bias MI | 26,449 (15,101) | 35,824 (23,591) | |
| Hypocaloric Bias CI | 18,582 (7779) | 17,194 (7397) | |
| Hypocaloric Bias MI | 32,383 (16,481) | 43,401 (22,738) | |
| Attentional Bias Index (N° Errors) | Food Bias CI | 1.37 (1.59) | 1.32 (0.49) |
| Food Bias MI | 0.86 (0.96) | 1.45 (1.38) | |
| Hypercaloric Bias CI | 1.41 (0.60) | 1.34 (0.62) | |
| Hypercaloric Bias MI | 0.75 (0.98) | 1.28 (1.51) | |
| Hypocaloric Bias CI | 1.33 (0.66) | 1.29 (0.48) | |
| Hypocaloric Bias MI | 0.96 (1.07) | 1.62 (1.39) | |
© 2020 by the authors. Licensee MDPI, Basel, Switzerland. This article is an open access article distributed under the terms and conditions of the Creative Commons Attribution (CC BY) license (http://creativecommons.org/licenses/by/4.0/).
Share and Cite
Favieri, F.; Forte, G.; Marotta, A.; Casagrande, M. Food-Related Attentional Bias in Individuals with Normal Weight and Overweight: A Study with a Flicker Task. Nutrients 2020, 12, 492. https://doi.org/10.3390/nu12020492
Favieri F, Forte G, Marotta A, Casagrande M. Food-Related Attentional Bias in Individuals with Normal Weight and Overweight: A Study with a Flicker Task. Nutrients. 2020; 12(2):492. https://doi.org/10.3390/nu12020492
Chicago/Turabian StyleFavieri, Francesca, Giuseppe Forte, Andrea Marotta, and Maria Casagrande. 2020. "Food-Related Attentional Bias in Individuals with Normal Weight and Overweight: A Study with a Flicker Task" Nutrients 12, no. 2: 492. https://doi.org/10.3390/nu12020492
APA StyleFavieri, F., Forte, G., Marotta, A., & Casagrande, M. (2020). Food-Related Attentional Bias in Individuals with Normal Weight and Overweight: A Study with a Flicker Task. Nutrients, 12(2), 492. https://doi.org/10.3390/nu12020492