Gut Microbiota Profile of Obese Diabetic Women Submitted to Roux-en-Y Gastric Bypass and Its Association with Food Intake and Postoperative Diabetes Remission

 , , , , , , , , ,
Abstract
1. Introduction
2. Materials and Methods
2.1. Ethical Issues
2.2. Patients
2.3. Metabolic Markers
2.4. T2D Remission
2.5. Anthropometric and Body Composition Variables
2.6. Food Intake
2.7. Microbiome Profiling
2.8. Bioinformatics and Statistical Analysis
3. Results
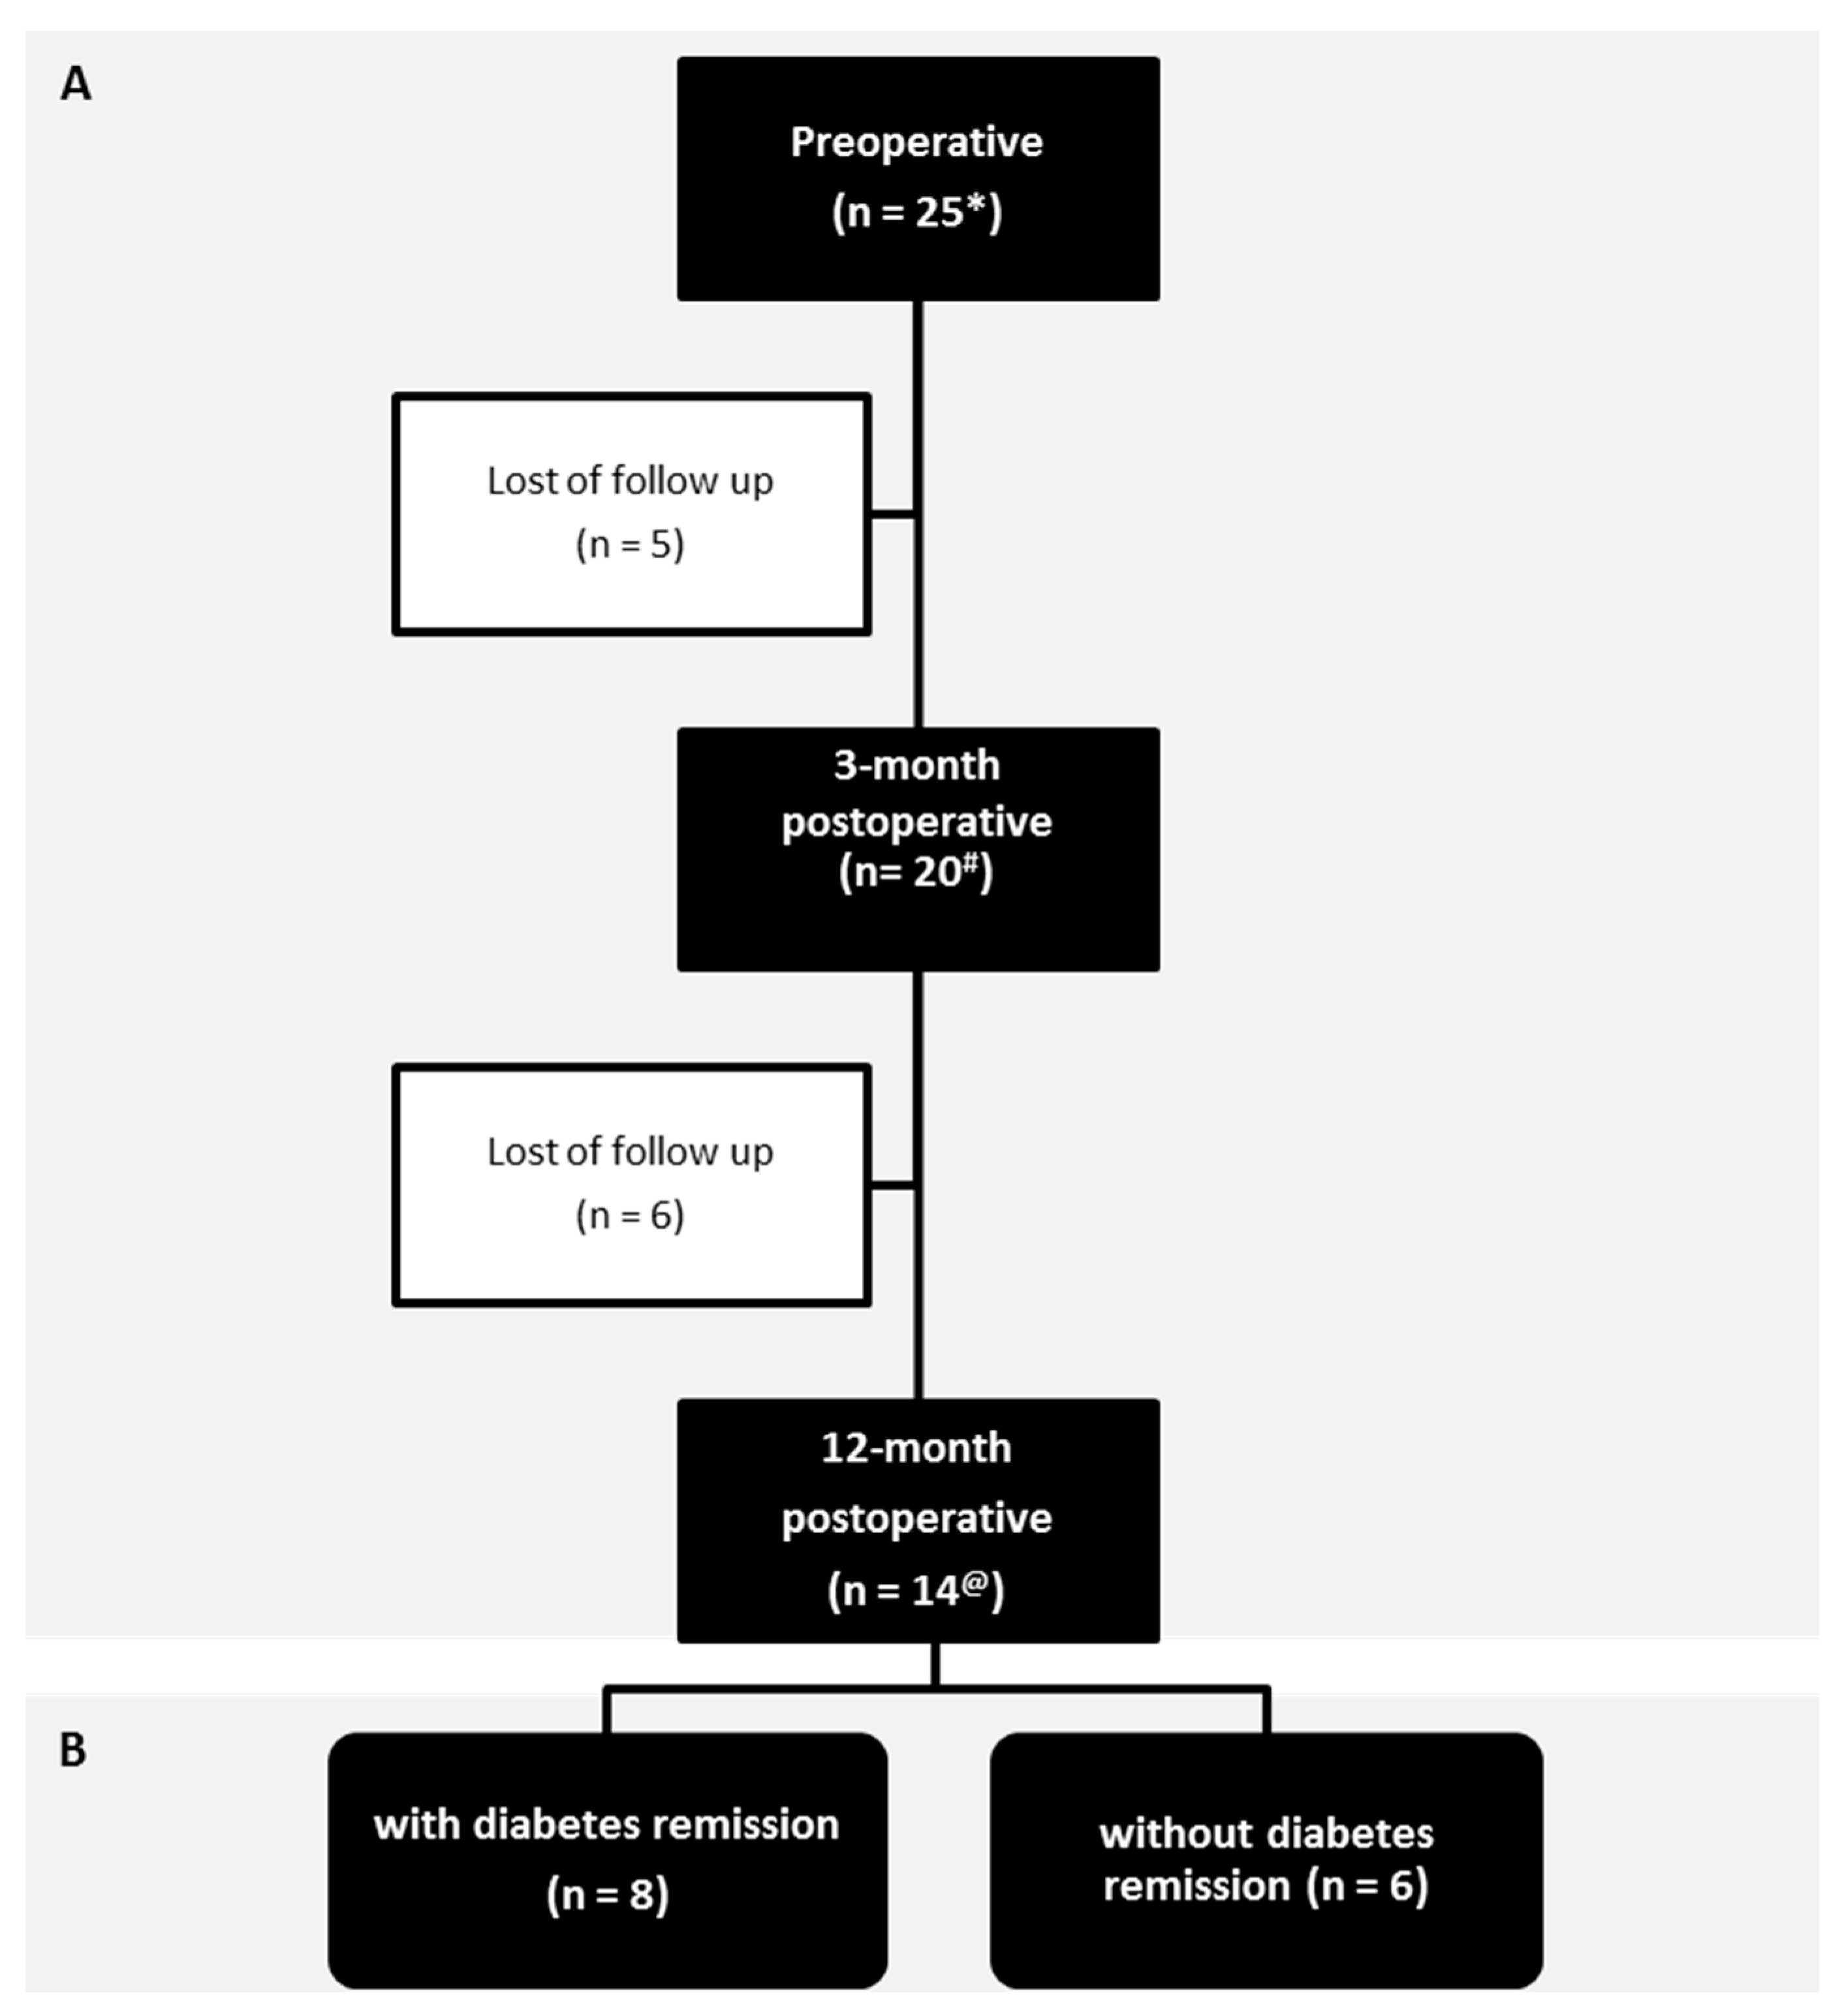
3.1. Patients
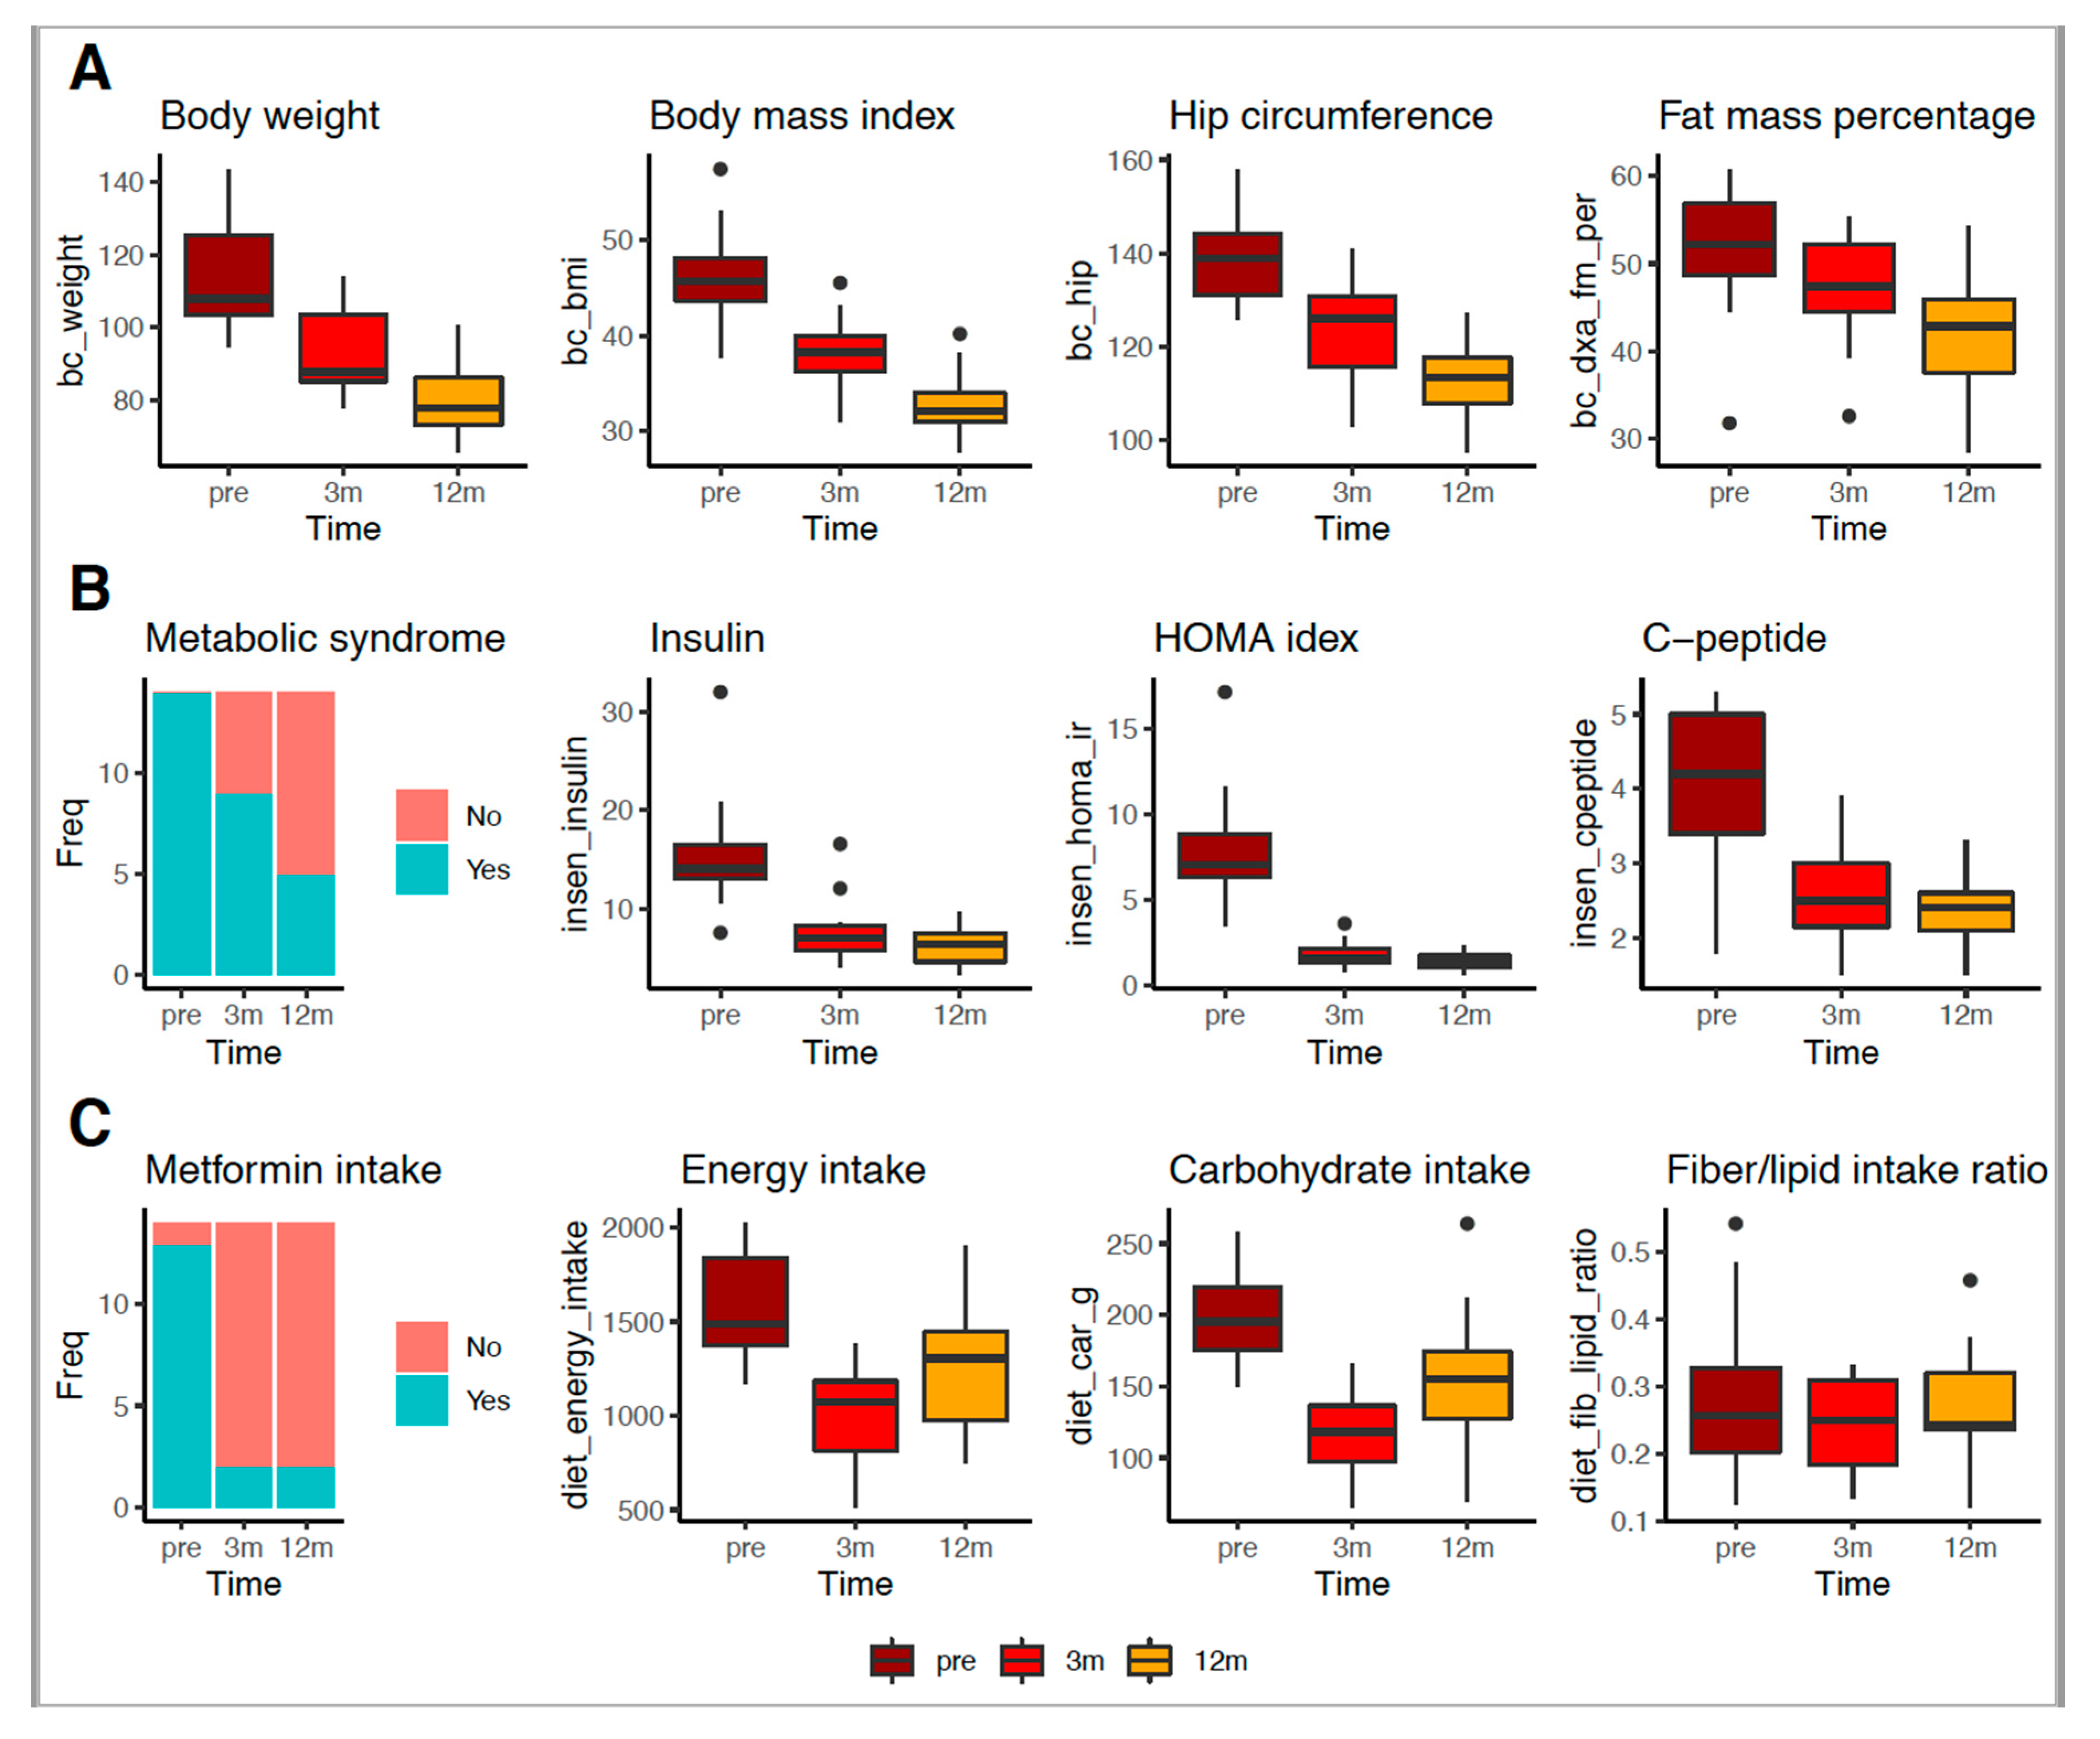
3.2. RYGB Surgery Improved Body, Metabolic and Food Intake Profiles
3.3. Patients with Total T2D Remission Displayed a Distinct Genus Signature Before RYGB Surgery
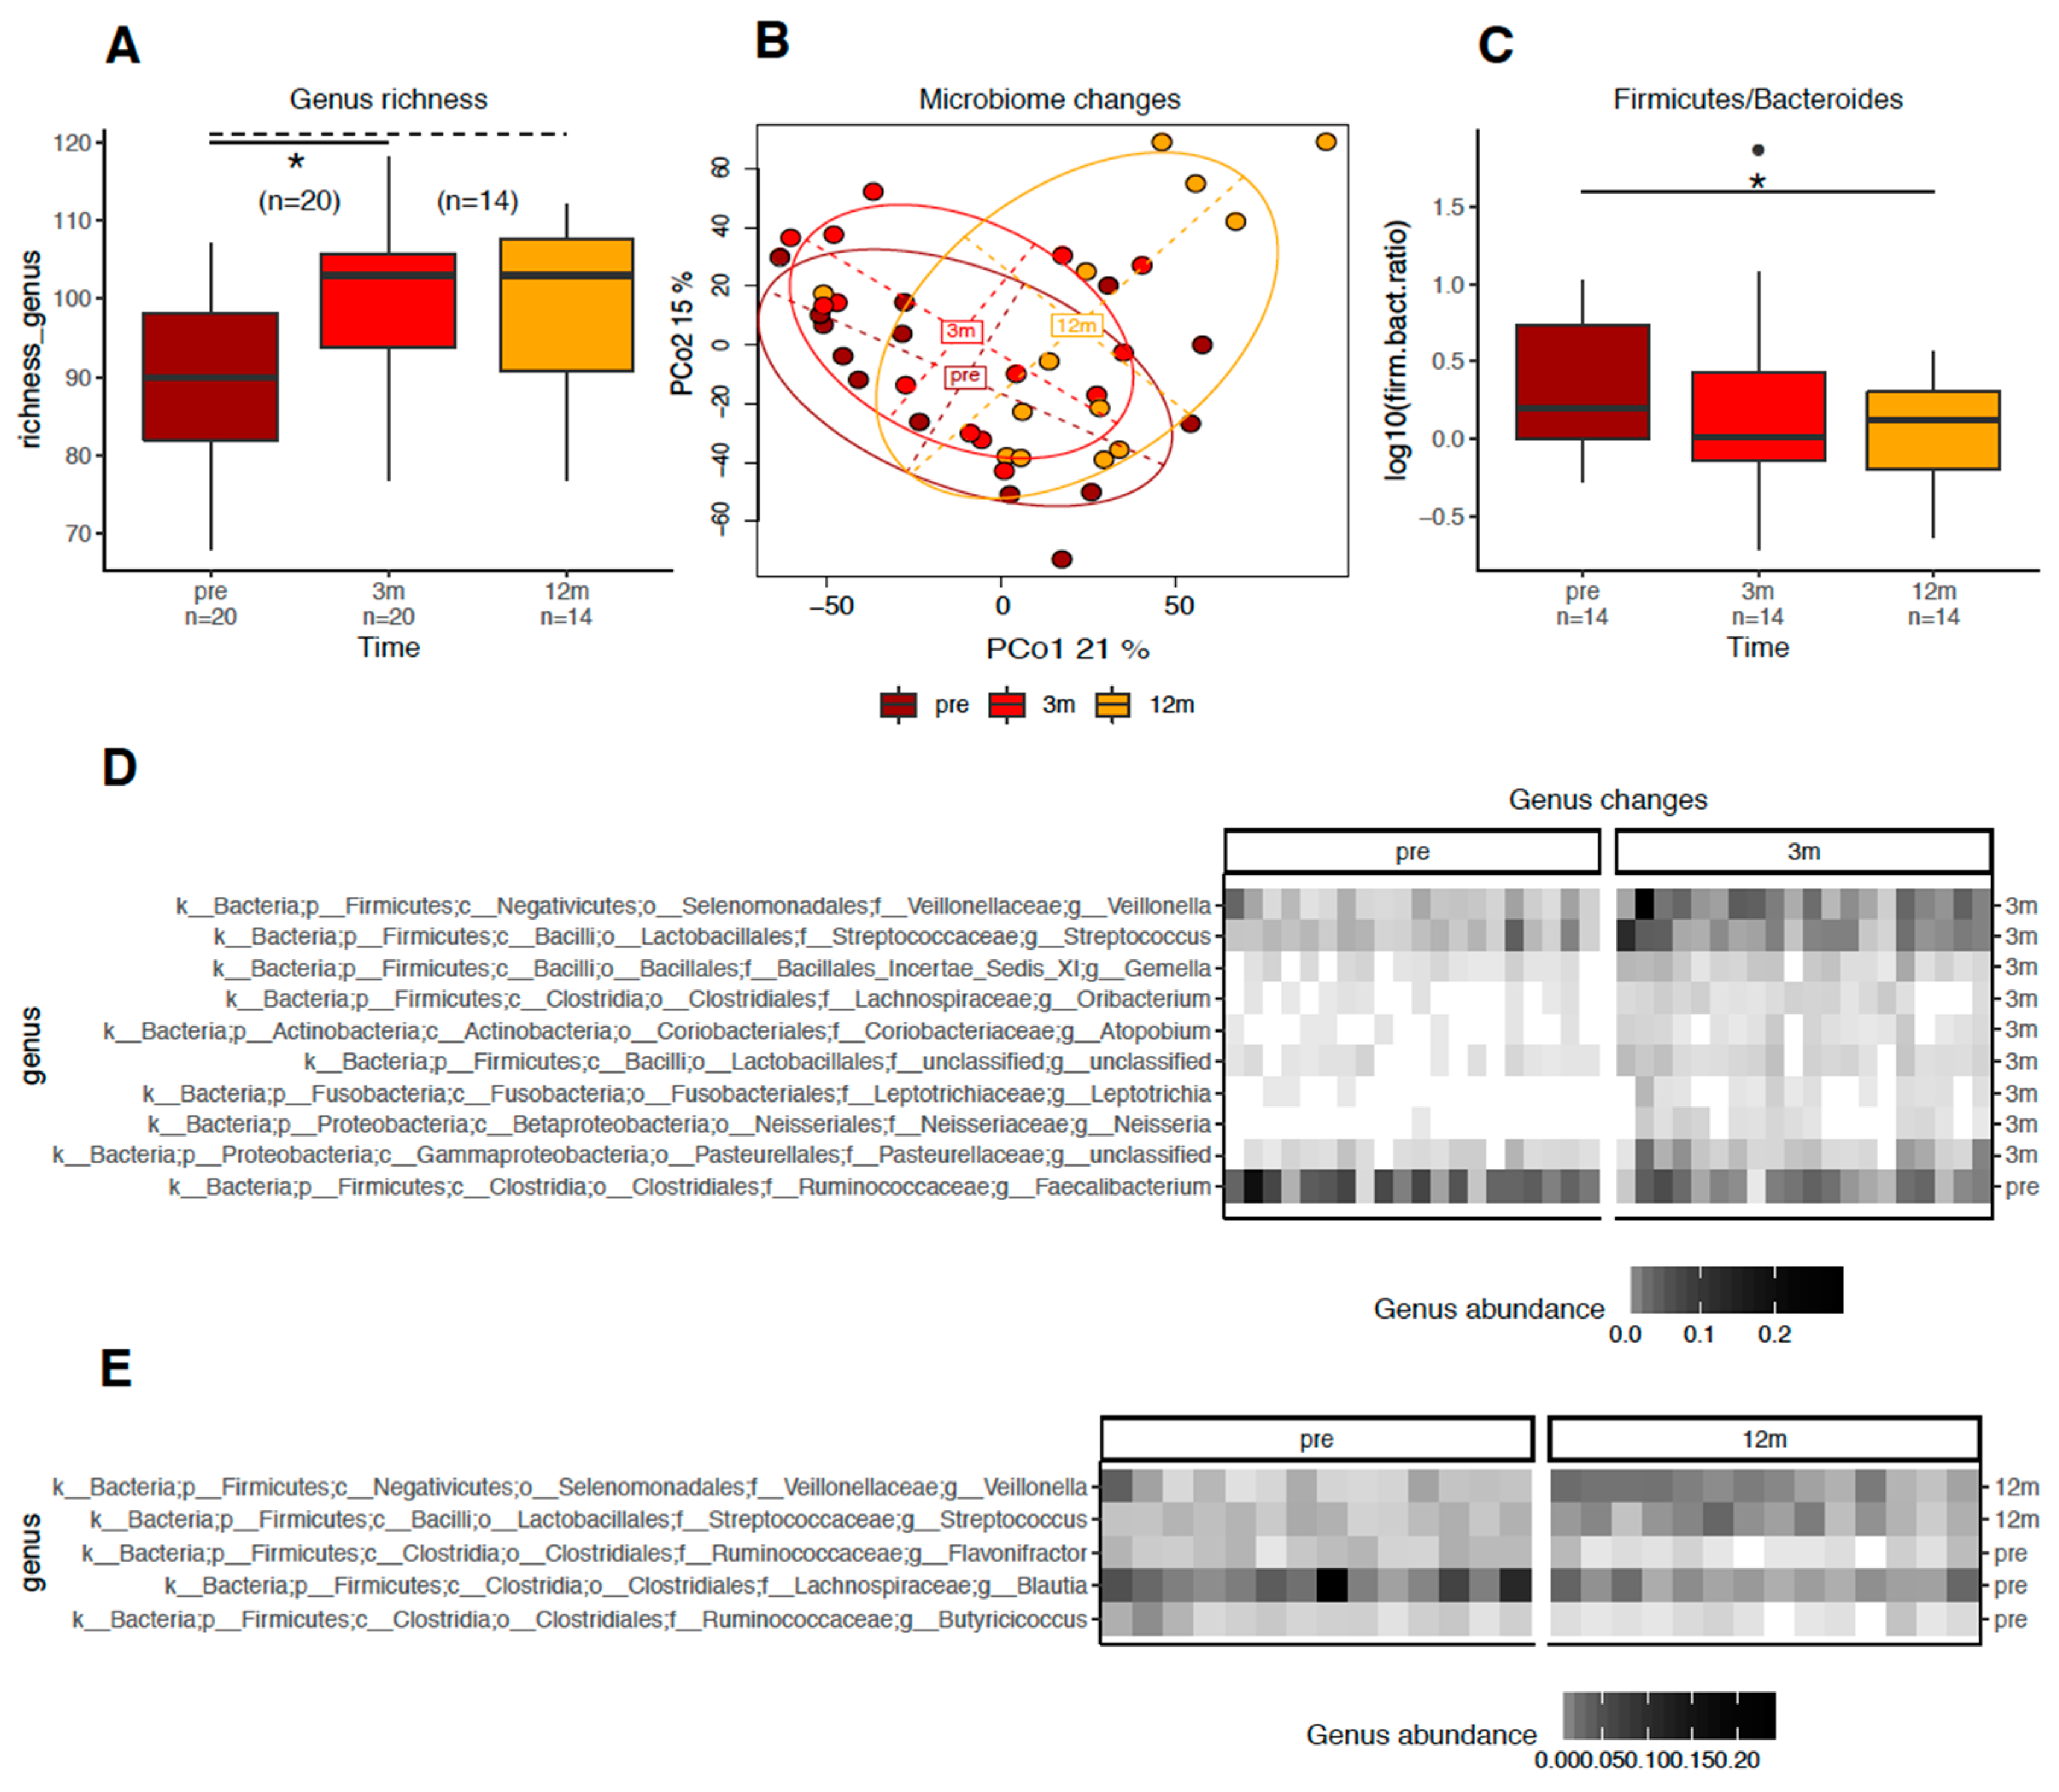
3.4. RYGB Surgery Was Associated with Changes in the Gut Bacteria Profile Regardless of Total T2D Remission
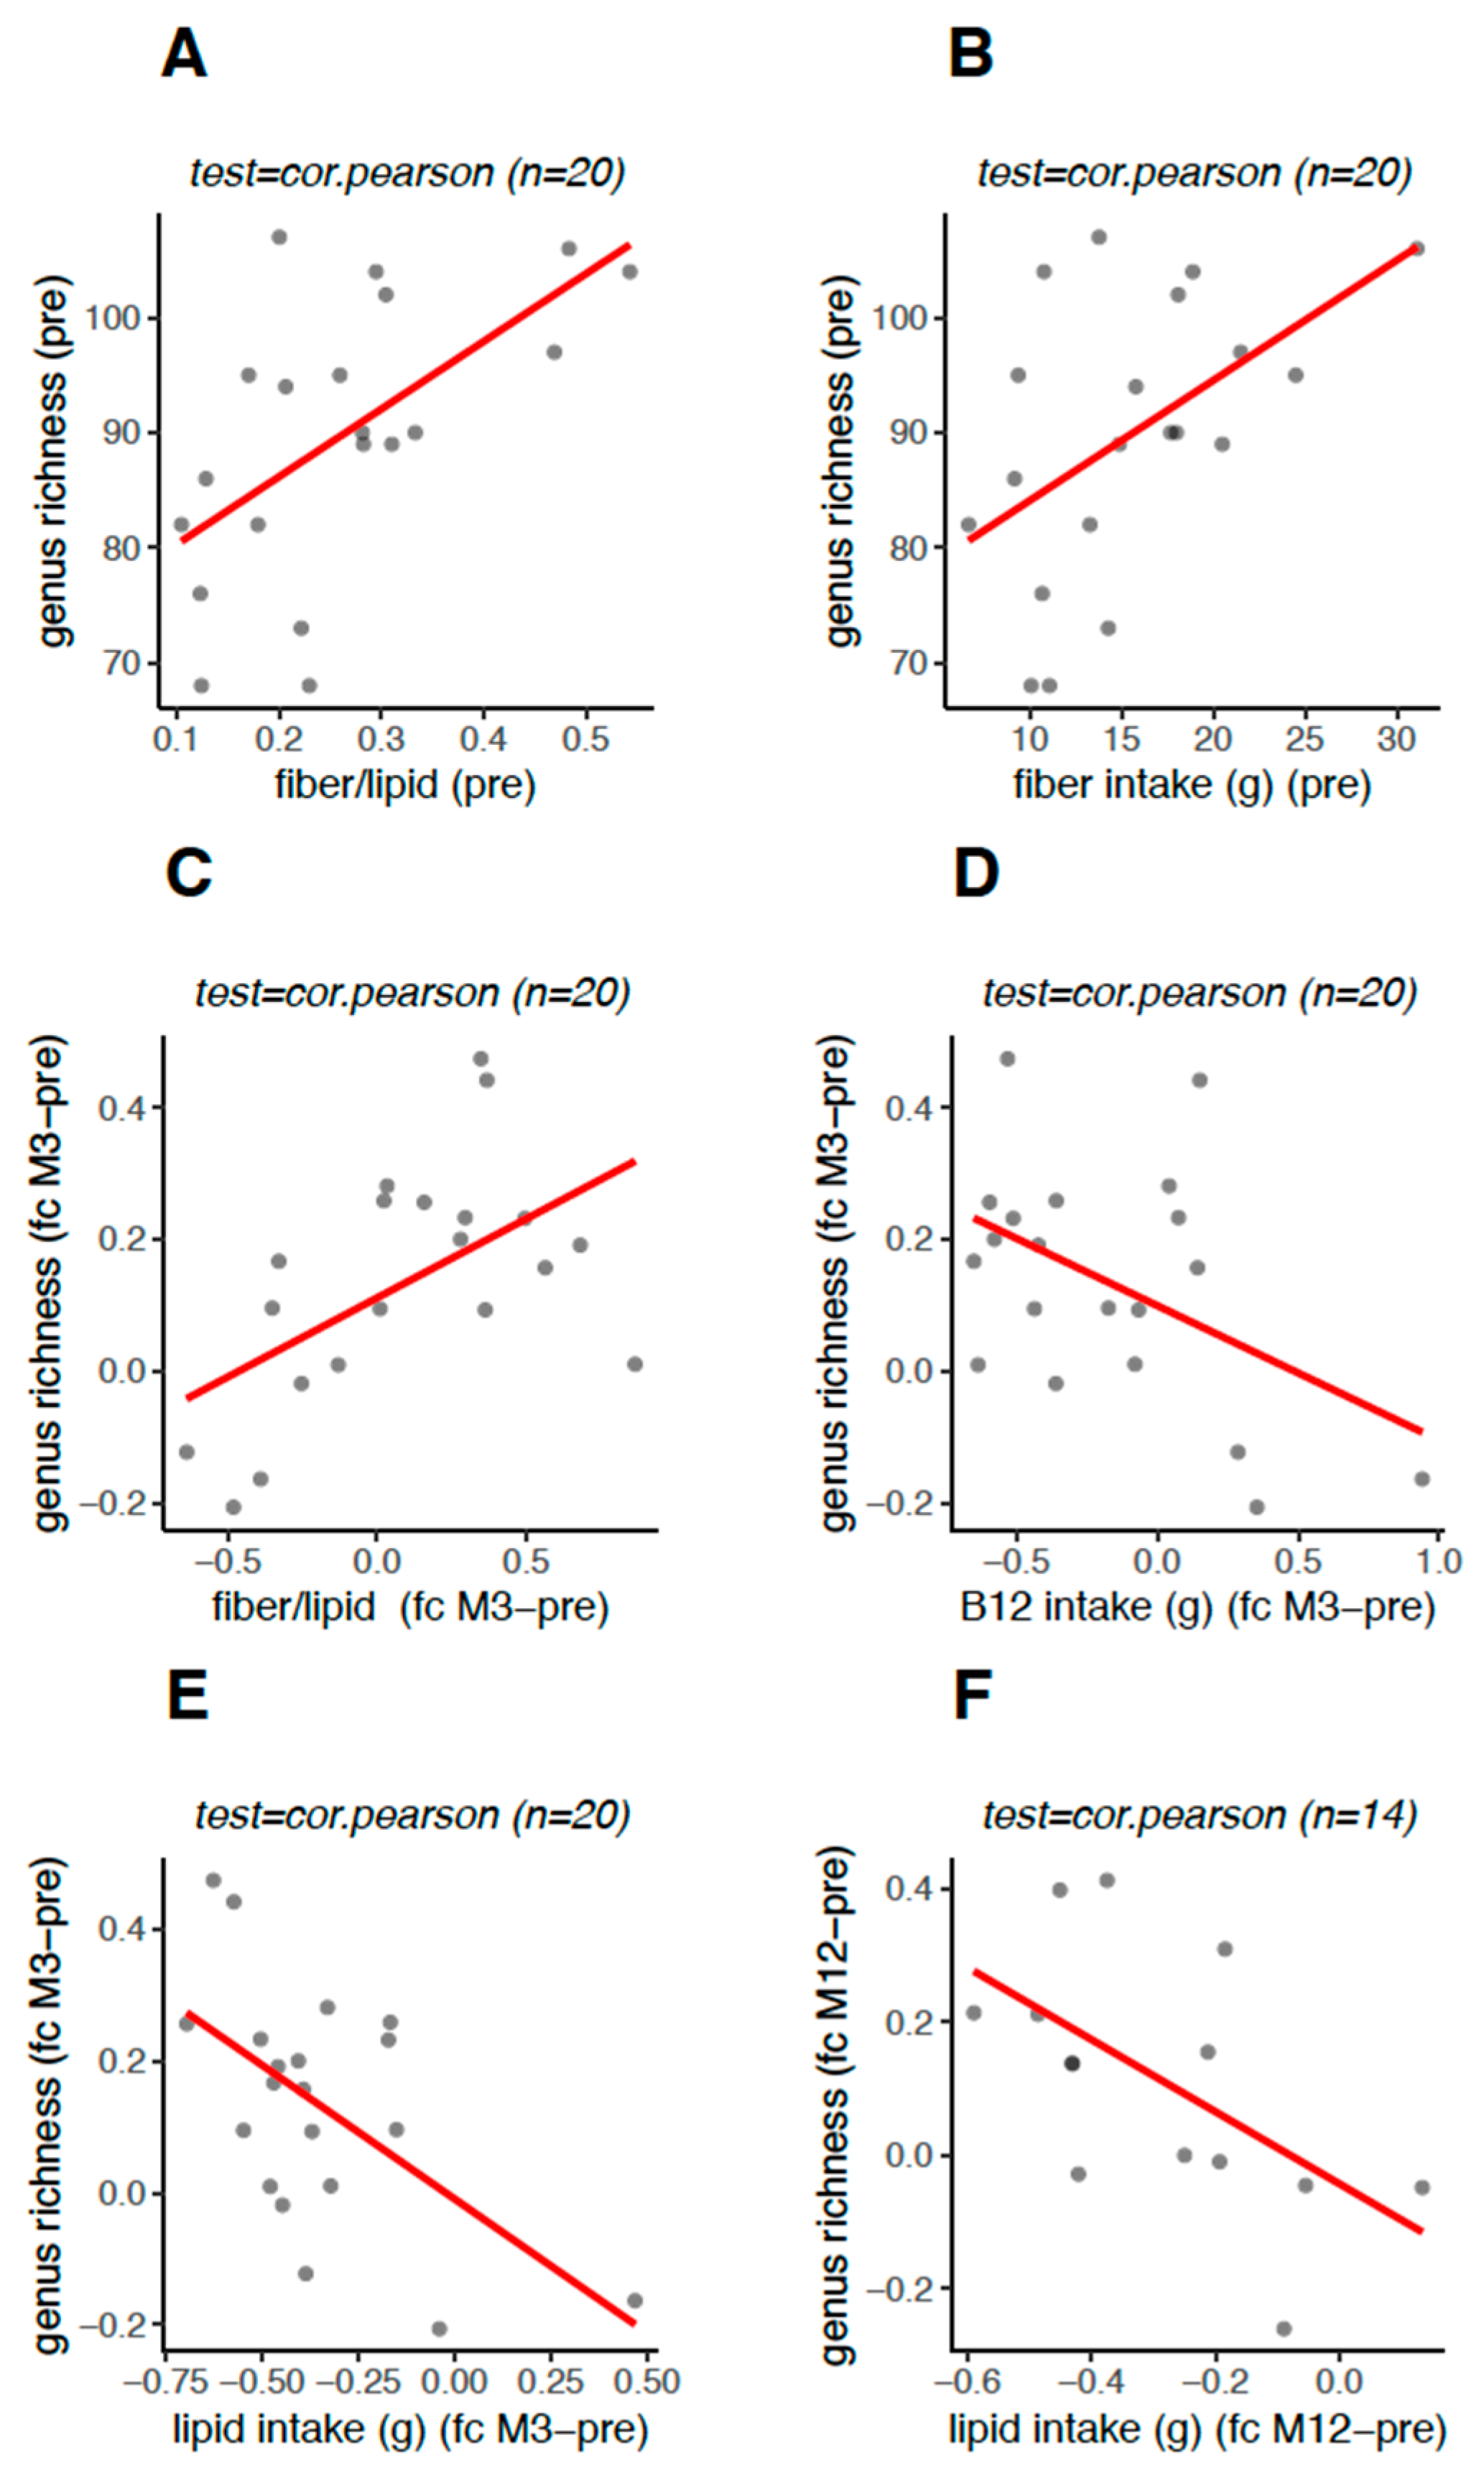
3.5. Genus Richness Was Associated with the Food Intake Profile
4. Discussion
5. Conclusions
Supplementary Materials
Author Contributions
Funding
Acknowledgments
Conflicts of Interest
Availability of Supporting Data
References
- Karlsson, F.H.; Tremaroli, V.; Nookaew, I.; Bergstrom, G.; Behre, C.J.; Fagerberg, B.; Nielsen, J.; Backhed, F. Gut metagenome in European women with normal; impaired and diabetic glucose control. Nature 2013, 498, 99–103. [Google Scholar] [CrossRef]
- Ley, R.E.; Turnbaugh, P.J.; Klein, S.; Gordon, J.I. Microbial ecology, human gut microbes associated with obesity. Nature 2006, 444, 1022–1023. [Google Scholar] [CrossRef] [PubMed]
- Qin, J.; Li, Y.; Cai, Z.; Li, S.; Zhu, J.; Zhang, F. A metagenome-wide association study of gut microbiota in type 2 diabetes. Nature 2012, 490, 55–60. [Google Scholar] [CrossRef] [PubMed]
- Ades, P.A.; Savage, P.D. Obesity in coronary heart disease, an unaddressed behavioral risk factor. Prev. Med. 2017, 104, 117–119. [Google Scholar] [CrossRef] [PubMed]
- Romieu, I.; Dossus, L.; Barquera, S.; Blottiere, H.M.; Franks, P.W.; Gunter, M.; Hwalla, N.; Hursting, S.D.; Leitzmann, M.; Maegetts, B.; et al. Energy balance and obesity, what are the main drivers? Cancer Causes Control 2017, 28, 247–258. [Google Scholar] [CrossRef] [PubMed]
- Turnbaugh, P.J.; Ridaura, V.K.; Faith, J.J.; Rey, F.E.; Knight, R.; Gordon, J.I. The effect of diet on the human gut microbiome, a metagenomic analysis in humanized gnotobiotic mice. Sci. Transl. Med. 2009, 1, 6ra14. [Google Scholar] [CrossRef]
- Tremaroli, V.; Backhed, F. Functional interactions between the gut microbiota and host metabolism. Nature 2012, 489, 242–249. [Google Scholar] [CrossRef]
- Martin, A.M.; Sun, E.W.; Rogers, G.B.; Keating, D.J. The Influence of the Gut Microbiome on Host Metabolism through the Regulation of Gut Hormone Release. Front. Physiol. 2019, 10, 428. [Google Scholar] [CrossRef]
- Turnbaugh, P.J.; Ley, R.E.; Mahowald, M.A.; Magrini, V.; Mardis, E.R.; Gordon, J.I. An obesity-associated gut microbiome with increased capacity for energy harvest. Nature 2006, 444, 1027–1031. [Google Scholar] [CrossRef]
- Le Chatelier, E.; Nielsen, T.; Qin, J.; Prifti, E.; Hildebrand, F.; Falony, G. Richness of human gut microbiome correlates with metabolic markers. Nature 2013, 500, 541–546. [Google Scholar] [CrossRef]
- Debédat, J.; Clément, K.; Aron-Wisnewsky, J. Gut microbiota dysbiosis in human obesity, impact of bariatric surgery. Curr. Obes. Rep. 2019, 8, 229–242. [Google Scholar] [CrossRef] [PubMed]
- Furet, J.P.; Kong, L.C.; Tap, J.; Poitou, C.; Basdevant, A.; Bouillot, J.L.; Mariat, D.; Corthier, G.; Doré, J.; Henegar, C.; et al. Differential adaptation of human gut microbiota to bariatric surgery-induced weight loss, links with metabolic and low-grade inflammation markers. Diabetes 2010, 59, 3049–3057. [Google Scholar] [CrossRef] [PubMed]
- Palleja, A.; Kashani, A.; Allin, K.H.; Nielsen, T.; Zhang, C.; Li, Y. Roux-en-Y gastric bypass surgery of morbidly obese patients induces swift and persistent changes of the individual gut microbiota. Genome Med. 2016, 8, 67. [Google Scholar] [CrossRef] [PubMed]
- Zhang, H.; DiBaise, J.K.; Zuccolo, A.; Kudrna, D.; Braidotti, M.; Yu, Y. Human gut microbiota in obesity and after gastric bypass. Proc. Natl. Acad. Sci. USA 2009, 106, 2365–2370. [Google Scholar] [CrossRef]
- Sjostrom, L.; Peltonen, M.; Jacobson, P.; Ahlin, S.; Andersson-Assarsson, J.; Anveden, A. Association of bariatric surgery with long-term remission of type 2 diabetes and with microvascular and macrovascular complications. JAMA 2014, 311, 2297–2304. [Google Scholar] [CrossRef]
- Busetto, L.; Dicker, D.; Azran, C.; Batterham, R.L.; Farpour-Lambert, N.; Fried, M. Practical Recommendations of the Obesity Management Task Force of the European Association for the Study of Obesity for the Post-Bariatric Surgery Medical Management. Obes. Facts 2017, 10, 597–632. [Google Scholar] [CrossRef]
- Kong, L.C.; Tap, J.; Aron-Wisnewsky, J.; Pelloux, V.; Basdevant, A.; Bouillot, J.L.; Zucker, J.D.; Doré, J.; Clément, K. Gut microbiota after gastric bypass in human obesity, increased richness and associations of bacterial genera with adipose tissue genes. Am. J. Clin. Nutr. 2013, 98, 16–24. [Google Scholar] [CrossRef]
- Graessler, J.; Qin, Y.; Zhong, H.; Zhang, J.; Licinio, J.; Wong, M.L. Metagenomic sequencing of the human gut microbiome before and after bariatric surgery in obese patients with type 2 diabetes, correlation with inflammatory and metabolic parameters. Pharmacogenom. J. 2013, 13, 514–522. [Google Scholar] [CrossRef]
- Li, J.V.; Ashrafian, H.; Bueter, M.; Kinross, J.; Sands, C.; le Roux, C.W. Metabolic surgery profoundly influences gut microbial-host metabolic cross-talk. Gut 2011, 60, 1214–1223. [Google Scholar] [CrossRef]
- Liou, A.P.; Paziuk, M.; Luevano, J.M., Jr.; Machineni, S.; Turnbaugh, P.J.; Kaplan, L.M. Conserved shifts in the gut microbiota due to gastric bypass reduce host weight and adiposity. Sci. Transl. Med. 2013, 5, 178ra41. [Google Scholar] [CrossRef]
- Peat, C.M.; Kleiman, S.C.; Bulik, C.M.; Carroll, I.M. The Intestinal Microbiome in Bariatric Surgery Patients. Eur. Eat. Disord. Rev. 2015, 23, 496–503. [Google Scholar] [CrossRef] [PubMed]
- Murphy, R.; Tsai, P.; Jullig, M.; Liu, A.; Plank, L.; Booth, M. Differential Changes in Gut Microbiota After Gastric Bypass and Sleeve Gastrectomy Bariatric Surgery Vary According to Diabetes Remission. Obes. Surg. 2017, 27, 917–925. [Google Scholar] [CrossRef] [PubMed]
- Healey, G.R.; Murphy, R.; Brough, L.; Butts, C.A.; Coad, J. Interindividual variability in gut microbiota and host response to dietary interventions. Nutr. Rev. 2017, 75, 1059–1080. [Google Scholar] [CrossRef] [PubMed]
- Sala, P.; Belarmino, G.; Machado, N.M.; Cardinelli, C.S.; Al Assal, K.; Silva, M.M.; Fonseca, D.C.; Ishida, R.K.; Santo, M.A.; de Moura, E.G.; et al. The SURMetaGIT study, Design and rationale for a prospective pan-omics examination of the gastrointestinal response to Roux-en-Y gastric bypass surgery. J. Int. Med. Res. 2016, 44, 1359–1375. [Google Scholar] [CrossRef]
- Alberti, K.G.; Zimmet, P.; Shaw, J. Group IDFETFC. The metabolic syndrome—A new worldwide definition. Lancet 2005, 366, 1059–1062. [Google Scholar] [CrossRef]
- Booth, H.; Khan, O.; Prevost, T.; Reddy, M.; Dregan, A.; Charlton, J. Incidence of type 2 diabetes after bariatric surgery, population-based matched cohort study. Lancet Diabetes Endocrinol. 2014, 2, 963–968. [Google Scholar] [CrossRef]
- Still, C.D.; Wood, G.C.; Benotti, P.; Petrick, A.T.; Gabrielsen, J.; Strodel, W.E. Preoperative prediction of type 2 diabetes remission after Roux-en-Y gastric bypass surgery, a retrospective cohort study. Lancet Diabetes Endocrinol 2014, 2, 38–45. [Google Scholar] [CrossRef]
- MAK. Avaliação nutricional. In Guia de Nutrição-Nutrição Clínica no Adulto; Cuppari, L., Ed.; Editora Manole 1 edição São Paulo Manole: São Paulo, Brazil, 2002. [Google Scholar]
- Callaway, C.W.; Bouchard, C.; Himes, J.H.; Lohman, T.G.; Martin, A.D. Circumferences. In Anthropometric Standardization Reference Manual. II; Logman, T.G., Roche, A.F., Seefeldt, V.C., Eds.; Human Kinetics Books: Champaign, IL, USA, 1988. [Google Scholar]
- JPM. Consumo Alimentar–Visualizando Porções–Série Nutrição e Metabolismo; Guanabara Koogan: Rio de Janeiro, Brazil, 2007. [Google Scholar]
- Silva, M.M.; Sala, P.C.; Cardinelli, C.S.; Torrinhas, R.S.; Waitzberg, D.L. Comparison of Virtual Nutri Plus® and Dietpro 5i® software systems for the assessment of nutrient intake before and after Roux-en-Y gastric bypass. Clinics 2014, 69, 714–722. [Google Scholar] [CrossRef]
- (NEPA). NdEePeA. TACO-Tabela Brasileira de Composição de Alimentos; UNICAMP: Campinas, Brazil, 2011. [Google Scholar]
- STP. Tabela de Composição de Alimentos, Suporte para Decisão Nutricional; São Paulo Manole: Barueri, SP, Brazil, 2002. [Google Scholar]
- Kozich, J.J.; Westcott, S.L.; Baxter, N.T.; Highlander, S.K.; Schloss, P.D. Development of a dual-index sequencing strategy and curation pipeline for analyzing amplicon sequence data on the MiSeq Illumina sequencing platform. Appl. Environ. Microbiol. 2013, 79, 5112–5120. [Google Scholar] [CrossRef]
- Schloss, P.D.; Westcott, S.L.; Ryabin, T.; Hall, J.R.; Hartmann, M.; Hollister, E.B. Introducing mothur, open-source; platform-independent; community-supported software for describing and comparing microbial communities. Appl. Environ. Microbiol. 2009, 75, 7537–7541. [Google Scholar] [CrossRef]
- Schloss, P.D.; Gevers, D.; Westcott, S.L. Reducing the effects of PCR amplification and sequencing artifacts on 16S rRNA-based studies. PLoS ONE 2011, 6, e27310. [Google Scholar] [CrossRef] [PubMed]
- Edgar, R.C.; Haas, B.J.; Clemente, J.C.; Quince, C.; Knight, R. UCHIME improves sensitivity and speed of chimera detection. Bioinformatics 2011, 27, 2194–2200. [Google Scholar] [CrossRef] [PubMed]
- Prifti, E.; Chatelier, E.L. MetaOMineR. A Quantitative Metagenomics Data Analyses Pipeline 1.0. 2014. Available online: https//cran.r-project.org/web/packages/momr/index.html (accessed on 13 December 2019).
- Ahlqvist, E.; Storm, P.; Käräjämäki, A.; Martinell, M.; Dorkhan, M.; Carlsson, A.; Vikman, P.; Prasad, R.B.; Aly, D.M.; Almgren, P.; et al. Novel subgroups of adult-onset diabetes and their association with outcomes, a data-driven cluster analysis of six variables. Lancet Diabetes Endocrinol. 2018, 6, 361–369. [Google Scholar] [CrossRef]
- Weglarz, L.; Dzierzewicz, Z.; Skop, B.; Orchel, A.; Parfiniewicz, B.; Wiśniowska, B.; Swiatkowska, L.; Wilczok, T. Desulfovibrio desulfuricans lipopolysaccharides induce endothelial cell IL-6 and IL-8 secretion and E-selectin and VCAM-1 expression. Cell. Mol. Biol. Lett. 2003, 8, 991–1003. [Google Scholar] [PubMed]
- Kushkevych, I.; Dordevic, D.; Kollar, P.; Vítězová, M.; Drago, L. Hydrogen sulfide as toxic product in the small-large intestine axis and its role in IBD development. J. Clin. Med. 2019, 8, 1054. [Google Scholar] [CrossRef] [PubMed]
- Cani, P.D.; Bibiloni, R.; Knauf, C.; Waget, A.; Neyrinck, A.M.; Delzenne, N.M.; Burcelin, R. Changes in gut microbiota control metabolic endotoxemia-induced inflammation in high-fat diet-induced obesity and diabetes in mice. Diabetes 2008, 57, 1470–1481. [Google Scholar] [CrossRef]
- Bleau, C.; Karelis, A.D.; St-Pierre, D.H.; Lamontagne, L. Crosstalk between intestinal microbiota.; adipose tissue and skeletal muscle as an early event in systemic low-grade inflammation and the development of obesity and diabetes. Diabetes Metab. Res. Rev. 2015, 31, 545–561. [Google Scholar] [CrossRef]
- Crusell, M.; Hansen, T.; Nielsen, T.; Allin, K.H.; Rühlemann, M.C.; Damm, P.; Vestergaard, H.; Rørbye, C.; Jørgensen, N.R.; Christiansen, O.B.; et al. Gestational diabetes is associated with change in the gut microbiota composition in third trimester of pregnancy and postpartum. Microbiome 2018, 6, 89. [Google Scholar] [CrossRef]
- Ferguson, L.R. Meat consumption, cancer risk and population groups within New Zealand. Mutat. Res. 2002, 506, 215–224. [Google Scholar] [CrossRef]
- Van Hul, M.; Geurts, L.; Plovier, H.; Druart, C.; Everard, A.; Stahlman, M. Reduced obesity.; diabetes and steatosis upon cinnamon and grape pomace are associated with changes in gut microbiota and markers of gut barrier. Am. J. Physiol. Endocrinol. Metabol. 2017, 314, E334–E352. [Google Scholar] [CrossRef]
- Tap, J.; Furet, J.P.; Bensaada, M.; Philippe, C.; Roth, H.; Rabot, S. Gut microbiota richness promotes its stability upon increased dietary fibre intake in healthy adults. Environ. Microbiol. 2015, 17, 4954–4964. [Google Scholar] [CrossRef] [PubMed]
- Kapoor, N.; Al-Najim, W.; le Roux, C.W.; Docherty, N.G. Shifts in Food Preferences after Bariatric Surgery, Observational Reports and Proposed Mechanisms. Curr. Obes. Rep. 2017, 6, 246–252. [Google Scholar] [CrossRef] [PubMed]
- Tremaroli, V.; Karlsson, F.; Werling, M.; Stahlman, M.; Kovatcheva-Datchary, P.; Olbers, T. Roux-en-Y Gastric Bypass and Vertical Banded Gastroplasty Induce Long-Term Changes on the Human Gut Microbiome Contributing to Fat Mass Regulation. Cell Metab. 2015, 22, 228–238. [Google Scholar] [CrossRef] [PubMed]
- Medina, D.A.; Pedreros, J.P.; Turiel, D.; Quezada, N.; Pimentel, F.; Escalona, A. Distinct patterns in the gut microbiota after surgical or medical therapy in obese patients. PeerJ 2017, 5, e3443. [Google Scholar] [CrossRef] [PubMed]
- Duncan, S.H.; Louis, P.; Thomson, J.M.; Flint, H.J. The role of pH in determining the species composition of the human colonic microbiota. Environ. Microbiol. 2009, 11, 2112–2122. [Google Scholar] [CrossRef]
- Carvalho, B.M.; Guadagnini, D.; Tsukumo, D.M.L.; Schenka, A.A.; Latuf-Filho, P.; Vassallo, J. Modulation of gut microbiota by antibiotics improves insulin signalling in high-fat fed mice. Diabetologia 2012, 55, 2823–2834. [Google Scholar] [CrossRef]
- Heinsen, F.A.; Fangmann, D.; Muller, N.; Schulte, D.M.; Ruhlemann, M.C.; Turk, K. Beneficial Effects of a Dietary Weight Loss Intervention on Human Gut Microbiome Diversity and Metabolism Are Not Sustained during Weight Maintenance. Obes. Facts 2016, 9, 379–391. [Google Scholar] [CrossRef]
- Lloyd-Price, J.; Mahurkar, A.; Rahnavard, G.; Crabtree, J.; Orvis, J.; Hall, A.B. Strains.; functions and dynamics in the expanded Human Microbiome Project. Nature 2017, 550, 61–66. [Google Scholar] [CrossRef]
- Aron-Wisnewsky, J.; Prifti, E.; Belda, E.; Ichou, F.; Kayser, B.D.; Dao, M.C.; Verger, E.O.; Hedjazi, L.; Bouillot, J.L.; Chevallier, J.M.; et al. Major microbiota dysbiosis in severe obesity;fate after bariatric surgery. Gut 2019, 68, 70–82. [Google Scholar] [CrossRef]
- Haro, C.; Rangel-Zuniga, O.A.; Alcala-Diaz, J.F.; Gomez-Delgado, F.; Perez-Martinez, P.; Delgado-Lista, J. Intestinal Microbiota Is Influenced by gender and body mass index. PLoS ONE 2016, 11, e0154090. [Google Scholar] [CrossRef]


| Variable | Preoperative | 3-Month Postoperative | 12-Month Postoperative | p Value * | p Value # | p Value @ |
|---|---|---|---|---|---|---|
| BMI (kg/m2) | 46.40 ± 5.48 | 38.20 ± 4.13 | 32.70 ± 3.54 | <0.001 | <0.001 | <0.001 |
| Body weight (kg) | 115.00 ± 15.40 | 94.50 ± 12.80 | 81.20 ± 11.10 | <0.001 | <0.001 | <0.050 |
| FM by DXA (%) | 51.80 ± 6.81 | 46.50 ± 6.54 | 41.50 ± 6.72 | <0.050 | <0.001 | <0.050 |
| WC (cm) | 128.00 ± 13.10 | 112.00 ± 12.10 | 103.00 ± 11.50 | <0.001 | <0.001 | <0.050 |
| HC (cm) | 138.00 ± 12.10 | 124.00 ± 10.70 | 113.00 ± 7.97 | <0.001 | <0.001 | <0.050 |
| WC:HC ratio (cm) | 0.93 ± 0.09 | 0.91 ± 0.07 | 0.91 ± 0.05 | 0.180 | 0.230 | 0.990 |
| SBP (mmHg) | 156.00 ± 30.60 | 139.00 ± 18.20 | 138.00 ± 20.70 | 0.063 | 0.079 | 0.940 |
| DBP (mmHg) | 102.00 ± 22.90 | 90.00 ± 12.50 | 90.90 ± 15.00 | 0.130 | 0.130 | 0.960 |
| HDL (mg/dL) | 44.00 ± 9.89 | 42.90 ± 10.20 | 53.40 ± 12.90 | 0.710 | <0.050 | <0.050 |
| LDL (mg/dL) | 119.00 ± 31.20 | 92.10 ± 29.60 | 85.00 ± 18.70 | <0.050 | <0.001 | 0.990 |
| VLDL (mg/dL) | 28.00 ± 8.17 | 21.60 ± 7.98 | 16.90 ± 2.96 | <0.050 | <0.001 | <0.050 |
| TC (mg/dL) | 191.00 ± 33.10 | 157.00 ± 36.90 | 155.00 ± 20.00 | <0.001 | <0.001 | 0.430 |
| Triglyc. (mg/dL) | 164.00 ± 96.10 | 109.00 ± 40.10 | 83.90 ± 14.60 | <0.050 | <0.001 | <0.050 |
| Hyperchol. (%) | 52.00 | 20.00 | 7.10 | <0.050 | <0.050 | 0.380 |
| Hypertrigl. (%) | 76.00 | 15.00 | 7.10 | <0.001 | <0.001 | 0.630 |
| MetS (%) | 100.00 | 70.00 | 36.00 | <0.05 | <0.001 | 0.080 |
| C peptide (ng/mL) | 4.05 ± 1.42 | 2.68 ± 0.60 | 2.32 ± 0.51 | <0.050 | <0.001 | 0.130 |
| FG (mg/dL) | 225.00 ± 74.00 | 104.00 ± 25.00 | 92.90 ± 16.00 | <0.001 | <0.001 | 0.300 |
| A1c (%) | 9.14 ± 1.70 | 6.17 ± 0.50 | 5.74 ± 0.54 | <0.001 | <0.001 | 0.074 |
| FI (mUI/L) | 21.80 ± 15.90 | 8.74 ± 3.96 | 6.16 ± 1.95 | <0.001 | <0.001 | 0.120 |
| HOMA-IR (%) | 11.40 ± 9.77 | 2.19 ± 1.34 | 1.40 ± 0.47 | <0.001 | <0.001 | 0.085 |
| Metformin use (%) | 84.00 | 10.00 | 14.00 | <0.001 | <0.001 | 1.000 |
| Energy (kcal/day) | 1700.00 ± 462.00 | 957.00 ± 226.00 | 1280.00 ± 356.00 | <0.001 | <0.050 | <0.050 |
| Protein (g/day) | 71.80 ± 18.70 | 48.30 ± 14.10 | 61.20 ± 17.40 | <0.001 | 0.170 | <0.050 |
| Carbohydrate (g/day) | 213.00 ± 51.50 | 107.00 ± 30.80 | 157.00 ± 47.8 | <0.001 | <0.050 | <0.001 |
| Fat (g/day) | 64.50 ± 22.20 | 38.60 ± 10.3 | 39.80 ± 8.46 | <0.001 | <0.001 | 0.780 |
| Saturated fat (g/day) | 18.50 ± 7.59 | 11.30 ± 3.94 | 11.60 ± 1.63 | <0.050 | <0.001 | 0.960 |
| MUF (g/day) | 17.60 ± 6.68 | 9.80 ± 3.41 | 10.10 ± 2.98 | <0.001 | <0.050 | 0.560 |
| PUF (g/day) | 12.40 ± 3.30 | 8.27 ± 2.17 | 6.22 ± 1.10 | <0.001 | <0.001 | <0.050 |
| Fiber (g/day) | 15.50 ± 5.95 | 9.61 ± 3.84 | 10.70 ± 3.05 | <0.050 | <0.050 | 0.290 |
| IF (g/day) | 3.69 ± 1.37 | 2.47 ± 1.13 | 2.83 ± 1.09 | <0.050 | <0.064 | 0.310 |
| SF (g/day) | 2.43 ± 1.43 | 1.37 ± 0.73 | 1.69 ± 0.79 | <0.001 | <0.059 | 0.180 |
| F:L ratio (g/day) | 0.26 ± 0.12 | 0.25 ± 0.09 | 0.27 ± 0.08 | 0.860 | 0.460 | 0.620 |
| B12 (mcg/day) | 0.89 ± 0.21 | 0.71 ± 0.32 | 0.82 ± 0.46 | 0.053 | 0.064 | 0.850 |
© 2020 by the authors. Licensee MDPI, Basel, Switzerland. This article is an open access article distributed under the terms and conditions of the Creative Commons Attribution (CC BY) license (http://creativecommons.org/licenses/by/4.0/).
Share and Cite
Al Assal, K.; Prifti, E.; Belda, E.; Sala, P.; Clément, K.; Dao, M.-C.; Doré, J.; Levenez, F.; Taddei, C.R.; Fonseca, D.C.; et al. Gut Microbiota Profile of Obese Diabetic Women Submitted to Roux-en-Y Gastric Bypass and Its Association with Food Intake and Postoperative Diabetes Remission. Nutrients 2020, 12, 278. https://doi.org/10.3390/nu12020278
Al Assal K, Prifti E, Belda E, Sala P, Clément K, Dao M-C, Doré J, Levenez F, Taddei CR, Fonseca DC, et al. Gut Microbiota Profile of Obese Diabetic Women Submitted to Roux-en-Y Gastric Bypass and Its Association with Food Intake and Postoperative Diabetes Remission. Nutrients. 2020; 12(2):278. https://doi.org/10.3390/nu12020278
Chicago/Turabian StyleAl Assal, Karina, Edi Prifti, Eugeni Belda, Priscila Sala, Karine Clément, Maria-Carlota Dao, Joel Doré, Florence Levenez, Carla R. Taddei, Danielle Cristina Fonseca, and et al. 2020. "Gut Microbiota Profile of Obese Diabetic Women Submitted to Roux-en-Y Gastric Bypass and Its Association with Food Intake and Postoperative Diabetes Remission" Nutrients 12, no. 2: 278. https://doi.org/10.3390/nu12020278
APA StyleAl Assal, K., Prifti, E., Belda, E., Sala, P., Clément, K., Dao, M.-C., Doré, J., Levenez, F., Taddei, C. R., Fonseca, D. C., Rocha, I. M., Balmant, B. D., Thomas, A. M., Santo, M. A., Dias-Neto, E., Setubal, J. C., Zucker, J.-D., Belarmino, G., Torrinhas, R. S., & Waitzberg, D. L. (2020). Gut Microbiota Profile of Obese Diabetic Women Submitted to Roux-en-Y Gastric Bypass and Its Association with Food Intake and Postoperative Diabetes Remission. Nutrients, 12(2), 278. https://doi.org/10.3390/nu12020278