Evaluation of Vitamin D Metabolism in Patients with Type 1 Diabetes Mellitus in the Setting of Cholecalciferol Treatment

 , , , ,
Abstract
1. Introduction
2. Materials and Methods
2.1. Study Population and Design
2.2. Sociodemographic and Anthropometric Data Collection
2.3. Laboratory Measurements
2.4. Statistical Analysis
3. Results
3.1. Baseline Laboratory Evaluation
3.2. Laboratory Evaluation after Intake of Cholecalciferol
3.2.1. Biochemical Parameters, PTH and DBP
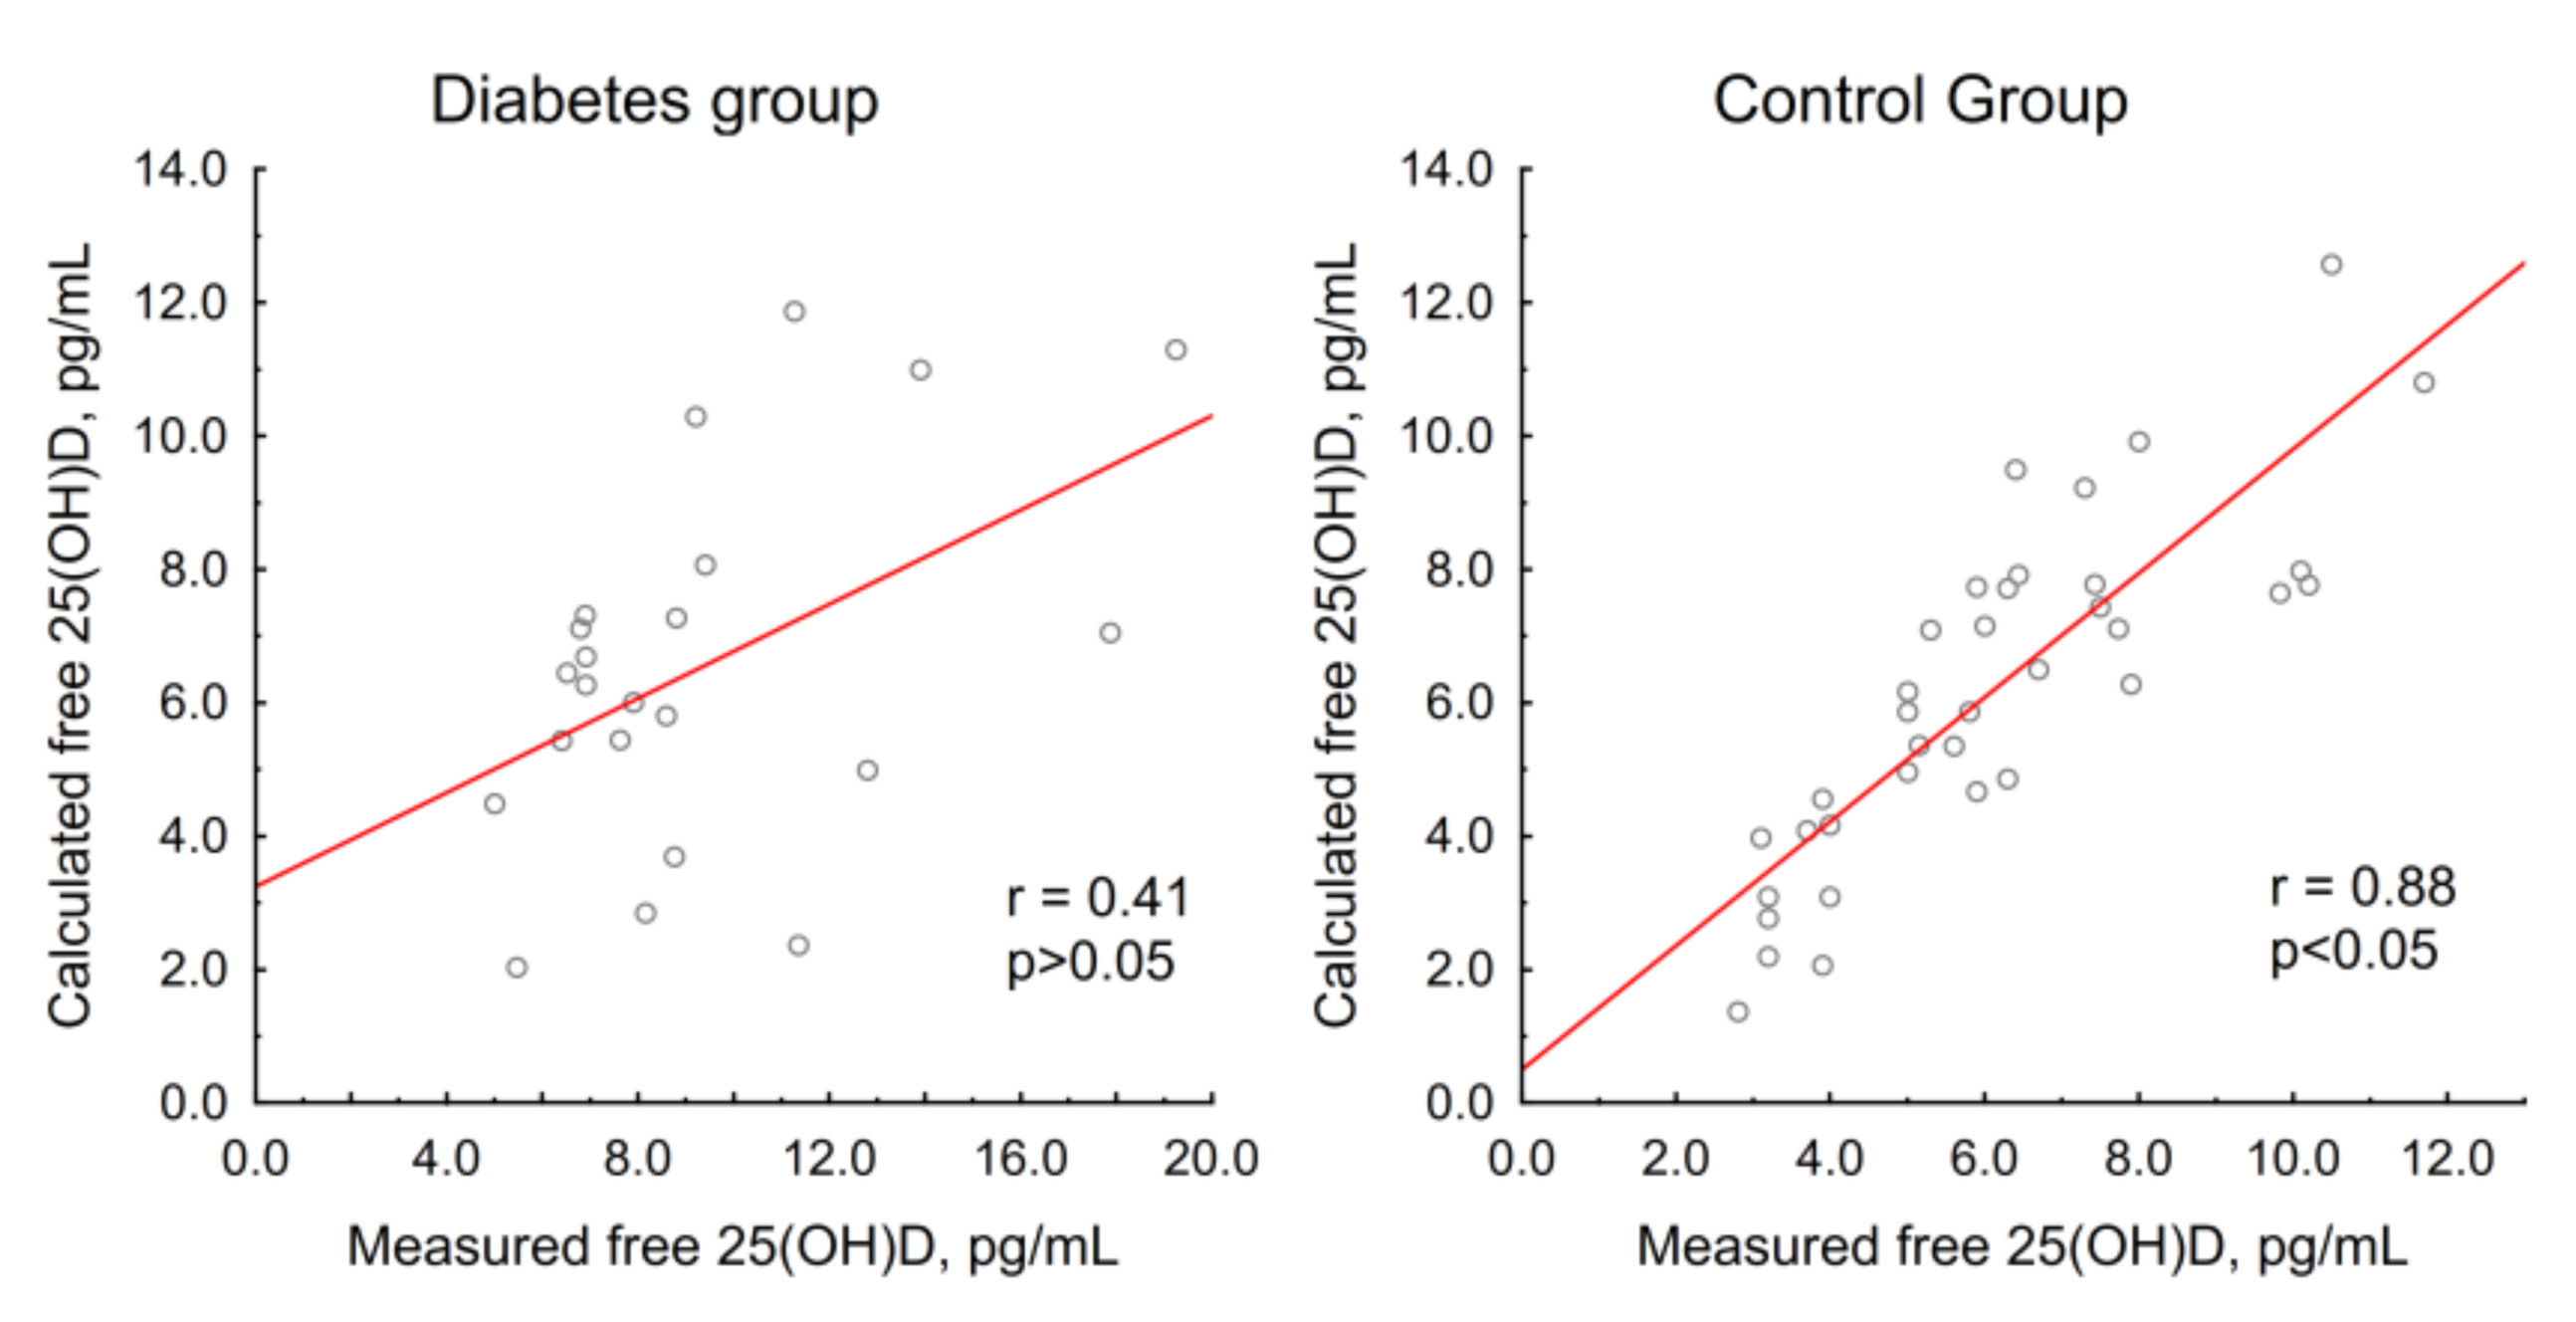
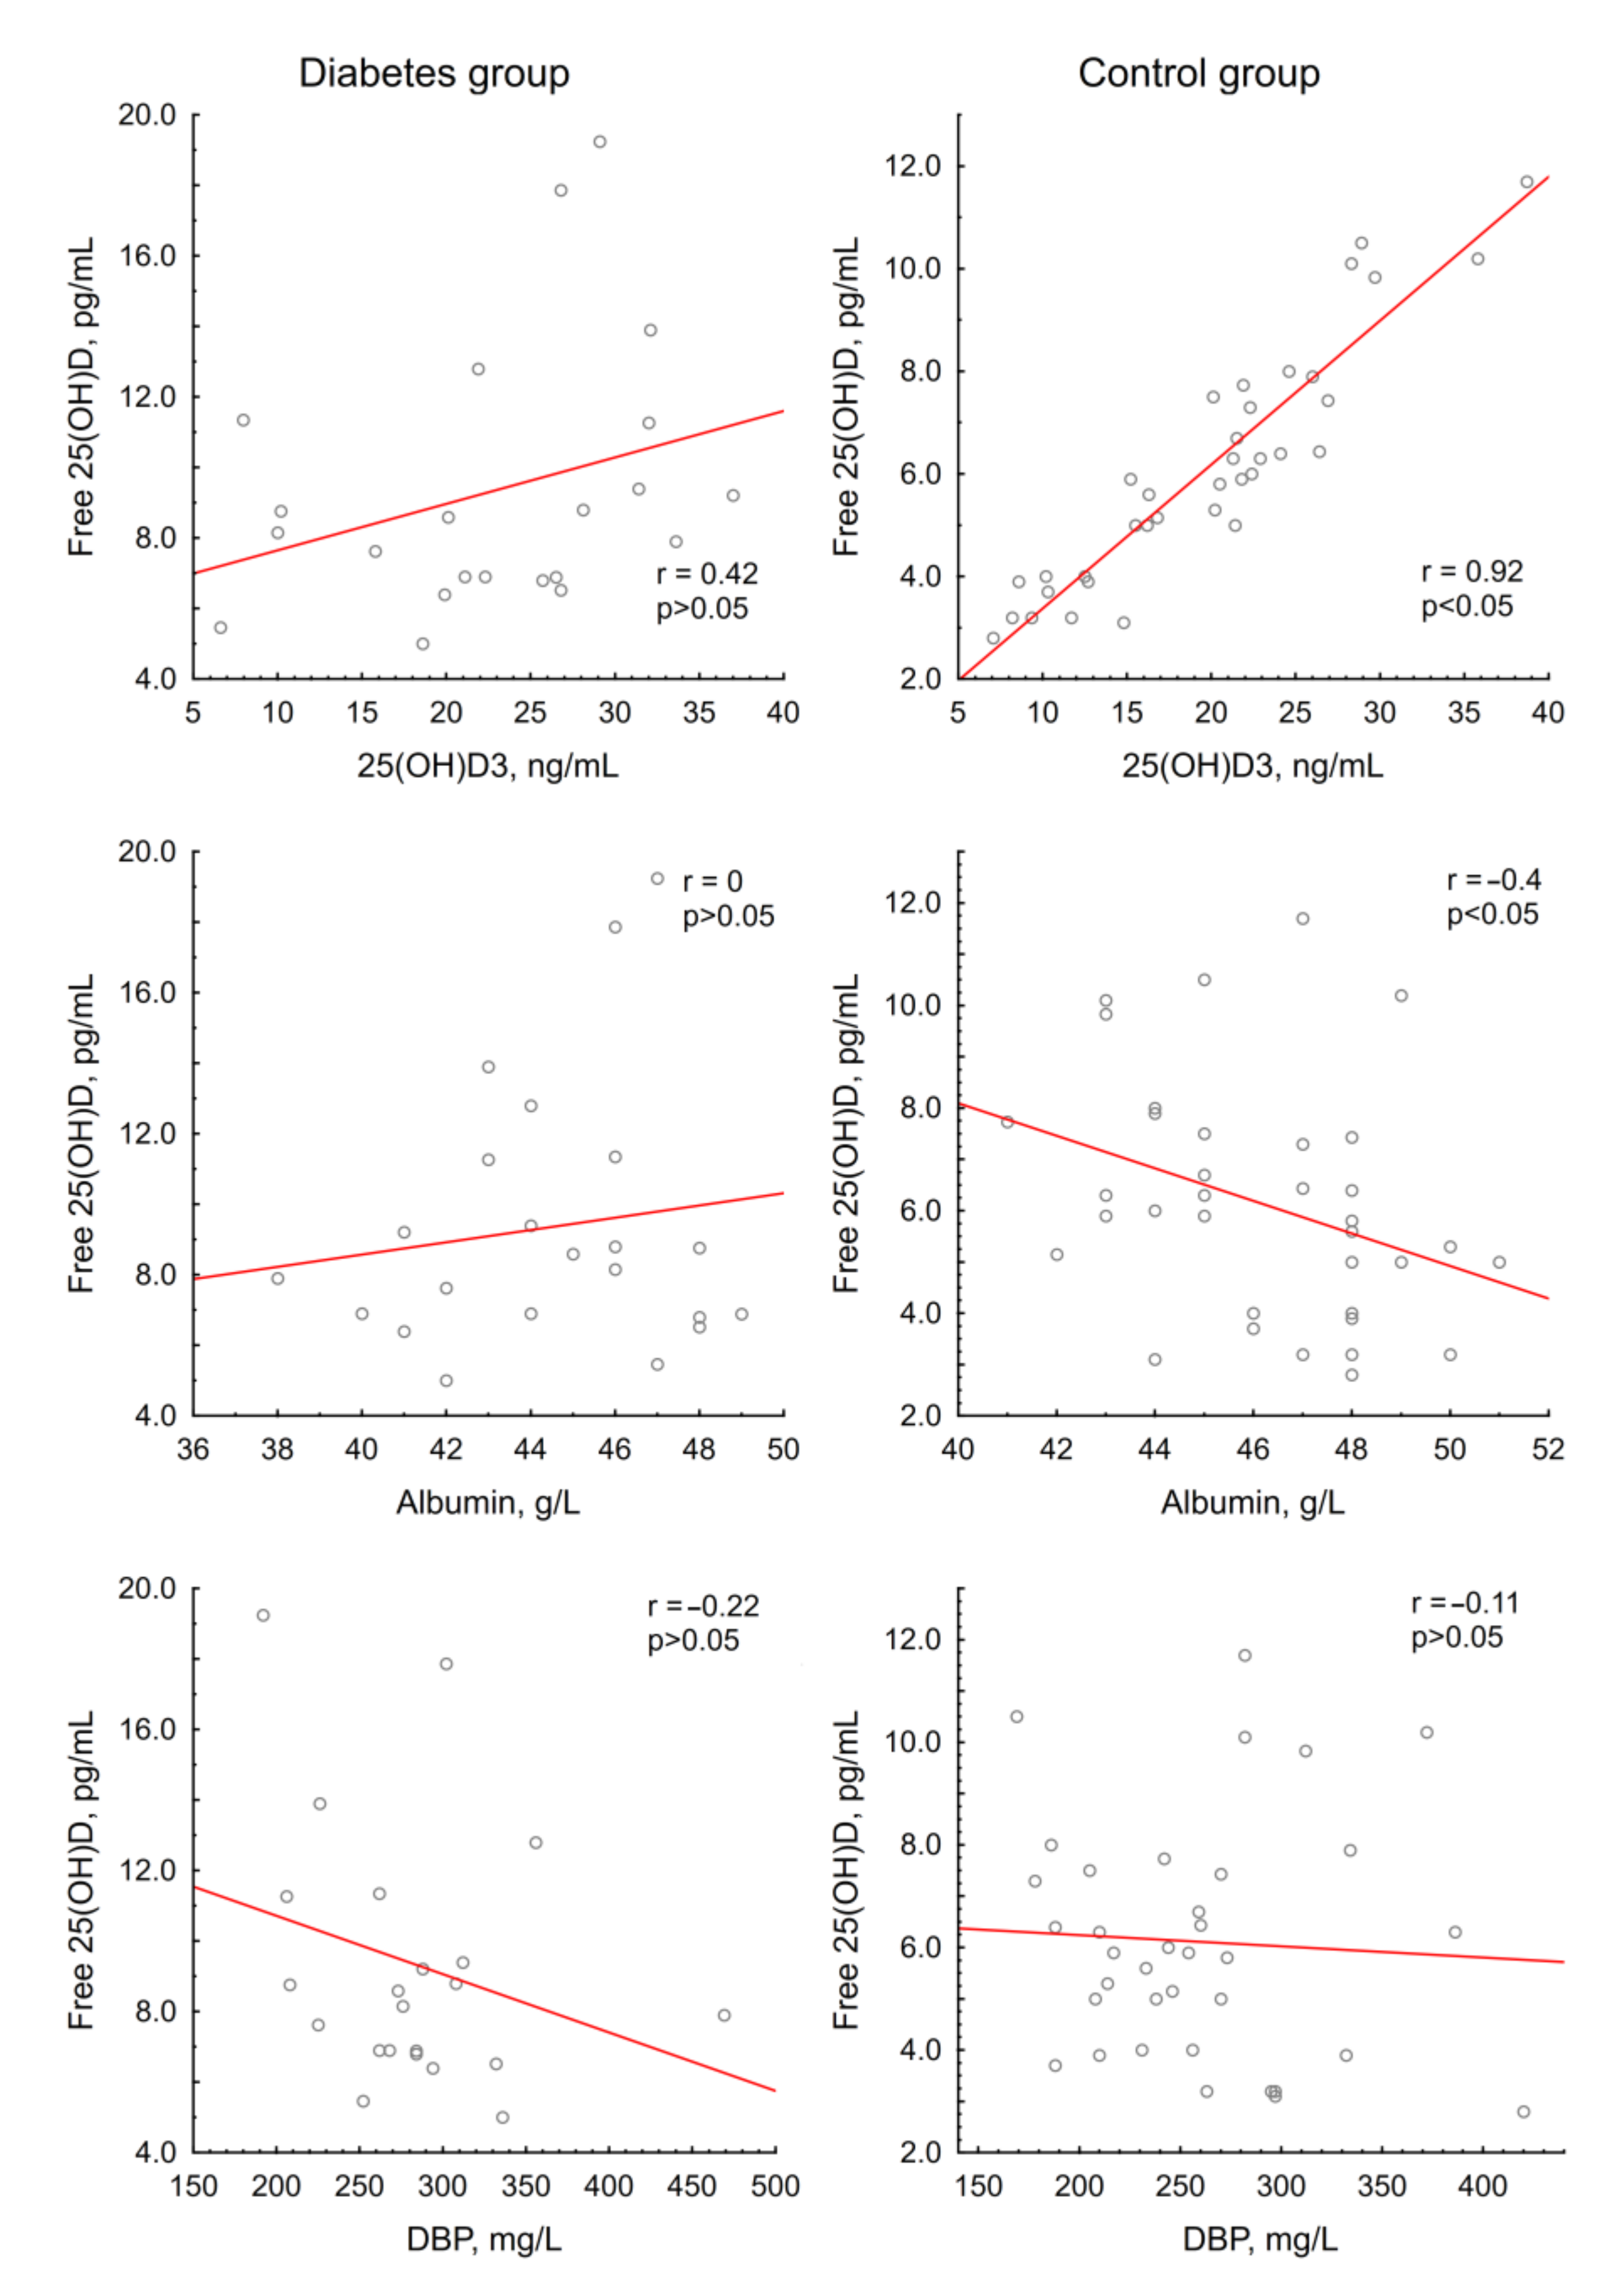
3.2.2. Vitamin D Metabolites and Free 25(OH)D
4. Discussion
5. Conclusions
Supplementary Materials
Author Contributions
Funding
Conflicts of Interest
References
- Holick, M.F.; Binkley, N.C.; Bischoff-Ferrari, H.A.; Gordon, C.M.; Hanley, D.A.; Heaney, R.P.; Murad, M.H.; Weaver, C.M. Evaluation, treatment, and prevention of vitamin D deficiency: An Endocrine Society clinical practice guideline. J. Clin. Endocrinol. Metab. 2011, 96, 1911–1930. [Google Scholar] [CrossRef] [PubMed]
- Holick, M.F. Vitamin D: Extraskeletal Health. Endocrinol. Metab. Clin. N. Am. 2010, 39, 381–400. [Google Scholar] [CrossRef] [PubMed]
- Rosen, C.J.; Adams, J.S.; Bikle, D.D.; Black, D.M.; Demay, M.B.; Manson, J.A.E.; Murad, M.H.; Kovacs, C.S. The nonskeletal effects of vitamin D: An Endocrine society scientific statement. Endocr. Rev. 2012, 33, 456–492. [Google Scholar] [CrossRef] [PubMed]
- Bikle, D.D. Vitamin D metabolism, mechanism of action, and clinical applications. Chem. Biol. 2014, 21, 319–329. [Google Scholar] [CrossRef] [PubMed]
- Speeckaert, M.; Huang, G.; Delanghe, J.R.; Taes, Y.E.S. Biological and clinical aspects of the vitamin D binding protein (Gc-globulin) and its polymorphism. Clin. Chim Acta 2006, 372, 33–42. [Google Scholar] [CrossRef] [PubMed]
- Chun, R.F.; Peercy, B.E.; Orwoll, E.S.; Nielson, C.M.; Adams, J.S.; Hewison, M. Vitamin D and DBP: The free hormone hypothesis revisited. J. Steroid Biochem. Mol. Biol. 2014, 144, 132–137. [Google Scholar] [CrossRef] [PubMed]
- Feng, R.; Li, Y.; Li, G.; Li, Z.; Zhang, Y.; Li, Q.; Sun, C. Lower serum 25(OH)D concentrations in type 1 diabetes: A meta-analysis. Diabetes Res. Clin. Pract. 2015, 108, e71–e75. [Google Scholar] [CrossRef]
- Liu, C.; Lu, M.; Xia, X.; Wang, J.; Wan, Y.; He, L.; Li, M. Correlation of serum vitamin D level with type 1 diabetes mellitus in children: A meta-analysis. Nutr. Hosp. 2015, 32, 1591–1594. [Google Scholar] [CrossRef]
- Shen, L.; Zhuang, Q.S.; Ji, H.F. Assessment of vitamin D levels in type 1 and type 2 diabetes patients: Results from metaanalysis. Mol. Nutr. Food Res. 2016, 60, 1059–1067. [Google Scholar] [CrossRef]
- Gregoriou, E.; Mamais, I.; Tzanetakou, I.; Lavranos, G.; Chrysostomou, S. The effects of vitamin D supplementation in newly diagnosed type 1 diabetes patients: Systematic review of randomized controlled trials. Rev. Diabet Stud. 2017, 14, 260–268. [Google Scholar] [CrossRef]
- Bogdanou, D.; Penna-Martinez, M.; Filmann, N.; Chung, T.L.; Moran-Auth, Y.; Wehrle, J.; Cappel, C.; Huenecke, S.; Herrmann, E.; Koehl, U.; et al. T-lymphocyte and glycemic status after vitamin D treatment in type 1 diabetes: A randomized controlled trial with sequential crossover. Diabetes Metab. Res. Rev. 2017, 33, e2865. [Google Scholar] [CrossRef] [PubMed]
- Gabbay, M.A.; Sato, M.N.; Finazzo, C.; Duarte, A.J.S.; Dib, S.A. Effect of cholecalciferol as adjunctive therapy with insulin on protective immunologic profile and decline of residual b-cell function in new-onset type 1 diabetes mellitus. Arch. Pediatr. Adolesc. Med. 2012, 166, 601–607. [Google Scholar] [CrossRef] [PubMed]
- Treiber, G.; Prietl, B.; Fröhlich-Reiterer, A.; Lechner, E.; Ribitsch, A.; Fritsch, M.; Rami-Merhar, B.; Steigleder-Schweiger, C.; Graninger, W.; Borkenstein, M.; et al. Cholecalciferol supplementation improves suppressive capacity of regulatory T-cells in young patients with new-onset type 1 diabetes mellitus—A randomized clinical trial. Clin. Immunol. 2015, 161, 217–224. [Google Scholar] [CrossRef] [PubMed]
- Shih, E.M.; Mittelman, S.; Pitukcheewanont, P.; Azen, C.G.; Monzavi, R. Effects of vitamin D repletion on glycemic control and inflammatory cytokines in adolescents with type 1 diabetes. Pediatr. Diabetes 2016, 17, 36–43. [Google Scholar] [CrossRef]
- Haller, M.J.; Wasserfall, C.H.; Hulme, M.A.; Cintron, M.; Brusko, T.M.; McGrail, K.M.; Wingard, J.R.; Theriaque, D.W.; Shuster, J.J.; Ferguson, R.J.; et al. Autologous Umbilical Cord Blood Infusion followed by Oral Docosahexaenoic Acid and Vitamin D Supplementation for C-Peptide Preservation in Children with Type 1 Diabetes. Biol. Blood Marrow Transplant. 2013, 19, 1126–1129. [Google Scholar] [CrossRef]
- Walter, M.; Kaupper, T.; Adler, K.; Foersch, J.; Bonifacio, E.; Ziegler, A.E. No effect of the 1α,25-dihydroxyvitamin D3on β-cell residual function and insulin requirement in adults with new-onset type 1 diabetes. Diabetes Care 2010, 33, 1443–1448. [Google Scholar] [CrossRef]
- Bizzarri, C.; Pitocco, D.; Napoli, N.; Di Stasio, E.; Maggi, D.; Manfrini, S.; Suraci, C.; Cavallo, M.G.; Cappa, M.; Ghirlanda, G.; et al. No protective effect of calcitriol on β-cell function in recent-onset type 1 diabetes: The IMDIAB XIII trial. Diabetes Care 2010, 33, 1962–1963. [Google Scholar] [CrossRef]
- Pitocco, D.; Crinò, A.; Di Stasio, E.; Manfrini, S.; Guglielmi, C.; Spera, S.; Anguissola, G.B.; Visalli, N.; Suraci, C.; Matteoli, M.C.; et al. The effects of calcitriol and nicotinamide on residual pancreatic β-cell function in patients with recent-onset Type 1 diabetes (IMDIAB XI). Diabet. Med. 2006, 23, 920–923. [Google Scholar] [CrossRef]
- Li, X.; Liao, L.; Yan, X.; Huang, G.; Lin, J.; Lei, M.; Wang, X.; Zhou, Z. Protective effects of 1- α -hydroxyvitamin D3 on residual β -cell function in patients with adult-onset latent autoimmune diabetes (LADA). Diabetes Metab. Res. Rev. 2009, 25, 411–416. [Google Scholar] [CrossRef]
- Ataie-Jafari, A.; Loke, S.C.; Rahmat, A.B.; Larijani, B.; Abbasi, F.; Leow, M.C.S.; Yassin, Z. A randomized placebo-controlled trial of alphacalcidol on the preservation of beta cell function in children with recent onset type 1 diabetes. Clin. Nutr. 2013, 32, 911–917. [Google Scholar] [CrossRef]
- De Boer, I.H.; Ioannou, G.N.; Kestenbaum, B.; Brunzell, J.D.; Weiss, N.S. 25-hydroxyvitamin D levels and albuminuria in the Third National Health and Nutrition Examination Survey (NHANES III). Am. J. Kidney Dis. 2007, 50, 69–77. [Google Scholar] [CrossRef] [PubMed]
- Diaz, V.A.; Mainous, A.G., 3rd; Carek, P.J.; Wessell, A.M.; Everett, C.J. The association of vitamin D deficiency and insufficiency with diabetic nephropathy: Implications for health disparities. J. Am. Board Fam. Med. 2009, 22, 521–527. [Google Scholar] [CrossRef] [PubMed][Green Version]
- Thrailkill, K.M.; Jo, C.H.; Cockrell, G.E.; Moreau, C.S.; Fowlkes, J.L. Enhanced excretion of vitamin D binding protein in type 1 diabetes: A role in vitamin D deficiency? J. Clin. Endocrinol. Metab. 2011, 96, 142–149. [Google Scholar] [CrossRef] [PubMed]
- Fowlkes, J.L.; Bunn, R.C.; Cockrell, G.E.; Clark, L.M.; Wahl, E.C.; Lumpkin, C.K.; Thraikill, K.M. Dysregulation of the intrarenal vitamin D endocytic pathway in a nephropathy-prone mouse model of type 1 diabetes. Exp. Diabetes Res. 2011, 2011, 269378. [Google Scholar] [CrossRef]
- Anderson, R.L.; Ternes, S.B.; Strand, K.A.; Rowling, M.J. Vitamin D homeostasis is compromised due to increased urinary excretion of the 25-hydroxycholecalciferol-vitamin D-binding protein complex in the Zucker diabetic fatty rat. Am. J. Physiol. Endocrinol. Metab. 2010, 299, E959–E967. [Google Scholar] [CrossRef]
- Ikeda, K.; Matsumoto, T.; Morita, K.; Yamato, H.; Takahashi, H.; Ezawa, I.; Ogata, E. The role of insulin in the stimulation of renal 1,25-dihydroxyvitamin D synthesis by parathyroid hormone in rats. Endocrinology 1987, 121, 1721–1726. [Google Scholar] [CrossRef]
- Colette, C.; Pares-Herbute, N.; Monnier, L.; Selam, J.L.; Thomas, N.; Mirouze, J. Effect of different insulin administration modalities on vitamin D metabolism of insulin-dependent diabetic patients. Horm. Metab. Res. 1989, 21, 37–41. [Google Scholar] [CrossRef]
- Frazer, T.E.; White, N.H.; Hough, S.; Santiago, J.V.; McGee, B.R.; Bryce, G.; Mallon, J.; Avioli, L.V. Alterations in circulating vitamin D metabolites in the young insulin-dependent diabetic. J. Clin. Endocrinol. Metab. 1981, 53, 1154–1159. [Google Scholar] [CrossRef]
- Mazanova, A.; Shymanskyi, I.; Lisakovska, O.; Hajiyeva, L.; Komisarenko, Y.; Veliky, M. Effects of Cholecalciferol on Key Components of Vitamin D-Endo/Para/Autocrine System in Experimental Type 1 Diabetes. Int. J. Endocrinol. 2018, 2018, 2494016:1–2494016:9. [Google Scholar] [CrossRef]
- Pozzilli, P.; Manfrini, S.; Crinò, A.; Picardi, A.; Leomanni, C.; Cherubini, V.; Valente, L.; Khazrai, M.; Visalli, N.; IMDIAB Group. Low levels of 25-hydroxyvitamin D3 and 1,25-dihydroxyvitamin D3 in patients with newly diagnosed type 1 diabetes. Horm. Metab. Res. 2005, 37, 680–683. [Google Scholar] [CrossRef]
- Aljabri, K.S.; Bokhari, S.A.; Khan, M.J. Glycemic changes after vitamin D supplementation in patients with type 1 diabetes mellitus and vitamin D deficiency. Ann. Saudi Med. 2010, 30, 454–458. [Google Scholar] [CrossRef] [PubMed]
- Hafez, M.; Hassan, M.; Musa, N.; Atty, S.A.; Azim, S.A. Vitamin D status in Egyptian children with type 1 diabetes and the role of vitamin D replacement in glycemic control. J. Pediatr. Endocrinol. Metab. 2017, 30, 389–394. [Google Scholar] [CrossRef] [PubMed]
- Panjiyar, R.P.; Dayal, D.; Attri, S.V.; Sachdeva, N.; Sharma, R.; Bhalla, A.K. Sustained serum 25-hydroxyvitamin D concentrations for one year with cholecalciferol supplementation improves glycaemic control and slows the decline of residual beta cell function in children with type 1 diabetes. Pediatr. Endocrinol. Diabetes Metab. 2018, 2018, 111–117. [Google Scholar] [CrossRef] [PubMed]
- Ordooei, M.; Shojaoddiny-Ardekani, A.; Hoseinipoor, S.H.; Miroliai, M.; Zare-Zardini, H. Effect of vitamin D on HbA1c levels of children and adolescents with diabetes mellitus type 1. Minerva Pediatr. 2017, 69, 391–395. [Google Scholar] [CrossRef] [PubMed]
- Wang, Z.; Senn, T.; Kalhorn, T.; Zheng, X.E.; Davis, C.L.; Hebert, M.F.; Lin, Y.S.; Thummel, K.S. Simultaneous measurement of plasma vitamin D3 metabolites, including 4β,25-dihydroxyvitamin D3, using liquid chromatography-tandem mass spectrometry. Anal. Biochem. 2011, 418, 126–133. [Google Scholar] [CrossRef] [PubMed]
- Aronov, P.A.; Hall, L.M.; Dettmer, K.; Stephensen, C.B.; Hammock, B.D. Metabolic profiling of major vitamin D metabolites using Diels-Alder derivatization and ultra-performance liquid chromatography-tandem mass spectrometry. Anal. Bioanal. Chem. 2008, 391, 1917–1930. [Google Scholar] [CrossRef]
- Bikle, D.D.; Siiteri, P.K.; Ryzen, E.; Haddad, J.G. Serum protein binding of 1,25-Dihydroxyvitamin D: A reevaluation by direct measurement of free metabolite levels. J. Clin. Endocrinol. Metab. 1985, 61, 969–975. [Google Scholar] [CrossRef]
- Bikle, D.D.; Gee, E.; Halloran, B.; Kowalski, M.A.; Ryzen, E.; Haddad, J.G. Assessment of the Free Fraction of 25-Hydroxyvitamin D in Serum and Its Regulation by Albumin and the Vitamin D-Binding Protein. J. Clin. Endocrinol. Metab. 1986, 63, 954–959. [Google Scholar] [CrossRef]
- Schwartz, J.B.; Lai, J.; Lizaola, B.; Kane, L.; Markova, S.; Weyland, P.; Terrault, N.A.; Stotland, N.; Bikle, D. A Comparison of Measured and Calculated Free 25(OH)Vitamin D Levels in Clinical Populations. J. Clin. Endocrinol. Metab. 2014, 99, 1631–1637. [Google Scholar] [CrossRef]
- Powe, C.E.; Seely, E.W.; Rana, S.; Bhan, I.; Ecker, J.; Karumanchi, S.A.; Thadhani, R. First Trimester Vitamin D, Vitamin D Binding Protein, and Subsequent Preeclampsia. Hypertension 2013, 56, 758–763. [Google Scholar] [CrossRef]
- Pigarova, E.A.; Rozhinskaya, L.Y.; Belaya, Z.E.; Dzeranova, L.K.; Karonova, T.L.; Ilyin, A.V.; Mel’nichenko, G.A.; Dedov, I.I. Russian Association of Endocrinologists recommendations for diagnosis, treatment and prevention of vitamin D deficiency in adults. Probl. Endokrinol. 2016, 62, 60–84. [Google Scholar] [CrossRef]
- Dirks, N.F.; Martens, F.; Vanderschueren, D.; Billen, J.; Pauwels, S.; Ackermans, M.T.; Endert, E.; den Heijer, M.; Blankenstein, M.A.; Heijboer, A.C. Determination of human reference values for serum total 1,25-dihydroxyvitamin D using an extensively validated 2D ID-UPLC–MS/MS method. J. Steroid Biochem. Mol. Biol. 2016, 164, 127–133. [Google Scholar] [CrossRef] [PubMed]
- Tang, J.C.Y.; Nicholls, H.; Piec, I.; Washbourne, C.J.; Dutton, J.J.; Jackson, S.; Greeves, J.; Fraser, W.D. Reference intervals for serum 24,25-dihydroxyvitamin D and the ratio with 25-hydroxyvitamin D established using a newly developed LC–MS/MS method. J. Nutr. Biochem. 2017, 46, 21–29. [Google Scholar] [CrossRef] [PubMed]
- Storm, T.L.; Sørensen, O.H.; Lund, B.; Lund, B.; Christiansen, J.S.; Andersen, A.R.; Lumholtz, I.B.; Parving, H.H. Vitamin D metabolism in insulin-dependent diabetes mellitus. Metab. Bone Dis. Relat. Res. 1983, 5, 107–110. [Google Scholar] [CrossRef]
- Kim, H.Y.; Lee, Y.A.; Jung, H.W.; Gu, M.J.; Kim, J.Y.; Lee, G.M.; Lee, J.; Yoon, J.Y.; Yang, S.W.; Shin, C.H. A lack of association between vitamin D-binding protein and 25-hydroxyvitamin D concentrations in pediatric type 1 diabetes without microalbuminuria. Ann. Pediatr. Endocrinol. Metab. 2017, 22, 247–252. [Google Scholar] [CrossRef] [PubMed]
- Rondeau, P.; Bourdon, E. The glycation of albumin: Structural and functional impacts. Biochimie 2011, 93, 645–658. [Google Scholar] [CrossRef]
- Soudahome, A.G.; Catan, A.; Giraud, P.; Kouao, S.A.; Guerin-Dubourg, A.; Debussche, X.; Le Moullec, N.; Bourdon, E.; Bravo, S.B.; Paradela-Dobarro, B.; et al. Glycation of human serum albumin impairs binding to the glucagon-like peptide-1 analogue liraglutide. J. Biol. Chem. 2018, 293, 4778–4791. [Google Scholar] [CrossRef]
- Iqbal, S.; Qais, F.A.; Alam, M.; Naseem, I. Effect of glycation on human serum albumin–zinc interaction: A biophysical study. J. Biol. Inorg. Chem. 2018, 23, 447–458. [Google Scholar] [CrossRef]
- Dahl, B.; Schiødt, F.V.; Rudolph, S.; Ott, P.; Kiaer, T.; Heslet, L. Trauma stimulates the synthesis of Gc-globulin. Intensive Care Med. 2001, 27, 394–399. [Google Scholar] [CrossRef]
- Dahl, B.; Schiødt, F.V.; Gehrchen, P.M.; Ramlau, J.; Kiaer, T.; Ott, P. Gc-globulin is an acute phase reactant and an indicator of muscle injury after spinal surgery. Inflamm. Res. 2001, 50, 39–43. [Google Scholar] [CrossRef]
- Arnaud, J.; Constans, J. Affinity differences for vitamin D metabolites associated with the genetic isoforms of the human serum carrier protein (DBP). Hum. Genet. 1993, 92, 183–188. [Google Scholar] [CrossRef] [PubMed]


| Diabetes Group (n = 25) | Control Group (n = 49) | p | |
|---|---|---|---|
| Age, years | 26.5 (22.7; 36.2) | 26.3 (25; 33.5) | 0.3 |
| Sex (female, %) | 84 | 80 | 0.76 |
| Body mass index, kg/m2 | 21.9 (20.7; 25.2) | 22.2 (20.1; 26.1) | 0.94 |
| 25(OH)D total, ng/mL | 21.3 (15.9; 29.9) | 18.4 (13.3; 25.2) | 0.21 |
| Parameter | Value |
|---|---|
| Median duration of T1DM, years | 17 (11; 19) |
| HbA1c, % | 7.1 (6.5; 7.6) |
| Treatment regimen | |
| Insulin pump (%) | 76 |
| Basal-bolus regimen (%) | 24 |
| Presence of diabetic complications | |
| Albuminuria (%) | 8 |
| Retinopathy (%) | 40 |
| Neuropathy (%) | 68 |
| Diabetes Group | Control Group | p | |
|---|---|---|---|
| Current smokers (%) | 8 | 22 | 0.2 |
| Total smokers (%) | 12 | 39 | 0.03 |
| Alcohol units, per week | 1 (0; 2.5) | 1 (0; 2) | 0.2 |
| Exercises lasting more than 30 min, per week | 3 (2; 5.5) | 3 (1.5; 5) | 0.44 |
| Dairy product consumption, servings per day | 1.5 (1; 2) | 1 (0.5; 2) | 0.06 |
| Meat dish consumption, portions per week | 5 (2; 7) | 4.5 (3; 6.5) | 0.34 |
| Coffee consumption, cups per week | 7 (1; 8) | 4.5 (2; 8) | 0.61 |
| Soft drinks, mL per week | 0 (0; 300) | 0 (0; 100) | 0.3 |
| Travelers to the south, % | 20 | 16 | 1.0 |
| Daytime walks in sunny weather, n | 9.5 (5; 30) | 5 (1; 10) | 0.04 |
| Laboratory Parameter | Group | Day 0 | Day 1 | Day 3 | Day 7 | p (Friedman ANOVA) | p (Day 0–1) | p (Day 1–3) | p (Day 3–7) | Reference Range |
|---|---|---|---|---|---|---|---|---|---|---|
| Total calcium, mmol/L | Diabetes | 2.37 (2.33; 2.46) | 2.38 (2.33; 2.43) | 2.41 (2.36; 2.48) | 2.37 (2.31; 2.44) | 0.53 | - | - | - | 2.15–2.55 |
| Control | 2.38 (2.33; 2.45) | 2.42 (2.36; 2.45) | 2.40 (2.36; 2.46) | 2.38 (2.36; 2.45) | 0.17 | - | - | - | ||
| Albumin-adjusted calcium, mmol/L | Diabetes | 2.28 (2.25; 2.32) | 2.29 (2.24; 2.32) | 2.32 (2.26; 2.36) | 2.30 (2.24; 2.35) | 0.25 | - | - | - | 2.15–2.55 |
| Control | 2.26 (2.21; 2.31) | 2.29 (2.25; 2.34) | 2.30 (2.25; 2.35) | 2.28 (2.25; 2.33) | 0.007 | 0.003 | 0.49 | 0.17 | ||
| Phosphorus, mmol/L | Diabetes | 1.19 (1.06; 1.32) | 1.23 (1.14; 1.33) | 1.27 (1.15; 1.43) | 1.17 (1.05; 1.30) | 0.001 | 0.22 | 0.2 | 0.001 | 0.74–1.52 |
| Control | 1.15 (1.06; 1.23) | 1.22 (1.10; 1.31) | 1.23 (1.18; 1.35) | 1.20 (1.12; 1.32) | 0.002 | 0.006 | 0.21 | 0.05 | ||
| PTH, pg/mL | Diabetes | 30.2 (23.5; 37.8) | 32.1 (22.2; 38.6) | 22.5 (20.9; 26.0) * | 25.7 (20.1; 32.4) | 0.0003 | 0.98 | 0.001 | 0.49 | 15–65 |
| Control | 35.9 (28.6; 47.2) | 34.3 (23.6; 46.7) | 30.5 (21.8; 41.5) | 28.6 (22.5; 39.2) | 0.002 | 0.15 | 0.11 | 0.55 | ||
| Creatinine, μmol/L | Diabetes | 71.0 (67.5; 80.2) | 71.5 (66.8; 77.9) | 73.8 (68.7; 76.6) | 74.4 (66.6; 86.1) | 0.86 | - | - | - | Not applicable |
| Control | 70.0 (65.9; 74.1) | 71.1 (65.7; 74.8) | 69.6 (65.7; 73.2) | 70.4 (65.5; 75.5) | 0.25 | - | - | - | ||
| Albumin, g/L | Diabetes | 45 (43; 47) | 45 (43; 46) | 45 (43; 47) | 44 (42; 46) | 0.65 | - | - | - | 35–50 |
| Control | 46 (45; 48) | 45 (44; 47) | 45 (44; 47) | 45 (44; 47) | 0.66 | - | - | - | ||
| Magnesium, mmol/L | Diabetes | 0.77 (0.74; 0.81) | 0.78 (0.75; 0.83) | 0.76 (0.72; 0.80) | 0.79 (0.73; 0.82) | 0.05 | - | - | - | 0.7–1.05 |
| Control | 0.80 (0.77; 0.82) | 0.79 (0.76; 0.84) | 0.79 (0.75; 0.82) | 0.79 (0.74; 0.84) | 0.23 | - | - | - | ||
| Calcium–creatinine ratio, mmol/mmol | Diabetes | 0.18 (0.14; 0.28) | 0.25 (0.15; 0.31) | 0.34 (0.18; 0.46) | 0.29 (0.17; 0.46) | 0.1 | - | - | - | 0.1–0.8 |
| Control | 0.28 (0.13; 0.42) | 0.31 (0.18; 0.44) | 0.31 (0.19; 0.41) | 0.30 (0.14; 0.46) | 0.79 | - | - | - | ||
| Phosphorus–creatinine ratio, mmol/mmol | Diabetes | 2.3 (1.8; 3.2) | 2.3 (1.7; 3.2) | 2.5 (1.9; 3.4) * | 2.9 (2.1; 3.4) * | 0.19 | - | - | - | 1.4–3.5 |
| Control | 2.1 (1.3; 2.8) | 2.2 (1.0; 2.6) | 2.1 (1.4; 2.7) | 2.0 (1.2; 2.6) | 0.32 | - | - | - |
| Laboratory Parameter | Group | Day 0 | Day 1 | Day 3 | Day 7 | p (Friedman ANOVA) | p (Day 0–1) | p (Day 1–3) | p (Day 3–7) | Reference Range |
|---|---|---|---|---|---|---|---|---|---|---|
| Free 25(OH)D, pg/mL | Diabetes | 8.4 (6.9; 11.3) * | 10.7 (8.2; 13.8) | 14.1 (9.9; 15.9) | 13.3 (10.6; 16.3) | 0.02 | 0.09 | 0.02 | 0.72 | 2.4–35 1 |
| Control | 5.9 (4.0; 7.5) | 11.2 (8.3; 14.4) | 14.0 (10.3; 17) | 13.0 (10.0; 15.8) | <0.00001 | <0.00001 | <0.00001 | 0.003 | ||
| DBP, mg/L | Diabetes | 280 (252; 308) | 276 (232; 376) | 261 (219; 311) | 265 (214; 343) | 0.03 | 0.19 | 0.03 | 0.65 | 176–623 1 |
| Control | 255 (212; 289) | 300 (246; 338) | 259 (218; 287) | 275 (240; 313) | 0.001 | 0.001 | 0.007 | 0.04 | ||
| 25(OH)D3, ng/mL | Diabetes | 22.3 (18.6; 28.1) | 35.9 (29; 41.8) * | 41.9 (33.4; 46.7) * | 41.4 (35.0; 46.3) * | <0.00001 | 0.00001 | 0.00004 | 0.69 | >30 2 |
| Control | 20.5 (14.8; 24.6) | 31.0 (26.8; 34.4) | 34.5 (31.8; 43.1) | 36.4 (32.8; 43.1) | <0.00001 | <0.000001 | <0.000001 | 0.004 | ||
| 3-epi-25(OH)D3, ng/mL | Diabetes | 1.6 (1.3; 2.1) | 3.7 (3.0; 4.5) * | 4.9 (4.4; 5.8) | 4.4 (3.8; 5.1) | <0.00001 | 0.00001 | 0.00003 | 0.00006 | Not available |
| Control | 1.4 (0.9; 1.8) | 3.0 (2.5; 3.9) | 4.6 (3.9; 5.6) | 4.3 (3.4; 5.2) | <0.00001 | <0.000001 | <0.000001 | 0.00003 | ||
| 1,25(OH)2D3, pg/mL | Diabetes | 35 (32; 41) | 43 (38; 49) | 42 (35; 53) | 44 (39; 54) | 0.001 | 0.002 | 0.33 | 0.15 | 25–66 3 |
| Control | 39 (34; 45) | 48 (39; 53) | 46 (40; 53) | 43 (38; 51) | 0.001 | <0.00001 | 0.98 | 0.28 | ||
| 24,25(OH)2D3, ng/mL | Diabetes | 1.8 (1.4; 3.0) | 2.2 (1.6; 3.3) | 3.3 (2.2; 4.5) | 3.8 (2.6; 4.9) | <0.00001 | 0.00009 | 0.00002 | 0.00005 | 0.5–5.6 3 |
| Control | 1.7 (0.9; 2.6) | 1.9 (1.3; 2.7) | 3.0 (2.1; 3.7) | 3.5 (2.7; 4.6) | <0.00001 | <0.000001 | <0.000001 | <0.000001 | ||
| 25(OH)D3/24,25(OH)2D3 | Diabetes | 12.5 (10.1; 16.0) | 16.8 (13.3; 21.9) | 11.7 (11.2; 16.0) | 10.8 (9.8; 13.8) | <0.00001 | 0.00001 | 0.0002 | 0.00002 | 7–23 3 |
| Control | 11.9 (9.6; 15.2) | 17.0 (12.1; 20.5) | 12.3 (10.1; 14.5) | 10.4 (8.5; 12.3) | <0.00001 | <0.000001 | <0.000001 | <0.000001 |
Publisher’s Note: MDPI stays neutral with regard to jurisdictional claims in published maps and institutional affiliations. |
© 2020 by the authors. Licensee MDPI, Basel, Switzerland. This article is an open access article distributed under the terms and conditions of the Creative Commons Attribution (CC BY) license (http://creativecommons.org/licenses/by/4.0/).
Share and Cite
Povaliaeva, A.; Pigarova, E.; Zhukov, A.; Bogdanov, V.; Dzeranova, L.; Mel’nikova, O.; Pekareva, E.; Malysheva, N.; Ioutsi, V.; Nikankina, L.; et al. Evaluation of Vitamin D Metabolism in Patients with Type 1 Diabetes Mellitus in the Setting of Cholecalciferol Treatment. Nutrients 2020, 12, 3873. https://doi.org/10.3390/nu12123873
Povaliaeva A, Pigarova E, Zhukov A, Bogdanov V, Dzeranova L, Mel’nikova O, Pekareva E, Malysheva N, Ioutsi V, Nikankina L, et al. Evaluation of Vitamin D Metabolism in Patients with Type 1 Diabetes Mellitus in the Setting of Cholecalciferol Treatment. Nutrients. 2020; 12(12):3873. https://doi.org/10.3390/nu12123873
Chicago/Turabian StylePovaliaeva, Alexandra, Ekaterina Pigarova, Artem Zhukov, Viktor Bogdanov, Larisa Dzeranova, Olga Mel’nikova, Elena Pekareva, Natalya Malysheva, Vitaliy Ioutsi, Larisa Nikankina, and et al. 2020. "Evaluation of Vitamin D Metabolism in Patients with Type 1 Diabetes Mellitus in the Setting of Cholecalciferol Treatment" Nutrients 12, no. 12: 3873. https://doi.org/10.3390/nu12123873
APA StylePovaliaeva, A., Pigarova, E., Zhukov, A., Bogdanov, V., Dzeranova, L., Mel’nikova, O., Pekareva, E., Malysheva, N., Ioutsi, V., Nikankina, L., & Rozhinskaya, L. (2020). Evaluation of Vitamin D Metabolism in Patients with Type 1 Diabetes Mellitus in the Setting of Cholecalciferol Treatment. Nutrients, 12(12), 3873. https://doi.org/10.3390/nu12123873