Abstract
There is a growing consensus that nutritional programming may persist and influence risk for several chronic diseases in adulthood. In the present study, we used urinary metabolic analysis in assessing diet effects on early-life metabolism. Urine samples from healthy three-month-old infants fed human milk (HM; n = 93), cow’s milk-based infant formula [MF; n = 80], or soy protein-based infant formula (SF; n = 76) were analyzed with an untargeted metabolomics approach using GC-TOF MS. PLS-DA and ANOVA analyses were performed using MetaboAnalyst (v4.0). A total of 150 metabolites differed significantly among the feeding groups, including dietary-specific patterns of urinary metabolites of sugars, sugar alcohols, amino acids, and polyphenols. Urinary metabolites may mirror the infant’s overall metabolism and serve as a noninvasive tool to examine the neonatal effects of diet on early-infant metabolism.
1. Introduction
Human milk (HM) is the sole source of nutrition, growth, and development of breast-fed infants [1] and provides protein and bioactive components that contribute to short- [2,3] and long-term health benefits [4,5,6]. Specifically, HM intake has been reported to reduce the incidence of necrotizing enterocolitis in preterm infants [7,8] and reduce respiratory tract infections [9,10]. Yet, the Center for Disease Control and Prevention (CDC) in 2016 reported that approximately 35% of US infants were fed HM alternatives, infant formulas, from birth to 12 months of age. The protein and amino acid content of infant formulas are higher than those present in human milk to achieve similar serum concentrations of the essential amino acids of breastfed infants [11]. However, the implications of higher protein content are unknown.
Nutritive and non-nutritive components of HM and infant formula are known factors that shape infant’s growth and body composition [12], and metabolism [13,14]. The neonatal diet promotes microbial colonization [15,16], which may impact the infant’s health [17]. For example, infant formula was found to alter fecal microbiota and metabolome profile in infants relative to human milk feeding through the first year of life [15] and breastfeeding enhanced the number of microbial genes related to glutamate and tryptophan metabolism in infants aged three, six, and 12 months [15]. Several studies have shown associations between specific nutrients and metabolites present in the blood and feces of infants receiving HM or infant formula [18,19]. However, the mechanisms involved in health outcomes during neonatal feeding remain to be fully characterized.
Knowledge of the urinary metabolite profile of infants consuming HM and infant formula is limited. Urine is less invasive to collect than blood and offers higher volumes for multiple downstream analyses. Urinary metabolomic analysis provides a snapshot of host and gut microbial metabolism and serves as a noninvasive biomarker for the evaluation of physiological changes. The impact of early infant feeding on the pattern of urinary bile acid excretion in infants has been reported [20], however, comprehensive metabolite analysis has not been investigated. Therefore, in the current study, we determined the urinary metabolite profiles in infants fed exclusively HM or cow’s milk formula (MF) or soy-based formula (SF) using an untargeted metabolomics approach at the age of three months.
2. Materials and Methods
2.1. Participants
Participants were 249 infants enrolled in the Beginnings Study (ClinicalTrials.gov: NCT00616395) between 2002 and 2010. The study was approved by the Institutional Review Board at the University of Arkansas for Medical Sciences, and the study design has been reported previously [21,22]. Infants were recruited before the age of 3 months and born from healthy pregnancies that were uncomplicated with no medical diagnoses (e.g., diabetes or pre-eclampsia) or the use of medications that could affect metabolism (e.g., thyroid replacement or selective serotonin reuptake inhibitors). All mothers were nonsmokers with no documented alcohol consumption or soy product intake during pregnancy or lactation. Mothers with soy intake during pregnancy and lactation were excluded. Infants were term (>37 weeks) and appropriate weight for gestational age (2.7 kg [6 lbs] to 4.1 kg [9 lbs] at birth).
2.2. Infant Diet
Prior to enrollment, infant’s diets chosen by the parent were either human milk (HM) or infant formula. HM group was breastfed or fed expressed HM by mothers during the study period. Those electing to feed formula were either on a cow’s milk-based formula (MF) or soy protein-based formula (SF) provided to them free of charge for the duration of the study (Similac Advance, Similac Soy Isomil, Enfamil Lipil or Enfamil Prosobee). Similac formulas were manufactured by Abbott Nutrition (Columbus, OH, USA), and Enfamil formulas were manufactured by Mead Johnson (Evansville, IN, USA). Diet composition for the infant formulas are presented in the Supplementary Table S1.
2.3. Anthropometric Measures
Anthropometric measures were obtained at 3 months of age +/− 3 days using standard methods that have been previously published [22]. Briefly, weight was measured to the nearest 0.01 kg using a tared scale (model 727; SECA Corp.) with the infant wearing only a diaper. Length was measured to the nearest 0.1 cm on a length board (Easy Glide Bearing Infantometer; Perspective Enterprises). Weight for Length Z-score were computed using the WHO Child Growth Standards [23].
2.4. Self-Reported Outcomes
The participant’s mother reported infant race, gestational age, birth weight, and length at the research study visit.
2.5. Urinary Samples
Urine samples were collected at 3 months using a sterile self-adhesive pediatric urine collector at the research study visit. Urine was preserved using sodium azide, aliquoted, and stored at −70 °C until analysis.
2.6. Creatinine Analyses
The quantification of creatinine was determined by an Enzymatic UV assay (#CR2336) using a RX Daytona clinical analyzer (Randox Laboratories-US limited; Kearneysville, WV, USA).
2.7. Urine Metabolome Analysis
Untargeted metabolomics analysis was performed by the West Coast Metabolomics Center at the University of California (Davis, CA, USA) using previously published methods [24,25]. Urine aliquots were normalized to urinary creatinine concentration. Samples were injected into an Agilent 6890 gas chromatograph and separated with a 30 m long, 0.25-mm-IDRtx5Sil-MS column. Mass spectrometry was conducted on a Leco Pegasus IV time-of-flight mass spectrometer. Resulting GC data were annotated with the BinBase (BB) algorithm with an automated database at the West Coast Metabolomics Center. The BinBase database matches mass spectrum information and retention times to the Fiehn laboratory mass spectral library of 1200 authentic standards in addition to the NIST05 commercial library. Each metabolite’s peak heights of quantifier ions were measured and normalized by the sum of intensities of all known metabolites. Unnamed peaks (unknown metabolites) were excluded from the analysis.
2.8. Statistical Analyses
Mean and standard error of the mean or counts and percent were calculated for maternal and child characteristics (birth weight and length, WFL Z-scores). To compare the feeding groups, One-way-ANOVAs were performed. Significance was set at alpha ≤0.05. Metabolomics analyses were conducted using MetaboAnalyst v4.0 [25]. There were no missing data observed in the raw data integrity check. Data were log-transformed and auto-scaled for further analyses. To determine metabolites that differed between the feeding groups, ANOVAs, followed by Tukey’s post-hoc tests, were used. Multivariate analysis was performed using partial least squares–discriminant analysis (PLS-DA).
3. Results
3.1. Maternal and Infant Characteristics
Demographics and clinical characteristics of the infants are reported in Table 1. Of the 249 children, most were Caucasians and more infants fed HM were Caucasians compared to infants fed SF (p = 0.004). Infants fed HM had significantly longer gestational age (+3 days on average) compared to the formula-fed (FF) infants. There were no differences in child sex, birth weight, or birth length between the different feeding groups (p > 0.05). There were also no differences at age 3 months in weight, height, or weight for length Z-scores between feeding groups (p > 0.05).

Table 1.
Cohort characteristics.
3.2. Urinary Metabolites Profile Was Altered by Neonatal Diet in Infants at 3 Months of Age
A total of 572 metabolites were identified among the three diet groups, of these 186 known metabolites were identified across feeding groups (Supplementary Table S2). PLSDA analyses of known metabolites discriminated the three infant diet groups demonstrating distinct metabolite enrichment in urinary samples of infants fed HM, MF, or SF (Figure 1). ANOVA of these metabolites indicated significant differences with 150 metabolites among the feeding groups (FDR p < 0.05). The number of metabolites significantly different among the three diet groups were 38, while overall formula diet (MF and SF) impacted 31 metabolite abundances relative to HM.
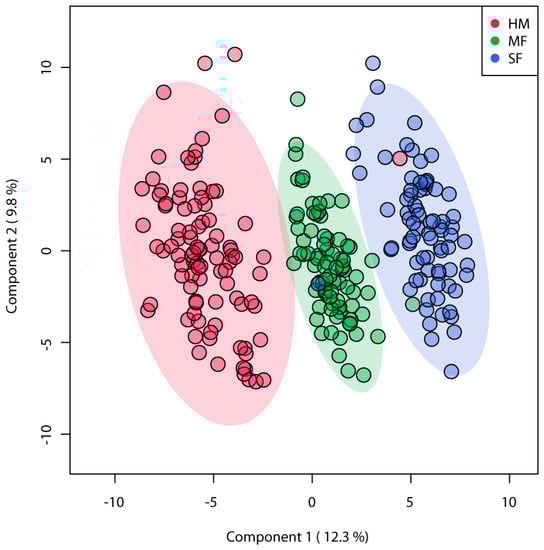
Figure 1.
Partial square discriminant analysis (PLS-DA) model from urinary metabolites of 3 months infants fed human milk (HM), cow’s milk-based infant formula (MF), or soy protein-based infant formula (SF). PLS-DA scores (i.e., individual samples) for PLS-DA components 1 and 2 are displayed. Shaded areas represent the 95% confidence regions. Red circles indicate HM (n = 93), green circles indicate MF (n = 80), and blue circles indicate SF (n = 76).
In addition, 31 metabolites differed significantly between MF to HM, while 17 metabolites differed in SF compared to HM infants (Figure 2). The complete list of metabolites impacted by the diet groups are shown in Supplementary Table S3.

Figure 2.
Venn diagram representing the number of metabolites statistically different between the three feeding groups, between formula diet groups (cow’s milk-based infant formula (MF); soy protein-based infant formula (SF)) relative to human milk (HM).
3.3. Formula Diet-Fed Infants Have Lower Abundance of Sugar and Sugar Alcohol Metabolites in Urine Relative to HM Infants at 3 Months of Age
Lactulose, maltose, leucrose, and raffinose were significantly different among the three diet groups with higher abundances observed in HM infants followed by MF and SF infants (Table 2). In HM infants, the carbohydrates fucose, ribose, arabinose, 1,5-anhydroglucitol, and xylose were higher in the urine relative to both MF and SF infants. Isoribose, isomaltose and sucrose were significantly higher in HM relative to MF group (Table 2). Both HM and MF infants had higher mannose, glucose, and threose than SF infants. However, the monosaccharide erythrose was higher in the urine of MF group relative to the other groups. Furthermore, sugar alcohols lactitol, hexitol, galactinol, myo-inositol, and glycerol were higher in the HM group in comparison to MF and SF groups. In addition, ribitol, lyxitol, and mannitol were lower in the urine of MF infants than in the HM and SF groups. Tartaric acid was higher in the MF group compared to the HM group, but it was lower than the urinary concentration in the SF group (Table 2).
Table 2.
Average abundances (quantifier ion (quantion) intensities) of sugar metabolites significantly different when comparing human milk (HM; n = 93), cow’s milk-based formula (MF; n = 80), and soy-formula (SF; n = 76) diet groups in the urine of infants at 3 months of age.
3.4. Formula Diet Altered Amino Acid Abundance in the Urine Relative to HM Infants at 3 Months of Age
Histidine differed significantly among the three diet groups with highest abundance in SF, followed by HM and MF infants. SF infants had higher abundance of glycine, tryptophan, and asparagine than both HM and MF infants. The amino acids alanine, serine, glutamate, proline, and aminomalonate were more abundant in the urine of the HM group than both MF and SF groups (Table 3).
Table 3.
Average abundances (quantifier ion (quantion) intensities) of urinary amino acids significantly different when comparing human milk (HM; n = 93), cow’s milk-based formula (MF; n = 80), and soy-formula (SF; n = 76) diet groups of infants at 3 months of age.
3.5. Fatty Acid and Dicarboxylic Acid Abundances Were Impacted by Neonatal Diet
Fatty acids including myristic acid, arachidic acid, and lactic acid were higher in the urine of HM compared to both MF and SF infants. Capric and palmitic acids were higher in the HM group relative to the SF group (Table 4). The dicarboxylic acids methylmalonic acid and oxalic acid were greater in the urine of HM group than in the MF group. Succinic acid was greater in the HM compared to the SF group (Table 5).
Table 4.
Average abundances (quantifier ion (quantion) intensities) of urinary fatty acids significantly different when comparing human milk (HM; n = 93), cow’s milk-based formula (MF; n = 80), and soy-formula (SF; n = 76) diet groups of infants at 3 months of age.
Table 5.
Average abundances (quantifier ion (quantion) intensities) of urinary dicarboxylic acids (DCAs) significantly different when comparing human milk (HM; n = 93), cow’s milk-based formula (MF; n = 80), and soy-formula (SF; n = 76) diet groups of infants at 3 months of age.
3.6. SF Diet Fed Infants Showed Higher Abundance of Polyphenol Metabolites
Polyphenol microbial metabolites, including 3,4-dihydroxyphenylacetic acid, 3-hydroxyphenylacetic acid, 4-hydroxyhippuric acid, and 4-hydroxyphenylacetic acid, were greater in the urine of SF group relative to MF and HM diet groups (Table 6).
Table 6.
Average abundances (quantifier ion (quantion) intensities) of urinary polyphenol microbial metabolites significantly different when comparing human milk (HM; n = 93), cow’s milk-based formula (MF; n = 80), and soy-formula (SF; n = 76) diet groups of infants at 3 months of age.
4. Discussion
Urinary metabolites reflect general metabolism, organ function (i.e., kidney, liver), and gut microbiota function [13]. Altered urinary metabolites have been observed at two weeks of age in infant rhesus macaques after breastfeeding or formula feeding [26]. Previously, the metabolic profile of fecal and plasma samples discriminated human milk and formula milk-fed infants [27,28]. The current study investigated the metabolite profile of urine from infants fed either human milk, cow’s milk formula or soy-milk formula at three months of age. The results demonstrate that human milk and formula-fed infants exhibit unique metabolite signatures. We identified 150 urinary metabolites whose abundances were distinct in infants fed HM, MF, or SF at three months of age. Carbohydrates, amino acids, sugar alcohols and sugar acids, fatty acids, and polyphenol derivatives were the most impacted categories by dietary groups.
Several urinary sugars and sugar alcohols (i.e., lactulose, maltose, leucrose, raffinose, fucose, ribose, arabinose, 1,5-anhydroglucitol, xylose, isoribose, isomaltose, sucrose, lactitol, hexitol, galactinol, 1,5-anhydroglucitol, myo-inositol, and glycerol) were significantly higher in HM infants relative to formula-fed infants. Interestingly, we observed a similar pattern for the sugar metabolites in a porcine model where HM fed piglets had higher urinary excretion of fucose and 1,5-anhydroglucitol compared to dairy-based infant formula at postnatal day 21 (manuscript in review). However, more sugar metabolites were observed in infants in comparison to the piglet model, likely due to differences in fasting conditions. Infants in the current study did not fast, while piglets were fasted for 8 hr before sample collection. Another explanation for the higher excretion of sugars in the HM group is that breastfed infants may utilize a lower amount of sugars or different sugar metabolites than formula-fed infants. Previously, it was demonstrated that carbohydrate intake was lower in breastfed infants at three and six months of age compared to formula-fed infants [29], and future studies are needed to demonstrate the neonatal diet impact on sugar metabolism in infants.
To our knowledge, this is the first report of early infant feeding effects on the urinary amino acid excretion in healthy infants aged three months. Free amino acids in human milk include glutamic acid (glutamate), glutamine, and taurine, which are the most abundant free amino acids in HM, and are a source of nitrogen supply compared to protein-derived amino acids from formula diet [30,31]. Previous studies have shown that free amino acid content in standard infant formulas is lower (i.e., glutamic acid = 57 µmol/L; glutamine = 2 µmol/L; and taurine = 387 µmol/L) relative to the concentration in full-term human milk (i.e., glutamic acid = 1419 µmol/L; glutamine = 20 µmol/L; and taurine = 555 µmol/L) [31,32]. In this study, the higher glutamic acid in the urine of HM infants is likely derived from the diet, suggesting that non-essential amino acid availability in HM can be a source of readily available nitrogen-compounds. Of a particular note, the SF diet resulted in higher cystine, glycine, tryptophan, and asparagine urinary excretion. These findings are in support of previous literature that higher levels of amino acids were observed in the plasma of formula-fed compared to breastfed infants [33,34], as a result of greater protein intake with formula feeding thus causing higher excretion of amino acids. Furthermore, the protein type is different with SF mainly has soy protein and MF with cow’s milk protein. It is possible that the changes observed are due to type of protein. Future studies are needed to determine whether MF fed differ in plasma amino acid profile relative to HM fed infants.
Polyphenols are a class of phytochemicals abundant in soy-based foods [35]. In the large intestine, the dietary polyphenols undergo microbial catabolism resulting in 3,4-dihydroxyphenylacetic acid and 3-hydroxyphenylacetic acid, among other metabolites [36]. As expected, this study observed a higher abundance of these polyphenols catabolites in the urine of SF compared to MF and HM diet groups. The interaction of non-absorbable polyphenols with the gut microbiota resulting in microbial catabolites has shown to positively affect human health by lowering inflammatory status and preventing obesity [37,38]. Studies in mice demonstrated that polyphenols may serve as substrates for the gut microbiota altering the microbial population [39]. It is possible that the detection of these polyphenols in the urine of SF infants is associated with the gut microbial degradation of dietary polyphenols. However, future studies are needed to analyze the mechanisms of action of these compounds in infants fed soy-formula.
In our cohort, because most children were Caucasian, no racial and ethnic disparities in the feeding groups were observed. Due to dynamic changes in the human milk composition and secretor status of human milk (presence of 2′-fucosyllactose) future studies are needed to confirm urinary metabolite profiles by specific components of human milk at multiple time points in a longitudinal study. In addition, birth mode, maternal diet, maternal and infant antibiotic exposures can affect microbiota and metabolite composition [40]. These factors should be considered in future studies to address the impact on infant metabolism and health. Furthermore, milk intake volume could be a factor resulting in the differences seen in the metabolite profiles. Furthermore, breastfed infants likely have better absorption of dietary components due to many bioactive components such as HMOs. These specific questions will need to be addressed in the future.
5. Conclusions
In summary, infant feeding distinguished the diversity of urinary metabolites in human milk versus cow and soy-based infant formulas.
- (a)
- The main divergence in the metabolic profiling was observed in HM relative to the formula diet groups, while differences in urinary metabolites were also observed between the formula groups.
- (b)
- The dietary-specific pattern of urinary metabolites of amino acids and monosaccharides were found in HM infants aged three months, which might be linked to the microbial catabolism of proteins and carbohydrates. For instance, studies in mouse models [41,42] have shown that human milk oligosaccharides present in high abundance in human milk serve as substrates to the beneficial bacteria in the distal gut lowering the development of gastrointestinal diseases. Thus, we speculate that the sugar excretion in our cohort reflect human milk components interactions with the host-microbiota. Additionally, microbial metabolism was reported as the source for amino acids excretion in feces of breastfed vs formula-fed infants prior to solid food introduction at 24-months of age [43]. Thus, it is possible that the amino acids excretion in the urine of breastfed vs formula-fed infants in this study were driven by the microbial modification of amino acids through specialized microbial populations.
- (c)
- The SF diet enhanced the excretion of metabolites from polyphenols microbial catabolism. Furthermore, early life gut microbiota colonization via maternal milk components rather than shaping the neonate’s gut microbiota [44], can also affect the host-microbial metabolism. Thus, our findings indicate that urinary metabolites may mirror the infant’s metabolism as noninvasive biomarkers and a potential tool to evaluate the impact of infant diets in early life.
- (d)
- We speculate that metabolite changes could affect other organ systems in the body (i.e., liver and brain). Thus, future studies are needed to determine the early diet impact on short and long-term health effects.
Supplementary Materials
The following are available online at https://www.mdpi.com/2072-6643/12/11/3552/s1, Table S1: Composition of the infant formulas used in this study. Table S2: Raw peak intensities (mz/rt) of all the known metabolites detected in the urine of infants at 3 months of age fed human milk (HM), cow’s milk-based formula (MF), or soy-formula (SF). Table S3: Average abundances (quantifier ion [quantion] intensities) of urinary metabolites significantly different when comparing human milk (HM; n = 93), cow’s milk-based formula (MF; n = 80), and soy-formula (SF; n = 76) diet groups in infants at 3 months of age.
Author Contributions
A.A., K.E.M., and L.Y. conceptualized the study; A.A., G.G., L.M.P., H.L., and K.E.M. generated data and conducted technical aspects of the study and generated data on creatinine and urinary metabolites; C.R.S., F.R., L.Y., and A.A. conducted data analyses and interpretation; T.B. and A.A.: principal investigators of the Beginnings cohort; F.R., L.Y., and A.A. wrote the manuscript and had the primary responsibility for the data interpretation and manuscript revision. All authors have read and agreed to the published version of the manuscript.
Funding
This work was supported by the United States Department of Agriculture/Agricultural Research Service (USDA-ARS Project 6026-51000-010-05S and 6026-51000-012-06S). L.Y. is also supported by NIH 1R21AI146521. A.A. is also supported by NIH 1R01DK 107516.
Acknowledgments
We thank Arkansas Children’s Nutrition Center (ACNC) Clinical Core team for subject recruitment and sample collection.
Conflicts of Interest
The authors have no conflicts of interest to disclose.
References
- Martin, C.R.; Ling, P.-R.; Blackburn, G.L. Review of Infant Feeding: Key Features of Breast Milk and Infant Formula. Nutrients 2016, 8, 279. [Google Scholar] [CrossRef] [PubMed]
- Beaudry, M.; Dufour, R.; Marcoux, S. Relation between infant feeding and infections during the first six months of life. J. Pediatr. 1995, 126, 191–197. [Google Scholar] [CrossRef]
- Donovan, S.M.; Comstock, S.S. Human Milk Oligosaccharides Influence Neonatal Mucosal and Systemic Immunity. Ann. Nutr. Metab. 2016, 69, 41–51. [Google Scholar] [CrossRef] [PubMed]
- Hanson, L.Å.; Korotkova, M.; Telemo, E. Breast-feeding, infant formulas, and the immune system. Ann. Allerg. Asthma Immunol. 2003, 90, 59–63. [Google Scholar] [CrossRef]
- Davis, E.C.; Wang, M.; Donovan, S. The role of early life nutrition in the establishment of gastrointestinal microbial composition and function. Gut Microbes 2017, 8, 143–171. [Google Scholar] [CrossRef] [PubMed]
- Bode, L.; McGuire, M.; Rodriguez, J.M.; Geddes, D.T.; Hassiotou, F.; Hartmann, P.E.; McGuire, M.K. It’s Alive: Microbes and Cells in Human Milk and Their Potential Benefits to Mother and Infant. Adv. Nutr. 2014, 5, 571–573. [Google Scholar] [CrossRef]
- Cristofalo, E.A.; Schanler, R.J.; Blanco, C.L.; Sullivan, S.; Trawoeger, R.; Kiechl-Kohlendorfer, U.; Dudell, G.; Rechtman, D.J.; Lee, M.L.; Lucas, A.; et al. Randomized Trial of Exclusive Human Milk versus Preterm Formula Diets in Extremely Premature Infants. J. Pediatr. 2013, 163, 1592–1595.e1. [Google Scholar] [CrossRef]
- Henderson, G.; Anthony, M.Y.; McGuire, W.L. Formula milk versus maternal breast milk for feeding preterm or low birth weight infants. Cochrane Database Syst. Rev. 2007, CD002972. [Google Scholar] [CrossRef]
- Hanson, L.Å. Session 1: Feeding and infant development Breast-feeding and immune function. Proc. Nutr. Soc. 2007, 66, 384–396. [Google Scholar] [CrossRef]
- Hanson, L.Å. The role of breastfeeding in prevention of neonatal infection. Semin. Neonatol. 2002, 7, 275–281. [Google Scholar] [CrossRef]
- Lönnerdal, B. Infant formula and infant nutrition: Bioactive proteins of human milk and implications for composition of infant formulas. Am. J. Clin. Nutr. 2014, 99, 712S–717S. [Google Scholar] [CrossRef] [PubMed]
- Phan, M.; Momin, S.R.; Senn, M.K.; Frazier-Wood, A.C. Metabolomic Insights into the Effects of Breast Milk Versus Formula Milk Feeding in Infants. Curr. Nutr. Rep. 2019, 8, 295–306. [Google Scholar] [CrossRef] [PubMed]
- Shoji, H.; Shimizu, T. Effect of human breast milk on biological metabolism in infants. Pediatr. Int. 2018, 61, 6–15. [Google Scholar] [CrossRef] [PubMed]
- Bardanzellu, F.; Fanos, V.; Strigini, F.A.L.; Artini, P.G.; Peroni, D.G. Human Breast Milk: Exploring the Linking Ring Among Emerging Components. Front. Pediatr. 2018, 6, 215. [Google Scholar] [CrossRef] [PubMed]
- Brink, L.R.; Mercer, K.E.; Piccolo, B.D.; Chintapalli, S.V.; Elolimy, A.; Bowlin, A.K.; Matazel, K.S.; Pack, L.; Adams, S.H.; Shankar, K.; et al. Neonatal diet alters fecal microbiota and metabolome profiles at different ages in infants fed breast milk or formula. Am. J. Clin. Nutr. 2020, 111, 1190–1202. [Google Scholar] [CrossRef]
- Hascoet, J.-M.; Hubert, C.; Rochat, F.; Legagneur, H.; Gaga, S.; Emady-Azar, S.; Steenhout, P.G. Effect of Formula Composition on the Development of Infant Gut Microbiota. J. Pediatr. Gastroenterol. Nutr. 2011, 52, 756–762. [Google Scholar] [CrossRef]
- Bäckhed, F.; Roswall, J.; Peng, Y.; Feng, Q.; Jia, H.; Kovatcheva-Datchary, P.; Li, Y.; Xia, Y.; Xie, H.; Zhong, H.; et al. Dynamics and Stabilization of the Human Gut Microbiome during the First Year of Life. Cell Host Microbe 2015, 17, 690–703. [Google Scholar] [CrossRef]
- Uhl, O.; Fleddermann, M.; Hellmuth, C.; Demmelmair, H.; Koletzko, B. Phospholipid Species in Newborn and 4 Month Old Infants after Consumption of Different Formulas or Breast Milk. PLoS ONE 2016, 11, e0162040. [Google Scholar] [CrossRef]
- Anderson, M.; Eliot, K.; Kelly, P.; Shoemaker, J. Dicarboxylic Acid Excretion in Normal Formula-Fed and Breastfed Infants. Nutr. Clin. Pract. 2016, 31, 819–823. [Google Scholar] [CrossRef]
- Wahlén, E.; Strandvik, B. Effects of Different Formula Feeds on the Developmental Pattern of Urinary Bile Acid Excretion in Infants. J. Pediatr. Gastroenterol. Nutr. 1994, 18, 9–19. [Google Scholar] [CrossRef]
- Andres, A.; Cleves, M.A.; Bellando, J.B.; Pivik, R.T.; Casey, P.H.; Badger, T. Developmental Status of 1-Year-Old Infants Fed Breast Milk, Cow’s Milk Formula, or Soy Formula. Pediatrics 2012, 129, 1134–1140. [Google Scholar] [CrossRef] [PubMed]
- Andres, A.; Casey, P.H.; Cleves, M.A.; Badger, T.M. Body Fat and Bone Mineral Content of Infants Fed Breast Milk, Cow’s Milk Formula, or Soy Formula during the First Year of Life. J. Pediatr. 2013, 163, 49–54. [Google Scholar] [CrossRef] [PubMed]
- WHO. WHO Child Growth Standards: Length/Height-for-Age, Weight-for-Age, Weight-for-Length, Weight-for-Height, and Body Mass Index-for Age: Methods and Development, 1st ed.; World Health Organization: Geneva, Switzerland, 2006; ISBN 9294154693X. [Google Scholar]
- Fiehn, O.; Wohlgemuth, G.; Scholz, M.; Kind, T.; Lee, D.Y.; Lu, Y.; Moon, S.; Nikolau, B. Quality control for plant metabolomics: Reporting MSI-compliant studies. Plant. J. 2008, 53, 691–704. [Google Scholar] [CrossRef] [PubMed]
- Chong, J.; Wishart, D.S.; Xia, J. Using MetaboAnalyst 4.0 for Comprehensive and Integrative Metabolomics Data Analysis. Curr. Protoc. Bioinforma. 2019, 68, e86. [Google Scholar] [CrossRef]
- He, X.; Sotelo-Orozco, J.; Rudolph, C.; Lönnerdal, B.; Slupsky, C.M. The Role of Protein and Free Amino Acids on Intake, Metabolism, and Gut Microbiome: A Comparison between Breast-Fed and Formula-Fed Rhesus Monkey Infants. Front. Pediatr. 2020, 7, 563. [Google Scholar] [CrossRef]
- He, X.; Parenti, M.; Grip, T.; Lönnerdal, B.; Timby, N.; Domellöf, M.; Hernell, O.; Slupsky, C.M. Fecal microbiome and metabolome of infants fed bovine MFGM supplemented formula or standard formula with breast-fed infants as reference: A randomized controlled trial. Sci. Rep. 2019, 9, 1–14. [Google Scholar] [CrossRef]
- Slupsky, C.M.; He, X.; Hernell, O.; Andersson, Y.; Rudolph, C.; Lönnerdal, B.; West, C.E. Postprandial metabolic response of breast-fed infants and infants fed lactose-free vs regular infant formula: A randomized controlled trial. Sci. Rep. 2017, 7, 3640. [Google Scholar] [CrossRef]
- Butte, N.F.; Wong, W.W.; Hopkinson, J.M.; Smith, E.O.; Ellis, K.J. Infant feeding mode affects early growth and body composition. Pediatrics 2000, 106, 1355–1366. [Google Scholar] [CrossRef]
- Koletzko, B. Glutamate Supply and Metabolism in Infants. Ann. Nutr. Metab. 2018, 73 (Suppl. 5), 29–35. [Google Scholar] [CrossRef]
- Chuang, C.-K.; Lin, S.-P.; Lee, H.-C.; Wang, T.-J.; Shih, Y.-S.; Huang, F.-Y.; Yeung, C.-Y. Free Amino Acids in Full-Term and Pre-Term Human Milk and Infant Formula. J. Pediatr. Gastroenterol. Nutr. 2005, 40, 496–500. [Google Scholar] [CrossRef]
- Agostoni, C.; Carratù, B.; Boniglia, C.; Riva, E.; Sanzini, E. Free Amino Acid Content in Standard Infant Formulas: Comparison with Human Milk. J. Am. Coll. Nutr. 2000, 19, 434–438. [Google Scholar] [CrossRef]
- Kirchberg, F.F.; Harder, U.U.; Weber, M.; Grote, V.; Demmelmair, H.; Peissner, W.W.; Rzehak, P.; Xhonneux, A.; Carlier, C.C.; Ferre, N.N.; et al. Dietary Protein Intake Affects Amino Acid and Acylcarnitine Metabolism in Infants Aged 6 Months. J. Clin. Endocrinol. Metab. 2015, 100, 149–158. [Google Scholar] [CrossRef] [PubMed]
- European Childhood Obesity Trial Study Group; Socha, P.; Grote, V.; Gruszfeld, D.; Janas, R.M.; Demmelmair, H.; Closa-Monasterolo, R.; Subías, J.E.; Scaglioni, S.; Verduci, E.; et al. Milk protein intake, the metabolic-endocrine response, and growth in infancy: Data from a randomized clinical trial. Am. J. Clin. Nutr. 2011, 94, 1776S–1784S. [Google Scholar] [CrossRef] [PubMed]
- Yang, R.; Xiu, H.; Zhou, Q.; Sun, L.; Mu, H.; Li, H.; Wang, S.; Li, X.; Chen, W.; Dong, J. Application of Urinary Polyphenol Biomarkers Measured by Liquid Chromatography Tandem Mass Spectrometry to Assess Polyphenol Intake and Their Association with Overweight and Obesity in Free-Living Healthy Subjects. Oxidative Med. Cell. Longev. 2019, 2019, 4809836. [Google Scholar] [CrossRef]
- Appeldoorn, M.M.; Vincken, J.-P.; Aura, A.-M.; Hollman, P.C.H.; Gruppen, H. Procyanidin Dimers Are Metabolized by Human Microbiota with 2-(3,4-Dihydroxyphenyl)acetic Acid and 5-(3,4-Dihydroxyphenyl)-γ-valerolactone as the Major Metabolites. J. Agric. Food Chem. 2009, 57, 1084–1092. [Google Scholar] [CrossRef] [PubMed]
- Roopchand, D.E.; Carmody, R.N.; Kuhn, P.; Moskal, K.; Rojas-Silva, P.; Turnbaugh, P.J.; Raskin, I. Dietary Polyphenols Promote Growth of the Gut BacteriumAkkermansia muciniphilaand Attenuate High-Fat Diet–Induced Metabolic Syndrome. Diabetes 2015, 64, 2847–2858. [Google Scholar] [CrossRef] [PubMed]
- Masumoto, S.; Terao, A.; Yamamoto, Y.; Mukai, T.; Miura, T.; Shoji, T. Non-absorbable apple procyanidins prevent obesity associated with gut microbial and metabolomic changes. Sci. Rep. 2016, 6, 31208. [Google Scholar] [CrossRef] [PubMed]
- Anhê, F.F.; Roy, D.; Pilon, G.; Dudonné, S.; Matamoros, S.; Varin, T.V.; Garofalo, C.; Moine, Q.; Desjardins, Y.; Levy, E.; et al. A polyphenol-rich cranberry extract protects from diet-induced obesity, insulin resistance and intestinal inflammation in association with increased Akkermansia spp. population in the gut microbiota of mice. Gut 2015, 64, 872–883. [Google Scholar] [CrossRef] [PubMed]
- Bokulich, N.A.; Chung, J.; Battaglia, T.; Henderson, N.; Jay, M.; Li, H.; Lieber, A.D.; Wu, F.; Perez-Perez, G.I.; Chen, Y.; et al. Antibiotics, birth mode, and diet shape microbiome maturation during early life. Sci. Transl. Med. 2016, 8, 343ra82. [Google Scholar] [CrossRef]
- Jantscher-Krenn, E.; Bode, L. Human milk oligosaccharides and their potential benefits for the breast-fed neonate. Minerva Pediatr. 2012, 64, 83–99. [Google Scholar]
- Good, M.; Sodhi, C.P.; Yamaguchi, Y.; Jia, H.; Lu, P.; Fulton, W.B.; Martin, L.Y.; Prindle, T.; Nino, D.F.; Zhou, Q.; et al. The human milk oligosaccharide 2′-fucosyllactose attenuates the severity of experimental necrotising enterocolitis by enhancing mesenteric perfusion in the neonatal intestine. Br. J. Nutr. 2016, 116, 1175–1187. [Google Scholar] [CrossRef] [PubMed]
- Sillner, N.; Walker, A.; Lucio, M.; Maier, T.V.; Bazanella, M.; Rychlik, M.; Haller, D.; Schmitt-Kopplin, P. Longitudinal profiles of dietary and microbial metabolites in formula- and breastfed infants. J. bioRxiv 2020. [Google Scholar] [CrossRef]
- Elsen, L.W.J.; Garssen, J.; Burcelin, R.; Verhasselt, V. Shaping the Gut Microbiota by Breastfeeding: The Gateway to Allergy Prevention? Front. Pediatr. 2019, 7. [Google Scholar] [CrossRef]
Publisher’s Note: MDPI stays neutral with regard to jurisdictional claims in published maps and institutional affiliations. |
© 2020 by the authors. Licensee MDPI, Basel, Switzerland. This article is an open access article distributed under the terms and conditions of the Creative Commons Attribution (CC BY) license (http://creativecommons.org/licenses/by/4.0/).