The Effects of Non-Nutritive Artificial Sweeteners, Aspartame and Sucralose, on the Gut Microbiome in Healthy Adults: Secondary Outcomes of a Randomized Double-Blinded Crossover Clinical Trial


Abstract
1. Introduction
2. Materials and Methods
2.1. Study Design
2.2. Study Participants
2.3. Inclusion and Exclusion Criteria
2.4. Randomization
2.5. Dietary Recommendation during the Time of the Study
2.6. Interventions
2.7. Assessment and Evaluation
2.8. Study Measures
2.9. Sample Collection
2.10. Faecal Microbiota
2.11. Faecal SCFA Analysis
2.12. Statistical Analysis
2.13. Faecal Microbiota Analysis
3. Results
3.1. Participants
3.2. Faecal Metabolomic Analysis
4. Discussion
5. Conclusions
Supplementary Materials
Author Contributions
Funding
Acknowledgments
Conflicts of Interest
References
- Gardner, C.; Wylie-Rosett, J.; Gidding, S.S.; Steffen, L.M.; Johnson, R.K.; Reader, D.; Lichtenstein, A.H. Nonnutritive sweeteners: Current use and health perspectives: A scientific statement from the American Heart Association and the American Diabetes Association. Circulation 2012, 126, 509–519. [Google Scholar] [CrossRef] [PubMed]
- Mattes, R.D.; Popkin, B.M. Nonnutritive sweetener consumption in humans: Effects on appetite and food intake and their putative mechanisms. Am. J. Clin. Nutr. 2009, 89, 1–14. [Google Scholar] [CrossRef] [PubMed]
- Government of Canada. List of Permitted Sweeteners (Lists of Permitted Food Additives). Available online: https://www.canada.ca/en/health-canada/services/food-nutrition/food-safety/food-additives/lists-permitted/9-sweeteners.html (accessed on 3 April 2019).
- Garriguet, D. Beverage consumption of Canadian adults. Health Rep. 2008, 19, 23–29. [Google Scholar] [PubMed]
- Nikpartow, N.; Danyliw, A.D.; Whiting, S.J.; Lim, H.J.; Vatanparast, H. Beverage consumption patterns of Canadian adults aged 19 to 65 years. Public Health Nutr. 2012, 15, 2175–2184. [Google Scholar] [CrossRef] [PubMed]
- Myles, I.A. Fast food fever: Reviewing the impacts of the Western diet on immunity. Nutr. J. 2014, 13, 61. [Google Scholar] [CrossRef]
- Canada, P. How Sweet It Is: The facts on zero and low calorie sweeteners in Canada. 2011. Available online: http://pepsico.ca/en/Purpose/HumanSustainability/ForHealthProfessionals/How-Sweet-It-Is-The-Facts-On-Zero-And-Low-Calorie-Sweeteners-In-Canada.html (accessed on 30 April 2019).
- Rinninella, E.; Raoul, P.; Cintoni, M.; Franceschi, F.; Miggiano GA, D.; Gasbarrini, A.; Mele, M.C. What is the Healthy Gut Microbiota Composition? A Changing Ecosystem across Age, Environment, Diet, and Diseases. Microorganisms 2019, 7, 14. [Google Scholar] [CrossRef] [PubMed]
- Kunz, C.; Kuntz, S.; Rudloff, S. Intestinal flora. Adv. Exp. Med. Biol. 2009, 639, 67–79. [Google Scholar]
- David, L.A.; Maurice, C.F.; Carmody, R.N.; Gootenberg, D.B.; Button, J.E.; Wolfe, B.E.; Ling, A.V.; Devlin, A.S.; Varma, Y.; Fischbach, M.A.; et al. Diet rapidly and reproducibly alters the human gut microbiome. Nature 2014, 505, 559–563. [Google Scholar] [CrossRef] [PubMed]
- Le Poul, E.; Loison, C.; Struyf, S.; Springael, J.Y.; Lannoy, V.; Decobecq, M.E.; Brezillon, S.; Dupriez, V.; Vassart, G.; van Damme, J.; et al. Functional characterization of human receptors for short chain fatty acids and their role in polymorphonuclear cell activation. J. Biol. Chem. 2003, 278, 25481–25489. [Google Scholar] [CrossRef]
- Morrison, D.J.; Preston, T. Formation of short chain fatty acids by the gut microbiota and their impact on human metabolism. Gut Microbes 2016, 7, 189–200. [Google Scholar] [CrossRef]
- Eckburg, P.B.; Bik, E.M.; Bernstein, C.N.; Purdom, E.; Dethlefsen, L.; Sargent, M.; Gill, S.R.; Nelson, K.E.; Retman, D.A. Diversity of the human intestinal microbial flora. Science 2005, 308, 1635–1638. [Google Scholar] [CrossRef]
- Berg, R.D. The indigenous gastrointestinal microflora. Trends Microbiol. 1996, 4, 430–435. [Google Scholar] [CrossRef]
- Jandhyala, S.M.; Talukdar, R.; Subramanyam, C.; Vuyyuru, H.; Sasikala, M.; Reddy, D.N. Role of the normal gut microbiota. World J. Gastroenterol. 2015, 21, 8787–8803. [Google Scholar] [CrossRef] [PubMed]
- Pickard, J.M.; Zeng, M.Y.; Caruso, R.; Núñez, G. Gut microbiota: Role in pathogen colonization, immune responses, and inflammatory disease. Immunol. Rev. 2017, 279, 70–89. [Google Scholar] [CrossRef]
- Hooks, K.B.; O’Malley, M.A. Dysbiosis and Its Discontents. MBio 2017, 8. [Google Scholar] [CrossRef] [PubMed]
- Martinez, K.B.; Leone, V.; Chang, E.B. Western diets, gut dysbiosis, and metabolic diseases: Are they linked? Gut Microbes 2017, 8, 130–142. [Google Scholar] [CrossRef]
- Harsch, I.A.; Konturek, P.C. The Role of Gut Microbiota in Obesity and Type 2 and Type 1 Diabetes Mellitus: New Insights into “Old” Diseases. Med. Sci. 2018, 6, 32. [Google Scholar] [CrossRef] [PubMed]
- Ruiz-Ojeda, F.J.; Plaza-Díaz, J.; Sáez-Lara, M.J.; Gil, A. Effects of Sweeteners on the Gut Microbiota: A Review of Experimental Studies and Clinical Trials. Adv. Nutr. 2019, 10 (Suppl. 1), S31–S48. [Google Scholar] [CrossRef]
- Suez, J.; Korem, T.; Zeevi, D.; Zilberman-Schapira, G.; Thaiss, C.A.; Maza, O.; Israeli, D.; Zmora, N.; Gilad, S.; Weinberger, A.; et al. Artificial sweeteners induce glucose intolerance by altering the gut microbiota. Nature 2014, 514, 181–186. [Google Scholar] [CrossRef] [PubMed]
- Abou-Donia, M.B.; El-Masry, E.M.; Abdel-Rahman, A.A.; McLendon, R.E.; Schiffman, S.S. Splenda alters gut microflora and increases intestinal p-glycoprotein and cytochrome p-450 in male rats. J. Toxicol. Environ. Health A 2008, 71, 1415–1429. [Google Scholar] [CrossRef]
- Palmnas, M.S.; Cowan, T.E.; Bomhof, M.R.; Su, J.; Reimer, R.A.; Vogel, H.J.; Hittel, D.S.; Shearer, J. Low-dose aspartame consumption differentially affects gut microbiota-host metabolic interactions in the diet-induced obese rat. PLoS ONE 2014, 9, e109841. [Google Scholar] [CrossRef] [PubMed]
- Ahmad, S.Y.; Friel, J.K.; Mackay, D.S. Effect of sucralose and aspartame on glucose metabolism and gut hormones. Nutr. Rev. 2020, 78, 725–746. [Google Scholar] [CrossRef]
- Ahmad, S.Y.; Friel, J.K.; MacKay, D.S. The effect of the artificial sweeteners on glucose metabolism in healthy adults: A randomized, double-blinded, crossover clinical trial. Appl. Physiol. Nutr. Metab. 2020, 45, 606–612. [Google Scholar] [CrossRef]
- Battram, D.S.; Graham, T.E.; Richter, E.A.; Dela, F. The effect of caffeine on glucose kinetics in humans—Influence of adrenaline. J. Physiol. 2005, 569 Pt 1, 347–355. [Google Scholar] [CrossRef]
- Steiner, J.L.; Crowell, K.T.; Lang, C.H. Impact of Alcohol on Glycemic Control and Insulin Action. Biomolecules 2015, 5, 2223–2246. [Google Scholar] [CrossRef] [PubMed]
- Engen, P.A.; Green, S.J.; Voigt, R.M.; Forsyth, C.B.; Keshavarzian, A. The Gastrointestinal Microbiome: Alcohol Effects on the Composition of Intestinal Microbiota. Alcohol. Res. 2015, 37, 223–236. [Google Scholar]
- Rogers, M.A.M.; Aronoff, D.M. The influence of non-steroidal anti-inflammatory drugs on the gut microbiome. Clin. Microbiol. Infect. 2016, 22, 178.e1–178.e9. [Google Scholar] [CrossRef]
- Hemarajata, P.; Versalovic, J. Effects of probiotics on gut microbiota: Mechanisms of intestinal immunomodulation and neuromodulation. Therap. Adv. Gastroenterol. 2013, 6, 39–51. [Google Scholar] [CrossRef] [PubMed]
- Crichton, N. Visual analogue scale (VAS). J. Clin. Nurs. 2001, 10, 706–716. [Google Scholar]
- Available online: https://microbiomeinsights.com (accessed on 15 June 2020).
- Kozich, J.J.; Westcott, S.L.; Baxter, N.T.; Highlander, S.K.; Schloss, P.D. Development of a dual-index sequencing strategy and curation pipeline for analyzing amplicon sequence data on the MiSeq Illumina sequencing platform. Appl. Environ. Microbiol. 2013, 79, 5112–5120. [Google Scholar] [CrossRef]
- Available online: https://mothur.org/wiki/miseq_sop/ (accessed on 1 October 2019).
- Zhao, G.; Nyman, M.; Jonsson, J.A. Rapid determination of short-chain fatty acids in colonic contents and faeces of humans and rats by acidified water-extraction and direct-injection gas chromatography. Biomed. Chromatogr. 2006, 20, 674–682. [Google Scholar] [CrossRef]
- Anderson, M.J.; Walsh, D.C.I. PERMANOVA, Anosim, and the Mantel Test in the Face of Heterogeneous Dispersions: What Null Hypothesis Are You Testing? The Ecological Society of America: Washington, DC, USA, 2013; Ecological Monographs; Volume 83. [Google Scholar]
- Shannon, C.E. The Mathematical Theory of Communication by Ce Shannon and W. Weaver. 1949. Available online: https://pure.mpg.de/rest/items/item_2383164/component/file_2383163/content (accessed on 1 October 2019).
- Magnuson, B. Council Spokesperson, Berna Magnuson, Reviews Nature Study on Low-Calorie Sweeteners. 2015. Available online: https://caloriecontrol.org/council-spokesperson-berna-magnuson-reviews-nature-study-on-low-calorie-sweeteners/ (accessed on 5 January 2020).
- Frankenfeld, C.L.; Sikaroodi, M.; Lamb, E.; Shoemaker, S.; Gillevet, P.M. High-intensity sweetener consumption and gut microbiome content and predicted gene function in a cross-sectional study of adults in the United States. Ann. Epidemiol. 2015, 25, 736–742.e4. [Google Scholar] [CrossRef]
- John, B.A.; Wood, S.G.; Hawkins, D.R. The pharmacokinetics and metabolism of sucralose in the mouse. Food Chem. Toxicol. 2000, 38 (Suppl. 2), S107–S110. [Google Scholar] [CrossRef]
- Sims, J.; Roberts, A.; Daniel, J.W.; Renwick, A.G. The metabolic fate of sucralose in rats. Food Chem. Toxicol. 2000, 38 (Suppl. 2), S115–S121. [Google Scholar] [CrossRef]
- Wood, S.G.; John, B.A.; Hawkins, D.R. The pharmacokinetics and metabolism of sucralose in the dog. Food Chem. Toxicol. 2000, 38 (Suppl. 2), S99–S106. [Google Scholar] [CrossRef]
- Roberts, A.; Renwick, A.G.; Sims, J.; Snodin, D.J. Sucralose metabolism and pharmacokinetics in man. Food Chem. Toxicol. 2000, 38 (Suppl. 2), S31–S41. [Google Scholar] [CrossRef]
- Wang, Q.P.; Browman, D.; Herzog, H.; Neely, G.G. Non-nutritive sweeteners possess a bacteriostatic effect and alter gut microbiota in mice. PLoS ONE 2018, 13, e0199080. [Google Scholar] [CrossRef]
- Bian, X.; Chi, L.; Gao, B.; Tu, P.; Ru, H.; Lu, K. Gut Microbiome Response to Sucralose and Its Potential Role in Inducing Liver Inflammation in Mice. Front. Physiol. 2017, 8, 487. [Google Scholar] [CrossRef]
- Uebanso, T.; Ohnishi, A.; Kitayama, R.; Yoshimoto, A.; Nakahashi, M.; Shimohata, T.; Mawatari, K.; Takahashi, A. Effects of Low-Dose Non-Caloric Sweetener Consumption on Gut Microbiota in Mice. Nutrients 2017, 9, 560. [Google Scholar] [CrossRef]
- Gill, H.S.; Guarner, F. Probiotics and human health: A clinical perspective. Postgrad. Med. J. 2004, 80, 516–526. [Google Scholar] [CrossRef] [PubMed]
- Swithers, S.E. Artificial sweeteners produce the counterintuitive effect of inducing metabolic derangements. Trends Endocrinol. Metab. 2013, 24, 431–441. [Google Scholar] [CrossRef]


| Assessments | Screening & Enrollment | Visit 1 | Visit 2 | Visit 3 | Visit 4 |
|---|---|---|---|---|---|
| Day in study | 1 | 28 | 42 | 84 | |
| Week in study | −2 | 1–4 | 5,6 | 7–10 | 11,12 |
| General information form | ✓ | ||||
| Informed consent | ✓ | ✓ | |||
| Medical history | ✓ | ✓ | |||
| Weight | ✓ | ✓ | ✓ | ✓ | ✓ |
| Non-nutritive sweetener supplementation 1 | ✓ | ✓ | |||
| Blood draw 2 (1.5 mL) session | ✓ | ✓ | ✓ | ✓ | |
| Stool sample collection | ✓ | ✓ | ✓ | ✓ | |
| Laboratory measurements in plasma: glucose, insulin, glucagon, GLP-1, leptin | ✓ | ✓ | ✓ | ✓ | |
| Laboratory measurements in stool: fecal microbiome, fecal short-chain fatty acids (SCFA) | ✓ | ✓ | ✓ | ✓ | |
| Oral glucose tolerance test (OGTT) 3 | ✓ | ✓ | ✓ | ||
| Fasting blood glucose (FBG) test 4 | ✓ | ✓ | ✓ | ✓ | ✓ |
| Visual analogue scales (taste panel) 5 | ✓ | ✓ | ✓ | ✓ | |
| Diet history questionnaire | ✓ | ||||
| Food diary 6 | ✓ | ✓ | ✓ | ✓ | |
| Adverse event log | ✓ | ✓ | ✓ | ✓ |
| Variables | Value |
|---|---|
| Total participants (F/M) | 17 (10/7) |
| Age (years) | 24 ± 1.64 |
| Body weight (kg) | 68.9 ± 2.54 |
| BMI (kg/m2) | 22.9 ± 0.6 |
| FBG (mmol/L) | 5.3 ± 0.1 |
| Caffeine (mg) (n = 16) * | 176.87 ± 46.68 |
| Protein (g) (n = 16) * | 70.87 ± 7.33 |
| Carbohydrate (g/day) (n = 16) * | 228.60 ± 24.57 |
| Fiber (g) (n = 16) * | 17.43 ± 2.30 |
| Total fat (g) (n = 16) * | 72.04 ± 7.78 |
| Aspartame (mg) (n = 15) * | 11.81 ± 2.99 |
| Sucralose (mg) (n = 12) * | 65.83 ± 48.65 |
| Total SCFA (mmol/kg) | 78.57 ± 11.18 |
| Acetic acid (mmol/kg) | 46.87 ± 24.94 |
| Propionic acid (mmol/kg) | 16.61 ±10.57 |
| Butyric acid (mmol/kg) | 10.51 ± 6.26 |
| Isovaleric acid (mmol/kg) | 2.27 ± 1.73 |
| Valeric acid (mmol/kg) | 1.86 ± 1.87 |
| Hexanoic acid (mmol/kg) | 0.42 ± 0.74 |
| Sucralose | Aspartame | |||||||
|---|---|---|---|---|---|---|---|---|
| Pre-Treatment | Post-Treatment | % Change | p-Value * | Pre- Treatment | Post-Treatment | % Change | p-Value * | |
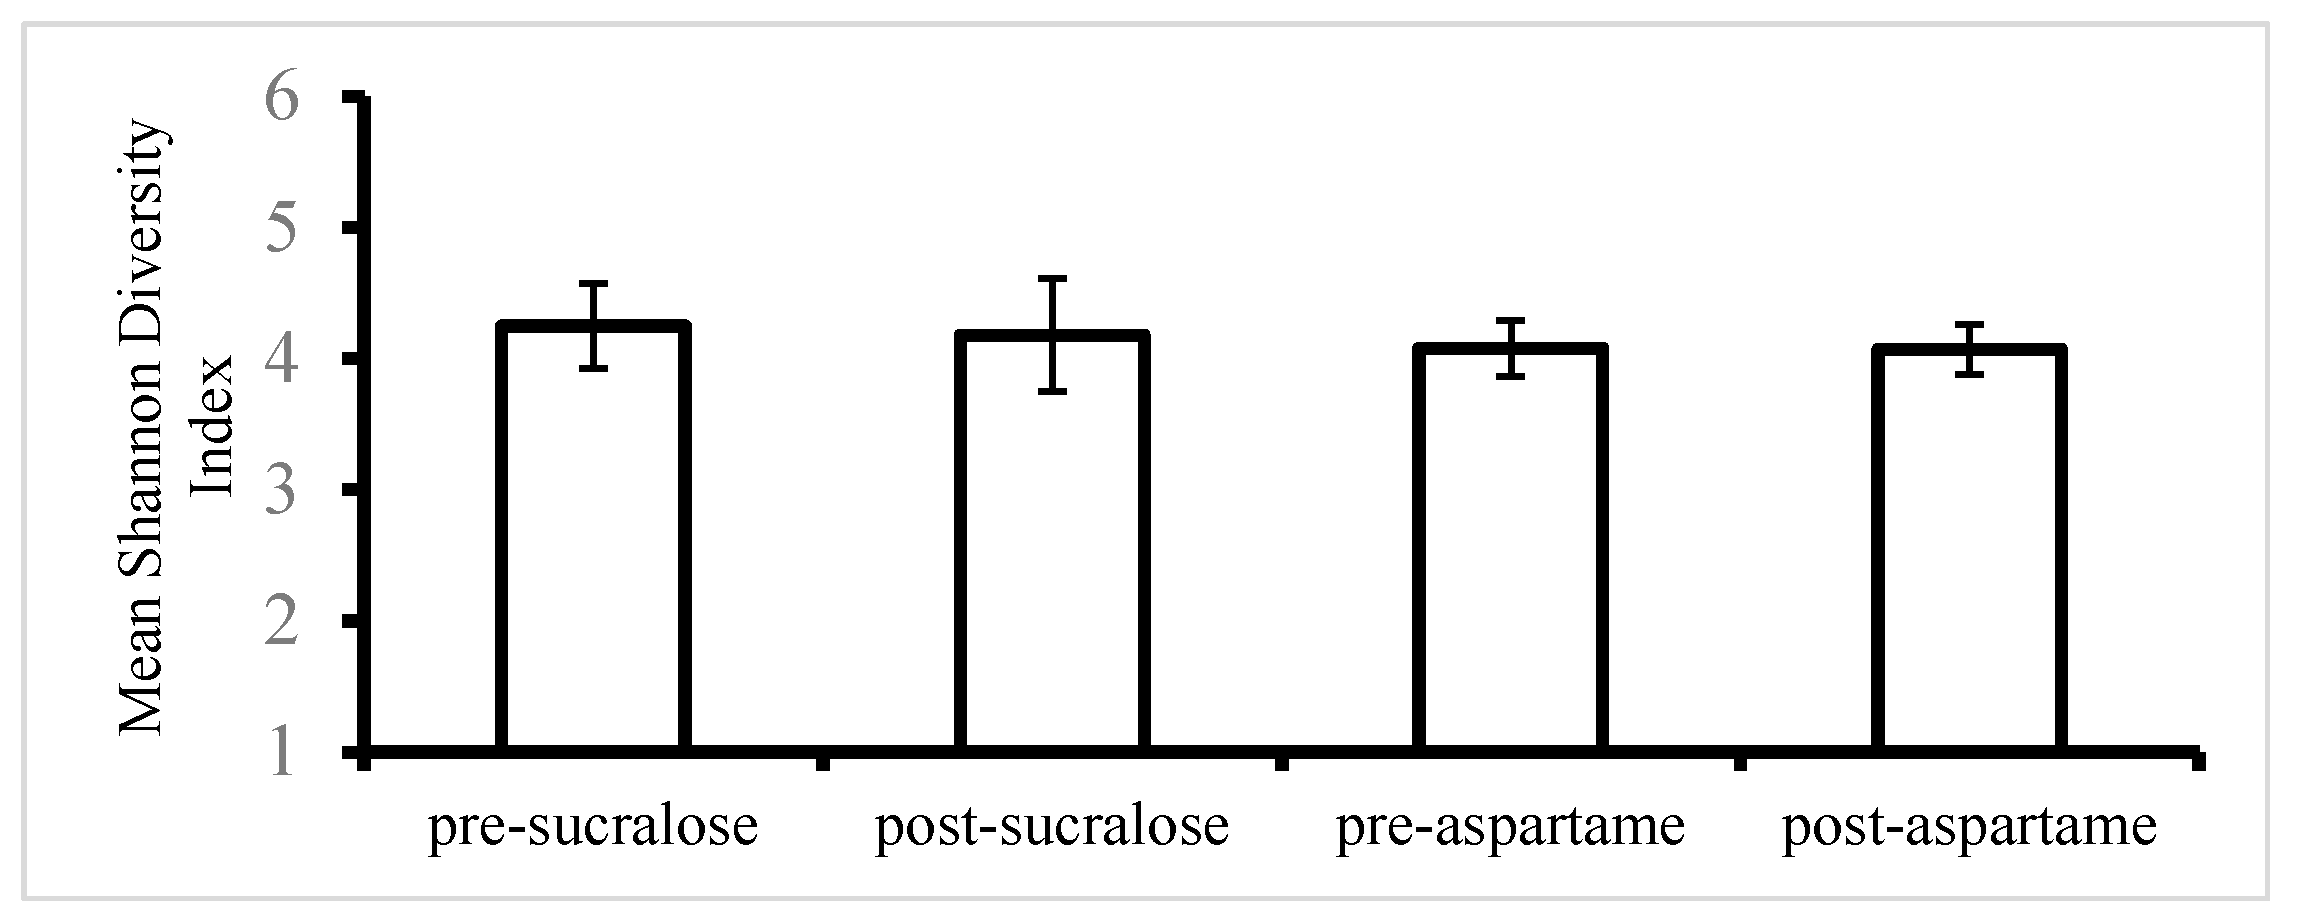
| Shannon index (alpha diversity) | 4.25 ± 0.79 | 4.18 ± 0.81 | −1.64 | 0.63 | 4.08 ± 0.82 | 4.07 ± 0.65 | −0.24 | 0.96 |
| ** | Phylum Genus | Pre-Treatment | Post-Treatment | p-Value | |||
|---|---|---|---|---|---|---|---|
| Sucralose | Aspartame | Sucralose | Aspartame | Sucralose | Aspartame | ||
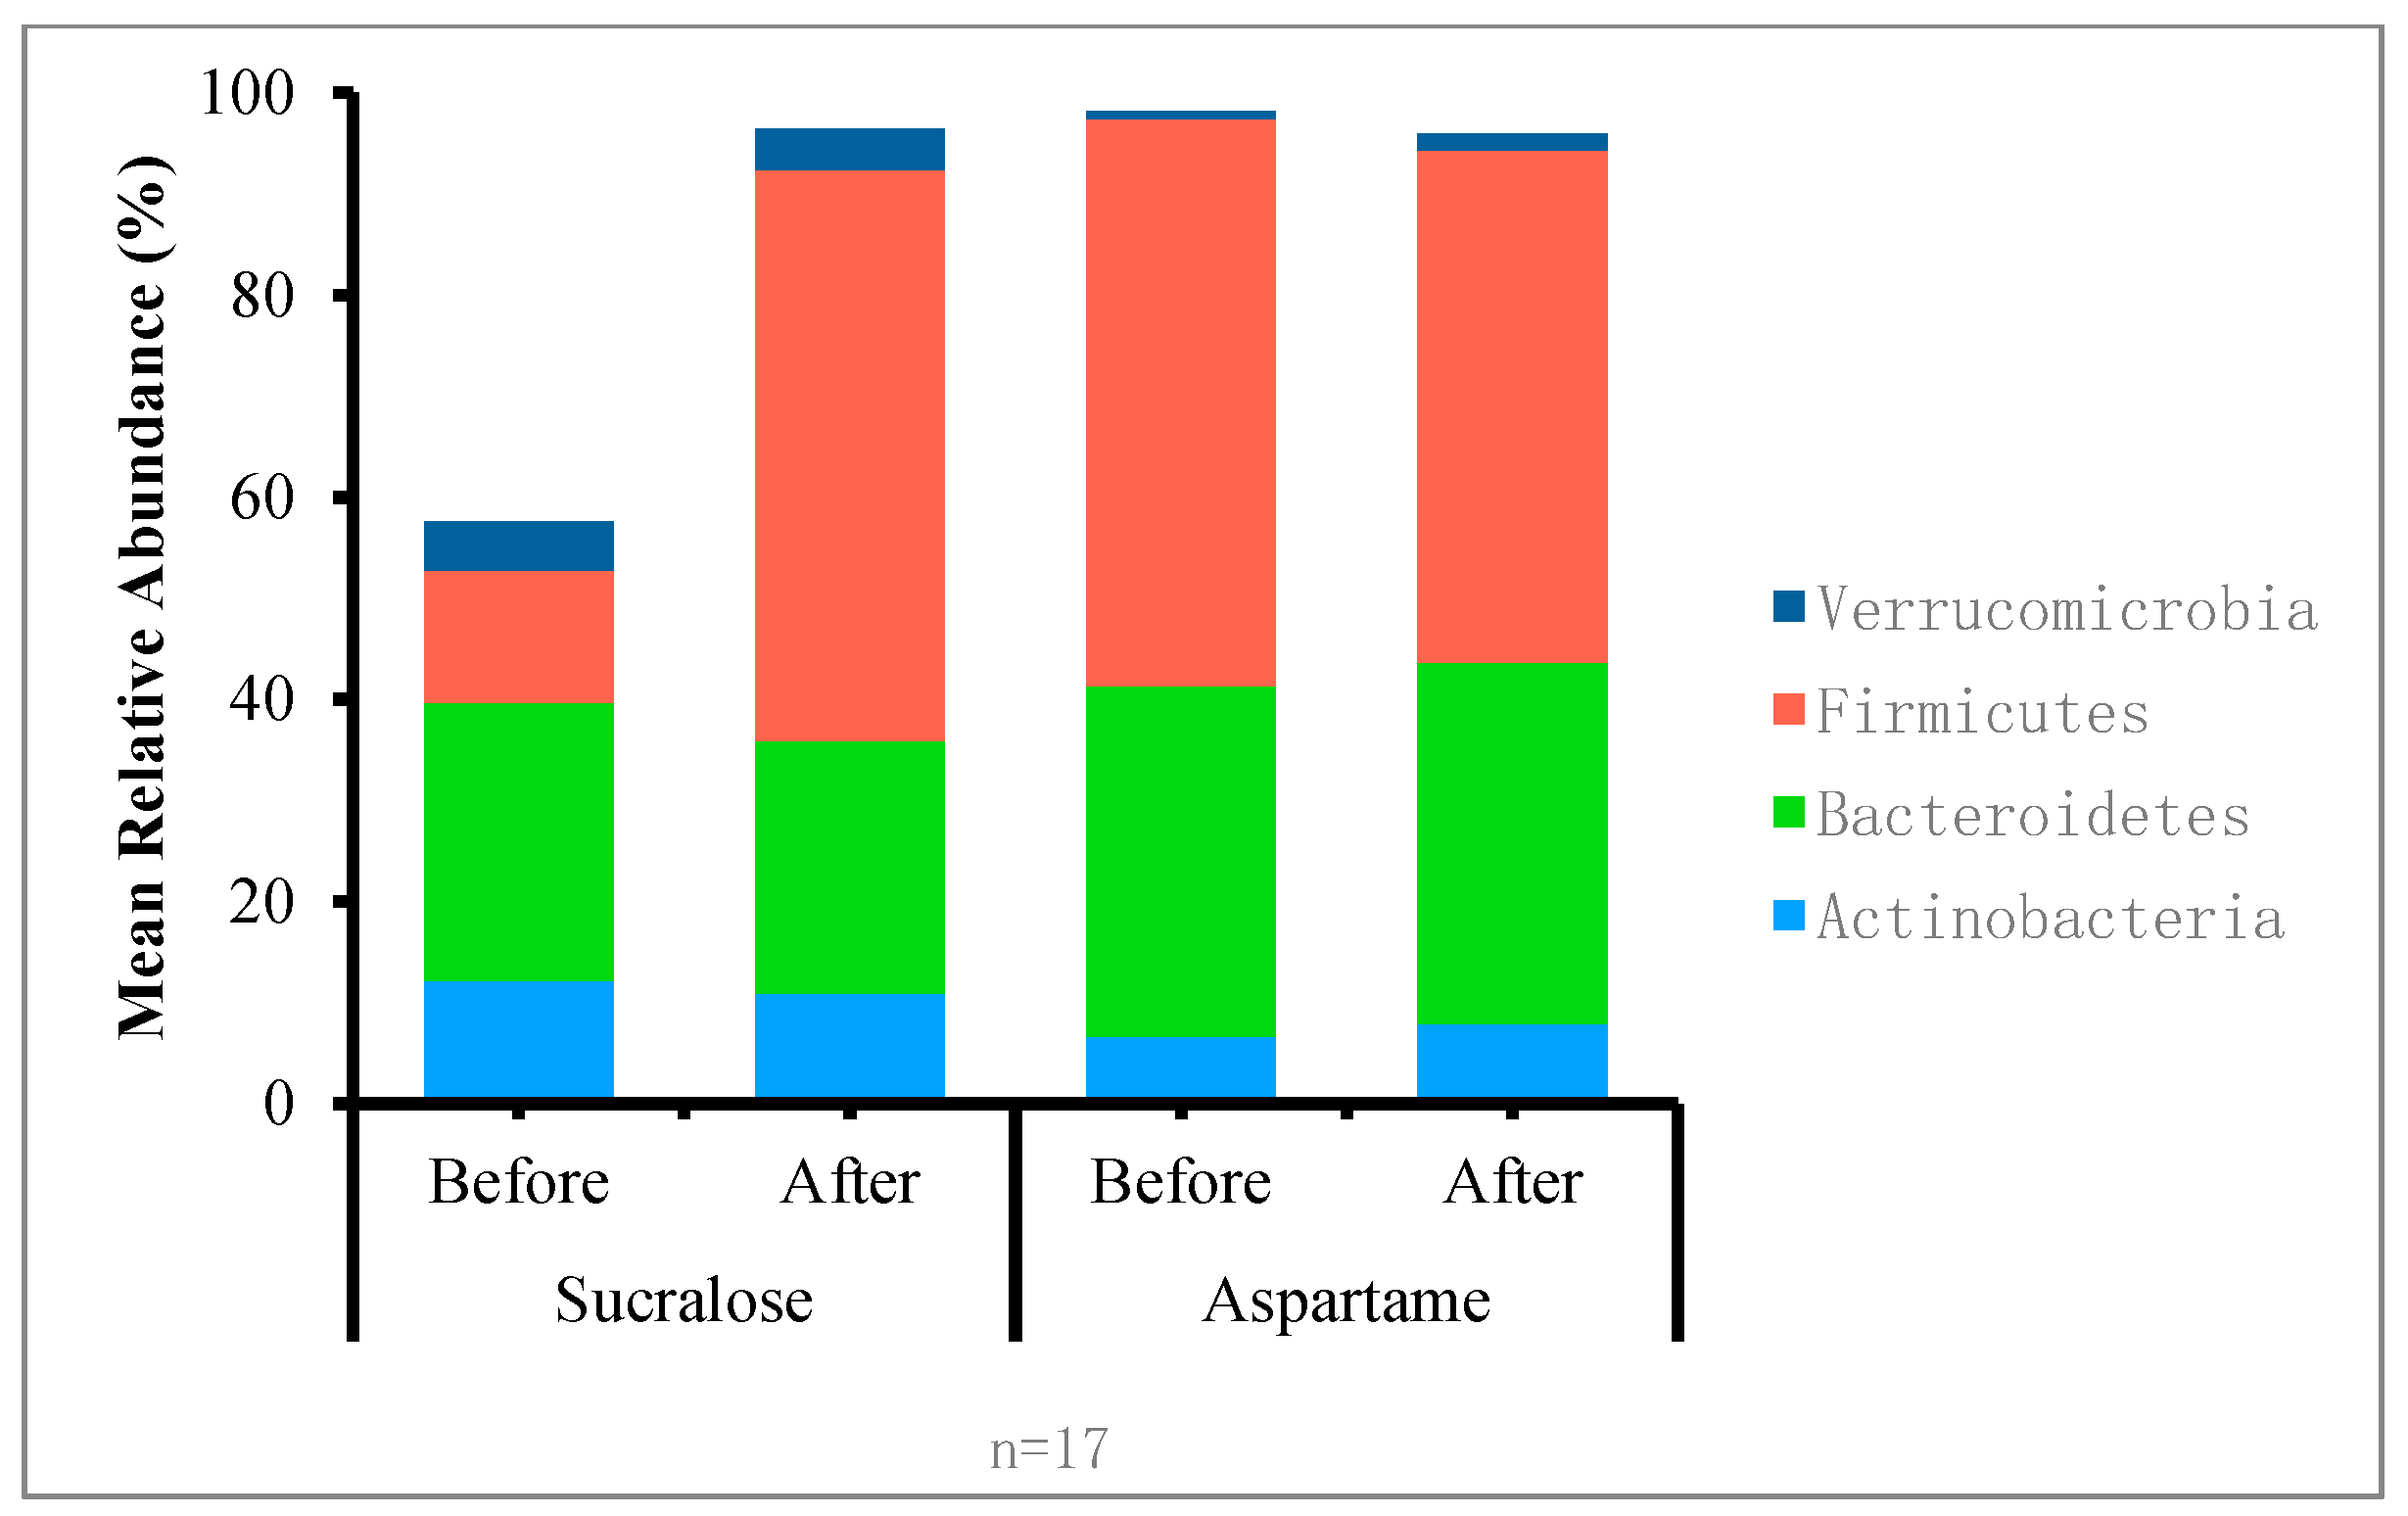
| Actinobacteria | 0.121 | 0.103 | 0.043 | 0.031 | 0.64 | 0.96 | |
| f__Clostridiaceae_ unclassified | 0.000 | 0.000 | 0.000 | 0.000 | 0.55 | 0.31 | |
| g__Bifidobacterium | 0.102 | 0.095 | 0.026 | 0.028 | 0.54 | 0.88 | |
| g__Collinsella | 0.010 | 0.009 | 0.008 | 0.005 | 0.96 | 0.72 | |
| g__Eggerthella | 0.000 | 0.000 | 0.000 | 0.000 | 0.80 | 0.31 | |
| g__Slackia | 0.000 | 0.000 | 0.000 | 0.000 | 0.78 | 0.89 | |
| Bacteroidetes | 0.131 | 0.215 | 0.374 | 0.409 | 0.61 | 0.92 | |
| g__[Prevotella] | 0.000 | 0.000 | 0.000 | 0.000 | 0.21 | 0.48 | |
| g__Alistipes | 0.003 | 0.009 | 0.013 | 0.013 | 0.23 | 0.68 | |
| g__Bacteroides | 0.035 | 0.053 | 0.075 | 0.098 | 0.29 | 0.96 | |
| g__Parabacteroides | 0.001 | 0.004 | 0.005 | 0.005 | 0.26 | 0.16 | |
| g__Prevotella | 0.028 | 0.019 | 0.101 | 0.014 | 0.35 | 0.47 | |
| Firmicutes | 0.517 | 0.548 | 0.533 | 0.530 | 0.18 | 0.54 | |
| F_Ruminococcaceae_ Unclassified | 0.036 | 0.028 | 0.027 | 0.027 | 0.30 | 0.15 | |
| g__Blautia | 0.075 | 0.077 | 0.099 | 0.087 | 0.88 | 0.64 | |
| g__Coprococcus | 0.036 | 0.043 | 0.033 | 0.024 | 0.96 | 0.76 | |
| g__Faecalibacterium | 0.026 | 0.024 | 0.066 | 0.033 | 0.41 | 0.10 | |
| G_Roseburia | 0.040 | 0.018 | 0.024 | 0.021 | 0.17 | 0.43 | |
| Verrucomicrobia | 0.000 | 0.000 | 0.000 | 0.000 | 0.92 | 0.44 | |
| g__Akkermansia | 0.000 | 0.000 | 0.000 | 0.000 | 0.92 | 0.44 | |
| Adonis Model 1 | R2 | p-Value |
|---|---|---|
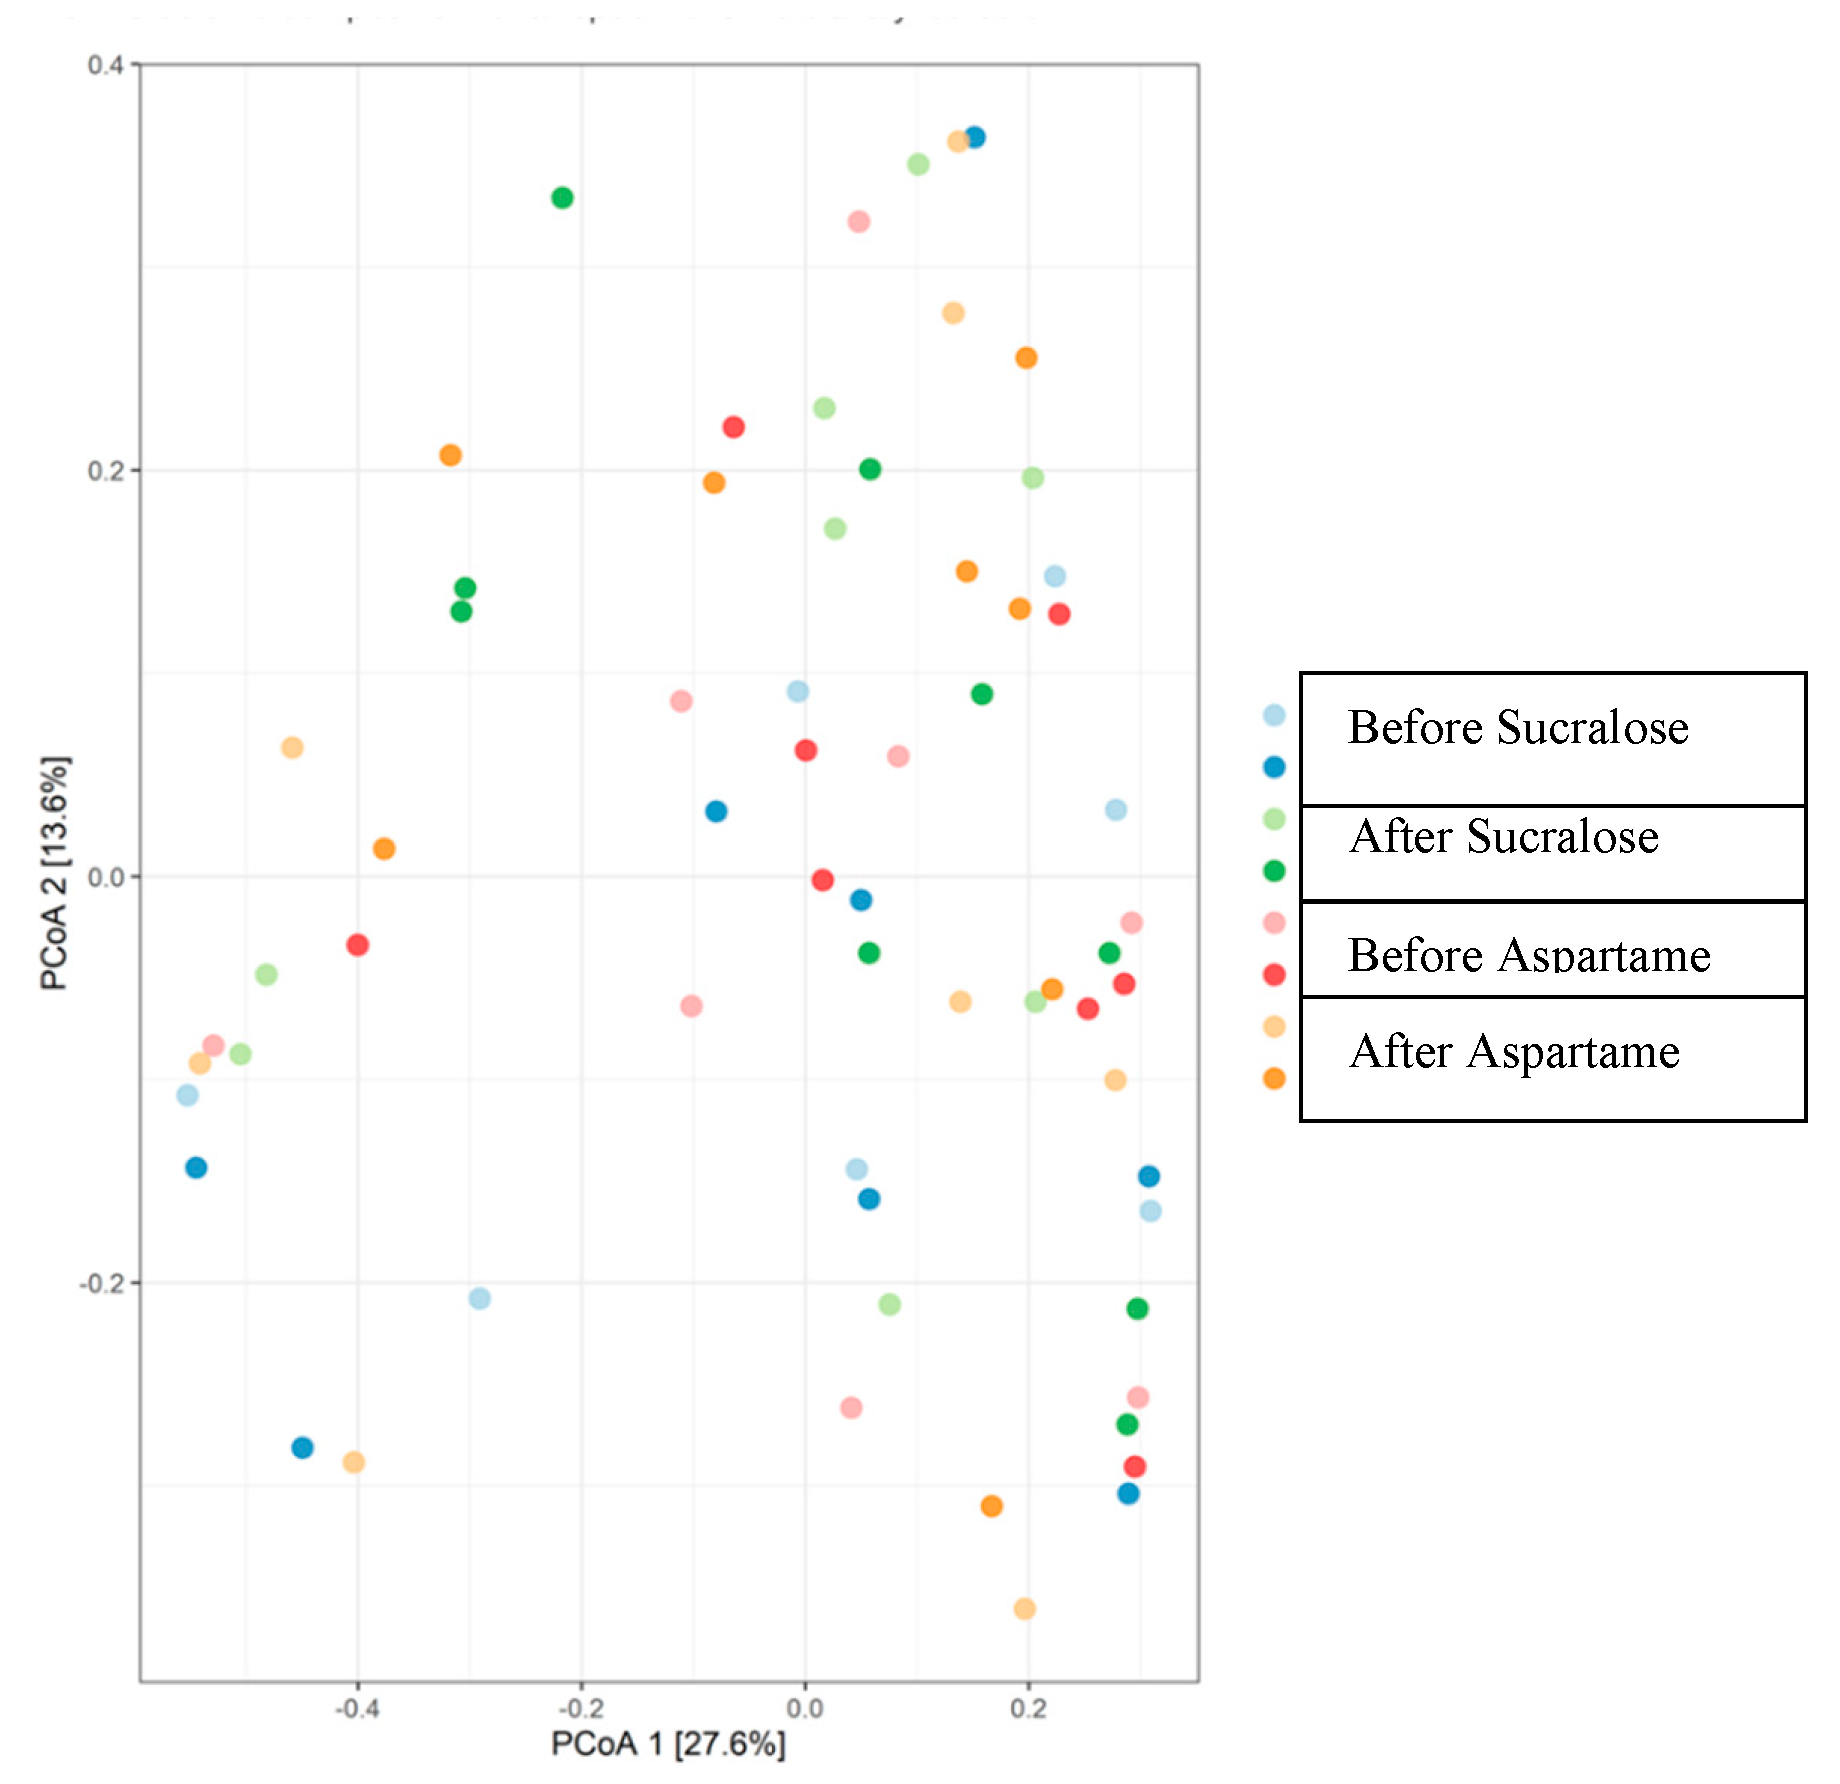
| Treatment | 0.012 | 0.99 |
| Sequence | 0.03 | 0.02 * |
| Period | 0.01 | 0.78 |
| Residuals | 0.94 | NA |
| Total | 1.00 | NA |
| SCFA Concentration (µmol SCFA/g Human Faeces) | Sucralose Treatment | Aspartame Treatment | ||||
|---|---|---|---|---|---|---|
| Pre-Sucralose | Post-Sucralose | p-Value * | Pre-Aspartame | Post-Aspartame | p-Value * | |
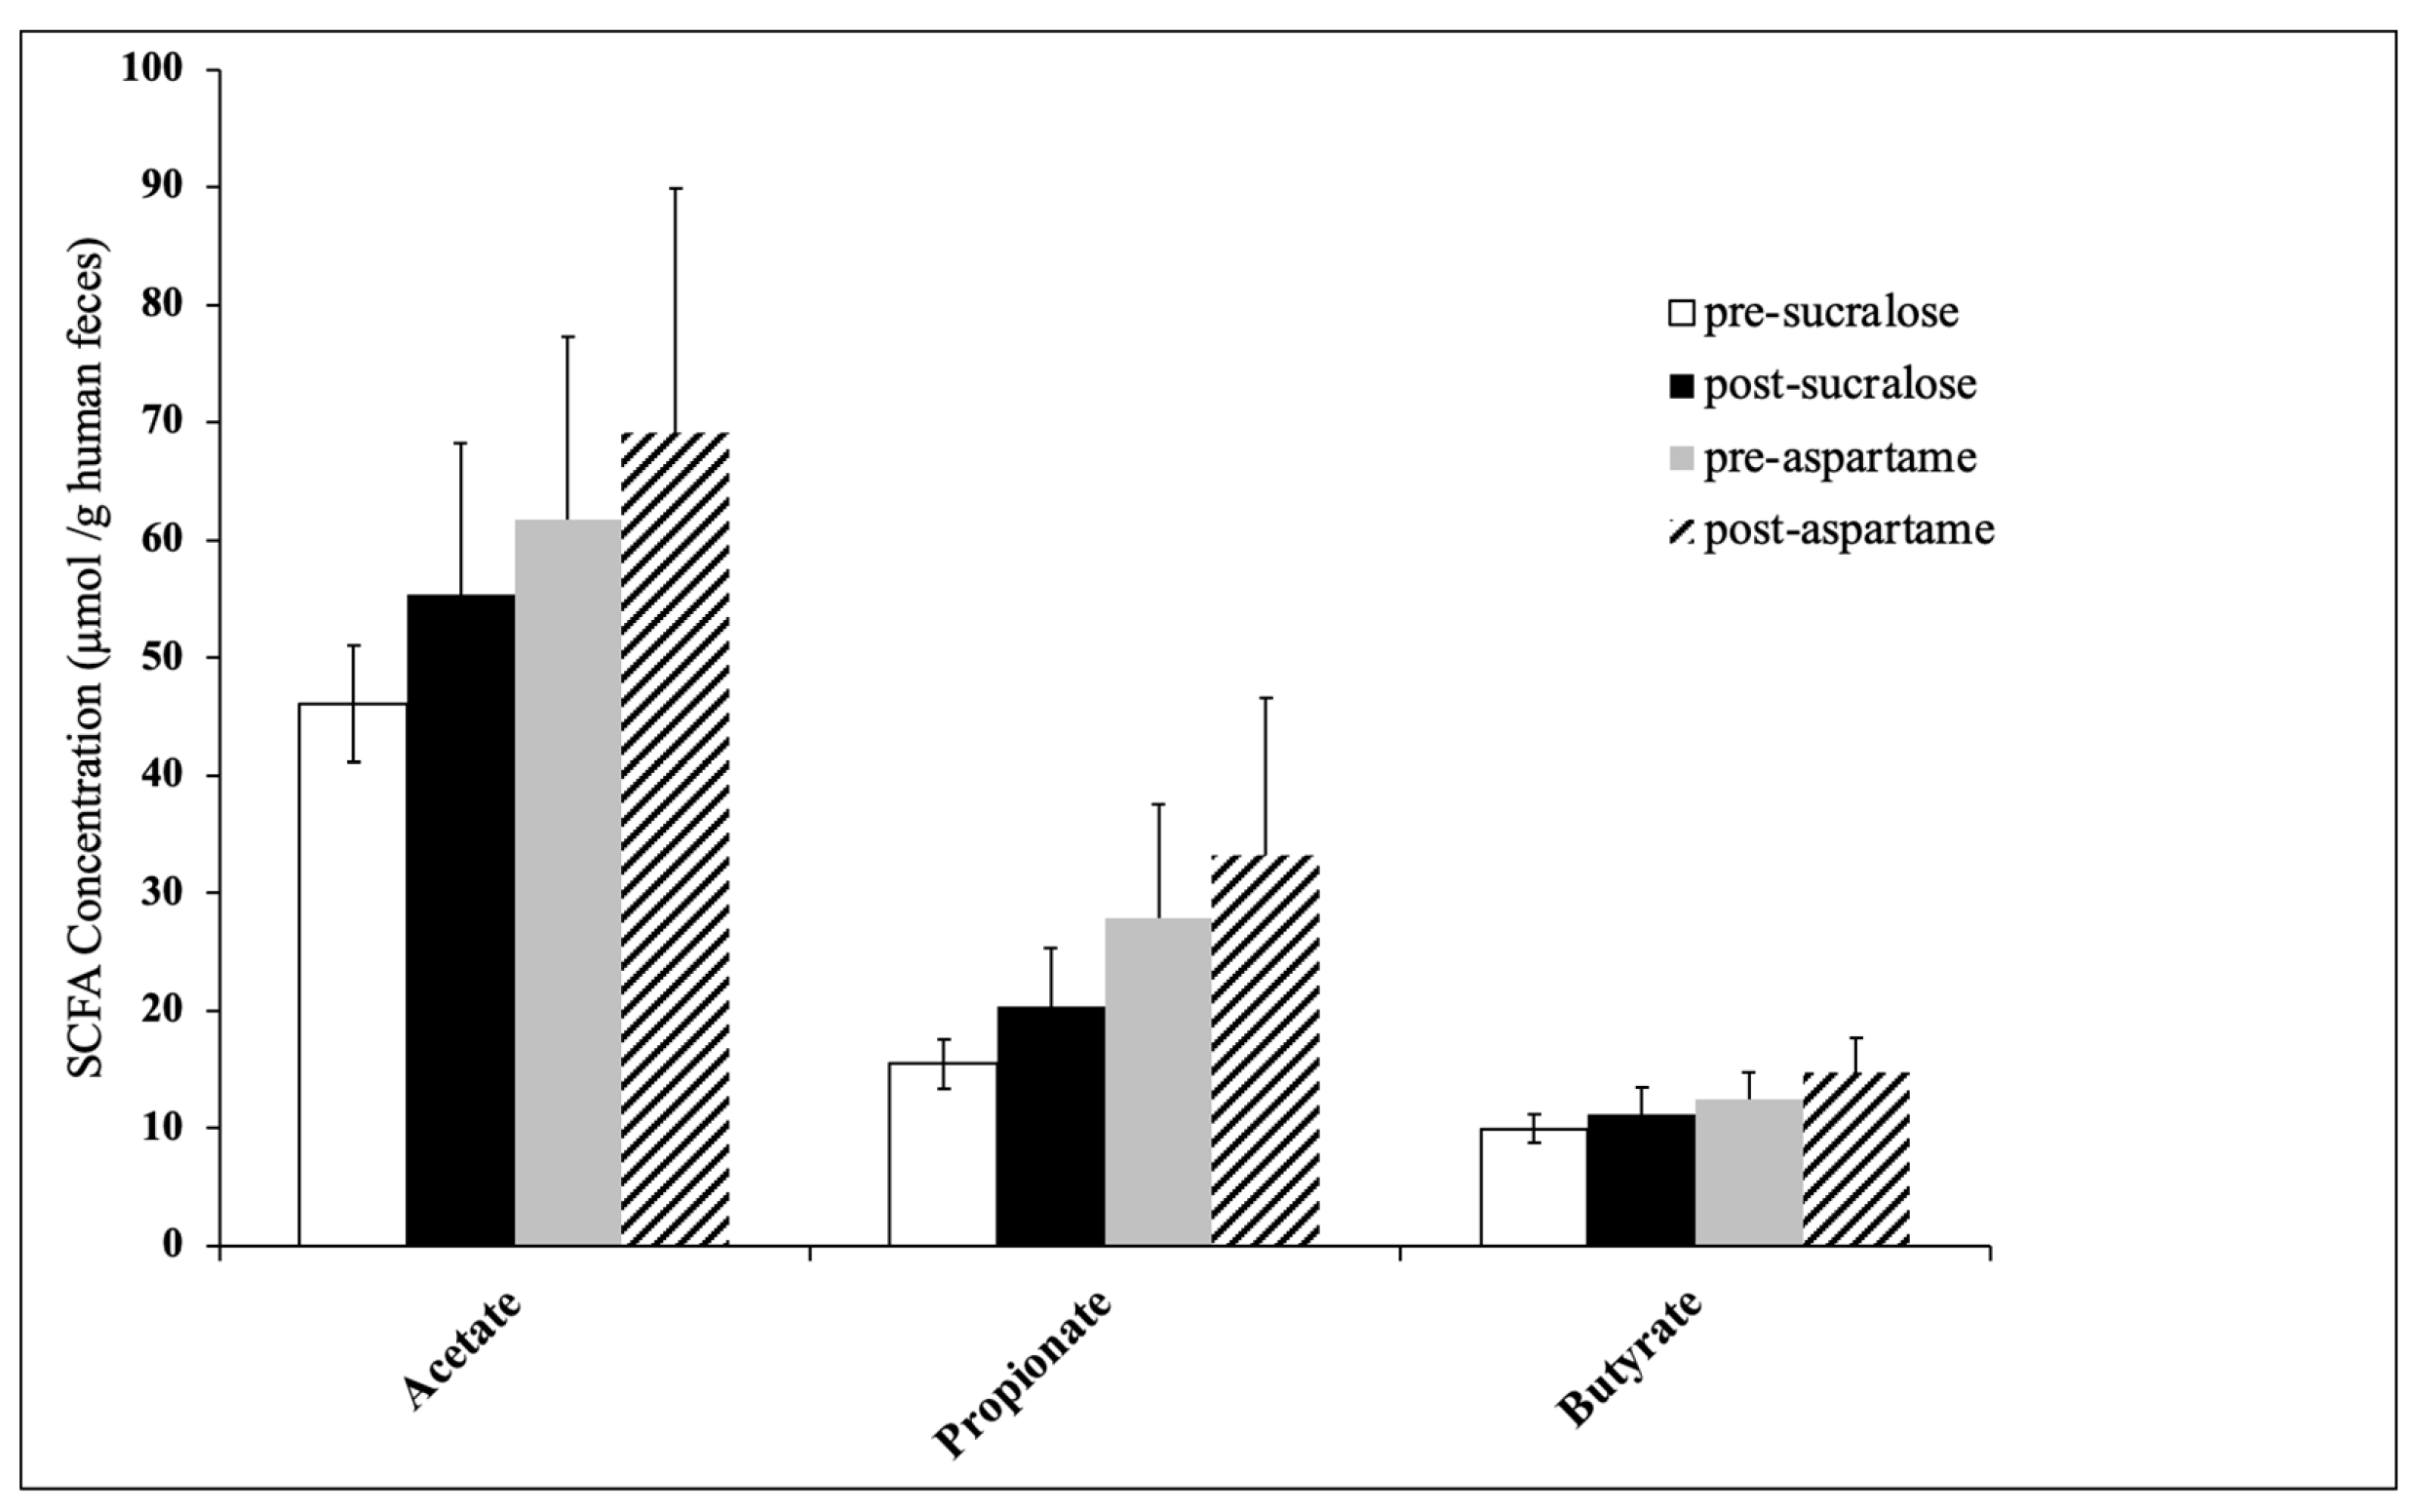
| Acetate | 46.13 ± 4.97 | 55.37 ± 12.92 | 0.49 | 61.76 ± 15.47 | 69.08 ± 20.84 | 0.79 |
| Propionate | 15.48 ± 2.11 | 20.35 ± 5.04 | 0.39 | 27.83 ± 9.69 | 33.24 ± 13.37 | 0.75 |
| Butyrate | 9.95 ± 1.21 | 11.17 ± 2.32 | 0.60 | 12.47 ± 2.34 | 14.78 ± 2.87 | 0.56 |
| Isovaleric acid | 2.01 ± 0.27 | 2.01 ± 0.33 | 0.99 | 2.67 ± 0.58 | 1.86 ± 0.25 | 0.14 |
| Valeric acid | 1.64 ± 0.36 | 1.38 ± 0.28 | 0.34 | 1.51 ± 0.35 | 2.80 ± 0.74 | 0.13 |
| Hexanoic acid | 0.30 ± 0.14 | 0.27 ± 0.08 | 0.78 | 0.31 ± 0.13 | 0.20 ± 0.08 | 0.38 |
Publisher’s Note: MDPI stays neutral with regard to jurisdictional claims in published maps and institutional affiliations. |
© 2020 by the authors. Licensee MDPI, Basel, Switzerland. This article is an open access article distributed under the terms and conditions of the Creative Commons Attribution (CC BY) license (http://creativecommons.org/licenses/by/4.0/).
Share and Cite
Ahmad, S.Y.; Friel, J.; Mackay, D. The Effects of Non-Nutritive Artificial Sweeteners, Aspartame and Sucralose, on the Gut Microbiome in Healthy Adults: Secondary Outcomes of a Randomized Double-Blinded Crossover Clinical Trial. Nutrients 2020, 12, 3408. https://doi.org/10.3390/nu12113408
Ahmad SY, Friel J, Mackay D. The Effects of Non-Nutritive Artificial Sweeteners, Aspartame and Sucralose, on the Gut Microbiome in Healthy Adults: Secondary Outcomes of a Randomized Double-Blinded Crossover Clinical Trial. Nutrients. 2020; 12(11):3408. https://doi.org/10.3390/nu12113408
Chicago/Turabian StyleAhmad, Samar Y., James Friel, and Dylan Mackay. 2020. "The Effects of Non-Nutritive Artificial Sweeteners, Aspartame and Sucralose, on the Gut Microbiome in Healthy Adults: Secondary Outcomes of a Randomized Double-Blinded Crossover Clinical Trial" Nutrients 12, no. 11: 3408. https://doi.org/10.3390/nu12113408
APA StyleAhmad, S. Y., Friel, J., & Mackay, D. (2020). The Effects of Non-Nutritive Artificial Sweeteners, Aspartame and Sucralose, on the Gut Microbiome in Healthy Adults: Secondary Outcomes of a Randomized Double-Blinded Crossover Clinical Trial. Nutrients, 12(11), 3408. https://doi.org/10.3390/nu12113408