The Impact of Amino Acids on Postprandial Glucose and Insulin Kinetics in Humans: A Quantitative Overview

 ,
,  ,
,  and
and
Abstract
1. Introduction
2. Materials and Methods
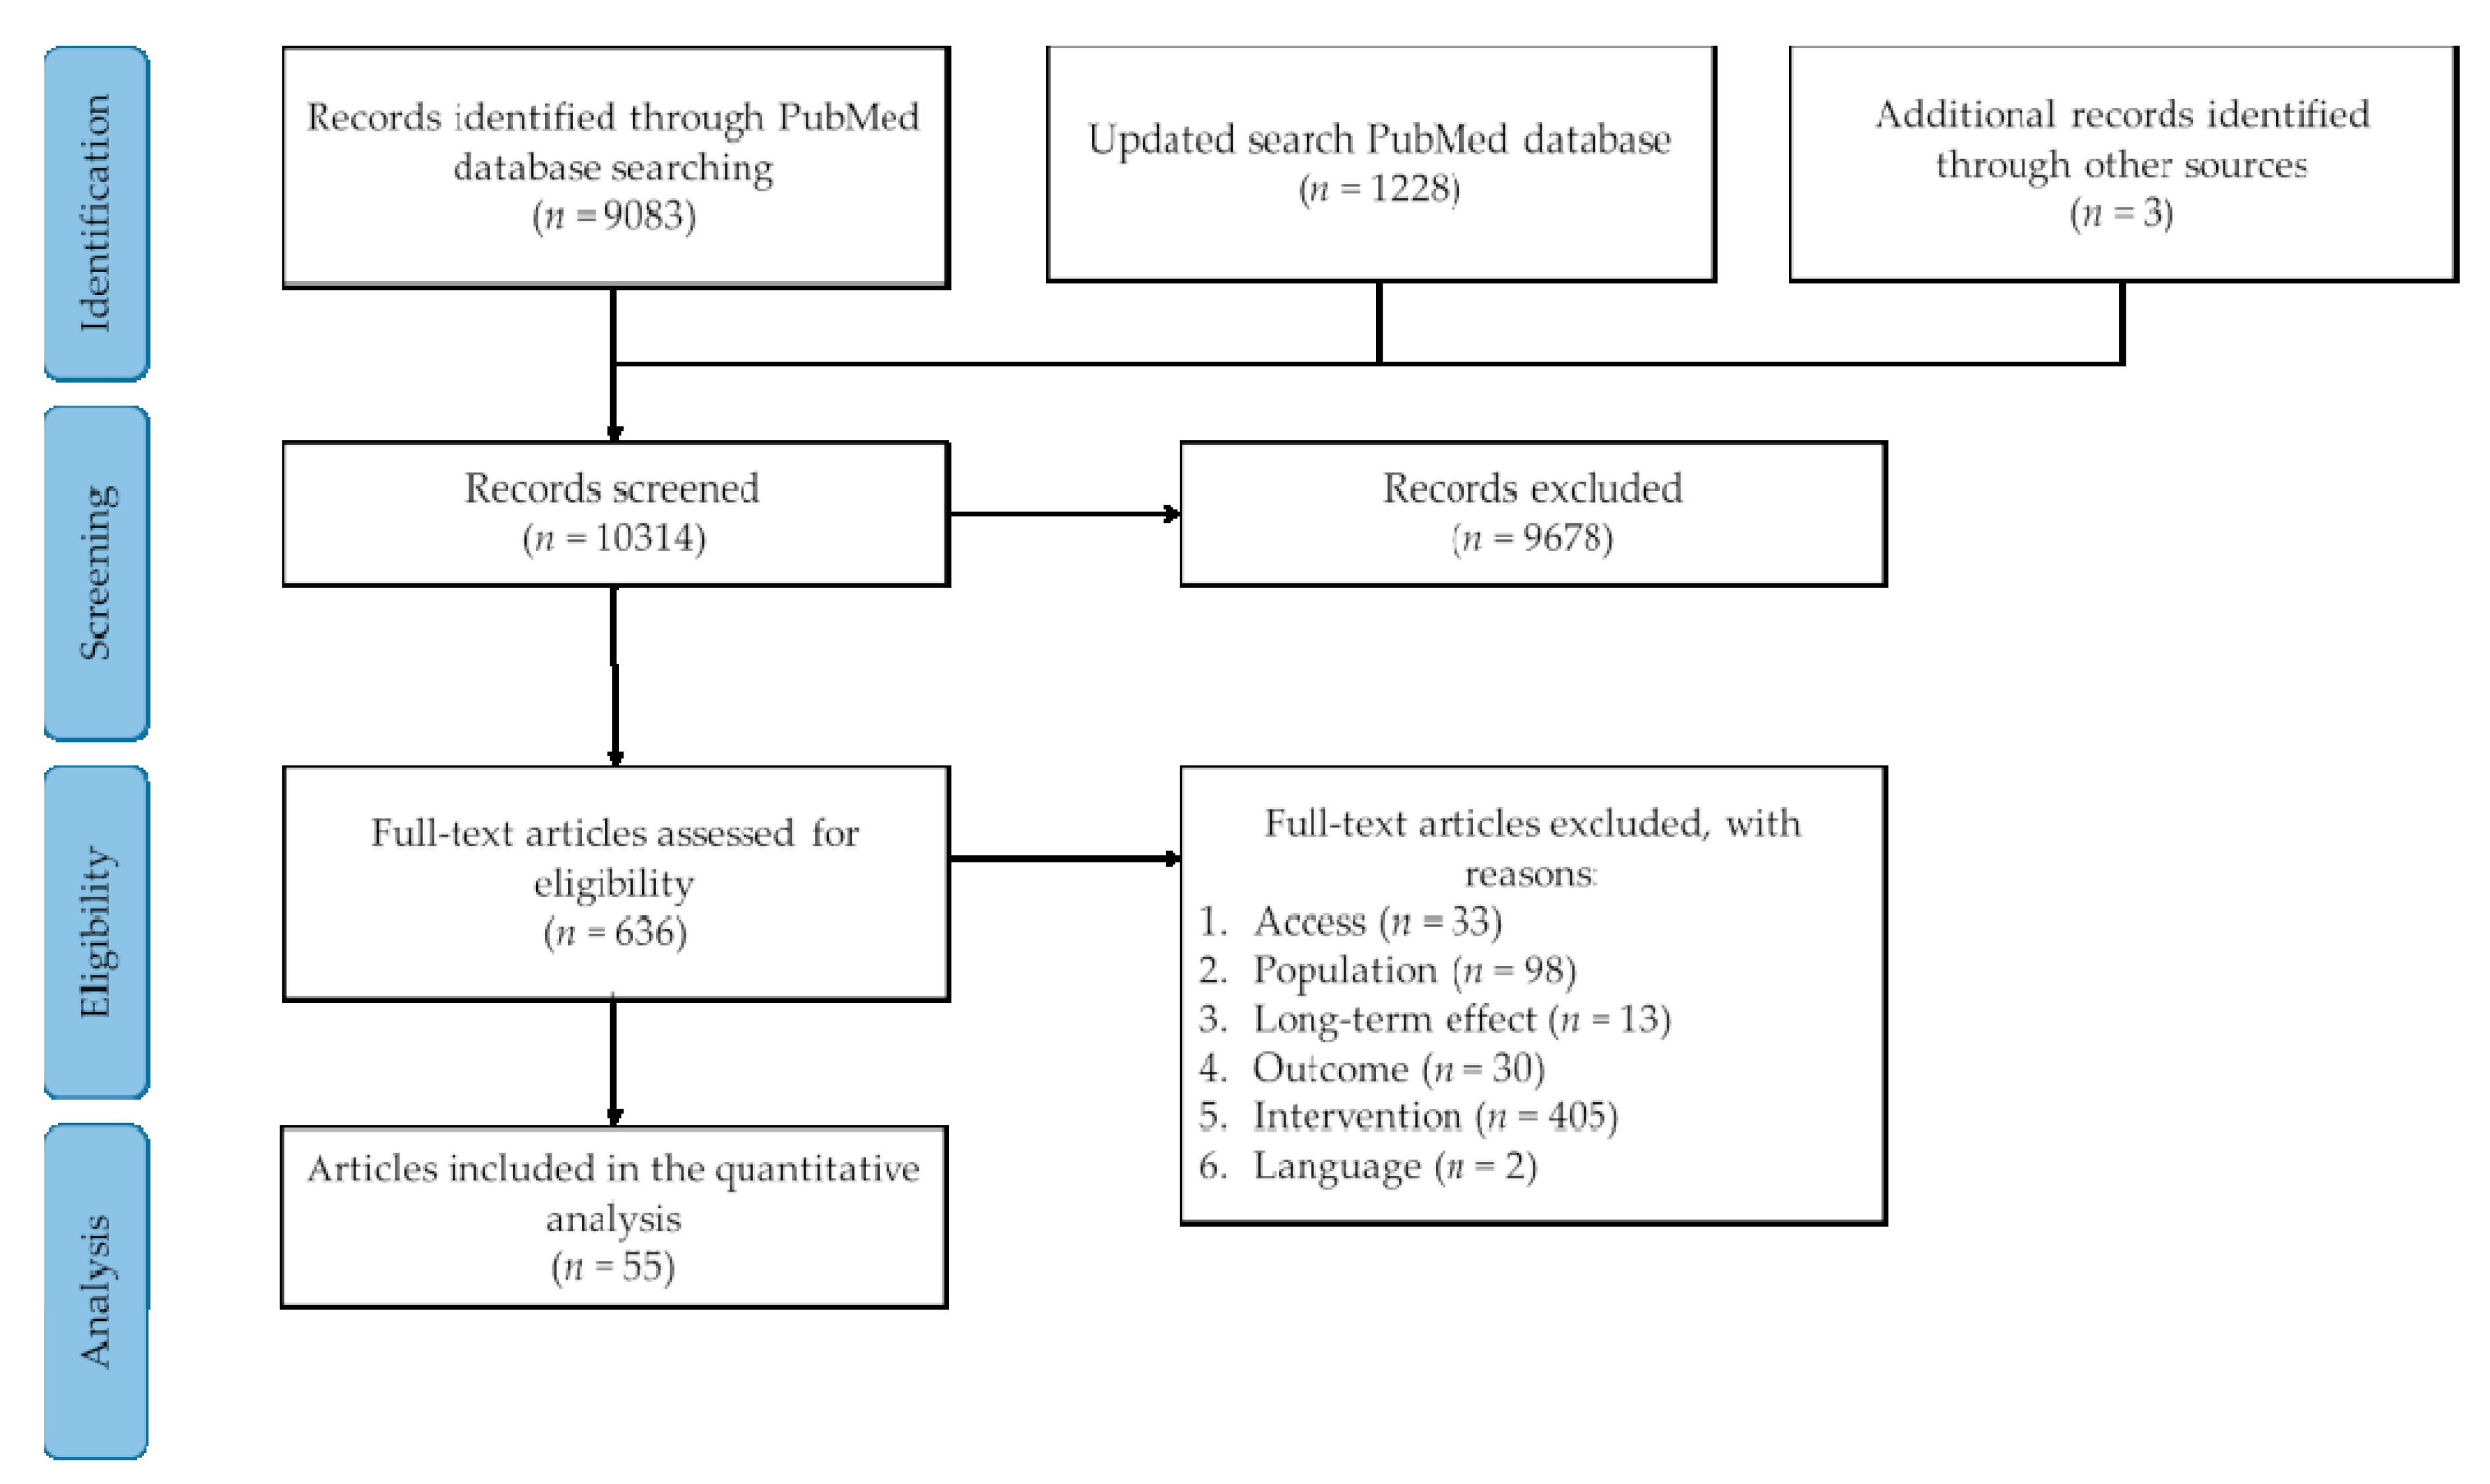
2.1. Search Strategy
2.2. Selection Criteria
2.3. Data Extraction
2.4. Data Processing
3. Results
3.1. Literature Search
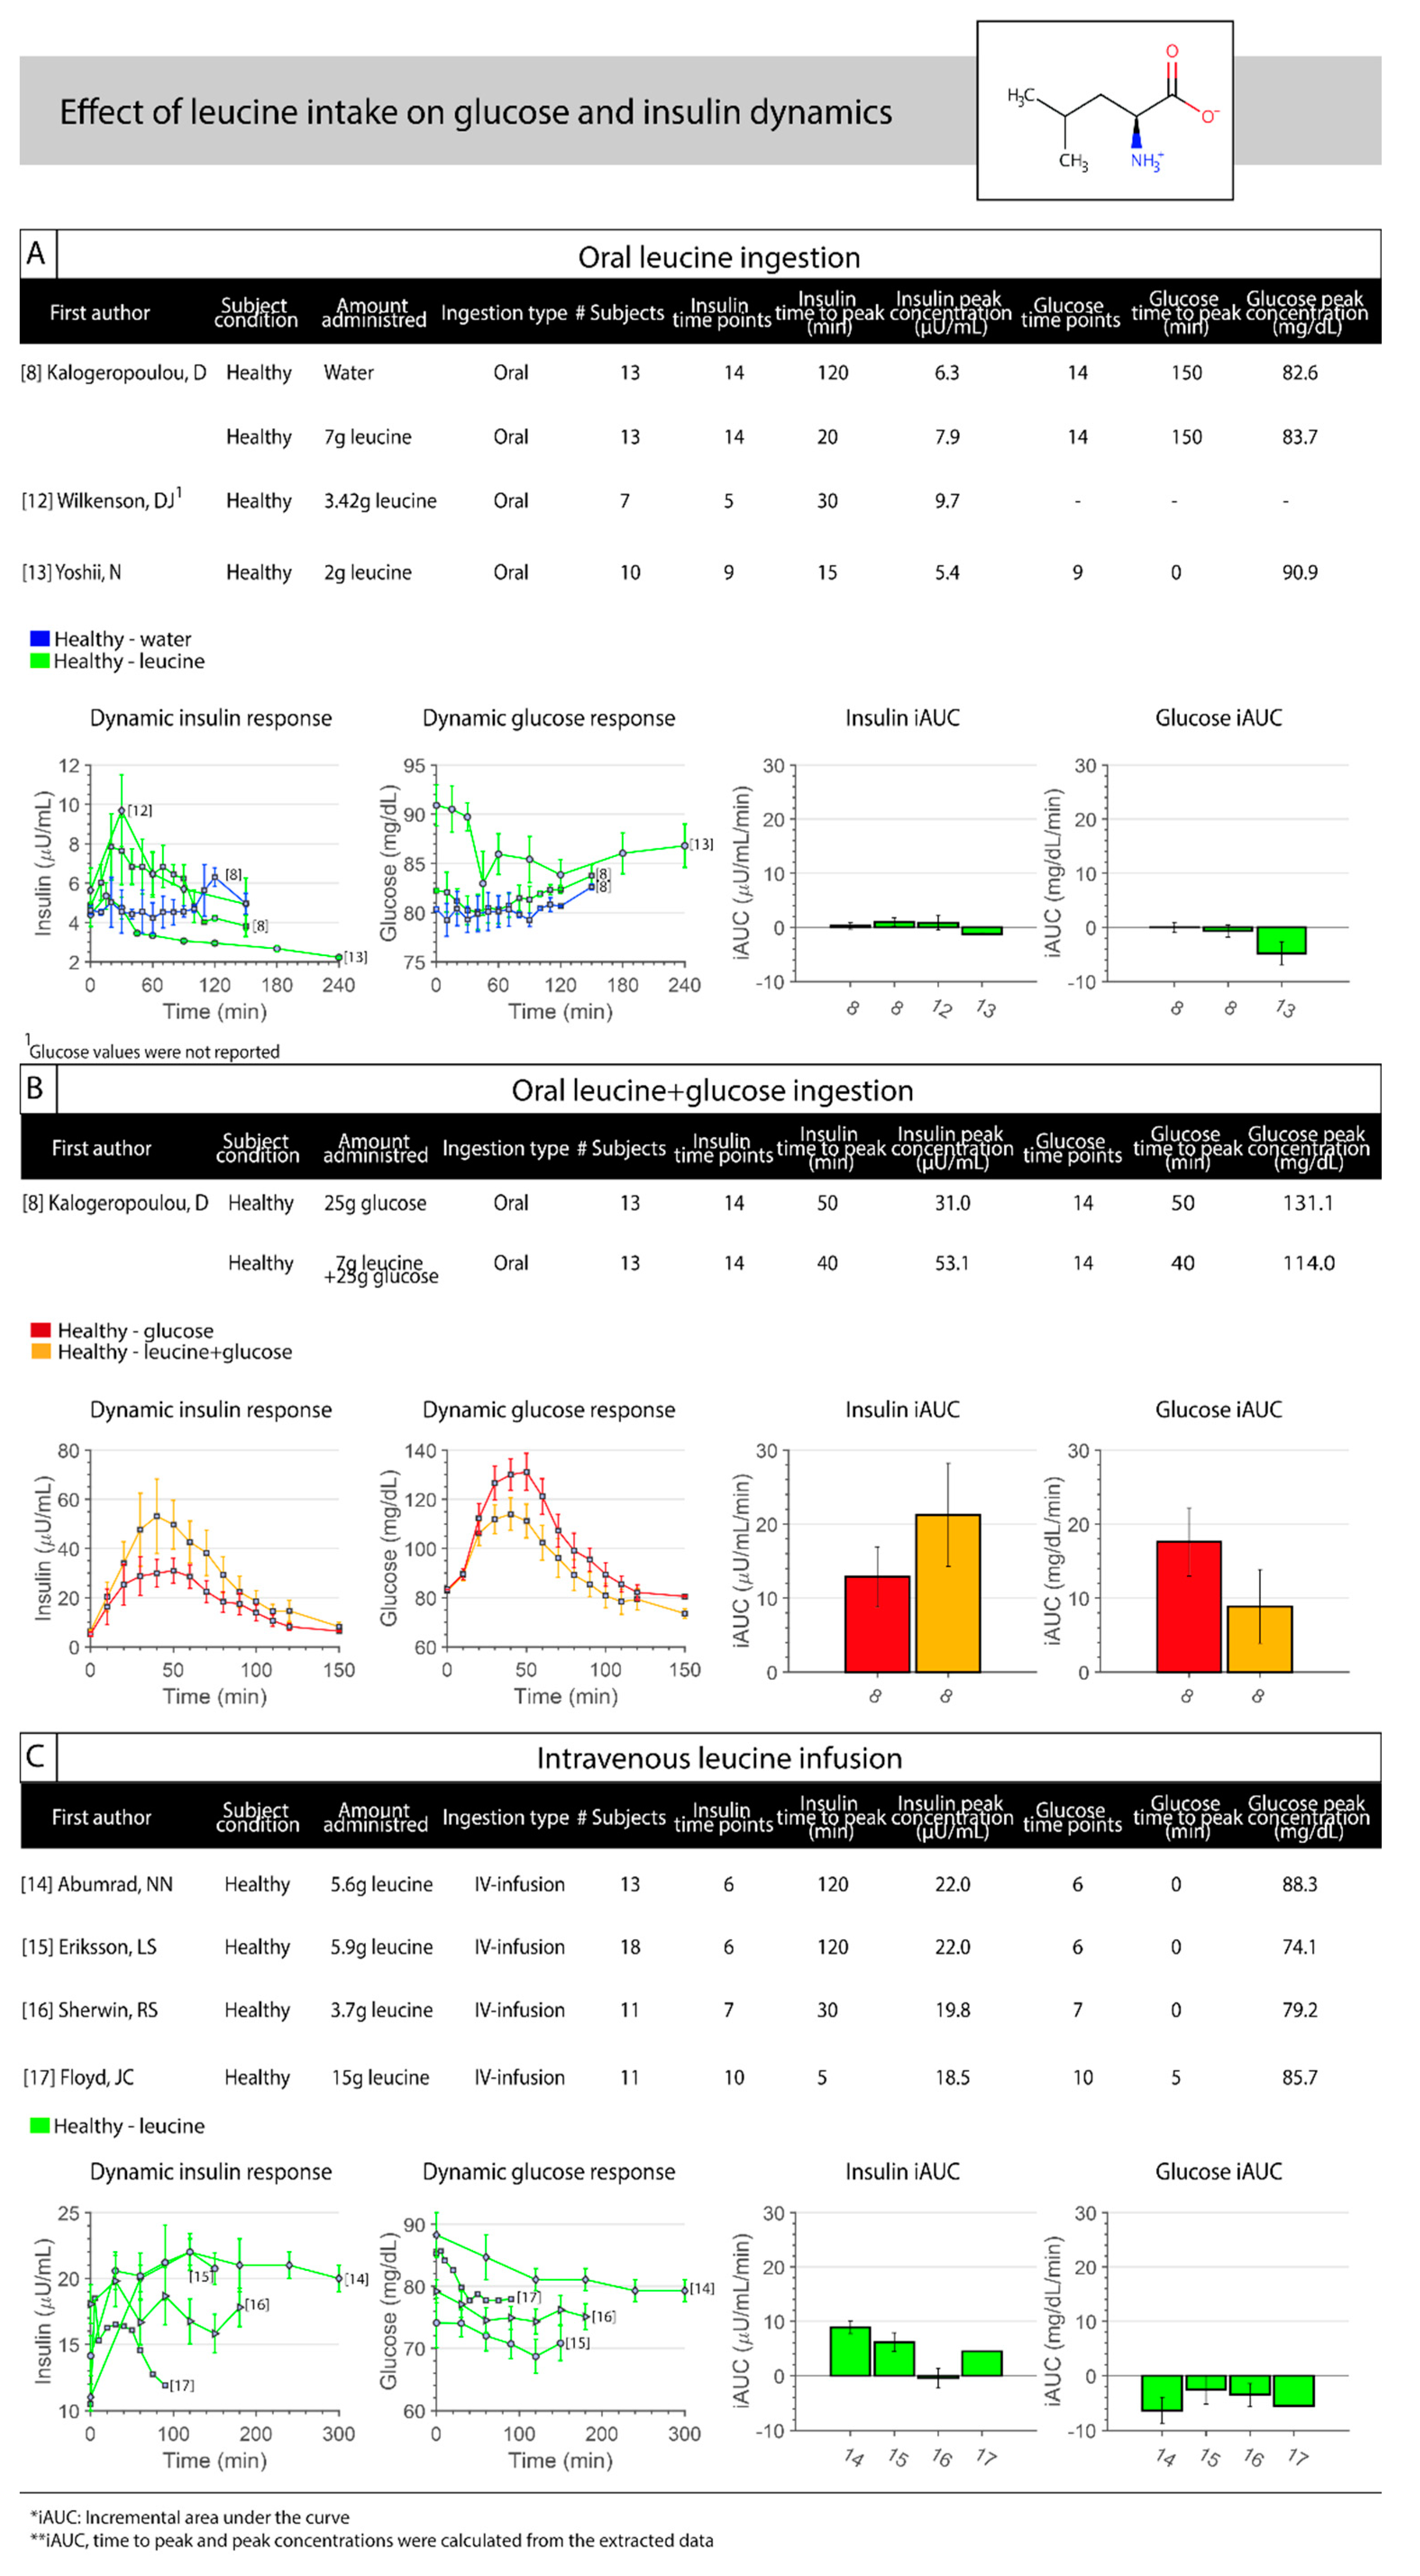
3.2. Leucine
3.3. Isoleucine
3.4. Alanine
3.5. Glutamine
3.6. Arginine
3.7. Lysine
3.8. Glycine
3.9. Proline
3.10. Phenylalanine
3.11. Glutamate
3.12. Branched-Chain Amino Acids
4. Discussion
Supplementary Materials
Author Contributions
Funding
Conflicts of Interest
References
- Pena, M.J.; Rocha, J.C.; Borges, N. Amino acids, glucose metabolism and clinical relevance for phenylketonuria management. Ann. Nutr. Disord. Ther. 2015, 2, 1026. [Google Scholar]
- Röder, P.V.; Wu, B.; Liu, Y.; Han, W. Pancreatic regulation of glucose homeostasis. Exp. Mol. Med. 2016, 48, e219. [Google Scholar] [CrossRef] [PubMed]
- Bröer, S.; Bröer, A. Amino acid homeostasis and signalling in mammalian cells and organisms. Biochem. J. 2017, 474, 1935–1963. [Google Scholar] [CrossRef] [PubMed]
- Newsholme, P.; Krause, M. Nutritional regulation of insulin secretion: Implications for diabetes. Clin. Biochem. Rev. 2012, 33, 35. [Google Scholar] [PubMed]
- Floyd, J.; Fajans, S.S.; Conn, J.W.; Knopf, R.F.; Rull, J. Stimulation of insulin secretion by amino acids. J. Clin. Investig. 1966, 45, 1487–1502. [Google Scholar] [CrossRef]
- Floyd, J.C.; Fajans, S.S.; Pek, S.; Thiffault, C.A.; Knopf, R.F.; Conn, J.W. Synergistic effect of essential amino acids and glucose upon insulin secretion in man. Diabetes 1970, 19, 109–115. [Google Scholar] [CrossRef]
- Nilsson, M.; Holst, J.J.; Björck, I.M. Metabolic effects of amino acid mixtures and whey protein in healthy subjects: Studies using glucose-equivalent drinks. Am. J. Clin. Nutr. 2007, 85, 996–1004. [Google Scholar] [CrossRef]
- Kalogeropoulou, D.; LaFave, L.; Schweim, K.; Gannon, M.C.; Nuttall, F.Q. Leucine, when ingested with glucose, synergistically stimulates insulin secretion and lowers blood glucose. Metab. Clin. Exp. 2008, 57, 1747–1752. [Google Scholar] [CrossRef]
- van Loon, L.J.; Kruijshoop, M.; Menheere, P.P.; Wagenmakers, A.J.; Saris, W.H.; Keizer, H.A. Amino acid ingestion strongly enhances insulin secretion in patients with long-term type 2 diabetes. Diabetes Care 2003, 26, 625–630. [Google Scholar] [CrossRef]
- Kovatchev, B.P.; Breton, M.; Man, C.D.; Cobelli, C. In silico preclinical trials: A proof of concept in closed-loop control of type 1 diabetes. J. Diabetes Sci. Technol. 2009, 3, 44–55. [Google Scholar] [CrossRef]
- MATLAB. R2018b; The MathWorks Inc.: Natick, MA, USA, 2018. [Google Scholar]
- Wilkinson, D.J.; Hossain, T.; Hill, D.; Phillips, B.; Crossland, H.; Williams, J.; Loughna, P.; Churchward-Venne, T.; Breen, L.; Phillips, S.M. Effects of leucine and its metabolite β-hydroxy-β-methylbutyrate on human skeletal muscle protein metabolism. J. Physiol. 2013, 591, 2911–2923. [Google Scholar] [CrossRef] [PubMed]
- Yoshii, N.; Sato, K.; Ogasawara, R.; Nishimura, Y.; Shinohara, Y.; Fujita, S. Effect of Mixed Meal and Leucine Intake on Plasma Amino Acid Concentrations in Young Men. Nutrients 2018, 10, 1543. [Google Scholar] [CrossRef] [PubMed]
- Abumrad, N.N.; Robinson, R.P.; Gooch, B.R.; Lacy, W. The effect of leucine infusion on substrate flux across the human forearm. J. Surg. Res. 1982, 32, 453–463. [Google Scholar] [CrossRef]
- Eriksson, L.S.; Hagenfeldt, L.; Felig, P.; Wahren, J. Leucine uptake by splanchnic and leg tissues in man: Relative independence of insulin levels. Clin. Sci. 1983, 65, 491–498. [Google Scholar] [CrossRef] [PubMed]
- Sherwin, R.S. Effect of starvation on the turnover and metabolic response to leucine. J. Clin. Investig. 1978, 61, 1471–1481. [Google Scholar] [CrossRef] [PubMed]
- Floyd, J.C., Jr.; Fajans, S.S.; Pek, S.; Thiffault, C.A.; Knopf, R.F.; Conn, J.W. Synergistic effect of certain amino acid pairs upon insulin secretion in man. Diabetes 1970, 19, 102–108. [Google Scholar] [CrossRef]
- Nuttall, F.Q.; Schweim, K.; Gannon, M.C. Effect of orally administered isoleucine with and without glucose on insulin, glucagon and glucose concentrations in non-diabetic subjects. Eur. J. Clin. Nutr. Metab. 2008, 3, e152–e158. [Google Scholar] [CrossRef]
- Rossini, A.A.; Aoki, T.T.; Ganda, O.P.; Soeldner, J.S.; Cahill, G.F., Jr. Alanine-induced amino acid interrelationships. Metabolism 1975, 24, 1185–1192. [Google Scholar] [CrossRef]
- Rose, D.P.; Leklem, J.E.; Fardal, L.; Baron, R.B.; Shrago, E. Effect of oral alanine loads on the serum triglycerides of oral contraceptive users and normal subjects. Am. J. Clin. Nutr. 1977, 30, 691–694. [Google Scholar] [CrossRef]
- Sato, T.; Saito, S.; Kokubun, M.; Saito, T.; Ito, M.; Yamamoto, M.; Kaise, K.; Kaise, N. Gluconeogenesis from glycerol and alanine in thyrotoxicosis. Tohoku J. Exp. Med. 1980, 132, 369–373. [Google Scholar] [CrossRef]
- Genuth, S.M.; Castro, J. Effect of oral alanine on blood beta-hydroxybutyrate and plasma glucose, insulin, free fatty acids, and growth hormone in normal and diabetic subjects. Metabolism 1974, 23, 375–386. [Google Scholar] [CrossRef]
- Genuth, S.M. Effects of oral alanine administration in fasting obese subjects. Metabolism 1973, 22, 927–937. [Google Scholar] [CrossRef]
- Asano, T.; Ninomiya, H.; Kan, K.; Yamamoto, T.; Okumura, M. Plasma glucagon response to intravenous alanine in obese and non-obese subjects. Endocrinol. Jpn. 1989, 36, 767–773. [Google Scholar] [CrossRef] [PubMed]
- Greenfield, J.R.; Farooqi, I.S.; Keogh, J.M.; Henning, E.; Habib, A.M.; Blackwood, A.; Reimann, F.; Holst, J.J.; Gribble, F.M. Oral glutamine increases circulating glucagon-like peptide 1, glucagon, and insulin concentrations in lean, obese, and type 2 diabetic subjects. Am. J. Clin. Nutr. 2008, 89, 106–113. [Google Scholar] [CrossRef] [PubMed]
- Gannon, M.C.; Nuttall, J.A.; Nuttall, F.Q. Oral arginine does not stimulate an increase in insulin concentration but delays glucose disposal. Am. J. Clin. Nutr. 2002, 76, 1016–1022. [Google Scholar] [CrossRef]
- Tang, Z.Q.; Wu, T.; Cui, S.W.; Zhu, X.H.; Yin, T.; Wang, C.F.; Zhu, J.Y.; Wu, A.J. Stimulation of insulin secretion by large-dose oral arginine administration in healthy adults. Exp. Ther. Med. 2013, 6, 248–252. [Google Scholar] [CrossRef]
- Giugliano, D.; Marfella, R.; Verrazzo, G.; Acampora, R.; Coppola, L.; Cozzolino, D.; D’Onofrio, F. The vascular effects of L-Arginine in humans. The role of endogenous insulin. J. Clin. Investig. 1997, 99, 433–438. [Google Scholar] [CrossRef]
- Coiro, V.; Volpi, R.; Capretti, L.; Speroni, G.; Caffarri, G.; Chiodera, P. Involvement of nitric oxide in arginine, but not glucose, induced insulin secretion in normal men. Clin. Endocrinol. 1997, 46, 115–119. [Google Scholar] [CrossRef]
- Broglio, F.; Gottero, C.; Benso, A.; Prodam, F.; Destefanis, S.; Gauna, C.; Maccario, M.; Deghenghi, R.; van der Lely, A.; Ghigo, E. Effects of ghrelin on the insulin and glycemic responses to glucose, arginine, or free fatty acids load in humans. J. Clin. Endocrinol. Metab. 2003, 88, 4268–4272. [Google Scholar] [CrossRef]
- Dela, F.; Mikines, K.J.; Tronier, B.; Galbo, H. Diminished arginine-stimulated insulin secretion in trained men. J. Appl. Physiol. 1990, 69, 261–267. [Google Scholar] [CrossRef]
- Penny, R.; Blizzard, R.M.; Davis, W.T. Sequential study of arginine monochloride and normal saline as stimuli to growth hormone release. Metabolism 1970, 19, 165–169. [Google Scholar] [CrossRef]
- Levin, S.R.; Karam, J.H.; Hane, S.; Grodsky, G.M.; Forsham, P.H. Enhancement of arginine-induced insulin secretion in man by prior administration of glucose. Diabetes 1971, 20, 171–176. [Google Scholar] [CrossRef] [PubMed]
- Bratusch-Marrain, P.; Björkman, O.; Hagenfeldt, L.; Waldhäusl, W.; Wahren, J. Influence of arginine on splanchnic glucose metabolism in man. Diabetes 1979, 28, 126–131. [Google Scholar] [CrossRef] [PubMed]
- Imura, H.; Seino, Y.; Ikeda, M.; Taminato, T.; Miyamoto, Y.; Goto, Y. Impaired plasma insulin response to arginine in hyperthyroidism: Important role of the rise of blood glucose in the second phase of insulin release induced by arginine. Diabetes 1976, 25, 961–968. [Google Scholar] [CrossRef] [PubMed]
- Hasselblatt, M.; Krampe, H.; Jacobs, S.; Sindram, H.; Armstrong, V.W.; Hecker, M.; Ehrenreich, H. Arginine challenge unravels persistent disturbances of urea cycle and gluconeogenesis in abstinent alcoholics. Alcohol Alcohol. 2006, 41, 372–378. [Google Scholar] [CrossRef][Green Version]
- Berger, W.; Stahl, M.; Ohnhaus, E.; Goschke, H. Pancreatic glucagon, plasma insulin and blood glucose responses to arginine infusion in nondiabetic subjects following biguanide pretreatment. Horm. Metab. Res. 1974, 6, 165. [Google Scholar] [CrossRef]
- Dupre, J.; Curtis, J.D.; Waddell, R.W.; Beck, J.C. Alimentary factors in the endocrine response to administration of arginine in man. Lancet 1968, 2, 28–29. [Google Scholar] [CrossRef]
- Dupre, J.; Curtis, J.D.; Unger, R.H.; Waddell, R.W.; Beck, J.C. Effects of secretin, pancreozymin, or gastrin on the response of the endocrine pancreas to administration of glucose or arginine in man. J. Clin. Investig. 1969, 48, 745–757. [Google Scholar] [CrossRef]
- Kimber, J.; Watson, L.; Mathias, C.J. Cardiovascular and neurohormonal responses to i. v. l-arginine in two groups with primary autonomic failure. J. Neurol. 2001, 248, 1036–1041. [Google Scholar] [CrossRef]
- Oneda, A.; Sato, M.; Matsuda, K.; Yanbe, A.; Maruhama, Y. Plasma glucagon response to blood glucose fall, gastrointestinal hormones and arginine in man. Tohoku J. Exp. Med. 1972, 107, 241–251. [Google Scholar] [CrossRef][Green Version]
- Efendić, S.; Cerasi, E.; Luft, R. Quantitative study on the potentiating effect of arginine on glucose-induced insulin response in healthy, prediabetic, and diabetic subjects. Diabetes 1974, 23, 161–171. [Google Scholar] [CrossRef] [PubMed]
- Kawamori, R.; Shichiri, M.; Kikuchi, M.; Yamasaki, Y.; Abe, H. Perfect normalization of excessive glucagon responses to intravenous arginine in human diabetes mellitus with the artificial beta-cell. Diabetes 1980, 29, 762–765. [Google Scholar] [CrossRef] [PubMed]
- Sparks, L.L.; Copinschi, G.; Donaldson, C.L.; Blum, A.S.; Forsham, P.H. Hyperglycemic response to intravenous arginine in prematurity-onset diabetes. Am. Diabetes Assoc. 1967, 16, 268–271. [Google Scholar] [CrossRef] [PubMed]
- Kawamori, R.; Shichiri, M.; Kikuchi, M.; Yamasaki, Y.; Abe, H. The mechanism of exaggerated glucagon response to arginine in diabetes mellitus. Diabetes Res. Clin. Pract. 1985, 1, 131–137. [Google Scholar] [CrossRef]
- Maccario, M.; Grottoli, S.; Razzore, P.; Procopio, M.; Oleandri, S.E.; Ciccarelli, E.; Camanni, F.; Ghigo, E. Effects of glucose load and/or arginine on insulin and growth hormone secretion in hyperprolactinemia and obesity. Eur. J. Endocrinol. 1996, 135, 205–210. [Google Scholar] [CrossRef]
- Marfella, R.; Acampora, R.; Verrazzo, G.; Ziccardi, P.; de Rosa, N.; Giunta, R.; Giugliano, D. Metformin improves hemodynamic and rheological responses to L-arginine in NIDDM patients. Diabetes Care 1996, 19, 934–939. [Google Scholar] [CrossRef]
- Raskin, P.; Aydin, I.; Unger, R.H. Effect of insulin on the exaggerated glucagon response to arginine stimulation in diabetes mellitus. Diabetes 1976, 25, 227–229. [Google Scholar] [CrossRef] [PubMed]
- Maejima, K.; Himeno, M.; Ishibashi, T.; Nakano, S.; Nishio, M.; Uchida, K. Paradoxical decrease in plasma nox by l-arginine load in diabetic and non-diabetic subjects. Clin. Exp. Hypertens. 2002, 24, 155–167. [Google Scholar] [CrossRef]
- Ohneda, A.; Ishii, S.; Horigome, K.; Yamagata, S. Glucagon response to arginine after treatment of diabetes mellitus. Diabetes 1975, 24, 811–819. [Google Scholar] [CrossRef] [PubMed]
- Carpentier, A.; Giacca, A.; Lewis, G. Effect of increased plasma non-esterified fatty acids (NEFAs) on arginine-stimulated insulin secretion in obese humans. Diabetologia 2001, 44, 1989–1997. [Google Scholar]
- Maccario, M.; Grottoli, S.; Procopio, M.; Oleandri, S.; Boffano, G.; Savio, P.; Camanni, F.; Ghigo, E. Effects of cholinergic blockade by pirenzepine on insulin and glucose response to oral and intravenous glucose and to arginine load in obesity. J. Endocrinol. Investig. 1997, 20, 8–12. [Google Scholar] [CrossRef] [PubMed]
- Walter, R.M., Jr.; Gold, E.M.; Michas, C.A.; Ensinck, J.W. Portal and peripheral vein concentrations of insulin and glucagon after arginine infusion in morbidly obese subjects. Metabolism 1980, 29, 1037–1040. [Google Scholar] [CrossRef]
- Kalogeropoulou, D.; LaFave, L.; Schweim, K.; Gannon, M.C.; Nuttall, F.Q. Lysine ingestion markedly attenuates the glucose response to ingested glucose without a change in insulin response. Am. J. Clin. Nutr. 2009, 90, 314–320. [Google Scholar] [CrossRef] [PubMed]
- Gannon, M.C.; Nuttall, J.A.; Nuttall, F.Q. The metabolic response to ingested glycine. Am. J. Clin. Nutr. 2002, 76, 1302–1307. [Google Scholar] [CrossRef] [PubMed]
- Kasai, K.; Kobayashi, M.; Shimoda, S.-I. Stimulatory effect of glycine on human growth hormone secretion. Metabolism 1978, 27, 201–208. [Google Scholar] [CrossRef]
- Nuttall, F.Q.; Gannon, M.C.; Jordan, K. The metabolic response to ingestion of proline with and without glucose. Metabolism 2004, 53, 241–246. [Google Scholar] [CrossRef] [PubMed]
- Nuttall, F.; Schweim, K.; Gannon, M. Effect of orally administered phenylalanine with and without glucose on insulin, glucagon and glucose concentrations. Horm. Metab. Res. 2006, 38, 518–523. [Google Scholar] [CrossRef]
- Di Sebastiano, K.M.; Bell, K.E.; Barnes, T.; Weeraratne, A.; Premji, T.; Mourtzakis, M. Glutamate supplementation is associated with improved glucose metabolism following carbohydrate ingestion in healthy males. Br. J. Nutr. 2013, 110, 2165–2172. [Google Scholar] [CrossRef]
- Fernstrom, J.D.; Cameron, J.L.; Fernstrom, M.H.; McConaha, C.; Weltzin, T.E.; Kaye, W.H. Short-term neuroendocrine effects of a large oral dose of monosodium glutamate in fasting male subjects. J. Clin. Endocrinol. Metab. 1996, 81, 184–191. [Google Scholar]
- Graham, T.E.; Sgro, V.; Friars, D.; Gibala, M.J. Glutamate ingestion: The plasma and muscle free amino acid pools of resting humans. Am. J. Physiol. Endocrinol. Metab. 2000, 278, E83–E89. [Google Scholar] [CrossRef]
- Zhang, Y.; Kobayashi, H.; Mawatari, K.; Sato, J.; Bajotto, G.; Kitaura, Y.; Shimomura, Y. Effects of branched-chain amino acid supplementation on plasma concentrations of free amino acids, insulin, and energy substrates in young men. J. Nutr. Sci. Vitaminol. 2011, 57, 114–117. [Google Scholar] [CrossRef]
- Gojda, J.; Strakova, R.; Plihalova, A.; Tuma, P.; Potockova, J.; Polak, J.; Andel, M. Increased Incretin but not Insulin Response after Oral versus Intravenous Branched Chain Amino Acids. Ann. Nutr. Metab. 2017, 70, 293–302. [Google Scholar] [CrossRef] [PubMed]
- Tatpati, L.L.; Irving, B.A.; Tom, A.; Bigelow, M.L.; Klaus, K.; Short, K.R.; Nair, K.S. The effect of branched chain amino acids on skeletal muscle mitochondrial function in young and elderly adults. J. Clin. Endocrinol. Metab. 2010, 95, 894–902. [Google Scholar] [CrossRef] [PubMed]
- Louard, R.J.; Barrett, E.J.; Gelfand, R.A. Effect of infused branched-chain amino acids on muscle and whole-body amino acid metabolism in man. Clin. Sci. 1990, 79, 457–466. [Google Scholar] [CrossRef]
- Mosteller, R.D. Simplified calculation of body-surface area. N. Engl. J. Med. 1987, 317, 1098. [Google Scholar]
- Metropolitan Life Insurance Company, Health and Safety Education Division. 1983 metropolitan height and weight tables. Stat. Bull. Metrop. Life Found 1983, 64, 3–9. [Google Scholar]
- Fryar, C.D.; Kruszan-Moran, D.; Gu, Q.; Ogden, C.L. Mean Body Weight, Weight, Waist Circumference, and Body Mass Index among Adults: United States, 1999–2000 through 2015–2016; Centers for Disease Control and Prevention: Hyattsville, MD, USA, 2018. [Google Scholar]
- Van Loon, C.; Luc, J. Amino acids as pharmaco-nutrients for the treatment of type 2 diabetes. Immunol. Endocr. Metab. Agents Med. Chem. 2007, 7, 39–48. [Google Scholar] [CrossRef]
- Panten, U.; Kriegstein, E.; Poser, W.; Schönborn, J.; Hasselblatt, A. Effects of L-leucine and alpha-ketoisocaproic acid upon insulin secretion and metabolism of isolated pancreatic islets. FEBS Lett. 1972, 20, 225–228. [Google Scholar] [CrossRef]
- Newsholme, P.; Gaudel, C.; McClenaghan, N. Nutrient regulation of insulin secretion and β-cell functional integrity. Adv. Exp. Med. Biol. 2010, 654, 91–114. [Google Scholar]
- Sener, A.; Best, L.C.; Yates, A.P.; Kadiata, M.M.; Olivares, E.; Louchami, K.; Jijakli, H.; Ladrière, L.; Malaisse, W.J. Stimulus-secretion coupling of arginine-induced insulin release. Endocrine 2000, 13, 329–340. [Google Scholar] [CrossRef]
- Dunne, M.J.; Yule, D.I.; Gallacher, D.V.; Petersen, O.H. Effects of alanine on insulin-secreting cells: Patch-clamp and single cell intracellular Ca2+ measurements. Biochim. Biophys. Acta 1990, 1055, 157–164. [Google Scholar] [CrossRef]
- McClenaghan, N.H.; Barnett, C.R.; Flatt, P.R. Na+ cotransport by metabolizable and nonmetabolizable amino acids stimulates a glucose-regulated insulin-secretory response. Biochem. Biophys. Res. Commun. 1998, 249, 299–303. [Google Scholar] [CrossRef] [PubMed]
- Newsholme, P.; Brennan, L.; Bender, K. Amino acid metabolism, β-cell function, and diabetes. Diabetes 2006, 55 (Suppl. S2), S39–S47. [Google Scholar] [CrossRef]
- Bankir, L.; Bouby, N.; Speth, R.C.; Velho, G.; Crambert, G. Glucagon revisited: Coordinated actions on the liver and kidney. Diabetes Res. Clin. Pract. 2018, 146, 119–129. [Google Scholar] [CrossRef] [PubMed]
- Doi, M.; Yamaoka, I.; Fukunaga, T.; Nakayama, M. Isoleucine, a potent plasma glucose-lowering amino acid, stimulates glucose uptake in C2C12 myotubes. Biochem. Biophys. Res. Commun. 2003, 312, 1111–1117. [Google Scholar] [CrossRef] [PubMed]
- Manders, R.J.; Wagenmakers, A.J.; Koopman, R.; Zorenc, A.H.; Menheere, P.P.; Schaper, N.C.; Saris, W.H.; van Loon, L.J. Co-ingestion of a protein hydrolysate and amino acid mixture with carbohydrate improves plasma glucose disposal in patients with type 2 diabetes. Am. J. Clin. Nutr. 2005, 82, 76–83. [Google Scholar] [CrossRef]
- Holst, J.J.; Gribble, F.; Horowitz, M.; Rayner, C.K. Roles of the Gut in Glucose Homeostasis. Diabetes Care 2016, 39, 884–892. [Google Scholar] [CrossRef]
- Nauck, M.A.; Meier, J.J. The incretin effect in healthy individuals and those with type 2 diabetes: Physiology, pathophysiology, and response to therapeutic interventions. Lancet Diabetes Endocrinol. 2016, 4, 525–536. [Google Scholar] [CrossRef]
- Gérard, C.; Vidal, H. Impact of Gut Microbiota on Host Glycemic Control. Front. Endocrinol. (Lausanne) 2019, 10, 29. [Google Scholar] [CrossRef]
- Lindgren, O.; Pacini, G.; Tura, A.; Holst, J.J.; Deacon, C.F.; Ahrén, B. Incretin effect after oral amino acid ingestion in humans. J. Clin. Endocrinol. Metab. 2015, 100, 1172–1176. [Google Scholar] [CrossRef]
- Abdulla, H.; Bass, J.J.; Stokes, T.; Gorissen, S.H.M.; McGlory, C.; Phillips, B.E.; Phillips, S.M.; Smith, K.; Idris, I.; Atherton, P.J. The effect of oral essential amino acids on incretin hormone production in youth and ageing. Endocrinol. Diabetes Metab. 2019, 2, e00085. [Google Scholar] [CrossRef] [PubMed]
- Robertson, R.P.; Bogachus, L.D.; Oseid, E.; Parazzoli, S.; Patti, M.E.; Rickels, M.R.; Schuetz, C.; Dunn, T.; Pruett, T.; Balamurugan, A.N.; et al. Assessment of β-cell mass and α- and β-cell survival and function by arginine stimulation in human autologous islet recipients. Diabetes 2015, 64, 565–572. [Google Scholar] [CrossRef] [PubMed]
- Tangphao, O.; Grossmann, M.; Chalon, S.; Hoffman, B.B.; Blaschke, T.F. Pharmacokinetics of intravenous and oral L-arginine in normal volunteers. Br. J. Clin. Pharmacol. 1999, 47, 261–266. [Google Scholar] [CrossRef]
- Castillo, L.; Chapman, T.E.; Yu, Y.M.; Ajami, A.; Burke, J.F.; Young, V.R. Dietary arginine uptake by the splanchnic region in adult humans. Am. J. Physiol. 1993, 265, E532–E539. [Google Scholar] [CrossRef] [PubMed]
- Roden, M.; Shulman, G.I. The integrative biology of type 2 diabetes. Nature 2019, 576, 51–60. [Google Scholar] [CrossRef]
- Samocha-Bonet, D.; Wong, O.; Synnott, E.-L.; Piyaratna, N.; Douglas, A.; Gribble, F.M.; Holst, J.J.; Chisholm, D.J.; Greenfield, J.R. Glutamine Reduces Postprandial Glycemia and Augments the Glucagon-Like Peptide-1 Response in Type 2 Diabetes Patients. J. Nutr. 2011, 141, 1233–1238. [Google Scholar] [CrossRef]
- Wang, X.; Liu, H.; Chen, J.; Li, Y.; Qu, S. Multiple Factors Related to the Secretion of Glucagon-Like Peptide-1. Int. J. Endocrinol. 2015, 2015, 651757. [Google Scholar] [CrossRef]


| Inclusion Criteria | Exclusion Criteria | |
|---|---|---|
| Population | Healthy adults | Children and adolescents |
| Adults with T2DM | Pregnant females | |
| Adults with overweight/obesity | Animals | |
| Cells | ||
| Intervention | Oral AA ingestion | |
| Intravenous AA infusion | ||
| Comparison | Control (i.e., water, saline) | |
| Outcomes | Glucose concentrations (repeated measurements) | |
| Insulin concentrations (repeated measurements) | ||
| Trial design | Intervention study | |
| Type of publication | Original research articles | Non-English articles |
| Published in a peer-reviewed international journal, regardless of publication year | Review articles |
| Section | First Author, Year of Publication | n | Age (yrs) | BMI (kg/m2) | Body Weight (kg) | Lean Body Mass (kg) | Subject Condition | Group | Dose | Route of Administration | Duration (min) | Glucose Measurements | Insulin Measurements | Blood Sampling |
|---|---|---|---|---|---|---|---|---|---|---|---|---|---|---|
| Floyd, 1970 [17] | 11 | 22.9 | - | - | - | Healthy | Leucine | 15 g | IV | 0–30 | Blood | Plasma | Forearm vein | |
| 11 | 22.9 | - | - | - | Healthy | Arginine | 15 g | IV | 0–30 | Blood | Plasma | Forearm vein | ||
| 11 | 22.9 | - | - | - | Healthy | Lysine | 15 g | IV | 0–30 | Blood | Plasma | Forearm vein | ||
| 11 | 22.9 | - | - | - | Healthy | Phenylalanine | 15 g | IV | 0–30 | Blood | Plasma | Forearm vein | ||
| A | Kalogeropoulou, 2008 [8] | 13 | 24 | 24 | 70.9 | 51 | Healthy | Leucine | 7 g | Oral | Acute | Serum | Serum | Antecubital or forearm vein |
| 13 | 24 | 24 | 70.9 | 51 | Healthy | Leucine+Glucose | 7 g + 25 g | Oral | Acute | Serum | Serum | Antecubital or forearm vein | ||
| 13 | 24 | 24 | 70.9 | 51 | Healthy | Glucose | 25 g | Oral | Acute | Serum | Serum | Antecubital or forearm vein | ||
| 13 | 24 | 24 | 70.9 | 51 | Healthy | Water | - | Oral | Acute | Serum | Serum | Antecubital or forearm vein | ||
| Wilkenson, 2013 [12] | 7 | 21 ± 0.3 | 25 ± 0.6 | - | - | Healthy | Leucine | 3.42 g | Oral | Acute | Plasma | Plasma | Arterialized blood from dorsal capillary bed of the hand | |
| Yoshii, 2018 [13] | 10 | 25 ± 1 | - | 65.8 ± 1.5 | - | Healthy | Leucine | 2 g | Oral | Acute | Blood | Plasma | Cutaneous forearm vein | |
| Abumrad, 1982 [14] | 13 | 27 ± 1 | - | 68 ± 2 | - | Healthy | Leucine | 5.6 g | IV | 0–300 | Plasma | Plasma | - | |
| Eriksson, 1983 [15] | 18 | 26 ± 1 | 22.9 | 76 ± 2 | - | Healthy | Leucine | 5.9 g | IV | 0–150 | Blood | Serum | Arterial blood samples | |
| Sherwin, 1978 [16] | 11 | 21–35 | - | - | - | Healthy | Leucine | 3.7 g 1 | IV | 0–180 | Plasma | Plasma | Antecubital vein | |
| B | Nuttall, 2008 [18] | 9 | 33.8 ± 6.5 | 28 ± 6.6 | 81 ± 20.8 | 56.5 ± 12.3 | Healthy | Isoleucine | 7.4 g | Oral | Acute | Plasma | Serum | Antecubital vein |
| 9 | 33.8 ± 6.5 | 28 ± 6.6 | 81 ± 20.8 | 56.5 ± 12.3 | Healthy | Isoleucine+Glucose | 7.4 g + 25 g | Oral | Acute | Plasma | Serum | Antecubital vein | ||
| 9 | 33.8 ± 6.5 | 28 ± 6.6 | 81 ± 20.8 | 56.5 ± 12.3 | Healthy | Glucose | 25 g | Oral | Acute | Plasma | Serum | Antecubital vein | ||
| 9 | 33.8 ± 6.5 | 28 ± 6.6 | 81 ± 20.8 | 56.5 ± 12.3 | Healthy | Water | - | Oral | Acute | Plasma | Serum | Antecubital vein | ||
| C | Rossini, 1975 [19] | 6 | 20–32 | - | - | - | Healthy | Alanine | 10 g | Oral | Acute | Blood | Serum | Antecubital vein |
| 6 | 20–32 | - | - | - | Healthy | Alanine | 10 g | IV | 0–60 | Blood | Serum | Antecubital vein | ||
| Rose, 1977 [20] | 13 | 23 ± 4 | - | 59.5 ± 5.6 | - | Healthy | Alanine | 11.9 g | Oral | Acute | Plasma | Plasma | Forearm vein | |
| Sato, 1980 [21] | 5 | 25 | - | - | - | Healthy | Alanine | 64.6 g 2 | Oral | Acute | Blood | Plasma | Antecubital vein | |
| Genuth, 1974 [22] | 10 | 20–46 | - | - | - | Healthy | Alanine | 33.8 g 2 | Oral | Acute | Plasma | Plasma | - | |
| 10 | 20–46 | - | - | - | Healthy | Alanine | 6.8 g 2 | Oral | Acute | Plasma | Plasma | - | ||
| 10 | 20–72 | - | - | - | T2DM | Alanine | 37.5 g 2 | Oral | Acute | Plasma | Plasma | - | ||
| 10 | 40–71 | - | - | - | T2DM | Alanine | 8.2 g 2 | Oral | Acute | Plasma | Plasma | - | ||
| Genuth, 1973 [23] | 6 | 42.5 ± 9.3 | - | 151 ± 39.6 | - | Obese | Alanine | 50 g | Oral | Acute | Plasma | Plasma | - | |
| Asano, 1989 [24] | 9 | 21 ± 0.7 | 19.8 ± 0.3 | 53 ± 5 | - | Healthy | Alanine | 5.3 g | IV | 0–2 | Plasma | Plasma | Forearm vein | |
| 6 | 28 ± 3.5 | 31.3 ± 3 | 89 ± 12 | - | Obese | Alanine | 8.9 g | IV | 0–2 | Plasma | Plasma | Forearm vein | ||
| D | Greenfield, 2008 [25] | 8 | 30 ± 5.8 | 21.9 ± 2.2 | 70.3 ± 8.6 | - | Healthy | Glutamine | 30 g | Oral | Acute | Plasma | Plasma | Antecubital vein |
| 8 | 30 ± 5.8 | 21.9 ± 2.2 | 70.3 ± 8.6 | - | Healthy | Water | 300 mL | Oral | Acute | Plasma | Plasma | Antecubital vein | ||
| 8 | 38.5 ± 8 | 38.5 ± 6.5 | 120.6 ± 24.2 | - | T2DM | Glutamine | 30 g | Oral | Acute | Plasma | Plasma | Antecubital vein | ||
| 8 | 38.5 ± 8 | 38.5 ± 6.5 | 120.6 ± 24.2 | - | T2DM | Water | 300 mL | Oral | Acute | Plasma | Plasma | Antecubital vein | ||
| 8 | 39 ± 9.8 | 34.5 ± 4.4 | 106 ± 14.8 | - | Obese | Glutamine | 30 g | Oral | Acute | Plasma | Plasma | Antecubital vein | ||
| 8 | 39 ± 9.8 | 34.5 ± 4.4 | 106 ± 14.8 | - | Obese | Water | 300 mL | Oral | Acute | Plasma | Plasma | Antecubital vein | ||
| E | Gannon, 2002 [26] | 9 | 21–52 | 25.9 ± 0.5 | 75 | 61 | Healthy | Arginine | 10.6 g | Oral | Acute | Plasma | Serum | Forearm vein |
| 9 | 21–52 | 25.9 ± 0.5 | 75 | 61 | Healthy | Arginine+Glucose | 10.6 g + 25 g | Oral | Acute | Plasma | Serum | Forearm vein | ||
| 9 | 21–52 | 25.9 ± 0.5 | 75 | 61 | Healthy | Glucose | 25 g | Oral | Acute | Plasma | Serum | Forearm vein | ||
| 9 | 21–52 | 25.9 ± 0.5 | 75 | 61 | Healthy | Water | - | Oral | Acute | Plasma | Serum | Forearm vein | ||
| Tang, 2013 [27] | 8 | 30.5 ± 3.7 | 21.0 ± 2.4 | 56.8 ± 6.8 | - | Healthy | Arginine | 30 g | Oral | Acute | Serum | Serum | - | |
| 8 | 30.5 ± 3.7 | 21.0 ± 2.4 | 56.8 ± 6.8 | - | Healthy | Arginine+Glucose | 30 g + 75 g | Oral | Acute | Serum | Serum | - | ||
| 8 | 30.5 ± 3.7 | 21.0 ± 2.4 | 56.8 ± 6.8 | - | Healthy | Glucose | 75 g | Oral | Acute | Serum | Serum | - | ||
| 8 | 30.5 ± 3.7 | 21.0 ± 2.4 | 56.8 ± 6.8 | - | Healthy | Water | 300 mL | Oral | Acute | Serum | Serum | - | ||
| Giugliano, 1997 [28] | 10 | 24 ± 1 | 23 ± 0.4 | 67 ± 1.8 | - | Healthy | Arginine | 30 g | IV | 0–30 | Plasma | Plasma | Dorsal vein | |
| Coiro, 1997 [29] | 14 | 24–35 | - | - | - | Healthy | Arginine | 30 g | IV | 0–30 | Blood | - | Antecubital vein | |
| Broglio, 2003 [30] | 7 | 28.3 ± 3.1 | 29.1 ± 0.9 | - | - | Healthy | Arginine | 34 g 3 | IV | 0–30 | Blood | Blood | Antecubital vein | |
| 7 | 28.3 ± 3.1 | 29.1 ± 0.9 | - | - | Healthy | Saline | 3 mL | IV | Acute | Blood | Blood | Antecubital vein | ||
| Dela, 1990 [31] | 7 | 22 | 23.2 | 76 | - | Healthy-untrained | Arginine | 68.4 g | IV | 0–90 | Plasma | Plasma | Retrograde direction in a dorsal hand vein (arterialized blood samples) | |
| 7 | 23 | 21.6 | 70 | - | Healthy-trained | Arginine | 63 g | IV | 0–90 | Plasma | Plasma | Retrograde direction in a dorsal hand vein (arterialized blood samples) | ||
| Penny, 1970 * [32] | 8 | - | - | 69.5 ± 14.3 | - | Healthy | Arginine | 34 g | IV | 0–30 | Plasma | - | Peripheral vein | |
| 8 | - | - | 69.5 ± 14.3 | - | Healthy | Saline | - | IV | 0–30 | Plasma | - | Peripheral vein | ||
| Levin, 1971 [33] | 6 | 23–50 | - | - | - | Healthy | Arginine | 20 g | IV | 0–20 | Blood | - | Antecubital vein | |
| 6 | 23–50 | - | - | - | Healthy | Arginine | 20 g | IV | 0–20 | Blood | - | Antecubital vein | ||
| Bratusch-Marrain, 1979 [34] | 9 | 21–42 | - | - | - | Healthy | Arginine | 30 g | IV | 0–30 | Blood | - | Glucose: arterialInsulin: hepatic venous | |
| Imura, 1976 [35] | 15 | - | - | - | - | Healthy | Arginine | 30 g | IV | 0–45 | Blood | Plasma | Antecubital vein | |
| Hasselblatt, 2006 [36] | 15 | 39 | 24.9 | - | - | Healthy | Arginine | 30 g | IV | 0–30 | Blood | Plasma | Glucose: capillary bloodInsulin: Forearm vein | |
| Berger, 1974 [37] | 9 | - | - | - | - | Healthy | Arginine | 30 g | IV | 0–30 | Blood | Plasma | - | |
| Dupre, 1968 [38] | 13 | - | - | - | - | Healthy | Arginine | 15 g | IV | 0–40 | Blood | Serum | - | |
| 6 | - | - | - | - | Healthy | Arginine | 3.9 g | IV | 0–40 | Blood | Serum | - | ||
| Dupre, 1969 [39] | 4 | 18–35 | - | - | - | Healthy | Arginine | 15 g | IV | 0–40 | Blood | Serum | Forearm vein | |
| 6 | 18–35 | - | - | - | Healthy | Arginine | 15 g | IV | 0–40 | Blood | Serum | Forearm vein | ||
| Kimber, 2001 [40] | 5 | 58 | - | - | - | Healthy | Arginine | 31.8 g 2 | IV | 0–30 | Plasma | Plasma | Antecubital vein | |
| Ohneda, 1972 [41] | 8 | - | - | - | - | Healthy | Arginine | 30 g | IV | 0–30 | Blood | Plasma | - | |
| Efendic, 1974 [42] | 7 | 30.6 ± 4.4 | - | - | - | Healthy | Arginine | 27.9 g 2 | IV | 0–30 | Blood | Plasma | Brachial vein | |
| 6 | 36.5 ± 15.3 | - | - | - | T2DM | Arginine | 29.8 g 2 | IV | 0–30 | Blood | Plasma | Brachial vein | ||
| Kawamori, 1980 [43] | 9 | 25–35 | - | - | - | Healthy | Arginine | 32.3 g 2 | IV | 0–30 | Blood | Plasma | Antecubital vein | |
| 5 | 48–70 | - | - | - | T2DM | Arginine | 33.5 g 2 | IV | 0–30 | Blood | Plasma | Antecubital vein | ||
| Sparks, 1967 [44] | 10 | 25 ± 1 | - | 66 ± 3 | - | Healthy | Arginine | 30 g | IV | 0–30 | Blood | Serum | Venous blood samples | |
| 6 | 57 ± 3 | - | 66 ± 9 | - | T2DM | Arginine | 30 g | IV | 0–30 | Blood | Serum | Venous blood samples | ||
| Kawamori, 1985 [45] | 9 | 25–30 | - | - | - | Healthy | Arginine | 32.3 g 2 | IV | 0–30 | Blood | Serum | Venous blood samples | |
| 7 | 48–71 | - | - | - | T2DM | Arginine | 32.3 g 2 | IV | 0–30 | Blood | Plasma | Antecubital vein | ||
| Maccario, 1996 [46] | 7 | 26–32 | 20.6 ± 1.3 | - | - | Healthy | Arginine | 27.2 g 3 | IV | 0–30 | Plasma | Serum | Antecubital vein | |
| 7 | 23–52 | 38.3 ± 2.6 | - | - | Obese | Arginine | 50.6 g 3 | IV | 0–30 | Plasma | Serum | Antecubital vein | ||
| Marfella, 1996 [47] | 10 | 47 ± 0.8 | 28.1 ± 0.7 | 78 ± 2.9 | - | T2DM | Arginine | 30 g | IV | 0–30 | Plasma | Plasma | Dorsal vein | |
| Raskin, 1976 [48] | 6 | 48 | - | 85 | - | T2DM | Arginine | 20 g | IV | 0–40 | Plasma | Plasma | Antecubital vein | |
| Maejima, 2002 [49] | 12 | 58.5 ± 3.3 | - | 57.0 ± 3.6 | - | T2DM | Arginine | 30 g | IV | 0–30 | Blood | - | - | |
| Ohneda, 1975 [50] | 5 | 63.2 ± 5.9 | - | - | - | T2DM | Arginine | 30 g | IV | 0–30 | Blood | Plasma | Glucose: capillary blood Insulin: antecubital vein | |
| Carpentier, 2001 [51] | 14 | 44.4 ± 2 | 36.2 ± 1.9 | - | - | Obese | Arginine | 30 g | IV | −0.75–30 | Plasma | Plasma | Forearm distal vein (arterialized venous blood) | |
| Maccario, 1997 [52] | 6 | - | - | - | - | Obese | Arginine | 49.3 g 3 | IV | 0–30 | Plasma | Serum | - | |
| Walter, 1980 [53] | 5 | 26–40 | - | 135–227 | - | Obese | Arginine | 5 g | IV | 0–1 | Serum | Serum | Antecubital vein | |
| F | Kalogeropoulou 2009 [54] | 13 | 30 | 26 | 80 | 60 | Healthy | Lysine | 11 g | Oral | Acute | Serum | Serum | Antecubital vein |
| 13 | 30 | 26 | 80 | 60 | Healthy | Lysine+Glucose | 11 g + 25 g | Oral | Acute | Serum | Serum | Antecubital vein | ||
| 13 | 30 | 26 | 80 | 60 | Healthy | Glucose | 25 g | Oral | Acute | Serum | Serum | Antecubital vein | ||
| 13 | 30 | 26 | 80 | 60 | Healthy | Water | - | Oral | Acute | Serum | Serum | Antecubital vein | ||
| G | Gannon, 2002 [55] | 9 | 21–52 | 25.9 ± 0.5 | 75 | 61 | Healthy | Glycine | 4.6 g | Oral | Acute | Plasma | Serum | Forearm vein |
| 9 | 21–52 | 25.9 ± 0.5 | 75 | 61 | Healthy | Glycine+Glucose | 4.6 g + 25 g | Oral | Acute | Plasma | Serum | Forearm vein | ||
| 9 | 21–52 | 25.9 ± 0.5 | 75 | 61 | Healthy | Glucose | 25 g | Oral | Acute | Plasma | Serum | Forearm vein | ||
| 9 | 21–52 | 25.9 ± 0.5 | 75 | 61 | Healthy | Water | - | Oral | Acute | Plasma | Serum | Forearm vein | ||
| Kasai, 1978 [56] | 19 | 20–70 | - | - | - | Healthy | Glycine | 22.5 g | Oral | Acute | Blood | Serum | Venous blood samples | |
| H | Nuttall, 2004 [57] | 8 | 28 | 23 | 80 | 53 | Healthy | Proline | 6 g | Oral | Acute | Plasma | Serum | Forearm vein |
| 8 | 28 | 23 | 80 | 53 | Healthy | Proline+Glucose | 6 g + 25 g | Oral | Acute | Plasma | Serum | Forearm vein | ||
| 8 | 28 | 23 | 80 | 53 | Healthy | Glucose | 25 g | Oral | Acute | Plasma | Serum | Forearm vein | ||
| 8 | 28 | 23 | 80 | 53 | Healthy | Water | - | Oral | Acute | Plasma | Serum | Forearm vein | ||
| I | Nuttall, 2006 [58] | 6 | 26 | 24 | - | 59 | Healthy | Phenylalanine | 9.7 g | Oral | Acute | Plasma | Serum | Antecubital vein |
| 6 | 26 | 24 | - | 59 | Healthy | Phenylalanine+Glucose | 9.7 g + 25 g | Oral | Acute | Plasma | Serum | Antecubital vein | ||
| 6 | 26 | 24 | - | 59 | Healthy | Glucose | 25 g | Oral | Acute | Plasma | Serum | Antecubital vein | ||
| 6 | 26 | 24 | - | 59 | Healthy | Water | - | Oral | Acute | Plasma | Serum | Antecubital vein | ||
| J | Di Sabastiano, 2013 [59] | 9 | 23.9 ± 1.9 | 25 ± 2.4 | 79.4 ± 9 | - | Healthy | Glutamate | 11.9 g | Oral | Acute | Serum | Serum | Antecubital vein |
| 9 | 23.9 ± 1.9 | 25 ± 2.4 | 79.4 ± 9 | - | Healthy | Gelatin capsules (containing NaCl in the same proportions as in the MSG capsules) | - | Oral | Acute | Serum | Serum | Antecubital vein | ||
| Fernstrom, 1996 [60] | 8 | 25.6 ± 4.1 | 25.1 ± 1.8 | 79.7 ± 7.5 | - | Healthy | Glutamate | 12.7 g | Oral | Acute | Plasma | Plasma | - | |
| 8 | 25.6 ± 4.1 | 25.1 ± 1.8 | 79.7 ± 7.5 | - | Healthy | Cold flavored vehicle (containing 3 g sodium chloride instead of MSG) | 300 mL | Oral | Acute | Plasma | Plasma | - | ||
| Graham, 2000 [61] | 9 | 26 | - | 76.9 | - | Healthy | Glutamate | 11.5 g | Oral | Acute | - | Plasma | Antecubital vein | |
| K | Zhang, 2011 [62] | 5 | 22–25 | 19.7 | 61 ± 3 | - | Healthy | BCAA (weight ratio of 1:2.3:1.2 for isoleucine:leucine:valine) | 1 g | Oral | Acute | Plasma | Plasma | - |
| 5 | 22–25 | 19.7 | 61 ± 3 | - | Healthy | BCAA (weight ratio of 1:2.3:1.2 for isoleucine:leucine:valine) | 5 g | Oral | Acute | Plasma | Plasma | - | ||
| Gojda, 2017 [63] | 18 | 25.5 ± 1.4 | - | 76.7 ± 2.6 | - | Healthy | BCAA (50% leucine, 25% isoleucine, 25% valine) | 30.7 ± 1.1 g | Oral | Acute | Plasma | Serum | - | |
| 18 | 25.5 ± 1.4 | - | 76.7 ± 2.6 | - | Healthy | Gelatin Capsule (methylcellulose in gelatin capsule, prepared by University Hospital pharmacy) | - | Oral | Acute | Plasma | Serum | - | ||
| 18 | 25.5 ± 1.4 | - | 76.7 ± 2.6 | - | Healthy | BCAA (43% leucine, 24% isoleucine, 33% valine) | 30.7 ± 1.1 g | IV | 0–120 | Plasma | Serum | - | ||
| Tatpati, 2010 [64] | 12 | 23.4 ± 0.8 | 24.4 ± 1 | 74.5 ± 4.2 | 47.6 ± 3.5 | Healthy | BCAA (equimolar mixture of valine, leucine and isoleucine) | 18.5 g | IV | 0–510 | Blood | Plasma | Dorsal hand vein (arterialized venous blood samples) | |
| 12 | 70.7 ± 1.1 | 24.5 ± 0.7 | 72.7 ± 3.3 | 42.2 ± 3.1 | Healthy | BCAA (equimolar mixture of valine, leucine and isoleucine) | 16.35 g | IV | 0–510 | Blood | Plasma | Dorsal hand vein (arterialized venous blood samples) | ||
| 12 | 23.4 ± 0.8 | 24.4 ± 1 | 74.5 ± 4.2 | 47.6 ± 3.5 | Healthy | Saline | - | IV | 0–510 | Blood | Plasma | Dorsal hand vein (arterialized venous blood samples) | ||
| 12 | 70.7 ± 1.1 | 24.5 ± 0.7 | 72.7 ± 3.3 | 42.2 ± 3.1 | Healthy | Saline | - | IV | 0–510 | Blood | Plasma | Dorsal hand vein (arterialized venous blood samples) | ||
| Louard, 1990 [65] | 10 | - | - | - | - | Healthy | BCAA (equimolar mixture of valine, leucine and isoleucine) | 3.4 g 2 | IV | 0–180 | Blood | Plasma | Arterial samples |
| -- | All studies show decrease from control/baseline | |||||||||||||
| - | One or more studies show decrease from control/baseline | |||||||||||||
| +/− | No change from control/baseline; contrasting outcomes | |||||||||||||
| + | One or more studies show increase from control/baseline | |||||||||||||
| ++ | All studies show increase from control/baseline | |||||||||||||
| AA | Oral ingestion | Co-ingestion with glucose | Intravenous infusion | |||||||||||
| Healthy | T2DM | Obese | Healthy | Healthy | T2DM | Obese | ||||||||
| I | G | I | G | I | G | I | G | I | G | I | G | I | G | |
| Leucine | + | +/− | ++ | -- | + | -- | ||||||||
| Isoleucine | +/− | -- | ++ | -- | ||||||||||
| Alanine | ++ | - | ++ | -- | ++ | -- | + | + | ++ | ++ | ||||
| Glutamine | ++ | +/− | ++ | +/− | ++ | +/− | ||||||||
| Arginine | + | +/− | +/− | +/− | ++ | + | ++ | ++ | ++ | ++ | ||||
| Lysine | ++ | -- | +/− | -- | ++ | -- | ||||||||
| Glycine | + | +/− | +/− | -- | ||||||||||
| Proline | ++ | +/− | +/− | -- | ||||||||||
| Phenylalanine | ++ | +/− | +/− | -- | ++ | -- | ||||||||
| Glutamate | + | +/− | ||||||||||||
| BCAA mixture (leucine, isoleucine, and valine) | + | -- | + | -- | ||||||||||
Publisher’s Note: MDPI stays neutral with regard to jurisdictional claims in published maps and institutional affiliations. |
© 2020 by the authors. Licensee MDPI, Basel, Switzerland. This article is an open access article distributed under the terms and conditions of the Creative Commons Attribution (CC BY) license (http://creativecommons.org/licenses/by/4.0/).
Share and Cite
van Sloun, B.; Goossens, G.H.; Erdos, B.; Lenz, M.; van Riel, N.; Arts, I.C.W. The Impact of Amino Acids on Postprandial Glucose and Insulin Kinetics in Humans: A Quantitative Overview. Nutrients 2020, 12, 3211. https://doi.org/10.3390/nu12103211
van Sloun B, Goossens GH, Erdos B, Lenz M, van Riel N, Arts ICW. The Impact of Amino Acids on Postprandial Glucose and Insulin Kinetics in Humans: A Quantitative Overview. Nutrients. 2020; 12(10):3211. https://doi.org/10.3390/nu12103211
Chicago/Turabian Stylevan Sloun, Bart, Gijs H. Goossens, Balazs Erdos, Michael Lenz, Natal van Riel, and Ilja C. W. Arts. 2020. "The Impact of Amino Acids on Postprandial Glucose and Insulin Kinetics in Humans: A Quantitative Overview" Nutrients 12, no. 10: 3211. https://doi.org/10.3390/nu12103211
APA Stylevan Sloun, B., Goossens, G. H., Erdos, B., Lenz, M., van Riel, N., & Arts, I. C. W. (2020). The Impact of Amino Acids on Postprandial Glucose and Insulin Kinetics in Humans: A Quantitative Overview. Nutrients, 12(10), 3211. https://doi.org/10.3390/nu12103211