Article

The Social Stratification of Availability, Affordability, and Consumption of Food in Families with Preschoolers in Addis Ababa; The EAT Addis Study in Ethiopia

by
Semira Abdelmenan
1,2,3,*,
Hanna Y. Berhane
1,2,
Magnus Jirström
4,
Jill Trenholm
2,
Alemayehu Worku
1,5,
Eva-Charlotte Ekström
1,† and
Yemane Berhane
1,2,†
1
Addis Continental Institute of Public Health, 26751/1000 Addis Ababa, Ethiopia
2
Department of Women’s and Children Health, International Maternal and Child Health, Uppsala University, 751 85 Uppsala, Sweden
3
Institute of Public Health, College of Medicine and Health Sciences, University of Gondar, 196 Gondar, Ethiopia
4
Department of Human Geography, Lund University, 223 62 Lund, Sweden
5
School of Public Health, College of Health Sciences, Addis Ababa University, 1176 Addis Ababa, Ethiopia
*
Author to whom correspondence should be addressed.
These authors contributed equally to this work.
Nutrients 2020, 12(10), 3168; https://doi.org/10.3390/nu12103168
Submission received: 13 September 2020 / Revised: 1 October 2020 / Accepted: 13 October 2020 / Published: 16 October 2020
(This article belongs to the Section Nutrition and Public Health)

Abstract

:
The aim of this study was to understand the quality of diet being consumed among families in Addis Ababa, and to what extent social stratification and perceptions of availability and affordability affect healthy food consumption. Data were collected from 5467 households in a face-to-face interview with mothers/caretakers and analyzed using mixed effect logistic regression models. All family food groups, except fish were perceived to be available by more than 90% of the participants. The food groups cereals/nuts/seeds, other vegetables, and legumes were considered highly affordable (80%) and were the most consumed (>75%). Households with the least educated mothers and those in the lowest wealth quintile had the lowest perception of affordability and also consumption. Consumption of foods rich in micronutrients and animal sources were significantly higher among households with higher perceived affordability, the highest wealth quintile, and with mothers who had better education. Households in Addis Ababa were generally seen to have a monotonous diet, despite the high perceived availability of different food groups within the food environment. There is a considerable difference in consumption of nutrient-rich foods across social strata, hence the cities food policies need to account for social differences in order to improve the nutritional status of the community.

1. Introduction

Malnutrition is one of the most serious public health challenges globally; nearly one in three people suffer from at least one form of malnutrition manifested as wasting, stunting, micro-nutrient deficiency, and/or overweight or obesity [1]. In the past two decades, the number of overweight individuals in Africa has significantly increased. This is a major concern especially in light of the remaining high prevalence of undernutrition in this region [2,3]. The occurrence of both under-and over nutrition in the same population is often referred to as the “double burden of malnutrition” [4]. The driving forces are multifaceted, including changes in dietary and physical activity patterns related to transitions in livelihoods; moving from traditional food systems dependent upon subsistence farming to dependence upon income generation and the market [1]. These transitions are more prominent in transient urban settings where they contribute to an excess intake of energy, insufficient amounts of micro-nutrients and limited physical activity [5,6,7].
Despite the various health benefits of fruits and vegetables including reducing risk for non-communicable diseases, the consumption is generally low [8]. An aggregated result from 28 low-and middle-income countries exemplified this with only 18% (95 CI: 16.6–19.4%) of the population meeting the recommended 400 g/day serving [9]. Traditional diets rich in fiber, high in vegetable and fruit varieties are being substituted by diets rich in oils, fats, and sugars, often in the form of ultra-processed foods [10,11]. The shift in diet can be partially explained by changes in food systems; whereby the rise of industrial production of cheap foods is making ultra-processed food more accessible [12,13,14].
With regards to food accessibility, the importance of the “food environment” is underscored [13,15,16]. The food environment which encompasses domains such as accessibility, availability, and affordability is an interface whereby individuals interact with the wider food system for food purchase and consumption [17]. Logically, individuals can only eat from the range of things that are available to them, and availability of an adequate supply of healthy food has been consistently associated with a healthy diet [18]. The availability of fresh healthy foods has also been improved by the development of advanced agricultural technologies and transport systems that can provide cold chain equipment to preserve perishables. However, as these technologies are undeveloped in low income settings 40% of fresh food does not reach consumers due to post-harvest loss [19,20].
Another important dimension relating to diet is affordability [18]. In low income urban areas where availability is limited, only the economically better-off families manage to access a wide range of the recommended food groups [20,21]. Despite sufficient access to markets, dietary choices are influenced by price [22]. The results from a multi-country study showed that individuals from low income countries spend more than half of their income in order to meet dietary recommendations [23]. The high cost prevents poorer households from affording a nutritionally adequate diet [22]. This is more common in urban areas where most households’ only source of food is that which is purchased. Furthermore, less healthy alternatives are often inexpensive, have a longer shelf-life, require little preparation, and have an alluring taste, making them both convenient and desirable for the women who are responsible for purchasing and preparing food for the family [13,24,25].
Mothers/caretakers have a significant role in shaping the diet of the household as they generally determine which foods are bought and prepared within the home. Mothers draw on wealth and food security of the household as well as their own education to fulfill this responsibility. Studies have shown that households with better socioeconomic resources enjoy a more nutritious diet, as opposed to their disadvantaged counterparts whose diet consists of much less fiber, fruits, and vegetables [26,27,28]. Households with educated mothers have been shown to have a higher consumption of fruits and vegetables as well as better diet diversity [9,29,30]. On the contrary, in some contexts, higher maternal education has also been associated with higher consumption of sugary drinks and more processed foods [31]. Moreover, although households in the highest wealth groups had a more diverse diet [26,32], they have also been associated with an increase in overweight/obesity [33,34].
The fundamental cause of the double burden of malnutrition is energy imbalance; “energy excess” for obesity and “energy and nutrient deficiencies” for undernutrition [35]. Hence the promotion of good nutrition presents an opportunity to avert the occurrence of both forms of malnutrition [34]. However, there is limited research, in particular concerning the food environments in sub-Saharan African countries, which makes designing holistic and contextualized policies problematic. Therefore, understanding how availability and affordability shapes the family diet is important. This study aims to understand the quality of diet being consumed among families in Addis Ababa, and to what extent social stratification and perceptions of availability and affordability affect healthy food consumption.

2. Materials and Methods

2.1. Study Design and Setting

A community-based cross-sectional study was carried out in the months of July–August, 2017 and January–February, 2018 in Addis Ababa, the capital city of Ethiopia. Addis Ababa has been experiencing a rapid increase in population size along with diminishing open public space [36]. The rapid expansion of residential areas to accommodate the increasing population size has led to the loss of highly fertile agricultural land and green spaces thereby reducing food production within and in the vicinity of the city [37]. This in turn, escalates the food prices and further jeopardizes the food and nutrition security of urban dwellers. Additionally, the city has one of the highest literacy rates in the country with 80% of its population having basic literacy level, and a high level of unemployment with 23.5% of the population in this urban area being unemployed [38,39].

2.2. Sampling

The study used a multi-stage sampling procedure. All 116 woredas (districts) in the city were included in the study in each of the two rounds of survey: First round took place during the wet season and second round during the dry season to consider seasonal variations. Each district was further divided into roughly five equal geographical clusters and one cluster was then selected using simple random sampling. Subsequently, systematic random sampling was used to visit 60 households in each cluster to check for eligibility. All households with at least one under five-year-old child were invited to participate. Additional households were visited if there were less than 20 eligible households in the cluster. Households in which the mother/caregiver was not available to interview after 3 repeat visits were then declared unavailable and excluded from the study without replacement.

2.3. Data Collection

The necessary data for the study were collected through face to face interviews with the mother/caregiver using a structured questionnaire. The questionnaires included sections on demographic and household characteristics, perceived availability and affordability of food groups, and family food consumption. The questionnaire comprised of standard measures as well as newly developed measures to assess the perceived affordability and availability; this was based upon literature and the research team’s expertise in this field. A photo gallery of common foods was used to help respondents understand the food groups. The questionnaires were initially developed in English and translated into Amharic language (the official language of Ethiopia) by a panel of translators. The questionnaires were pretested in households that were not included in the study for comprehension of concepts and language.
Data were collected using tablets pre-programmed with the questionnaire. The data collectors were trained on the objective of the study, the content of the questionnaires, the sampling procedures, and the use of the tablets. The data collection was supervised daily by members of the research team and on-site support was given to the teams to ensure the study procedures were strictly observed. Data were received directly onto the data server at the Addis Continental Institute of Public Health and a data manager provided regular feedback on the quality of data.

2.4. Measurement

The age of the mothers was grouped into five categories: 15–24, 25–34, 35–44, and 45+, and their educational levels were summarized as: never attended/finished a grade, grade 1–4, grade 5–8, grade 9–12, and college. Marital status was categorized as currently married (in union) and currently not married (single).
Wealth index was computed from multiple variables including ownership of house, type of housing unit, housing material (floor, roof, wall material), access to a separate toilet facility and clean drinking water, and assets (including bicycle, motorbike, car, cell-phone, radio, TV, refrigerator, bed, electric stove for making the local bread “Injera” and a saving account) [40]. Households were then divided into wealth quintiles (lowest, second, third, fourth, and highest) to indicate their relative economic status.

Consumption, Availability, and Affordability of Food Groups

For this study, a modified version of the women’s minimum dietary diversity indicator was used; it measures quality of diet, both in terms of energy and micronutrient adequacy [41] instead of using the usual household diet diversity measures which reflect more on the economic access and dietary energy [42]. This modified measure used in this study, hereafter referred to “family food groups”, has eleven food groups rather than 10 as in the usual measures. Based on the local consumption patterns; food groups “fish and meat” and “Vitamin A rich fruits and vegetables” were both split; while merging “legumes” with “nuts and seeds” groups since the latter is not commonly consumed in the study setting.
Perceived availability of family food was measured using a photo gallery of common foods from each of the family food groups (11-family food groups). Mothers were asked whether any of the foods shown in the photo were available in the market. The response options were “Yes”, “No”, and “Don’t know”. Then, each food group was dichotomized as “available” if the responses were “yes” and “not available” if the responses were “no”. “Don’t know” responses were treated as missing.
Perceived affordability of family food was assessed by asking the mother/caregiver, “How often can your family afford to consume any of these foods?” Response options were coded: “as often as wanted”, “a little less frequently than wanted”, and “much less frequently than wanted/not at all”. Perception of affordability was dichotomized as “affordable” if response was “as often as wanted” and “not affordable” for the other categories.
Household food consumption was measured by a combination of two complimentary methods; first the mothers were asked to recall foods consumed by the family in the last 24 h. Then, the enumerator read and showed the photos of common foods by family food group whilst asking: “did any household member consume any of these foods in this photo in the last 24 h?” The response options included “yes”, “no”, and “don’t know”; the response category “don’t know” was treated as missing.

2.5. Statistical Analysis

Analysis was conducted using the statistical software program Stata version 15.0 [43]. Standard descriptive statistics were computed for outcome and explanatory variables including percentages and their respective confidence intervals for categorical variables as well as mean and standard deviation for continuous variables. Mixed effect logistic regression models were used to assess the bivariate and multivariable associations between the dependent variables’ family food consumption and the explanatory variables including perceived affordability, wealth quintiles, and maternal education. All models were adjusted for clustering at district level. p-values of <0.05 were considered as statistically significant. The variance of random effect value along with 95% confidence intervals (CI) and standard error (SE) computed to observe heterogeneity between districts. An additional intraclass correlation coefficient (ICC) was conducted to check variance at district level.

2.6. Ethical Consideration

Ethical approval for the EAT Addis study was obtained from the institutional review board of Addis Continental Institute of Public Health with reference number ACIPH/IRB/004/2015 and University of Gondar institutional review board reference number V/P/RCS/05/352/2019. Verbal informed consent was obtained from each of the participants after explaining the purpose of the study and addressing any questions. Permission to conduct the study was obtained from all sub-cities and district level health offices.

3. Results

A total of 14,018 households were visited to identify eligible households, 8293 households had no children under the age of five years and in 194 of the households, respondent mothers/caregivers were not available. Finally, with the response rate of 98.8%, a total of 5467 household were included in the study (Figure 1).
More than half of the mothers (61.1%) were in the age group, 24–34 years, 88% were married and 47% had 12 or more years of schooling. The average family size for households in our study was 4.3 ± 1.5, and only about one-fifth of families owned the house they live in (21.3%) (Table 1).

3.1. Perceived Availability, Affordability, and Consumption of Family Food

Most food groups were perceived to be highly available in the market (Table 2). All food groups were reported to be available by more than 90% of the participants except for fish (73.5%). Due to the reported high perceived availability of the food items, the social stratification and its explanatory contribution to household consumption was not reported.
Considerable variations were observed in the perceived affordability of family foods ranging from 16% to 89%. Fish was perceived affordable only by 16.2% (95% CI: 15.2, 17.2) of the households. Other food groups were perceived to be affordable by less than 50% of households; vitamin A rich fruits (38.3%; 95% CI: 37.0, 39.6), other fruits (46.6%; 95%CI: 45.3, 48.0), and meat (32.4%; 95% CI: 31.2, 33.7). The highly perceived affordable food groups included cereals and white roots/tubers (89.2%; 95% CI: 88.4, 90.1), other vegetables (86.0%; 95% CI: 85.1, 87.0), and legumes, nuts and seeds (84.5%, 95% CI: 83.5, 85.4) (Table 2).
The main foods consumed in the study population were cereals and white roots/tubers (99.3%; 95% CI: 99.0, 99.5), followed by other vegetables (97.5; 95% CI: 97.1, 97.9), and legumes, nuts and seeds (84.9%; 95% CI: 84.0, 85.9). The reported consumption of fish was the lowest (2.3%; 95% CI: 1.9, 2.7). The consumption of other food groups was also reported by 50% or less proportion of the households; vitamin A rich fruits (10.0%; 95% CI: 9.2, 10.8), dark green leafy vegetables (23.1%; 95% CI: 22.0, 24.2), vitamin A rich vegetables (24.9%; 95% CI: 23.7, 26.0), other fruits (33.2%; 95% CI: 32.0, 34.5), meat (31.5%%; 95% CI: 30.3, 32.8), eggs (27.7%%; 95% CI: 26.5, 28.9), and dairy products (45.9%; 95% CI: 44.5, 47.2). The consumption pattern showed households have a monotonous staple diet with limited diet diversity (Table 2). The three most highly consumed food groups i.e., cereals and white roots/tubers, other vegetables, and legumes, nuts and seeds were not considered in the regression models evaluating associations with wealth and maternal education.

3.2. Social Stratification of Perceived Affordability and Consumption of Family Food

The perceived affordability and consumption showed significant social stratification by wealth and maternal education; the least educated caretakers and the poorest quintile had the lowest perception of affordability as well as consumption for most of the food groups. Both affordability and consumption showed significant differences between the lowest and the highest wealth quintiles and maternal education categories for all food groups except cereals/white roots and tubers. The largest differences in perceived affordability by wealth (lowest versus highest quintile) and education (no education versus college) was observed in fish (3.9-fold by wealth and 4.4-fold by education), meat (3.4-fold by wealth and 3.9-fold by education), and vitamin A fruits (3-fold by wealth and 3.4-fold by education). Similarly, the three largest differences in consumption were observed for fish (7.9-fold by wealth and 6-fold by education), vitamin A rich fruits (3.6-folds by wealth and 5.1-folds by education), and meat (3.1-fold by wealth and 2.7-fold by education) (Table 3).

3.3. Family Food Consumption and Association Attributed to Individual Indicators

To evaluate the relative contribution of wealth, maternal education, and perceived affordability to family consumption of different food groups, we examined their independent association.
After controlling for wealth, maternal education, food security status, and clustering effect in the model, those who reported high affordability (could purchase as much as wanted) were more likely to consume the food items. Except for vitamin A rich fruits, the odds of consuming micronutrient rich foods (vitamin A rich vegetables, dark green leafy vegetables, and other fruits) and protein rich animal source foods (meat, dairy, and eggs) were significantly higher in households that perceived they could afford as much as they wanted as compared to those who could not afford (“not at all/afford much less than I want” categories) (Table 4).
Regarding wealth, after adjusting for maternal education, affordability, food security, and cluster, households in the top wealth categories i.e., fourth and highest quintiles had higher odds of consuming micronutrient rich foods (vitamin A rich fruits and vegetables, dark green leafy vegetables and other fruits) compared to households in the lowest quintile. The odds of households in the highest wealth quintile to consume protein rich animal source foods (meat, dairy, and eggs) were more than 2 times higher than those in the lowest wealth quintile (Table 5).
Regarding maternal education, the adjusted analysis revealed that households with college educated mothers had higher odds for consuming micronutrient rich foods (vitamin A rich fruits and vegetables, dark green leafy vegetables, and other fruits) as compared to households with the least educated mothers (never attended/finished a grade). Consumption of Vitamin A rich fruits showed the highest variation; households with college educated mothers were about 4 times more likely to consume them compared to household with mothers who never attended/finished a grade (AOR: 3.77; 95%CI: 2.43, 5.85). When compared with households that had mothers who never attended/finished a grade; those with a college educated mother had about 2 times higher odds of consuming protein rich animal source foods, meat (AOR: 2.1; 95%CI: 1.64–2.69), eggs (AOR: 2.51; 95%CI: 1.93–3.26) and dairy products (AOR: 2.43; 95%CI: 1.96–3.01) (Table 6).
As indicated in Table 7, considerable heterogeneity was not observed between the study clusters. The ICC showed that from 2% to 7% of the variation attributes to cluster level variance. The lowest variance was observed in dairy, Vitamin A rich and dark green vegetables consumption while the highest variance was observed in meat consumption. (Table 7).

4. Discussion

This study found that all family food groups were perceived to be available in the market. A few food groups (cereals, other vegetables, and legumes) were perceived as affordable by the majority and were also consumed to a large extent. On the contrary, micronutrient rich foods (vitamin A rich fruits and vegetables and dark green leafy vegetables) as well as animal source protein rich foods (meat, dairy, and eggs) showed a considerable variation in perceived affordability as well as consumption with a clear stratification in terms of household wealth and maternal education. Evaluation of the relative contribution of affordability, wealth, and maternal education to consumption of family foods showed, with a few exceptions, that all three of them independently explained consumption of the various family foods; higher perceptions of affordability and socioeconomic resources were associated with higher prevalence of consumption.
All of the family food types with the exception of fish were reported to be available by 90% or more of the respondents. This gives a clear indication that most foods required for a healthy diet are perceived to be available for the vast majority of households. The high availability of foods may be explained by the diversities in food retail alternatives and a high dependability on informal markets which makes the food market more responsive to the need of vulnerable segments of the population [44,45]. This, in turn, makes the more vulnerable less susceptible to food deserts which often occur in urban high-income settings with a high dependence on supermarkets [45]. Another explanation for high availability could be that the supply is increasingly following the demand of the population; as the population size increases, the produce coming to the capital may be increasing. This is especially true for cereals/white roots/tubers which constitutes a major part of the staple diet [46].
While a social stratification was shown, the three food groups (cereals/white roots and tubers, legumes, and other vegetables) were considered affordable by a large proportion of the households as well as were consumed by almost all. Across all social strata, consumption of these three types of foods was the same or higher than what households reported to be able to afford. On the contrary, for the other food groups, households consumed less than what they can afford. This could be due to the interplay of many other factors such as preferences, ability to prepare the foods in the family food groups in terms of having adequate cooking space, time, and skills, all of which have been identified as potential drivers for food choices [13,47,48,49].
The high consumption of cereals and white roots/tubers observed here is consistent with national food consumption survey which reported more than 65% of the energy intake of the population is from carbohydrates [46]. Part of the explanation for the affordability of cereals could be high production [50]; the surplus production could potentially make it slightly more affordable than other items in the market. These perceptions align to the realities of the cost of food in Ethiopia [51]. Except for cereals and white roots/tubers, the price of all other food group categories, particularly vitamin A rich dark green leafy vegetables and animal source food, are increasing markedly [51]. Part of the increase in price of perishable foods could be due to infrastructure and transportation systems resulting in large post-harvest losses [20]. This may also push the price of fruits and vegetables higher. As was reflected earlier, affordability rather than availability is a more serious challenge in improving the family diet in urban settings [21]. Except for dark green leafy vegetables, both micronutrient rich foods (vitamin A rich fruits and vegetables) as well as protein rich foods (meat, dairy and eggs) were neither perceived affordable nor actually consumed by the majority of the households. The high cost of a nutritious diet makes the poor more vulnerable; for example, in low income countries 29% of a household’s income is required to purchase one serving of fruits [23]. In another study where they estimated the cost of a recommended healthy diet relative to households per capita, they found that the cost exceeded the total income for 20% of the world’s populations [52], making it impossible for poor households to meet dietary recommendations.
Households in the highest wealth quintile had higher odds of consuming both micronutrient rich foods (vitamin A rich fruits and vegetables and dark green leafy vegetables) as well as protein rich foods (meat, dairy, and eggs). The difference in consumption between households in the highest compared to the lowest wealth quintile was nearly double for both micronutrient rich as well as animal source protein rich foods and remained significant after adjusting for known confounding factors. Other studies have also shown that higher household wealth status significantly improved purchase and consumption of a diverse diet [26,53]. The better-off households were less vulnerable to price fluctuations putting them in a better position for a more planned diet than the poor households [5,47].
Perceptions of affordability were associated with higher odds of consumption of the food groups. This is in line with studies on fruits and vegetables that have shown these food groups were perceived expensive and hence consumed in a limited amount particularly among the disadvantaged groups [26,54]. Individuals from the lowest wealth quintile may not have adequate cold storage options such as refrigerators to store short-lived items such as meat, dairy, and even fruit and vegetable leading to purchases for one-time use, thus paying higher prices to retailers, which renders these items more unaffordable [55]. Food items that were considered affordable, were widely consumed by our study groups indicating cost is a strong determinant for their diets [22,56].
Maternal education level was also associated with better consumption of a variety of food groups. In households with college educated mothers, consumption of both micronutrient and animal source food was higher compared to households with mothers who never attended/finished a grade. Studies have shown that mothers’ awareness of dietary recommendations and nutrition knowledge as well as diet-related diseases are important factors in diet quality [29]. Understanding the health value of food items is linked to years of schooling; higher levels of schooling have been associated with improved diet diversity [57]. Another possible explanation for the improvement in consumption of different food groups is the fact that educated mothers, are often working outside home, have more self-efficacy in making decisions and subsequently a better income, all of which have been shown to improve the diet of the family [30,58].
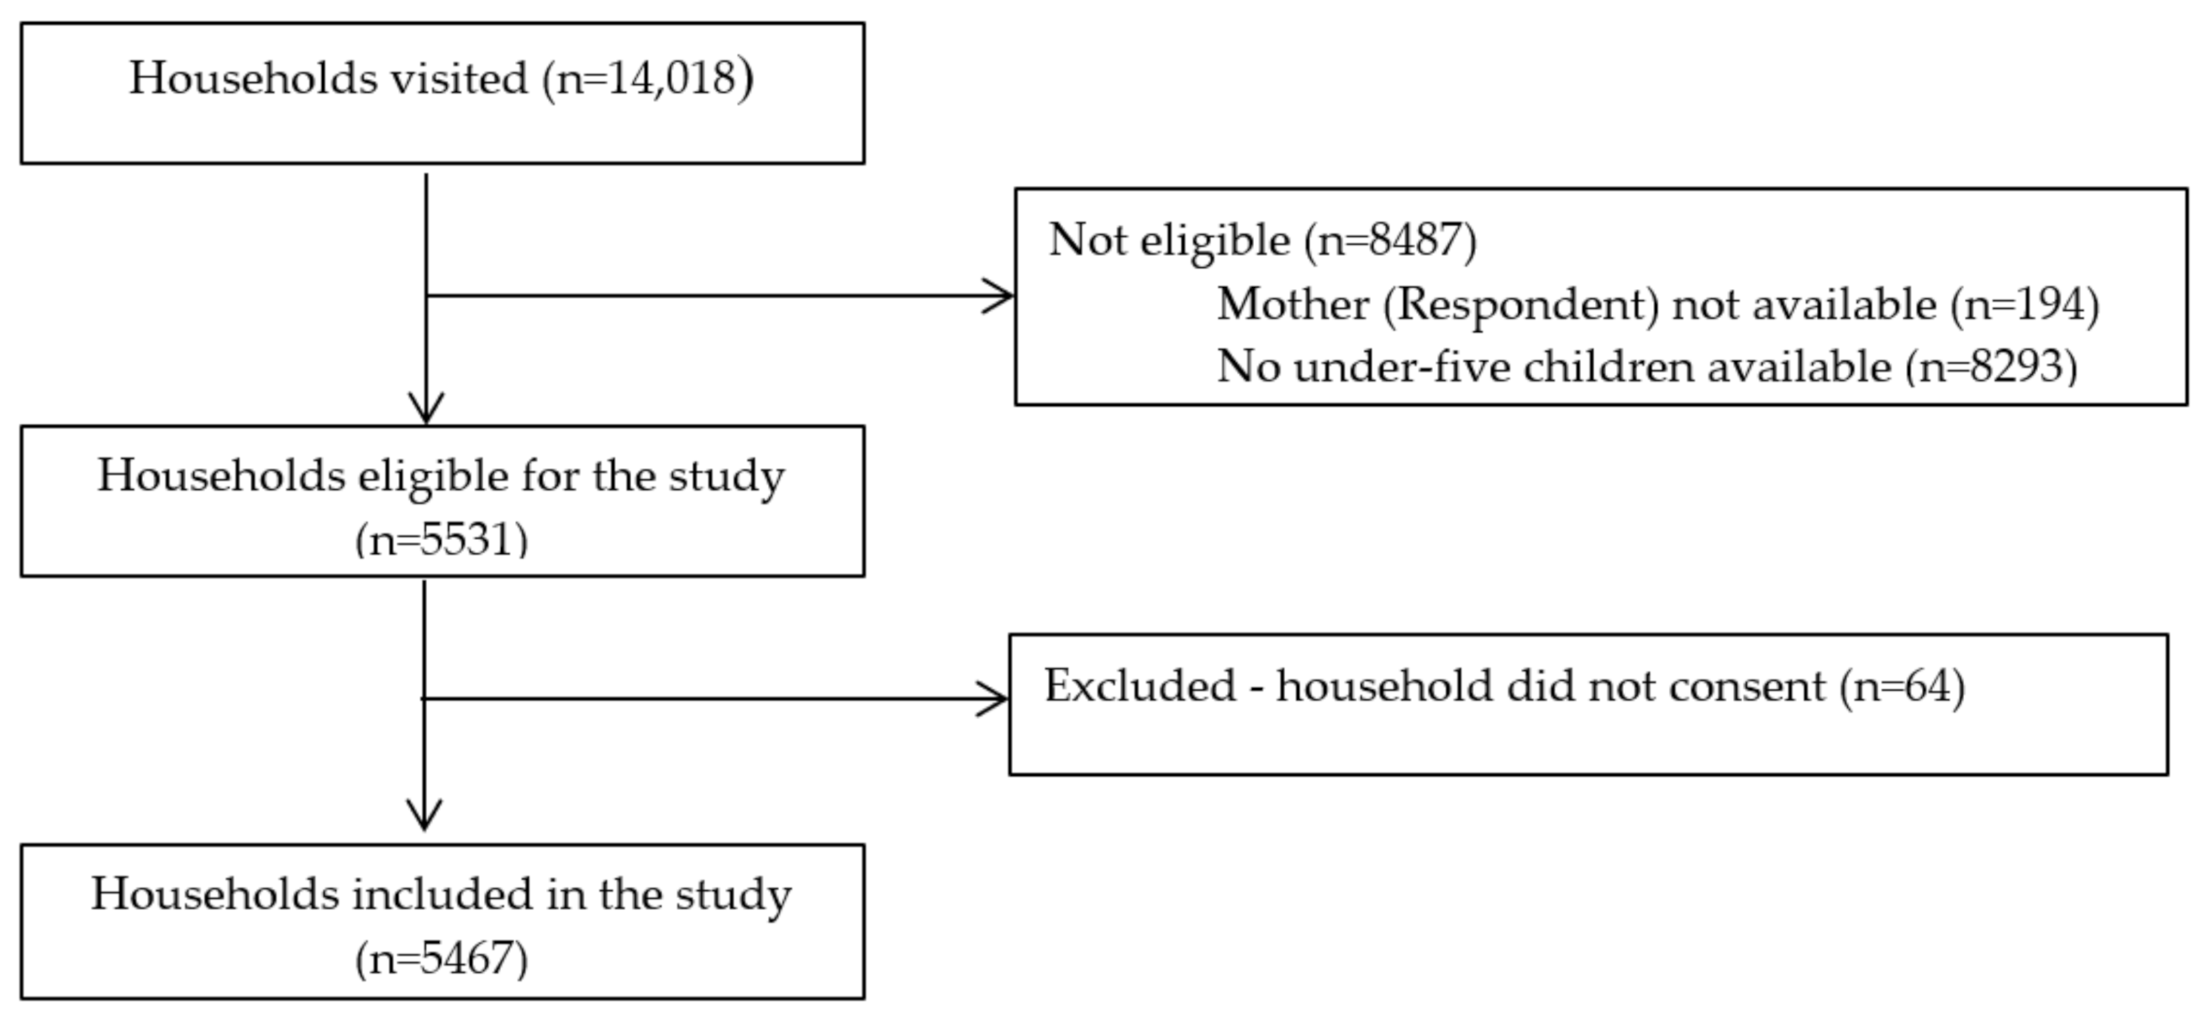
This study is the largest survey in Addis Ababa on the subject matter and draws a sample from all 116 districts (the smallest administrative unit) of the city. To cover seasonal variations due to the availability of food items, the survey was conducted in two rounds; in what is referred to as the season of plenty and the season of scarcity. The response rate was very high in almost all districts. Thus, the findings are a fair representation of the situation in Addis Ababa. That said, cautious interpretation is advised when attempting to generalize the results to other contexts as Addis Ababa presents a slightly different demographic compared to other cities within Ethiopia, due to its diverse population drawing/migrating from all corners of the country.
For this study we developed two new measures: perceived availability and perceived affordability of foods. The translation of the concepts into Amharic were discussed with native speakers in and outside of the research team before pilot testing. In the pilot testing we found that the concepts were easily understood. Preliminary comparison between perceived availability and our simultaneously collected data on actual availability of foods in the residential neighborhoods show good agreement. Further, preliminary analyses show that perceptions of affordability have a socio-economic stratification in the way it is expected. However, while perception-based measurements provide an understanding of people’s perceptions it is difficult to know what their imbedded dimension are. We suggest further research on this.
We used a standard method for sampling of households. As the sampling is based on selection of a physical dwelling (even if at times of low standard) it does exclude homeless inhabitants of Addis Ababa, unfortunately this is almost unavoidable. Finally, the limitations are as always, a risk of potential social desirability in responses as well as residual confounding in statistical analyses.

5. Conclusions

In conclusion, although all the food groups necessary for leading a healthy and nutritious diet were perceived to be available in the food environment, there was a large variation in the perceived affordability and in the actual consumption among the households of Addis Ababa. Generally, households’ food consumption lacked diversity, especially the consumption of micronutrient-rich and animal-source protein-rich foods which were highly limited. All three socio-economic aspects: perception of affordability, maternal education, and household wealth were independently associated and to a similar extent, contributed to variations in consumption. Hence, food policy in this rapidly urbanizing city needs to consider these factors in order to improve the nutritional status of children and families. With cautious interpretation these recommendations may be useful to other in low-income countries’ major cities.

Author Contributions

Conceptualization, S.A., H.Y.B., E.-C.E., and Y.B.; methodology, S.A., H.Y.B., A.W., E.-C.E., and Y.B.; software, S.A.; validation, S.A., H.Y.B. and E.-C.E.; formal analysis, S.A.; investigation, S.A., H.Y.B. and Y.B.; resources, S.A., H.Y.B., M.J., E.-C.E., and Y.B.; data curation, S.A., H.Y.B. and E.-C.E.; writing—original draft preparation, S.A. and H.Y.B.; writing—review and editing, S.A., H.Y.B., M.J., J.T., A.W., E.-C.E., and Y.B.; visualization, S.A., H.Y.B., A.W., E.-C.E., and Y.B.; supervision, S.A. and H.Y.B.; project administration, H.Y.B., E.-C.E. and Y.B.; funding acquisition, H.Y.B., M.J., E.-C.E., and Y.B. All authors have read and agreed to the published version of the manuscript.

Funding

This research was funded by Swedish Research Council Formas, grant number 2016-00272.

Conflicts of Interest

The authors declare no conflict of interest. The funders had no role in the design of the study; in the collection, analyses, or interpretation of data; in the writing of the manuscript, or in the decision to publish the results.

References

  1. HLPE Nutrition and Food Systems. A Report by the High Level Panel of Experts on Food Security and Nutrition of the Committee on World Food Security; FAO Global: Roma, Italy, 2017; Volume 152. [Google Scholar]
  2. Onyango, A.W.; Jean-Baptiste, J.; Samburu, B.; Mahlangu, T.L.M. Regional Overview on the Double Burden of Malnutrition and Examples of Program and Policy Responses: African Region. Ann. Nutr. Metab. 2019, 75, 127–130. [Google Scholar] [CrossRef] [PubMed]
  3. World Health Organization. Atlas of African Health Statistics 2018: Universal Health Coverage and the Sustainable Development Goals in the WHO African Region; World Health Organization, Regional Office for Africa: Cité du Djoué, Republic of Congo, 2018. [Google Scholar]
  4. WHO Double Burden of Malnutrition. Available online: http://www.who.int/nutrition/double-burden-malnutrition/en/ (accessed on 13 September 2020).
  5. International Food Policy Research Institute. 2017 Global Food Policy Report; International Food Policy Research Institute: Washington, DC, USA, 2017. [Google Scholar]
  6. Popkin, B.M.; Corvalan, C.; Grummer-Strawn, L.M. Dynamics of the double burden of malnutrition and the changing nutrition reality. Lancet 2020, 395, 65–74. [Google Scholar] [CrossRef]
  7. Congdon, P. Obesity and Urban Environments. Int. J. Environ. Res. Public Health 2019, 16, 464. [Google Scholar] [CrossRef] [PubMed] [Green Version]
  8. WHO Promoting Fruit and Vegetable Consumption Around the World. Available online: https://www.who.int/dietphysicalactivity/fruit/en/ (accessed on 13 September 2020).
  9. Frank, S.M.; Webster, J.; McKenzie, B.; Geldsetzer, P.; Manne-Goehler, J.; Andall-Brereton, G.; Houehanou, C.; Houinato, D.; Gurung, M.S.; Bicaba, B.W.; et al. Consumption of Fruits and Vegetables Among Individuals 15 Years and Older in 28 Low- and Middle-Income Countries. J. Nutr. 2019, 149, 1252–1259. [Google Scholar] [CrossRef]
  10. WHO Healthy Diet. Available online: https://www.who.int/news-room/fact-sheets/detail/healthy-diet (accessed on 13 September 2020).
  11. Willett, W.; Rockström, J.; Loken, B.; Springmann, M.; Lang, T.; Garnett, T.; Tilman, D.; Wood, A.; DeClerck, F.; Jonell, M.; et al. Our food in the Anthropocene: The EAT-Lancet Commission on Healthy Diets from Sustainable Food Systems. Lancet 2019, 393, 447–492. [Google Scholar] [CrossRef]
  12. Popkin, B.M.; Adair, L.S.; Ng, S.W. Global nutrition transition and the pandemic of obesity in developing countries. Nutr. Rev. 2012, 70, 3–21. [Google Scholar] [CrossRef] [Green Version]
  13. Herforth, A.; Ahmed, S. The food environment, its effects on dietary consumption, and potential for measurement within agriculture-nutrition interventions. Food Secur. 2015, 7, 505–520. [Google Scholar] [CrossRef] [Green Version]
  14. Reardon, T.; Timmer, C.P. The Economics of the Food System Revolution. Annu. Rev. Resour. Econ. 2012, 4, 225–264. [Google Scholar] [CrossRef]
  15. Giskes, K.; van Lenthe, F.J.; Kamphuis, C.B.M.; Huisman, M.; Brug, J.; Mackenbach, J.P. Household and food shopping environments: Do they play a role in socioeconomic inequalities in fruit and vegetable consumption? A multilevel study among Dutch adults. J. Epidemiol. Community Health 2008, 63, 113–120. [Google Scholar] [CrossRef]
  16. Holsten, J.E. Obesity and the community food environment: A systematic review. Public Health Nutr. 2008, 12, 1. [Google Scholar] [CrossRef] [Green Version]
  17. Turner, C.; Aggarwal, A.; Walls, H.; Herforth, A.; Drewnowski, A.; Coates, J.; Kalamatianou, S.; Kadiyala, S. Concepts and critical perspectives for food environment research: A global framework with implications for action in low- and middle-income countries. Glob. Food Secur. 2018, 18, 93–101. [Google Scholar] [CrossRef]
  18. Caspi, C.E.; Sorensen, G.; Subramanian, S.V.; Kawachi, I. The local food environment and diet: A systematic review. Health Place 2012, 18, 1172–1187. [Google Scholar] [CrossRef] [PubMed] [Green Version]
  19. Gustavsson, J.; Cederberg, C.; Sonesson, U. Global Food Losses and Food Waste; The Swedish Institute for Food and Biotechnology: Gòteborg, Sweden, 2013. [Google Scholar]
  20. WHO; FAO (Eds.) Diet, Nutrition, and the Prevention of Chronic Diseases: Report of a WHO-FAO Expert Consultation; WHO Technical Report Series; World Health Organization: Geneva, Switzerland, 2003; ISBN 978-92-4-120916-8. [Google Scholar]
  21. Brand, C.; Bricas, N.; Conaré, D.; Daviron, B.; Debru, J.; Michel, L.; Soulard, C.-T. (Eds.) Designing Urban Food Policies: Concepts and Approaches; Urban Agriculture; Springer International Publishing: Cham, Switzerland, 2019; ISBN 978-3-030-13957-5. [Google Scholar]
  22. Lo, Y.-T.; Chang, Y.-H.; Lee, M.-S.; Wahlqvist, M.L. Health and nutrition economics: Diet costs are associated with diet quality. Asia Pac. J. Clin. Nutr. 2009, 18, 598–604. [Google Scholar] [PubMed]
  23. Miller, V.; Yusuf, S.; Chow, C.K.; Dehghan, M.; Corsi, D.J.; Lock, K.; Popkin, B.; Rangarajan, S.; Khatib, R.; Lear, S.A.; et al. Availability, affordability, and consumption of fruits and vegetables in 18 countries across income levels: Findings from the Prospective Urban Rural Epidemiology (PURE) study. Lancet Glob. Health 2016, 4, e695–e703. [Google Scholar] [CrossRef] [Green Version]
  24. Reid, M.; Worsley, A.; Mavondo, F. Gatekeeper influence on food acquisition, food preparation and family diet. In Proceedings of the Australian and New Zealand Marketing Academy Conference, Melbourne, Australia, 30 November–2 December 2009; Volume 10, pp. 1–8. [Google Scholar]
  25. Burton, M.; Reid, M.; Worsley, A.; Mavondo, F. Food skills confidence and household gatekeepers’ dietary practices. Appetite 2017, 108, 183–190. [Google Scholar] [CrossRef]
  26. Giskes, K.; Avendano, M.; Brug, J.; Kunst, A.E. A systematic review of studies on socioeconomic inequalities in dietary intakes associated with weight gain and overweight/obesity conducted among European adults. Obes. Rev. Off. J. Int. Assoc. Study Obes. 2010, 11, 413–429. [Google Scholar] [CrossRef]
  27. Mayén, A.-L.; Marques-Vidal, P.; Paccaud, F.; Bovet, P.; Stringhini, S. Socioeconomic determinants of dietary patterns in low- and middle-income countries: A systematic review. Am. J. Clin. Nutr. 2014, 100, 1520–1531. [Google Scholar] [CrossRef] [Green Version]
  28. Darmon, N.; Drewnowski, A. Does social class predict diet quality? Am. J. Clin. Nutr. 2008, 87, 1107–1117. [Google Scholar] [CrossRef] [Green Version]
  29. Van Ansem, W.J.; Schrijvers, C.T.; Rodenburg, G.; van de Mheen, D. Maternal educational level and children’s healthy eating behaviour: Role of the home food environment (cross-sectional results from the INPACT study). Int. J. Behav. Nutr. Phys. Act. 2014, 11, 113. [Google Scholar] [CrossRef] [Green Version]
  30. Sinharoy, S.S.; Waid, J.L.; Haardörfer, R.; Wendt, A.; Gabrysch, S.; Yount, K.M. Women’s dietary diversity in rural Bangladesh: Pathways through women’s empowerment. Matern. Child. Nutr. 2018, 14. [Google Scholar] [CrossRef] [Green Version]
  31. Contreras, M.; Blandón, E.Z.; Persson, L.-Å.; Hjern, A.; Ekström, E.-C. Socio-economic resources, young child feeding practices, consumption of highly processed snacks and sugar-sweetened beverages: A population-based survey in rural northwestern Nicaragua. BMC Public Health 2015, 15, 25. [Google Scholar] [CrossRef] [PubMed] [Green Version]
  32. Solomon, D.; Aderaw, Z.; Tegegne, T.K. Minimum dietary diversity and associated factors among children aged 6–23 months in Addis Ababa, Ethiopia. Int. J. Equity Health 2017, 16, 181. [Google Scholar] [CrossRef] [Green Version]
  33. Hawkes, C.; Harris, J.; Gillespie, S. Urbanization and the Nutrition Transition; International Food Policy Research Institute (IFPRI): Washington, DC, USA, 2017. [Google Scholar]
  34. Hawkes, C.; Ruel, M.T.; Salm, L.; Sinclair, B.; Branca, F. Double-duty actions: Seizing programme and policy opportunities to address malnutrition in all its forms. Lancet 2020, 395, 142–155. [Google Scholar] [CrossRef]
  35. WHO What Is Malnutrition? Available online: http://www.who.int/features/qa/malnutrition/en/ (accessed on 13 September 2020).
  36. Zewdie, M.; Worku, H.; Bantider, A. Temporal Dynamics of the Driving Factors of Urban Landscape Change of Addis Ababa During the Past Three Decades. Environ. Manag. 2018, 61, 132–146. [Google Scholar] [CrossRef]
  37. Satterthwaite, D.; McGranahan, G.; Tacoli, C. Urbanization and its implications for food and farming. Philos. Trans. R. Soc. B Biol. Sci. 2010, 365, 2809–2820. [Google Scholar] [CrossRef] [PubMed]
  38. Spaliviero, M.; Cheru, F.; Gasten/Guests. The State of Addis Ababa 2017: The Addis Ababa We Want. Available online: https://openaccess.leidenuniv.nl/handle/1887/58263 (accessed on 13 September 2020).
  39. World Bank Group Addis Ababa, Ethiopia: Enhancing Urban Resilience. Available online: https://www.worldbank.org/en/topic/urbandevelopment/publication/addis-ababa-ethiopia-enhancing-urban-resilience (accessed on 13 September 2020).
  40. Rutstein, S.O. Steps to Constructing the New DHS Wealth Index; ICF International: Rockville, MD, USA, 2015. [Google Scholar]
  41. FAO; FHI 360. Minimum Dietary. In Diversity for Women-A Guide to Measurement; FAO: Rome, Italy, 2016. [Google Scholar]
  42. Kennedy, G.; Ballard, T.; Dop, M.-C. Guidelines for Measuring Household and Individual Dietary Diversity; FAO: Rome, Italy, 2011; ISBN 978-92-5-106749-9. [Google Scholar]
  43. StataCorp Stata Statistical Software: Release 15; StataCorp LLC: College Station, TX, USA, 2017.
  44. Woldu, T.; Abebe, G.; Lamoot, I.; Minten, B. Urban Food Retail in Africa: The case of Addis Ababa, Ethiopia; International Food Policy Research Institute: Washington, DC, USA, 2013. [Google Scholar]
  45. Battersby, J.; Crush, J. Africa’s Urban Food Deserts. Urban Forum 2014, 25, 143–151. [Google Scholar] [CrossRef]
  46. Ethiopian Public Health Institute Ethiopia National Food Consumption Survey. Available online: https://www.ephi.gov.et/images/pictures/National%20Food%20Consumption%20Survey%20Report_Ethiopia.pdf (accessed on 13 September 2020).
  47. Berhane, H.Y.; Ekström, E.-C.; Jirström, M.; Berhane, Y.; Turner, C.; Alsanius, B.W.; Trenholm, J. What Influences Urban Mothers’ Decisions on What to Feed Their Children Aged Under Five—The Case of Addis Ababa, Ethiopia. Nutrients 2018, 10, 1142. [Google Scholar] [CrossRef] [PubMed] [Green Version]
  48. Chaturvedi, S.; Ramji, S.; Arora, N.K.; Rewal, S.; Dasgupta, R.; Deshmukh, V. Time-constrained mother and expanding market: Emerging model of under-nutrition in India. BMC Public Health 2016, 16, 632. [Google Scholar] [CrossRef] [Green Version]
  49. Beshara, M.; Hutchinson, A.; Wilson, C. Preparing meals under time stress. The experience of working mothers. Appetite 2010, 55, 695–700. [Google Scholar] [CrossRef]
  50. Baye, K.; Hirvonen, K.; Dereje, M.; Remans, R. Energy and nutrient production in Ethiopia, 2011–2015: Implications to supporting healthy diets and food systems. PLoS ONE 2019, 14, e0213182. [Google Scholar] [CrossRef] [Green Version]
  51. Bachewe, F.; Hirvonen, K.; Minten, B.; Yimer, F. The Rising Costs of Nutritious Foods in Ethiopia; ESSP II Research Note 67; International Food Policy Research Institute (IFPRI): Washington, DC, USA; Ethiopia Development Research Institute (EDRI): Addis Ababa, Ethiopia, 2017; Volume 4. [Google Scholar]
  52. Hirvonen, K.; Bai, Y.; Headey, D.; Masters, W.A. Affordability of the EAT–Lancet reference diet: A global analysis. Lancet Glob. Health 2020, 8, e59–e66. [Google Scholar] [CrossRef] [Green Version]
  53. Ali, N.B.; Tahsina, T.; Hoque, D.M.E.; Hasan, M.M.; Iqbal, A.; Huda, T.M.; Arifeen, S.E. Association of food security and other socio-economic factors with dietary diversity and nutritional statuses of children aged 6-59 months in rural Bangladesh. PLoS ONE 2019, 14, e0221929. [Google Scholar] [CrossRef] [PubMed] [Green Version]
  54. Giskes, K.; Turrell, G.; Patterson, C.; Newman, B. Socio-economic differences in fruit and vegetable consumption among Australian adolescents and adults. Public Health Nutr. 2002, 5, 663–669. [Google Scholar] [CrossRef] [PubMed] [Green Version]
  55. Hirvonen, K.; Wolle, A. Consumption, Production, Market Access and Affordability of Nutritious Foods in the Oromia Region of Ethiopia; International Food Policy Research Institute (IFPRI): Washington, DC, USA, 2019. [Google Scholar]
  56. Drewnowski, A.; Darmon, N. Food choices and diet costs: An economic analysis. J. Nutr. 2005, 135, 900–904. [Google Scholar] [CrossRef]
  57. Greenaway, E.S.; Leon, J.; Baker, D.P. Understanding the association between maternal education and use of health services in Ghana: Exploring the role of health knowledge. J. Biosoc. Sci. 2012, 44, 733–747. [Google Scholar] [CrossRef] [Green Version]
  58. Shroff, M.R.; Griffiths, P.L.; Suchindran, C.; Nagalla, B.; Vazir, S.; Bentley, M.E. Does maternal autonomy influence feeding practices and infant growth in rural India? Soc. Sci. Med. 1982 2011, 73, 447–455. [Google Scholar] [CrossRef] [Green Version]
Figure 1. Participant flowchart of households included in the study, Addis Ababa, Ethiopia.
Nutrients 12 03168 g001
Table 1. Household, and women’s characteristics, Addis Ababa, Ethiopia.
LevelCharacteristics (n = 5467)% (n) or Mean (±SD)
WomenAge
15–2415.8 (864)
25–3461.1 (3342)
35–4418.3 (999)
45 and above4.8 (262)
Education
Never attend/Not finished first grade13.8 (752)
Grade 1–49.1 (498)
Grade 5–830.0 (1638)
Grade 9–1227.1 (1482)
College20.1 (1097)
Marital status (Married)88.0 (4813)
Involvement in income earning activity26.2 (1432)
HouseholdMale headed households86.5 (4, 729)
Owns a house21.3 (1165)
Family size4.3 (±1.5)
Access to improve water98.5 (5386)
Toilet facility
No facility1.4 (79)
Shared facility76.1 (4160)
Private facility22.5 (1228)
Table 2. Perceived availability, affordability and consumption of family foods in Addis Ababa, Ethiopia.
Food GroupPerceived AvailabilityPerceived Affordability Consumption
n/N% (95% CI)n/N% (95% CI)n/N% (95% CI)
Cereal/w root/tub5463/546799.9 (99.8, 100.0)4879/546789.2 (88.4, 90.1)5428/546799.3 (99.0, 99.5)
Vit A Veg5126/546593.8 (93.1, 94.4)3261/546759.6 (58.3, 61.0)1357/546024.9 (23.7, 26.0)
D Green leafy Veg5163/546494.5 (93.9, 95.1)3333/546761.0 (59.7, 62.3)1261/546023.1 (22.0, 24.2)
Other vegetables5430/546599.4 (99.1, 99.6)4704/546786.0 (85.1, 87.0)5329/546097.5 (97.1, 97.9)
Vit A Fruit4964/544991.1 (90.3, 91.8)2094/546738.3 (37.0, 39.6)547/546410.0 (9.2, 10.8)
Other fruits5162/546694.4 (93.8, 95.0)2549/546746.6 (45.3, 48.0)1816/546133.2 (32.0, 34.5)
Meat5130/546393.9 (93.2, 94.5)1773/546732.4 (31.2, 33.7)1722/546531.5 (30.3, 32.8)
Eggs5203/546595.2 (94.6, 95.8)2726/546749.9 (48.5, 51.2)1511/546327.7 (26.5, 28.9)
Fish3776/513773.5 (72.3, 74.7)884/546716.2 (15.2, 17.2)125/54252.3 (1.9, 2.7)
Leg/nut/seed5399/546798.8 (98.4, 99.0)4619/546784.5 (83.5, 85.4)4643/546784.9 (84.0, 85.9)
Dairy5113/544693.9 (93.2, 94.5)2732/546750.0 (48.6, 51.3)2503/545845.9 (44.5, 47.2)
Abbreviations: Cereal/w root/tub—Cereals and white roots and tubers; Vit A Veg—Vitamin A rich vegetables; D Green leafy Veg—Dark green leafy vegetables; Vit A Fruit—Vitamin A rich fruits; Leg/nut/seed—legumes, nuts and seeds; CI—Confidence Interval.
Table 3. Perception of affordability and consumption of family food by socioeconomic resources, Addis Ababa, Ethiopia.
Food Groups Wealth Maternal Education
Lowest QuintileSecond QuintileMiddle QuintileFourth QuintileHighest Quintilep ValueRatio Highest/LowestNo EducationGrade 1–4Grade 5–8Grade 9–12Collegep ValueRatio College/No Education
(N = 1106)(N = 1093)(N = 1083)(N = 1098)(N = 1087)(N = 752)(N = 498)(N = 1638)(N = 1482)(N = 1097)
%%%%% %%%%%
Perceived Affordability *
Cereal/w root/tub81.788.290.091.195.3<0.011.280.682.787.793.395.1<0.011.2
Vit A Veg43.753.863.360.677.3<0.011.839.245.855.666.077.5<0.012.0
D Green leafy Veg45.356.262.363.577.8<0.011.740.246.257.567.977.8<0.011.9
Other vegetables78.184.788.287.392.0<0.011.276.676.784.890.792.3<0.011.2
Vit A Fruit20.330.238.241.761.4<0.013.018.022.331.345.160.9<0.013.4
Other fruits25.538.849.251.568.5<0.012.724.728.741.053.469.2<0.012.8
Meat16.525.029.734.856.5<0.013.414.217.724.738.055.6<0.013.9
Eggs30.041.452.152.973.3<0.012.426.633.144.357.371.7<0.012.7
Fish7.911.814.216.430.7<0.013.96.97.211.218.730.5<0.014.4
Leg/nut/seed78.284.586.683.190.2<0.011.276.678.78388.589.3<0.011.2
Dairy31.744.151.154.968.5<0.012.228.535.943.657.670.4<0.012.5
Consumption
Cereal/w root/tub99.399.399.399.399.40.991.099.398.899.199.699.40.311.0
Vit A Veg16.417.725.926.138.4<0.012.314.416.921.429.334.8<0.012.4
D Green leafy Veg16.420.023.923.332.0<0.012.017.018.122.123.630.3<0.011.8
Other vegetables97.398.497.097.497.50.261.09895.697.097.798.7<0.011.0
Vit A Fruit5.26.68.311.318.8<0.013.63.56.87.012.017.9<0.015.1
Other fruits20.227.534.237.447.1<0.012.317.621.728.038.649.8<0.012.8
Meat16.025.732.734.549.1<0.013.117.816.527.035.948.6<0.012.7
Eggs15.723.228.031.540.2<0.012.613.318.724.932.039.8<0.013.0
Fish0.71.11.82.45.5<0.017.90.81.20.93.14.8<0.016.0
Leg/nut/seed88.587.384.783.081.1<0.010.989.085.786.185.179.9<0.010.9
Dairy32.941.446.049.060.1<0.011.828.131.841.454.459.5<0.012.1
* Perceived affordability is presented as affordable for those who responded can afford to consume the food item as often as wanted. p value of chi-square test presented. Abbreviation: Cereal/w root/tub—Cereals and white roots and tubers; Vit A Veg—Vitamin A rich vegetables; D Green leafy Veg-—Dark green leafy vegetables; Vit A Fruit—Vitamin A rich fruits; Leg/nut/seed—legumes, nuts, and seeds.
Table 4. Family food consumption and its association with perceived affordability, Addis Ababa, Ethiopia.
Family Food GroupsModelAffordability
Much Less than Wanted/Not at AllLittle Less than WantedAs Much as Wanted
OR (95% CI)OR (95% CI)
Vit A FruitUnadjustedRef2.56 (0.78,8.43)3.97 (1.24,12.64)
Adjusted 1Ref2.61 (0.77,8.75)2.47 (0.76,8.02)
Vit A VegUnadjustedRef1.29 (0.92,1.80)2.35 (1.72,3.22)
Adjusted 1Ref1.08 (0.77,1.52)1.49 (1.08,2.07)
D Green leafy VegUnadjustedRef1.03 (0.79,1.36)1.78 (1.39,2.29)
Adjusted 1Ref0.95 (0.73,1.26)1.34 (1.02,1.74)
Other fruitsUnadjustedRef1.94 (1.63,2.31)4.11 (3.47,4.87)
Adjusted 1Ref1.49 (1.25,1.79)2.42 (2.00,2.92)
MeatUnadjustedRef2.46 (1.97,3.06)5.44 (4.42,6.70)
Adjusted 1Ref1.80 (1.43,2.26)2.61 (2.07,3.28)
EggUnadjustedRef2.27 (1.93,2.67)3.27 (2.79,3.82)
Adjusted 1Ref1.70 (1.43,2.02)2.00 (1.67,2.40)
DairyUnadjustedRef1.07 (0.72,1.58)2.46 (1.72,3.54)
Adjusted 1Ref0.93 (0.62,1.40)1.61 (1.10,2.36)
1 Model adjusted for Household wealth, maternal education and food security. Clustering effect was controlled for both unadjusted and adjusted models. Abbreviation: Vit A Fruit—Vitamin A rich fruits; Vit A Veg—Vitamin A rich vegetables; D Green leafy Veg—Dark green leafy vegetables; OR—Odds ratio; CI—confidence interval; Ref—Reference group.
Table 5. Family food consumption and its association with household wealth, Addis Ababa, Ethiopia.
Family Food GroupsModelWealth Status
Lowest QuintileSecond QuintileMiddle QuintileForth QuintileHighest Quintile
OR (95% CI)OR (95% CI)OR (95% CI)OR (95% CI)
Vit A FruitUnadjustedRef1.28 (0.89, 1.84)1.66 (1.18, 2.35)2.30 (1.65, 3.20)4.22 (3.09, 5.77)
Adjusted 1Ref1.09 (0.76, 1.58)1.27 (0.89, 1.80)1.64 (1.17, 2.30)2.55 (1.83, 3.54)
Vit A VegUnadjustedRef1.07 (0.85, 1.34)1.73 (1.40, 2.14)1.73 (1.40, 2.15)3.08 (2.51, 3.78
Adjusted 1Ref0.95 (0.76, 1.19)1.42 (1.14, 1.77)1.39 (1.11, 1.73)2.17 (1.74, 2.69)
D Green leafy VegUnadjustedRef1.27 (1.01, 1.58)1.59 (1.28, 1.97)1.54 (1.24, 1.92)2.41 (1.96, 2.98)
Adjusted 1Ref1.17 (0.94, 1.46)1.37 (1.09, 1.70)1.31 (1.04, 1.63)1.82 (1.45, 2.27)
Other fruitsUnadjustedRef1.49 (1.22, 1.82)2.07 (1.70, 2.52)2.33 (1.91, 2.85)3.52 (2.89, 4.28)
Adjusted 1Ref1.25 (1.02, 1.54)1.51 (1.23, 1.85)1.62 (1.31, 1.99)1.92 (1.56, 2.37)
MeatUnadjustedRef1.81 (1.45, 2.24)2.57 (2.08, 3.18)2.67 (2.15, 3.3)4.98 (4.04, 6.15)
Adjusted 1Ref1.51 (1.21, 1.89)1.83 (1.46, 2.29)1.79 (1.43, 2.24)2.66 (2.12, 3.33)
EggUnadjustedRef1.59 (1.28, 1.98)2.06 (1.66, 2.55)2.43 (1.96, 3.01)3.62 (2.93, 4.46)
Adjusted 1Ref1.39 (1.10, 1.73)1.58 (1.27, 1.98)1.79 (1.44, 2.25)2.17 (1.74, 2.72)
DairyUnadjustedRef1.41 (1.18, 1.69)1.76 (1.47, 2.10)1.94 (1.62, 2.32)3.04 (2.54, 3.65)
Adjusted 1Ref1.24 (1.03, 1.49)1.37 (1.14, 1.65)1.47 (1.22, 1.77)1.95 (1.61, 2.36)
1 Model adjusted for affordability, maternal education and food security. Clustering effect was controlled for both unadjusted and adjusted models. Abbreviation: Vit A Fruit—Vitamin A rich fruits; Vit A Veg—Vitamin A rich vegetables; D Green leafy Veg—Dark green leafy vegetables; OR—Odds ratio; CI—confidence interval; Ref—Reference group.
Table 6. Family food consumption and its association with Maternal Education, Addis Ababa, Ethiopia.
Family Food GroupsModelMaternal Education
Never AttendedGrade 1–4Grade 5–8Grade 9–12College
OR (95% CI)OR (95% CI)OR (95% CI)OR (95% CI)
Vit A FruitUnadjustedRef2.04 (1.20, 3.45)2.10 (1.36, 3.26)3.85 (2.52, 5.90)6.15 (4.02, 9.41)
Adjusted 1Ref1.97 (1.16, 3.35)1.77 (1.13, 2.75)2.75 (1.78, 4.25)3.77 (2.43, 5.85)
Vit A VegUnadjustedRef1.17 (0.86, 1.61)1.61 (1.27, 2.04)2.44 (1.93, 3.09)3.06 (2.40, 3.91)
Adjusted 1Ref1.18 (0.86, 1.62)1.43 (1.12, 1.82)1.88 (1.48, 2.40)2.09 (1.62, 2.69)
D Green leafy VegUnadjustedRef1.06 (0.78, 1.43)1.36 (1.08, 1.70)1.48 (1.17, 1.85)2.09 (1.66, 2.65)
Adjusted 1Ref1.02 (0.75, 1.38)1.19 (0.94, 1.50)1.15 (0.90, 1.46)1.46 (1.14, 1.87)
Other fruitsUnadjustedRef1.27 (0.95, 1.69)1.80 (1.44, 2.24)2.88 (2.31, 3.59)4.51 (3.59, 5.66)
Adjusted 1Ref1.22 (0.91, 1.64)1.48 (1.18, 1.85)1.97 (1.57, 2.48)2.58 (2.03, 3.29)
MeatUnadjustedRef0.91 (0.67, 1.24)1.70 (1.36, 2.12)2.51 (2.01, 3.14)4.23 (3.35, 5.33)
Adjusted 1Ref0.85 (0.62, 1.17)1.27 (1.01, 1.61)1.52 (1.19, 1.92)2.10 (1.64, 2.69)
EggUnadjustedRef1.49 (1.09, 2.03)2.16 (1.69, 2.75)3.04 (2.39, 3.88)4.25 (3.31, 5.46)
Adjusted 1Ref1.38 (1.08, 2.04)1.81 (1.41, 2.32)2.11(1.64, 2.72)2.51 (1.93, 3.26)
DairyUnadjustedRef1.16 (0.9, 1.49)1.77 (1.46, 2.14)2.96 (2.44, 3.6)3.60 (2.93, 4.43)
Adjusted 1Ref1.13 (0.88, 1.46)1.52 (1.25, 1.85)2.24 (1.83, 2.73)2.43 (1.96, 3.01)
1 Model adjusted for affordability, Household wealth, and food security. Clustering effect was controlled for both unadjusted and adjusted models. Abbreviation: Vit A Fruit—Vitamin A rich fruits; Vit A Veg—Vitamin A rich vegetables; D Green leafy Veg—Dark green leafy vegetables; OR—Odds ratio; CI-confidence interval; Ref—Reference group.
Table 7. Mixed effect logistic regression results of family food consumption, Addis Ababa, Ethiopia.
Measure of VariationVit A FruitVit A VegD Green Leafy VegOther FruitsMeatEggDairy
Variance of random effect0.10 (0.04–0.25)0.06 (0.02–0.13)0.08 (0.04–0.16)0.10 (0.06–0.17)0.24 (0.16–0.37)0.13 (0.08–0.22)0.07 (0.04–0.13)
SE0.050.020.030.030.050.030.02
ICC (%)3 (1–7)2 (1–4)2 (1–5)3 (2–5)7 (5–10)4 (2–6)2 (1–4)
Publisher’s Note: MDPI stays neutral with regard to jurisdictional claims in published maps and institutional affiliations.

