Article

Effect of Organic Food Intake on Nitrogen Stable Isotopes

Faculté de Médecine, Université de Tours, INSERM, N2C UMR 1069, 37032 Tours, France
*
Author to whom correspondence should be addressed.
Nutrients 2020, 12(10), 2965; https://doi.org/10.3390/nu12102965
Submission received: 30 July 2020 / Revised: 1 September 2020 / Accepted: 25 September 2020 / Published: 28 September 2020
(This article belongs to the Special Issue Dietary Biomarkers in Human Nutrition)

Abstract

:
Food choices affect the isotopic composition of the body with each food item leaving its distinct isotopic imprint. The common view is that the natural abundance of the stable isotopes of nitrogen (expressed as δ15N) is higher in animals than in plants that constitute our contemporary diets. Higher δ15N is thus increasingly viewed as a biomarker for meat and fish intake. Here we show that organic compared to conventional farming increases plant δ15N to an extent that can appreciably impact the performance of δ15N as a biomarker. The error that can arise when organic plants are consumed was modelled for the entire range of proportions of plant versus animal protein intake, and accounting for various intakes of organic and conventionally grown crops. This mass balance model allows the interpretation of differences in δ15N in light of organic food consumption. Our approach shows that the relationship between δ15N and meat and fish intake is highly contextual and susceptible to variation at the population, community or group level. We recommend that fertilization practices and organic plant consumption must not be overlooked when using δ15N as a biomarker for meat and fish intake or to assess compliance to nutritional interventions.

1. Introduction

Biomarkers for the intake of plant and animal proteins can help us to understand relationships between diet and health, and to assess adherence to nutritional interventions aiming at modulating reliance on animal and plant proteins. The natural abundance of the stable isotopes of nitrogen (δ15N) is increasingly viewed as a biomarker for meat and fish intake [1,2,3,4,5]. Recent controlled feeding studies found associations between tissue δ15N and meat and fish intake [1,2], reinforcing the potential of δ15N as a dietary intake biomarker.
The rationale behind this approach lies on the fact that organisms are enriched in 15N relative to their diet [6] likely due to isotopic fractionation during certain metabolic reactions [7]. Animals are, thus, enriched in 15N compared to the plants and other animals that they consume, an isotopic offset that varies with changes in protein and amino acid metabolism [8,9]. Due to the greater length of aquatic food chains, marine products and fish, particularly when not farm-raised [10], have the highest 15N content [11]. δ15N is, therefore, a biomarker of meat and fish intake under the premise that the animal proteins consumed have a higher 15N content than the plant proteins consumed. The 15N content depends on the nitrogen cycle from which a product originates with nitrogen conversion processes fractionating isotopes to different degrees depending on the context [12,13,14]. Human activities and agricultural practices affect the nitrogen cycle.
This higher 15N isotopic abundance in animals than in plants is, indeed, expected in nature. Human mastering of agriculture might have strengthened this difference with the use of synthetic fertilizers. Synthetic fertilizers, an important nitrogen source in modern agriculture, have a low 15N content (δ15N close to 0 ‰) because their nitrogen is derived from atmospheric N2 and fractionation tends to be minimal during their production [12,15]. However, in recent years, the market for organic food has been increasing and land use for organic agriculture expanding [16]. Synthetic fertilizers are prohibited in organic farming, where fertilization is achieved with the application of natural products such as animal manures. According to Bateman and Kelly [13], fertilizers that may be permitted in organic agriculture have a higher 15N content (mean δ15N of 8.5 ‰). Many studies have consequently shown a higher δ15N in organically compared to conventionally grown crops [14] suggesting that the δ15N of the animal proteins compared to the plant proteins consumed, may not be as high when organic plants are the preferred choice.
This study assesses the impact that organic food and fertilization practices can have on the performance of δ15N as a biomarker. A nitrogen mass balance model was developed to test the effect of organic plant intake on body proteins δ15N at various relative intakes of plant and animal proteins. Various scenarios were identified where the performance of δ15N as a biomarker for fish and meat intake is impacted differently.

2. Materials and Methods

2.1. 15N Natural Isotopic Abundance of Organic Plants

δ15N values of edible plants detailed in Supplementary Materials Table S1 were obtained from published literature. As there are more published δ15N data for conventionally grown plants, only studies containing data for both crops considered as organic and conventionally grown were included in our analysis to avoid having imbalanced data in terms not only of plants categories per farming method, but also of sample size. This resulted in the inclusion of 21 studies in our analysis (with 80 and 90 δ15N values for conventionally and organically grown crops, respectively). The isotopic offset between organic and conventionally grown plants (Δ15Norg-conv) was determined from the median δ15N values of the two farming methods:
Δ15Norg-conv = δ15Norganic plants − δ15Nconventional plants

2.2. Effect of Organic Plant Protein Intake on Body 15N Natural Isotopic Abundance

A two-sources isotope mixing model can be use to relate the proportions of plant to animal proteins consumed to tissue δ15N if the isotopic offset between tissue and dietary proteins owing to metabolism is considered. Human tissues δ15N equals the sum of the δ15N of the different proteins consumed, weighted by their proportion to dietary nitrogen, plus an isotopic discrimination factor that is linked to amino acid and protein metabolism [17,18]. As detailed in Supplementary Materials Text S1, separating the nitrogen consumed into nitrogen from either animal or plant sources and further separating the plant sources into conventionally and organically grown plants, the impact of organic food intake on tissue protein δ15N can be assessed using a simple isotopic mass balance calculation:
δ15Ntissue proteins = δ15Nanimal × Panimal + (δ15Nconv plants + Δ15Norg-conv × Porg) × (1-Panimal) + Δ15Ntissue-diet
where δ15Ntissue proteins is the isotopic composition of the body proteins, δ15Nconv plants and δ15Nanimal are the δ15N values of dietary plant and animal proteins, respectively. Panimal is the proportion of dietary proteins occupied by animal proteins and 1-Panimal is the proportion occupied by plant proteins (where protein refers to protein nitrogen). Porg is the proportion of dietary plant proteins occupied by proteins from organically grown plants. Δ15Ntissue-diet is the isotopic change between tissue and dietary proteins owing to metabolism, set here at 3.5‰ (an approximation based on the liver proteins analyzed after the consumption of two diets with different effects on amino acid metabolism [17]).
The error resulting from organic plant intake on δ15Ntissue proteins was then calculated as follows:
δ15N absolute error = Δ15N org-conv × Porg × (1-Panimal)
δ15N relative error = 100 × δ15N absolute error/[δ15Nanimal × Panimal + δ15Nconv plants × (1-Panimal) + Δ15Ntissue-diet]
δ15Ntissue proteins and its absolute and relative error were computed over the whole range of Panimal (0 to 1) and for each 0.1 (10%) increment in Porg. Calculations were performed over the whole range of δ15N values observed in animal proteins according to Huelsemann et al. [11], with the lowest end of δ15Nanimal at 2,83‰, the average δ15N of poultry, and the highest end of δ15Nanimal at 12.39‰, the average δ15N of fish. As in Equation (1), δ15Nconv plants was set as the median of the literature values for conventionally grown plants.

3. Results

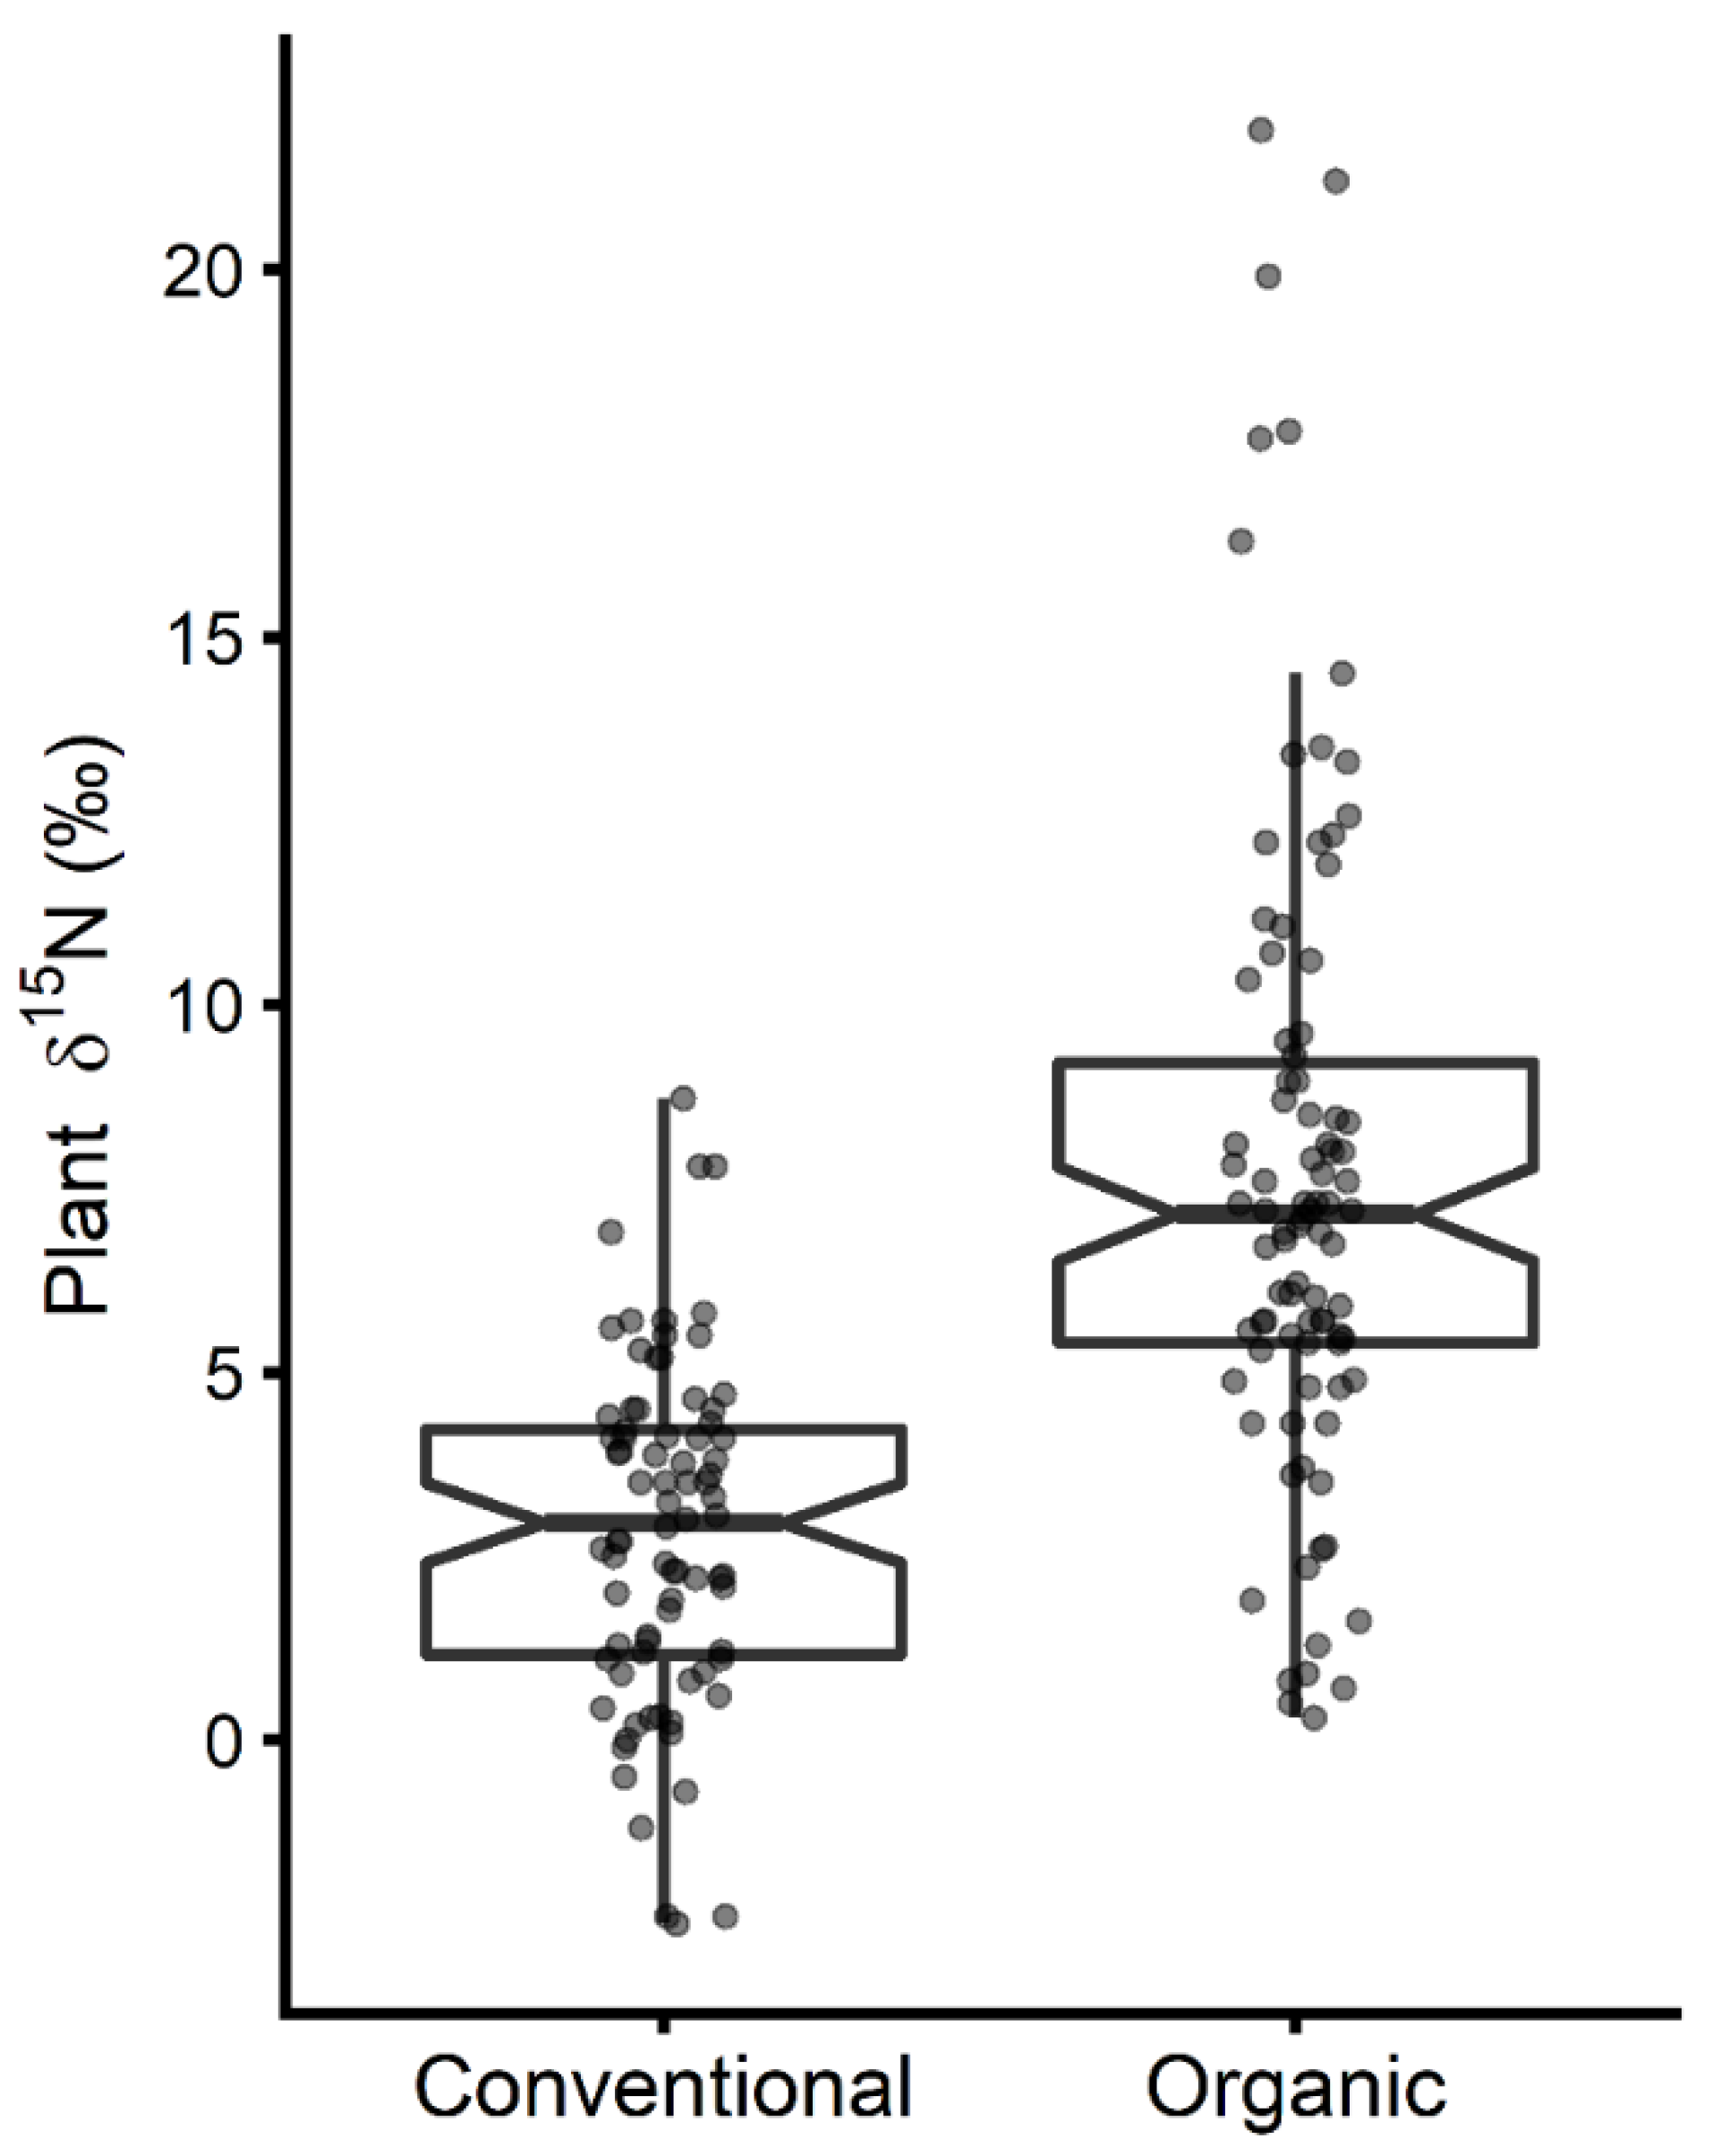
3.1. 15N Natural Isotopic Abundance of Organic Plants

Literature δ15N data for plants grown conventionally or using organic fertilization are displayed in Figure 1. Crops fertilized organically tended to have a higher δ15N. The mean δ15N of organically grown plants was 7.7 ± 4.4‰ (median = 7.2‰) while it was 2.8 ±2.3‰ (median = 3.0‰) for plants fertilized inorganically resulting in a Δ15Norg-conv of 4.2‰. Figure 1 shows an overlap between the δ15N values of organically and conventionally grown plants. The lowest δ15N value for conventional farming was observed in a batch of tomatoes and was of −2.5‰ [15] while the highest value, 8.72‰, was observed in peppers [19] (Table S1). For organic agriculture, the lowest δ15N value, 0.3‰, was measured in peas obtained from an organic grocery store [20] and the highest δ15N values, 21.89‰, in lettuce fertilized with bat guano [21] (Table S1).

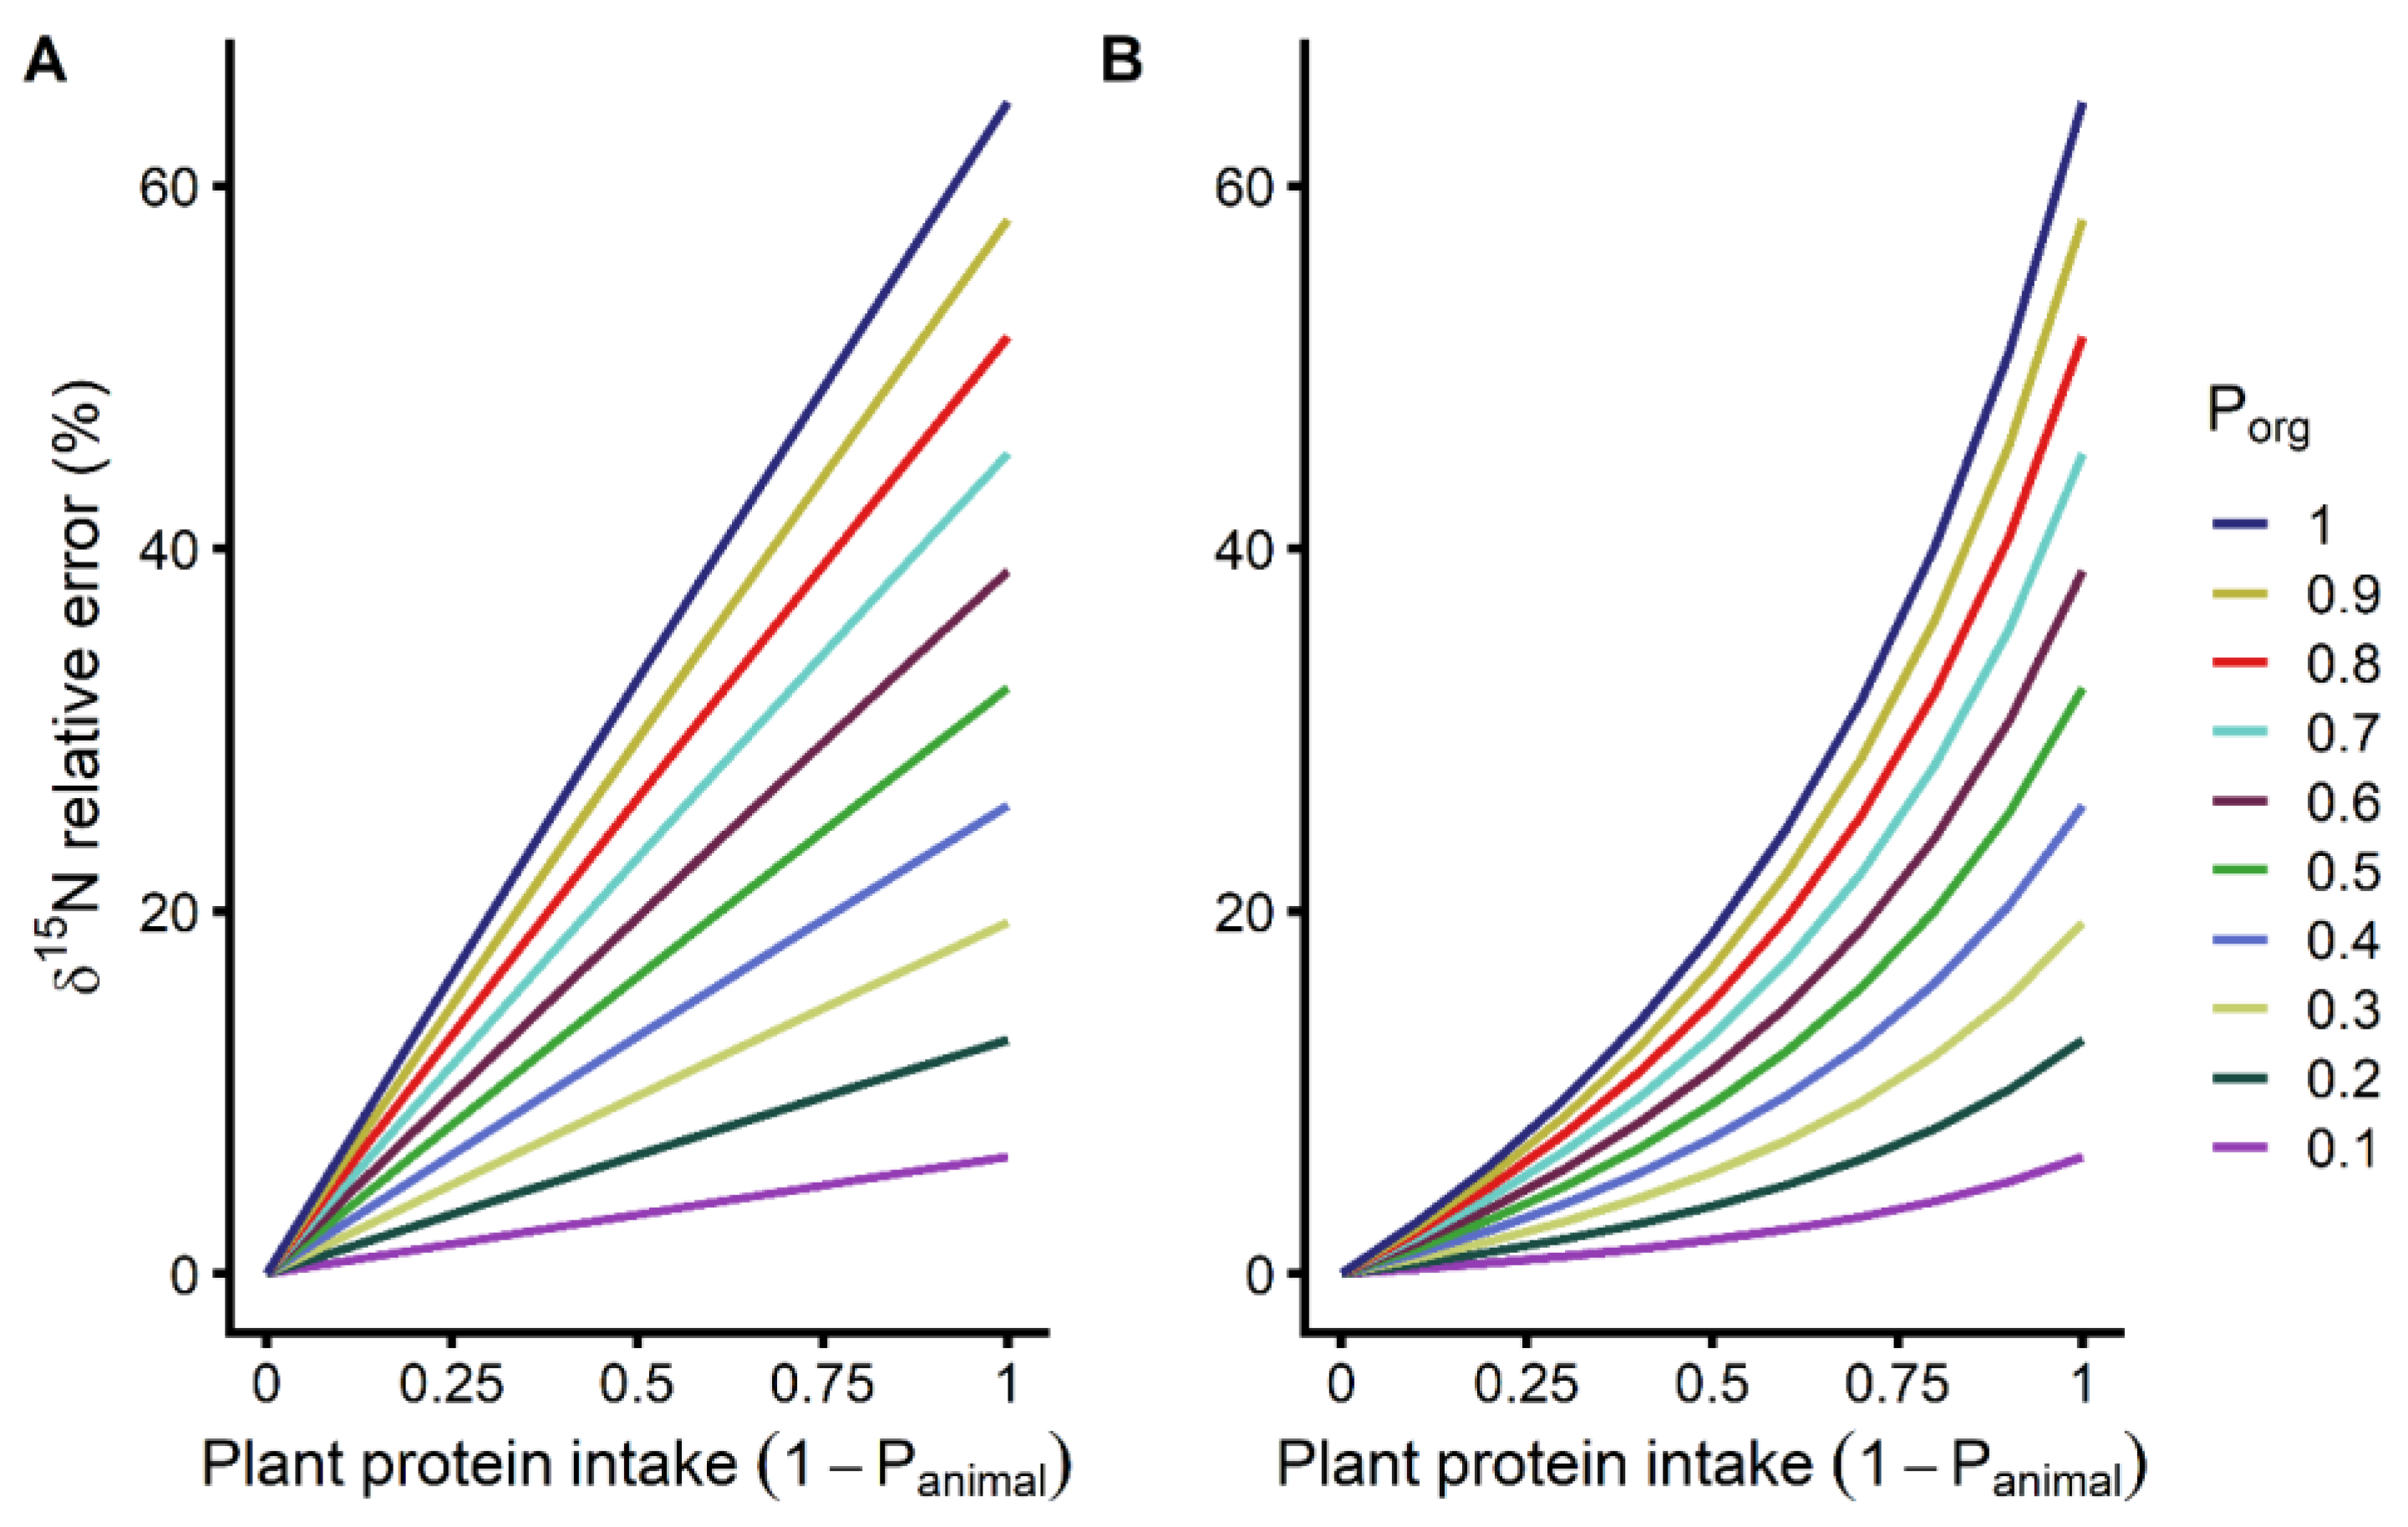
3.2. Effect of Organic Plant Protein Intake on Body 15N Isotopic Abundance

Model output (δ15Ntissue proteins, Equation (2)) is shown in Supplementary Materials Figure S1. At the low end of the δ15Nanimal spectrum, δ15Ntissue proteins increases not only with organic plant intake (Figure S1A), but also with plant protein intake. The opposite relationship between δ15Ntissue proteins and plant protein intake is seen at the high end of the δ15Nanimal spectrum (Figure S1B).
δ15N relative error introduced by organic plant consumption is plotted in Figure 2 as a function of the contribution of plant proteins to total protein intake (1-Panimal). Figure S2 shows the absolute error. As seen from Equation (3), the absolute error is independent of δ15Nanimal. At the usual level of plant protein intake observed in the French and American populations (~30% of protein from plant sources, 1-Panimal = 0.3; [22,23,24]), the error ranged from 0.1‰ to 1.3‰ for low to high Porg (0.1 to 1).
Figure 2 shows the relative error for both the low (Figure 2A) and high (Figure 2B) ends of the δ15Nanimal spectrum. When δ15Nanimal of the dietary intake is low, a situation where the major source of animal protein is poultry, δ15N relative error seems to vary linearly with the relative importance of plant proteins to total protein intake (Figure 2A). In this situation, at the usual level of plant protein intake in the French and American populations (~30% of protein from plant sources, 1-Panimal = 0.3; [22,23,24]), δ15N relative error ranged from 2.0% to 19.8% for low to high Porg. In contrast, Figure 2B shows that when δ15Nanimal of the dietary intake is high, a situation where the main source of animal protein is fish or marine products, δ15N relative error vary non-linearly with the relative importance of plant proteins to total protein intake. In this case, at the usual level of plant protein intake, δ15N relative error ranged from 1.0% to 9.6% for low to high Porg. Maximal error occurs when all of the plant protein intake is from organic sources (Porg = 1), and the proportional plant protein intake is high (1-Panimal close to 1). In that context, for both the low (Figure 2A) and high (Figure 2B) ends the δ15Nanimal spectrum, the maximal δ15N absolute error is 4.2‰ and the relative error 64.6%. As shown in Equation (4), relative error was not only a function of δ15Nanimal, but also dependent on Δ15Ntissue-diet.

4. Discussion

Whereas natural 15N abundance is a candidate biomarker for meat and fish intake [1,2] due to a higher 15N content in meat and fish than in plants, it has been shown that organic compared to conventional farming increases plant δ15N [14]. The present study demonstrates that this isotopic particularity of organic plants impacts the performance of δ15N as a biomarker in humans, for meat and fish intake. Proportional changes in organic compared to non-organic plant consumption impact the body δ15N differently depending on plant and animal protein intakes, and on the δ15N of the animal proteins consumed.

4.1. Organic Farming Impacts Plant Nitrogen Isotopic Composition

Plant δ15N was lower on average for conventionally grown plants than for organically grown plants (Δ15Norg-conv = 4.2‰, Figure 1) due to the use of fertilizers with a high 15N content such as animal manures in organic agriculture. Huelsemann et al. [11] reported a similar yet slightly lower average difference of 3.7‰ between vegetables grown conventionally versus organically with a δ15N of 6.8‰ in organic plants. In the present study, organic plants had an average δ15N of 7.7‰, a value higher than the average δ15N of many animal products. It must be emphasized that these average isotopic differences between conventionally and organically grown plants are highly contextual and dependent on the nitrogen cycle from which the products originate. It has been shown, for instance, that organic fertilization with green manure alone instead of animal manure can result in lower plant δ15N [25,26]. Local practices and potentially rapidly evolving national regulations on organic fertilization must be taken into account when assessing the impact of organic farming on plant δ15N, and thus on body δ15N as a biomarker for fish and meat intake in a population, or a community, and as a marker of compliance in study participants.

4.2. Organic Plant Intake Affects the Performance of δ15N as a Biomarker

We demonstrate here that organic plant intake can affect the performance of 15N natural isotopic abundance as a biomarker for meat and fish intake. This idea was illustrated by computing δ15N changes introduced by organic plant consumption using a mass balance model accounting for proportional intakes of plant and animal proteins (Figure 2). Various proportional intakes of organic relative to non-organic plants were also considered to simulate different frequencies of purchasing organic foods. The goal of this approach was, rather than to reflect the average behaviour of a population, to explore all possibilities that could be seen among individuals and between different populations and communities.
More precisely, potential behavioural differences between individuals affecting their tissue δ15N that were studied were: (1), the intake of plant relative to animal proteins (1-Panimal), (2) the intake of organic relative to non-organic plant proteins (Porg), and (3) the δ15N of animal protein intake (Figure 2A vs. Figure 2B), which depends on the types of animals consumed.
Figure 2 shows that the impact of organic plant consumption on tissue δ15N depends on the intake of plant relative to animal proteins. Studies of the French and American populations showed that plant proteins represent, on average, around 30% of the proteins consumed (1-Panimal = 0.3) [22,23,24]. The proportion of plant protein intake is at 100% on a vegan diet, and when organic plants are consumed, this has the greatest impact on tissue δ15N.
Although the effect of organic farming on the δ15N of vegetables was undeniable in a previous study, it was argued that organic plant intake has a minor effect on the body δ15N of contemporary Germans, who obtains few of their proteins from vegetables and around 30% from cereals, as no significant difference between conventionally and organically grown cereals were observed [11]. There is, however, data clearly showing that organic fertilization can impact cereals δ15N [25,26,27], indicating that such a generalization may not be possible.
We acknowledge some limitations of the current approach. The first one lies in the estimation of Δ15Norg-conv since very little data are available for some plant categories like legumes that tend to have a low δ15N due to atmospheric N2 fixation. A smaller or minor effect of organic fertilization could thus be expected in these plants. Nonetheless, legumes account for a small proportion of total plant protein intake in some populations [24]. This shows that Δ15Norg-conv and, therefore, the effect of organic plant intake on δ15N, is highly circumstantial and dependent on the nitrogen cycle from where consumed plants are grown. Furthermore, the lower digestibility of some vegetable proteins was not explicitly accounted for in Equation (2), which means that proportional plant protein intake (1-Panimal) as used here is the contribution of effectively digested plant proteins to total effectively digested proteins.

4.3. Animal Protein Sources Affect the Performance of δ15N as a Biomarker

The source of animal protein is another modulator of the performance of δ15N as a biomarker that was studied. There is a well-documented δ15N spectrum between different animal categories with poultry at the lower end and fish at the higher end of the δ15N values and with considerable δ15N variability within the animal categories [10,11]. While consumers that choose organic plants might also prefer organic meat, there appear to be no clear effects of organic animal production on their δ15N, which must also be considered as highly context dependent [28]. At the two ends of this δ15N spectrum of animal products, δ15N behave in opposing ways with changes in organic plant intake. When organic plants are consumed and poultry is the main source of animal proteins, increasing proportional intake of plant proteins makes the body δ15N closer to that of meat and fish, while it is the opposite when animal proteins are predominantly from an aquatic origin (Figure S1). This reemphasizes that the capacity of δ15N as biomarker for meat and fish intake [1,2] is very contextual. Furthermore, these opposite δ15N behaviors between the two modeled dietary scenarios (Figure S1) show that the directionality of the error that ranges between 0‰ and Δ15Norg-conv (Figure S2, Equation (3)) depends on the difference in δ15N between dietary plants and animals. If the δ15N is higher in dietary plants than in animal proteins, the error is positive; when δ15N of animal proteins is higher the error is negative. Opposite error directionalities show that the common view that meat intake increases tissue δ15N is not always valid. Although, as can be seen from Equation (3), the absolute isotopic impact in ‰ of organic plant intake (Figure S2) is independent of the source of animal proteins, δ15N relative error propagates differently along the plant protein intake axis depending on the δ15N of the animal proteins consumed (Figure 2). Having poultry as the main source of animal proteins results in a higher relative impact at low proportional intake of plant proteins (Figure 2A). In contrast, if the main source of animal proteins is from an aquatic origin, the relative impact on δ15N of organic plant intake will increase more sharply when the proportional intake of plant proteins is high (non-linear increase in Figure 2B). This latter scenario is of relevance to pescatarians on a predominantly plant-based diet supplemented with a small amount of fish.
Different relative error propagations due to varying sources of animal proteins raises the question of the meaning of the relative error for an isotopic biomarker. According to our model predictions, this might depend on the δ15N of the studied population and on its homogeneity in terms of δ15N. Relative error could reflect the effect size of the relationship between animal protein intake and δ15N, which can differ across populations due to different δ15N values of the animals and plants consumed. This should be explored more deeply in future work and pertains to another caveat of our approach which is that the isotopic offset between tissue and dietary proteins (Δ15Ntissue-diet in Equation (2)) is likely to increase with plant protein intake [17] due to changes in amino acid metabolism. In proportion, metabolically induced δ15N variations have different impacts depending on the δ15N of consumed proteins.

5. Conclusions

Natural differences in nitrogen isotopic abundance between individuals, is increasingly viewed as a biomarker for meat and fish intake. With an isotopic mass balance equation, considering proportional animal and plant protein intakes, we show that this is not strictly true when organic plants are consumed. There can even be opposite relationships between tissue 15N content and animal protein intake depending on the context. There is thus no systematic relationship between meat and fish intake and human tissue isotopic composition. Both fertilization practices and their potential evolution, and organic plant consumption must be considered when using the natural abundance of the stable isotopes of nitrogen as a dietary intake biomarker or a compliance marker. A case-by-case approach accounting for the nitrogen cycle should be used and adapted to the population, community or individuals concerned. We hope that future implications include a cautious context-dependent use of the natural abundance of nitrogen isotopes as a marker of food choices and adherence to nutritional advice.

Supplementary Materials

The following are available online at https://www.mdpi.com/2072-6643/12/10/2965/s1: Figure S1: Model output (Equation (2)) showing δ15Ntissue proteins at the low (A) and high (B) ends of the δ15Nanimal spectrum, Figure S2: δ15N absolute error resulting from organic plant intake (Equation (3)), Table S1: Edible plant δ15N values, Text S1: Calculations of the effect of organic food intake on tissue proteins δ15N.

Author Contributions

Conceptualization, O.L.M., A.D.L. and R.H.; methodology, O.L.M.; software, O.L.M.; validation, O.L.M., A.D.L., M.L.P. and R.H.; formal analysis, O.L.M.; investigation, O.L.M.; resources, O.L.M. and R.H.; data curation, O.L.M.; writing—original draft preparation, O.L.M.; writing—review and editing, O.L.M., A.D.L., M.L.P. and R.H.; visualization, O.L.M. All authors have read and agreed to the published version of the manuscript.

Funding

This research received no external funding.

Conflicts of Interest

The authors declare no conflict of interest.

References

  1. Votruba, S.B.; Shaw, P.A.; Oh, E.J.; Venti, C.A.; Bonfiglio, S.; Krakoff, J.; O’Brien, D.M. Associations of plasma, RBCs, and hair carbon and nitrogen isotope ratios with fish, meat, and sugar-sweetened beverage intake in a 12-wk inpatient feeding study. Am. J. Clin. Nutr. 2019, 110, 1306–1315. [Google Scholar] [CrossRef] [PubMed]
  2. Yun, H.Y.; Lampe, J.W.; Tinker, L.F.; Neuhouser, M.L.; Beresford, S.A.; Niles, K.R.; Mossavar-Rahmani, Y.; Snetselaar, L.G.; Van Horn, L.; Prentice, R.L. Serum nitrogen and carbon stable isotope ratios meet biomarker criteria for fish and animal protein intake in a controlled feeding study of a Women’s Health Initiative Cohort. J. Nutr. 2018, 148, 1931–1937. [Google Scholar] [CrossRef] [PubMed] [Green Version]
  3. Petzke, K.J.; Boeing, H.; Klaus, S.; Metges, C.C. Carbon and nitrogen stable isotopic composition of hair protein and amino acids can be used as biomarkers for animal-derived dietary protein intake in humans. J. Nutr. 2005, 135, 1515–1520. [Google Scholar] [CrossRef] [Green Version]
  4. Kuhnle, G.G.; Joosen, A.M.; Kneale, C.J.; O’Connell, T.C. Carbon and nitrogen isotopic ratios of urine and faeces as novel nutritional biomarkers of meat and fish intake. Eur. J. Nutr. 2013, 52, 389–395. [Google Scholar] [CrossRef] [PubMed] [Green Version]
  5. Patel, P.S.; Cooper, A.J.; O’Connell, T.C.; Kuhnle, G.G.; Kneale, C.K.; Mulligan, A.M.; Luben, R.N.; Brage, S.; Khaw, K.-T.; Wareham, N.J. Serum carbon and nitrogen stable isotopes as potential biomarkers of dietary intake and their relation with incident type 2 diabetes: The EPIC-Norfolk study. Am. J. Clin. Nutr. 2014, 100, 708–718. [Google Scholar] [CrossRef] [PubMed] [Green Version]
  6. O’Brien, D.M. Stable isotope ratios as biomarkers of diet for health research. Annu. Rev. Nutr. 2015, 35, 565–594. [Google Scholar] [CrossRef] [Green Version]
  7. Macko, S.A.; Estep, M.L.F.; Engel, M.H.; Hare, P. Kinetic fractionation of stable nitrogen isotopes during amino acid transamination. Geochim. Cosmochim. Acta 1986, 50, 2143–2146. [Google Scholar] [CrossRef]
  8. Mantha, O.L.; Polakof, S.; Huneau, J.F.; Mariotti, F.; Poupin, N.; Zalko, D.; Fouillet, H. Early changes in tissue amino acid metabolism and nutrient routing in rats fed a high-fat diet: Evidence from natural isotope abundances of nitrogen and carbon in tissue proteins. Br. J. Nutr. 2018, 119, 981–991. [Google Scholar] [CrossRef] [Green Version]
  9. Huneau, J.-F.; Mantha, O.L.; Hermier, D.; Mathé, V.; Galmiche, G.; Mariotti, F.; Fouillet, H. Natural Isotope Abundances of Carbon and Nitrogen in Tissue Proteins and Amino Acids as Biomarkers of the Decreased Carbohydrate Oxidation and Increased Amino Acid Oxidation Induced by Caloric Restriction under a Maintained Protein Intake in Obese Rats. Nutrients 2019, 11, 1087. [Google Scholar] [CrossRef] [Green Version]
  10. Martinelli, L.A.; Nardoto, G.B.; Perez, M.A.; Junior, G.A.; Fracassi, F.C.; Oliveira, J.G.; Ottani, I.S.; Lima, S.H.; Mazzi, E.A.; Gomes, T.F. Carbon and Nitrogen Isotope Ratios of Food and Beverage in Brazil. Molecules 2020, 25, 1457. [Google Scholar] [CrossRef] [Green Version]
  11. Huelsemann, F.; Koehler, K.; Braun, H.; Schaenzer, W.; Flenker, U. Human dietary δ15N intake: Representative data for principle food items. Am. J. Phys. Anthropol. 2013, 152, 58–66. [Google Scholar] [CrossRef] [PubMed]
  12. Choi, W.-J.; Kwak, J.-H.; Lim, S.-S.; Park, H.-J.; Chang, S.X.; Lee, S.-M.; Arshad, M.A.; Yun, S.-I.; Kim, H.-Y. Synthetic fertilizer and livestock manure differently affect δ15N in the agricultural landscape: A review. Agric. Ecosyst. Environ. 2017, 237, 1–15. [Google Scholar] [CrossRef]
  13. Bateman, A.S.; Kelly, S.D. Fertilizer nitrogen isotope signatures. Isot. Environ. Health Stud. 2007, 43, 237–247. [Google Scholar] [CrossRef] [PubMed]
  14. Inácio, C.T.; Chalk, P.M.; Magalhães, A.M. Principles and limitations of stable isotopes in differentiating organic and conventional foodstuffs: 1. Plant products. Crit. Rev. Food Sci. Nutr. 2015, 55, 1206–1218. [Google Scholar] [CrossRef] [PubMed]
  15. Bateman, A.S.; Kelly, S.D.; Jickells, T.D. Nitrogen isotope relationships between crops and fertilizer: Implications for using nitrogen isotope analysis as an indicator of agricultural regime. J. Agric. Food Chem. 2005, 53, 5760–5765. [Google Scholar] [CrossRef]
  16. Willer, H.; Lernoud, J. The World of Organic Agriculture. Statistics and Emerging Trends 2019; Research Institute of Organic Agriculture (FiBL): Frick, Switzerland; IFOAM–Organics International: Bonn, Germany, 2019; ISBN 3-03736-119-0. [Google Scholar]
  17. Poupin, N.; Bos, C.; Mariotti, F.; Huneau, J.-F.; Tomé, D.; Fouillet, H. The nature of the dietary protein impacts the tissue-to-diet 15N discrimination factors in laboratory rats. PLoS ONE 2011, 6, e28046. [Google Scholar] [CrossRef] [Green Version]
  18. Poupin, N.; Mariotti, F.; Huneau, J.-F.; Hermier, D.; Fouillet, H. Natural isotopic signatures of variations in body nitrogen fluxes: A compartmental model analysis. PLoS Comput. Biol. 2014, 10, e1003865. [Google Scholar] [CrossRef] [Green Version]
  19. Del Amor, F.M.; Navarro, J.; Aparicio, P.M. Isotopic discrimination as a tool for organic farming certification in sweet pepper. J. Environ. Qual. 2008, 37, 182–185. [Google Scholar] [CrossRef]
  20. Rogers, K.M. Nitrogen isotopes as a screening tool to determine the growing regimen of some organic and nonorganic supermarket produce from New Zealand. J. Agric. Food Chem. 2008, 56, 4078–4083. [Google Scholar] [CrossRef]
  21. Verenitch, S.; Mazumder, A. Isotopic characterization as a screening tool in authentication of organic produce commercially available in western North America. Isot. Environ. Health Stud. 2015, 51, 332–343. [Google Scholar] [CrossRef]
  22. Camilleri, G.M.; Verger, E.O.; Huneau, J.-F.; Carpentier, F.; Dubuisson, C.; Mariotti, F. Plant and animal protein intakes are differently associated with nutrient adequacy of the diet of French adults. J. Nutr. 2013, 143, 1466–1473. [Google Scholar] [CrossRef] [PubMed]
  23. Bianchi, C.M.; Egnell, M.; Huneau, J.-F.; Mariotti, F. Plant protein intake and dietary diversity are independently associated with nutrient adequacy in French adults. J. Nutr. 2016, 146, 2351–2360. [Google Scholar] [CrossRef] [PubMed] [Green Version]
  24. Pasiakos, S.M.; Agarwal, S.; Lieberman, H.R.; Fulgoni, V.L. Sources and amounts of animal, dairy, and plant protein intake of US adults in 2007–2010. Nutrients 2015, 7, 7058–7069. [Google Scholar] [CrossRef] [PubMed] [Green Version]
  25. Yun, S.-I.; Lim, S.-S.; Lee, G.-S.; Lee, S.-M.; Kim, H.-Y.; Ro, H.-M.; Choi, W.-J. Natural 15 N abundance of paddy rice (Oryza sativa L.) grown with synthetic fertilizer, livestock manure compost, and hairy vetch. Biol. Fertil. Soils 2011, 47, 607–617. [Google Scholar] [CrossRef]
  26. Laursen, K.H.; Mihailova, A.; Kelly, S.; Epov, V.; Bérail, S.; Schjørring, J.K.; Donard, O.; Larsen, E.H.; Pedentchouk, N.; Marca-Bell, A. Is it really organic?—Multi-isotopic analysis as a tool to discriminate between organic and conventional plants. Food Chem. 2013, 141, 2812–2820. [Google Scholar] [CrossRef]
  27. Schmidt, H.; Roßmann, A.; Voerkelius, S.; Schnitzler, W.H.; Georgi, M.; Graßmann, J.; Zimmermann, G.; Winkler, R. Isotope characteristics of vegetables and wheat from conventional and organic production. Isot. Environ. Health Stud. 2005, 41, 223–228. [Google Scholar] [CrossRef]
  28. Inácio, C.T.; Chalk, P.M. Principles and limitations of stable isotopes in differentiating organic and conventional foodstuffs: 2. Animal products. Crit. Rev. Food Sci. Nutr. 2017, 57, 181–196. [Google Scholar] [CrossRef]
Figure 1. Reported plant δ15N values for conventional and organic farming (Table S1). The box represents the interquartile range (IQR), the dark line represents the median, whiskers extend to 1.5 times the IQR, and notches give an estimate of the 95% confidence interval around the median.
Nutrients 12 02965 g001
Figure 2. δ15N relative error resulting from organic plant intake, as a function of proportional plant protein intake (1-Panimal) and organic plant intake (Porg). Data are presented for both the low ((A), 2.83‰) and high ((B), 12.39‰) ends of the animal proteins δ15N range.
Nutrients 12 02965 g002

