Dietary Intake, Mediterranean Diet Adherence and Caloric Intake in Huntington’s Disease: A Review


Abstract
1. Introduction
1.1. Huntington’s Disease and HD Genetics
1.2. Micronutrients, Macronutrients and Neurodegenerative Diseases
1.3. Mediterranean Diet and Neurodegenerative Diseases
2. Materials and Methods
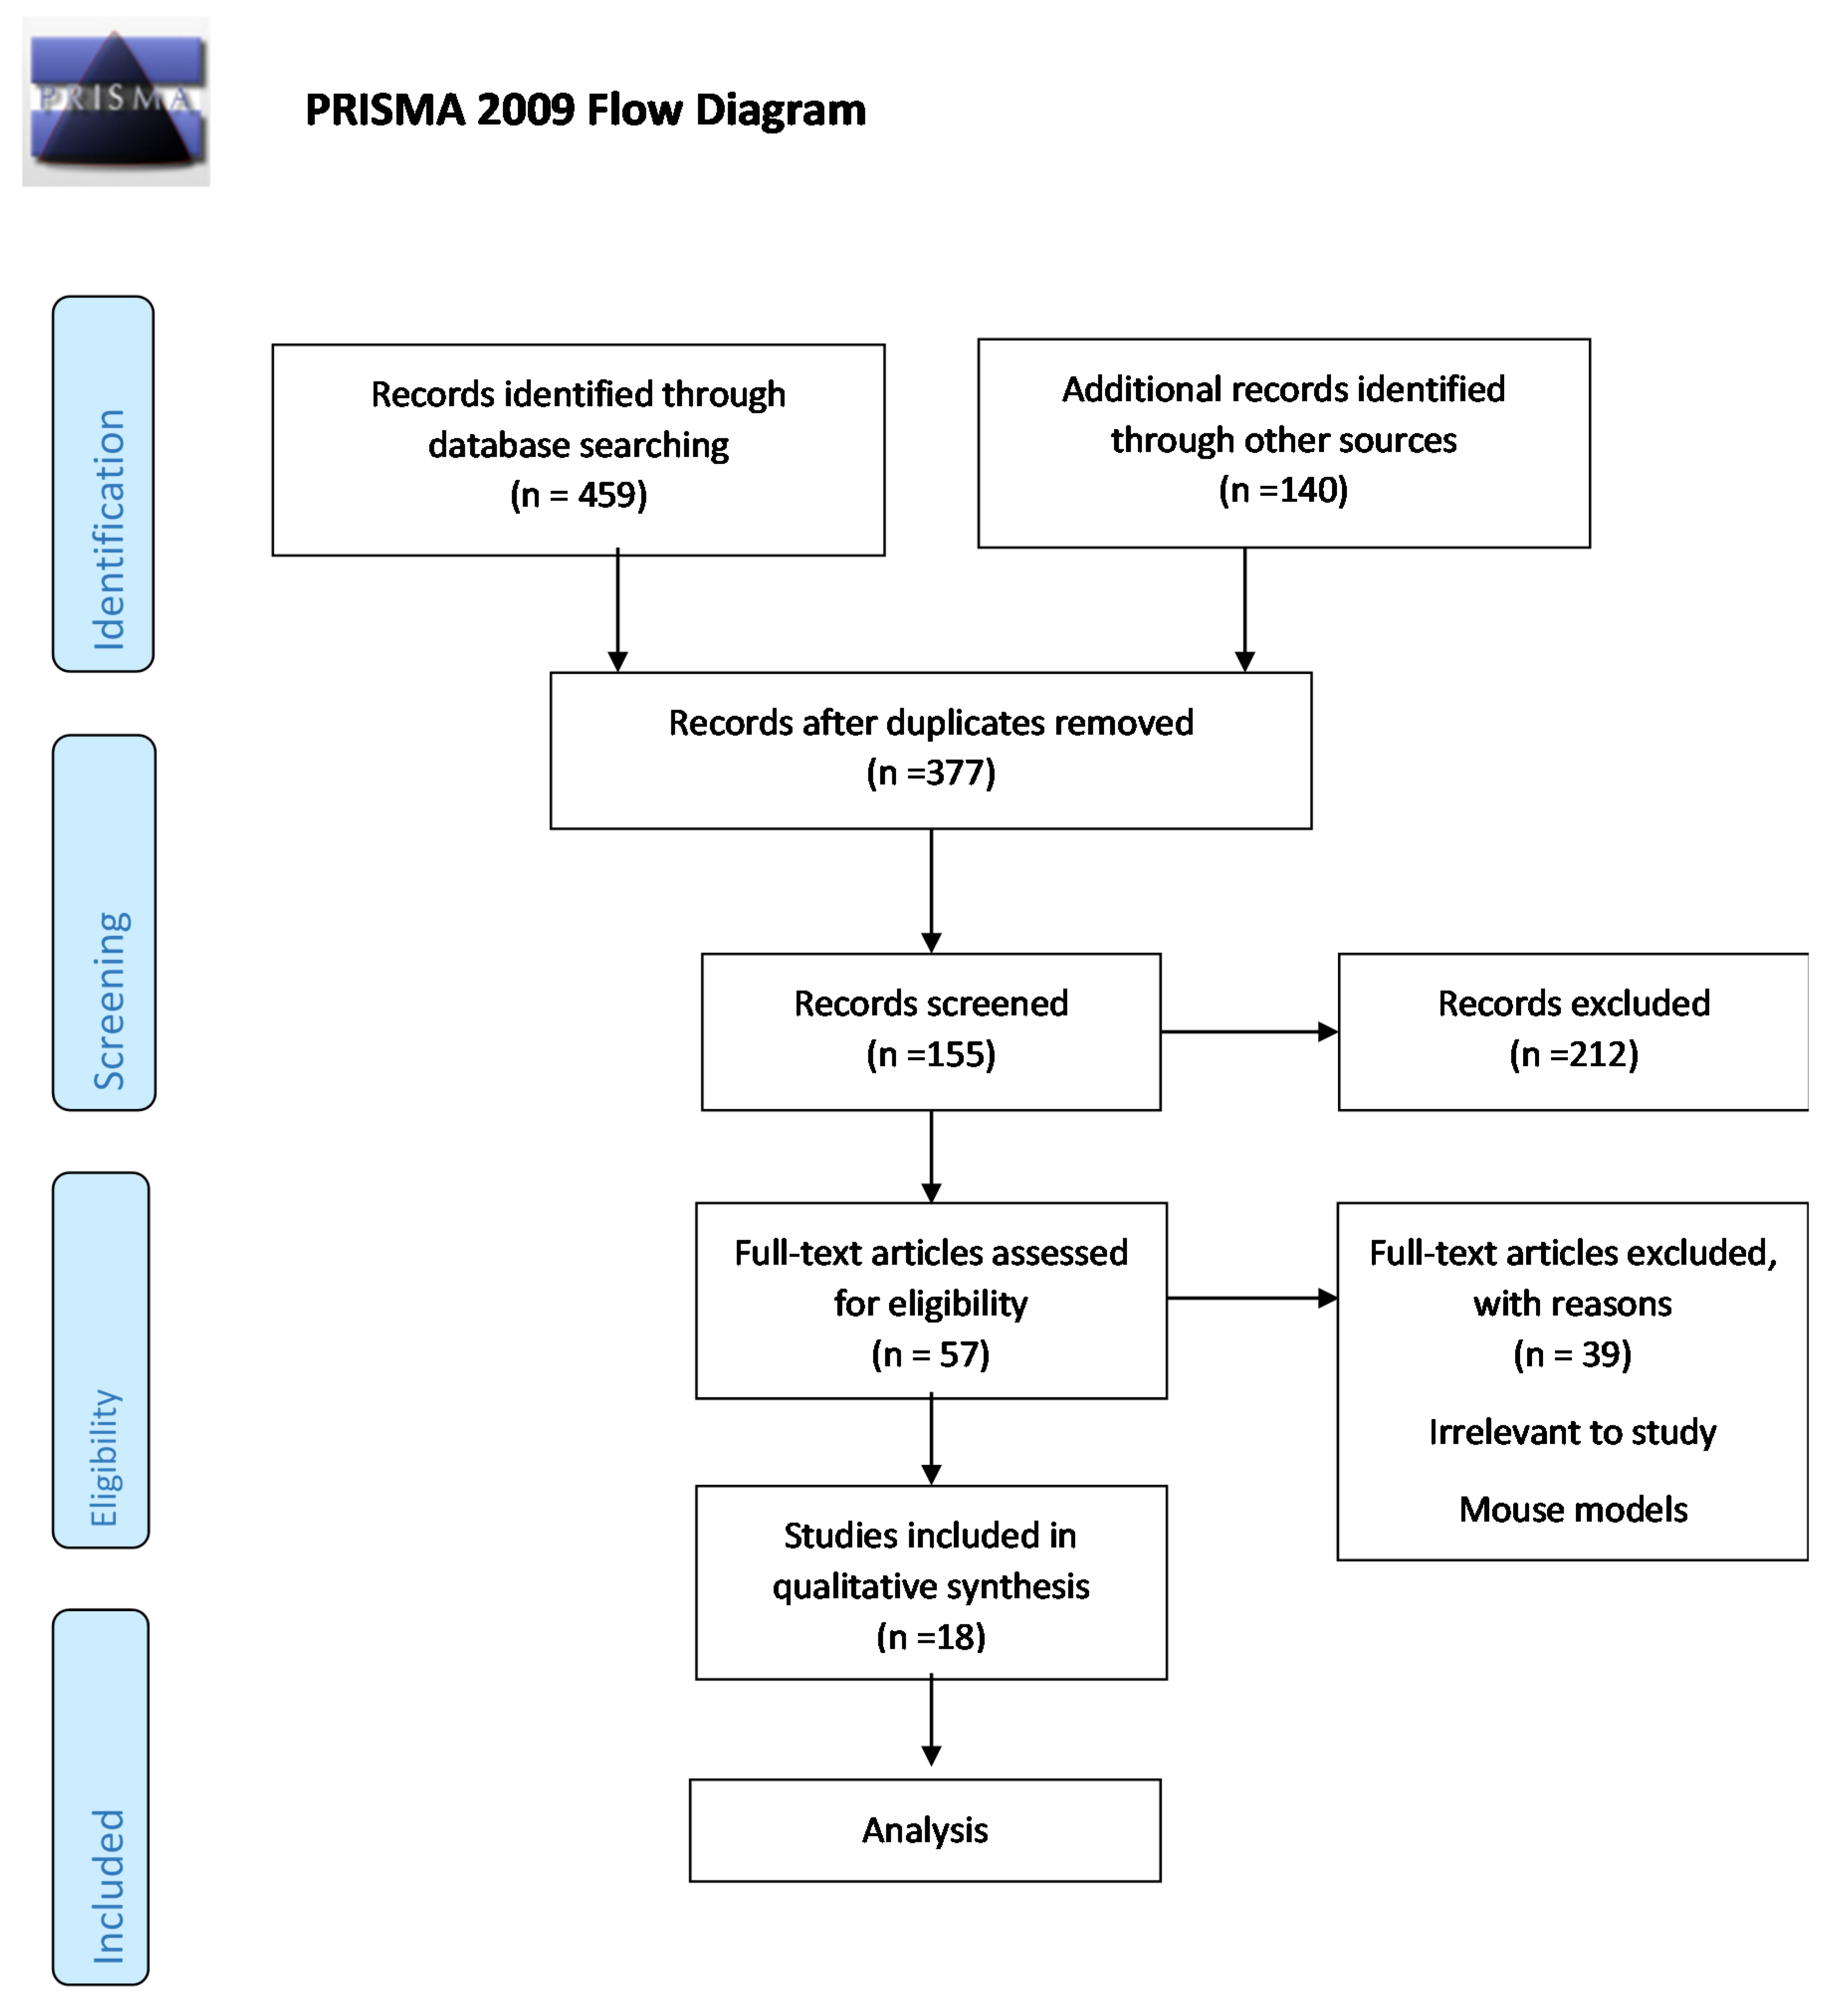
2.1. Search Strategy and Study Selection
2.2. Quality Analysis of Studies
3. Results
3.1. Supplementation
3.2. Micronutrients and Macronutrients
3.3. MD Adherence
3.4. Lifestyle and Dietary Patterns
3.5. Caloric Intake
4. Discussion
5. Conclusions
Supplementary Materials
Author Contributions
Funding
Acknowledgments
Conflicts of Interest
Abbreviations
| AAO | Age of Onset AD Alzheimer’s Disease |
| AIMS | Abnormal involuntary movement |
| ALS | Amyotrophic Lateral Sclerosis |
| AOIM | Age of Onset of Involuntary Movements |
| AOPC | Age of Onset of Psychological Changes |
| BMI | Body Mass Index |
| BBB | Blood Brain Barrier |
| CAG | Cytosine Adenosine Guanine |
| CNS | Central Nervous System |
| DA | Dopamine |
| EHDN | European Huntington’s Disease Network |
| FFQ | Food Frequency Questionnaire |
| GABA | Gamma-Aminobutyric acid |
| HD | Huntington’s Disease |
| HPD | High Protein Diet |
| HTT | Huntingtin |
| IS | Independence Score |
| ITT | Intent to treat |
| LACC | L-acetyl carnitine |
| MD | Mediterranean Diet |
| mHTT | Mutant Huntingtin |
| MMSE | Mini Mental State Examination |
| MUFA | Monounsaturated Fatty Acids |
| NR | Not Reported |
| 3-NP | 3-Nitropmiddleionic acid |
| NS | Non-significant |
| PD | Parkinson’s Disease |
| PP | Protocol Violation |
| PUFA | Polyunsaturated Fatty Acids |
| RCT | Randomized Controlled Trial |
| RP | Rate of progression |
| SFA | Saturated Fatty Acids |
| TFC | Total Functional Capacity |
| TMS | Total Motor Score |
| UA | Uric Acid |
| UHDRS | Unified Huntington’s Disease Rating Scale |
References
- Johri, A.; Beal, M.F. Antioxidants in Huntington’s disease. Biochim. Biophys. Acta-Mol. Basis Dis. 2012, 1822, 664–674. [Google Scholar] [CrossRef] [PubMed]
- Manoharan, S.; Guillemin, G.J.; Abiramasundari, R.S.; Essa, M.M.; Akbar, M.; Akbar, M.D. The Role of Reactive Oxygen Species in the Pathogenesis of Alzheimer’s Disease, Parkinson’s Disease, and Huntington’s Disease: A Mini Review. Oxid. Med. Cell. Longev. 2016, 2016, 1–15. [Google Scholar] [CrossRef] [PubMed]
- Kalathur, R.K.R.; Pedro Pinto, J.; Sahoo, B.; Chaurasia, G.; Futschik, M.E. HDNetDB: A Molecular Interaction Database for Network-Oriented Investigations into Huntington’s Disease. Sci. Rep. 2017, 7. [Google Scholar] [CrossRef] [PubMed]
- Roos, R.A. Huntington’s disease: A clinical review. Orphanet J. Rare Dis. 2010, 5, 40. [Google Scholar] [CrossRef]
- Bates, G.P.; Dorsey, R.; Gusella, J.F.; Hayden, M.R.; Kay, C.; Leavitt, B.R.; Nance, M.; Ross, C.A.; Scahill, R.I.; Wetzel, R.; et al. Huntington disease. Nat. Rev. Dis. Primers 2015, 1, 1–21. [Google Scholar] [CrossRef]
- Walker, F.O. Huntington’s disease. Lancet 2007, 369, 218–228. [Google Scholar] [CrossRef]
- Willett, W.C. Overview and perspective in human nutrition. Asia Pac. J. Clin. Nutr. 2008, 17, 1–4. [Google Scholar]
- Tucker, K.L. Nutrient intake, nutritional status, and cognitive function with aging. Ann. N. Y. Acad. Sci. 2016, 1367, 38–49. [Google Scholar] [CrossRef]
- Gillette-Guyonnet, S.; Secher, M.; Vellas, B. Nutrition and neurodegeneration: Epidemiological evidence and challenges for future research. Br. J. Clin. Pharmacol. 2013, 75, 738–755. [Google Scholar] [CrossRef]
- Caamaño, D.; de la Garza, A.; Beltran-Ayala, P.; Chisanuano, A.M. Nutrition and Neurodegenerative Diseases: The Role of Carbohydrates and Gluten. Int. J. Nutr. Sci. 2016, 1, 1–6. [Google Scholar]
- Seidl, S.E.; Santiago, J.A.; Bilyk, H.; Potashkin, J.A. The emerging role of nutrition in Parkinson’s disease. Front. Aging Neurosci. 2014, 6, 1–14. [Google Scholar] [CrossRef] [PubMed]
- Romagnolo, D.F.; Selmin, O.I. Mediterranean Diet and Prevention of Chronic Diseases. Nutr. Today 2017, 52, 208–222. [Google Scholar] [CrossRef] [PubMed]
- Sofi, F.; Macchi, C.; Casini, A. Mediterranean Diet and Minimizing Neurodegeneration. Curr. Nutr. Rep. 2013. [Google Scholar] [CrossRef]
- Féart, C.; Samieri, C.; Rondeau, V.; Amieva, H.; Portet, F.; Dartigues, J.-F.; Scarmeas, N.; Barberger-Gateau, P. Adherence to a Mediterranean Diet, Cognitive Decline, and Risk of Dementia. JAMA 2009, 302, 638–648. [Google Scholar] [CrossRef] [PubMed]
- Tangney, C.C.; Kwasny, M.J.; Li, H.; Wilson, R.S.; Evans, D.A.; Morris, M.C. Adherence to a Mediterranean-type dietary pattern and cognitive decline in a community population. Am. J. Clin. Nutr. 2011, 93, 601–607. [Google Scholar] [CrossRef]
- Marder, K.; Gu, Y.; Eberly, S.; Tanner, C.M.; Scarmeas, N.; Oakes, D.; Shoulson, I. Relationship of Mediterranean diet and caloric intake to phenoconversion in Huntington disease. JAMA Neurol. 2013, 70, 1382–1388. [Google Scholar] [CrossRef][Green Version]
- Ohlhorst, S.D.; Russell, R.; Bier, D.; Klurfeld, D.M.; Li, Z.; Mein, J.R.; Milner, J.; Ross, A.C.; Stover, P.; Konopka, E. Nutrition research to affect food and a healthy life span. Am. J. Clin. Nutr. 2013, 620–625. [Google Scholar] [CrossRef]
- Rivadeneyra, J.; Cubo, E.; Gil, C.; Calvo, S.; Mariscal, N.; Martínez, A. Factors associated with Mediterranean diet adherence in Huntington’s disease. Clin. Nutr. ESPEN 2016, 12, e7–e13. [Google Scholar] [CrossRef]
- Trichopoulou, A. Modified Mediterranean diet and survival: EPIC-elderly prospective cohort study. BMJ 2005, 330, 1–7. [Google Scholar] [CrossRef]
- Wells, G.; Shea, B.; O’Connell, D.; Peterson, J.; Welch, V.; Losos, M.; Tugwell, P. The Newcastle–Ottawa Scale (NOS) for Assessing the Quality of Non-Randomized Studies in Meta-Analysis. 2000. Available online: http://www.ohri.ca/programs/clinical_epidemiology/oxford.asp (accessed on 9 September 2020).
- Puri, B.K.; Leavitt, B.R.; Hayden, M.R.; Ross, C.A.; Rosenblatt, A.; Greenamyre, J.T.; Hersch, S.; Vaddadi, K.S.; Sword, A.; Horrobin, D.F.; et al. Ethyl-EPA in Huntington disease. Neurology 2005, 65, 286–292. [Google Scholar] [CrossRef]
- Puri, B.K.; Bydder, G.M.; Manku, M.S.; Clarke, A.; Waldman, A.D.; Beckmann, C.F. Reduction in cerebral atrophy associated with ethyl-eicosapentaenoic acid treatment in patients with Huntington’s disease. J. Int. Med. Res. 2008, 36, 896–905. [Google Scholar] [CrossRef]
- Mochel, F.; Duteil, S.; Marelli, C.; Jauffret, C.; Barles, A.; Holm, J.; Sweetman, L.; Benoist, J.-F.; Rabier, D.; Carlier, P.G.; et al. Dietary anaplerotic therapy improves peripheral tissue energy metabolism in patients with Huntington’s disease. Eur. J. Hum. Genet. 2010, 18, 1057–1060. [Google Scholar] [CrossRef] [PubMed]
- Goetz, C.G.; Tanner, C.M.; Cohen, J.A.; Thelen, J.A.; Carroll, V.S.; Klawans, H.L.; Fariello, R.G. L-Acetyl-Carnitine in Huntington disease: Double blind placebo controlled cross-over study of drug effects on movement disorder and dementia. Mov. Disord. 1990, 5, 263–265. [Google Scholar] [CrossRef]
- Cuturic, M.; Abramson, R.K.; Moran, R.R.; Hardin, J.W.; Frank, E.M.; Sellers, A.A. Serum carnitine levels and levocarnitine supplementation in institutionalized Huntington’s disease patients. Neurol. Sci. 2013, 34, 93–98. [Google Scholar] [CrossRef] [PubMed]
- Tabrizi, S.J.; Blamire, A.M.; Manners, D.N.; Rajagopalan, B.; Styles, P.; Schapira, A.H.; Warner, T.T. Creatine therapy for Huntington’s disease: Clinical and magnetic resonance spectroscopy findings in a one year pilot study. Ann. Neurol. 2003, 61, 141–142. [Google Scholar]
- Auinger, P.; Kieburtz, K.; McDermott, M.P. The relationship between uric acid levels and Huntington’s Disease progression. Mov. Disord. 2010, 25, 224–228. [Google Scholar] [CrossRef]
- Trejo, A.; Boll, M.-C.; Alonso, M.E.; Ochoa, A.; Velásquez, L. Use of oral nutritional supplements in patients with Huntington’s disease. Nutrition 2005, 21, 889–894. [Google Scholar] [CrossRef]
- Cubo, E.; Rivadeneyra, J.; Armesto, D.; Mariscal, N.; Martinez, A.; Camara, R.J.; Martínez, D.; Ramos, M.A.; Pastor, B.V.; Párez, R.; et al. Relationship between Nutritional Status and the Severity of Huntington’s Disease. A Spanish Multicenter Dietary Intake Study. J. Huntingtons. Dis. 2015, 4, 75–85. [Google Scholar] [CrossRef]
- Trejo, A.; Tarrats, R.M.; Alonso, M.E.; Boll, M.C.; Ochoa, A.; Velásquez, L. Assessment of the Nutrition Status of Patients With Huntington’s Disease. Nutrition 2004, 20, 192–196. [Google Scholar] [CrossRef]
- Chen, C.-M.; Lin, Y.-S.; Wu, Y.-R.; Chen, P.; Tsai, F.-J.; Yang, C.-L.; Tsao, Y.-T.; Chang, W.; Hsieh, I.-S.; Chern, Y.; et al. High Protein Diet and Huntington’s Disease. PLoS ONE 2015, 10, e0127654. [Google Scholar] [CrossRef]
- Morales, L.M.; Estevez, J.; Suarez, H.; Villabolos, R.; Chacin de Bonilla, L.; Bonilla, E. Nutritional evaluation of Huntington disease patients. Am. J. Clin. Nutr. 1989, 50, 145–150. [Google Scholar] [CrossRef] [PubMed]
- Buruma, O.J.S.; Van der Kamp, W.; Barendswaard, E.C.; Roos, R.A.C.; Kromhout, D.; Van der Velde, E.A. Which factors influence age at onset and rate of progression in Huntington’s disease? J. Neurol. Sci. 1987, 80, 299–306. [Google Scholar] [CrossRef]
- Simonin, C.; Duru, C.; Salleron, J.; Hincker, P.; Charles, P.; Delval, A.; Youssov, K.; Burnouf, S.; Azulay, J.-P.; Verny, C.; et al. Association between caffeine intake and age at onset in Huntington’s disease. Neurobiol. Dis. 2013, 58, 179–182. [Google Scholar] [CrossRef] [PubMed]
- Marder, K.; Zhao, H.; Eberly, S.; Tanner, C.M.; Oakes, D.; Shoulson, I. Dietary intake in adults at risk for Huntington disease. Neurology 2009, 73, 385–392. [Google Scholar] [CrossRef] [PubMed]
- Mochel, F.; Charles, P.; Seguin, F.; Barritault, J.; Coussieu, C.; Perin, L.; Le Bouc, Y.; Gervais, C.; Carcelain, G.; Vassault, A.; et al. Early energy deficit in Huntingdon disease: Identification of a plasma biomarker traceable during disease progression. PLoS ONE 2007, 2, e647. [Google Scholar] [CrossRef] [PubMed]
- Mehrotra, A.; Kanwal, A.; Banerjee, S.K.; Sandhir, R. Mitochondrial modulators in experimental Huntington’s disease: Reversal of mitochondrial dysfunctions and cognitive deficits. Neurobiol. Aging 2015, 36, 2186–2200. [Google Scholar] [CrossRef]
- Wishart, D.S.; Knox, C.; Guo, A.C.; Cheng, D.; Shrivastava, S.; Tzur, D.; Gautam, B.; Hassanali, M. DrugBank: A knowledgebase for drugs, drug actions and drug targets. Nucleic Acids Res. 2008, 36, 901–906. [Google Scholar] [CrossRef]
- Kim, S.; Thiessen, P.A.; Bolton, E.E.; Chen, J.; Fu, G.; Gindulyte, A.; Han, L.; He, J.; He, S.; Shoemaker, B.A.; et al. PubChem substance and compound databases. Nucleic Acids Res. 2016, 44, D1202–D1213. [Google Scholar] [CrossRef]
- Hersch, S.M.; Schifitto, G.; Oakes, D.; Bredlau, A.-L.; Meyers, C.M.; Nahin, R.; Rosas, H.D.; Huntington Study Group CREST-E Investigators and Coordinators. The CREST-E study of creatine for Huntington disease: A randomized controlled trial. Neurology 2017, 89, 594–601. [Google Scholar] [CrossRef]


| Study Reference | Study Countries | Range of Participants | Range of Ages | Study Type |
|---|---|---|---|---|
| Marder et al., 2013 [16] | United States of America (USA) | People with HD recruited from Prospective Huntington at Risk Observational study (PHAROS) 41 HD group sites in US and Canada 1001 participants enrolled in PHAROS 738 individuals completed NIH FFQ Inclusion of 211 HD patients with expanded CAG ≥ 37 | 25–57 years | Prospective cohort study |
| Rivadeneyra et al., 2016 [18] | Spain | 98 Spanish people with HD and pre-manifesting HD carriers of the European Huntington Disease Networks | 48 (range 38–60) | Cohort study |
| Puri et al., 2005 [19] | United Kingdom (UK) | 135 Symptomatic people with HD 67 in Ethyl EPA 68 in placebo group | 50 ± 9.3 (Ethyl EPA group) 49 ± 9.0 (Placebo group) | Double blind, randomized controlled trial (RCT) |
| Puri et al., 2008 [21] | United Kingdom (UK) | 34 Symptomatic people with HD 6 in Ethyl-EPA group 18 in placebo group | 51.3 ± 2.5 48.7 ± 2.2 | Double blind, randomized controlled trial (RCT) |
| Mochel et al., 2010 [22] | France | 6 people with HD with abnormal CAG repeat expansions 5 females 1 male | NR | Short term cohort clinical trial study |
| Goetz et al., 1990 [23] | United State of America (USA) | 10 HD patients in a double blind RCT, crossover design 4 men and 6 women with HD | 51.6 (16.7) | Double blind placebo controlled cross-over study |
| Cuturic et al., 2013 [24] | United State of America (USA) | 23 institutionalized people with HD 6 people with HD treated with hypocarnitinemia 17 people with HD without hypocarnitinemia | 43.4 (10.3) 51. 9 (7.9) | Retrospective study |
| Tabrizi et al., 2003 [25] | United Kingdom (UK) | 10 people with HD and 3 HD mutation carriers 4 age matched controls | NR | Open-label pilot study |
| Auigner et al., 2010 [26] | United State of America (USA) | 347 early HD patients | 18–75 (47.9 years) | Double blind, randomized controlled trial (RCT) |
| Trejo et al., 2005 [27] | Mexico | 30 people with HD 70% male 30% female | 46 (range 20–69) | Interventional study cohort study |
| Cubo et al., 2015 [28] | Spain | 224 Spanish people with HD patients and carriers from the European HD registry (EHDN) Control group from Spanish population obtained from EHIDE | 47.41 ± 14.26 | Observational, cross-sectional study |
| Trejo et al., 2004 [29] | Mexico | 25 people with HD 25 age and sex matched controls | 46 ± 12 (21–70) 46 ± 8 (23–72) | Case-control study |
| Chen et al., 2015 [30] | Taiwan | 30 people with HD 19 men and 11 women 23 controls 12 men and 11 women 14 HD out of 30 people with HD (2 year pilot study) 22 HD patients (1 year follow up) | 44.7 ± 11.4 42.26 ± 2.6 | Intervention and cohort study |
| Morales et al., 1989 [31] | Venezuela | 18 choreic patients 31 offspring (1st generation) 19 individuals (2nd generation) 7 individuals (3rd generation) 40 controls | 15 to 57 years 12 to 72 years 14 to 45 years 18 to 32 years 14 to 72 years | Case-Control study |
| Buruma et al., 1987 [32] | The Netherlands | 51 people with HD | 53 (range 26–78) | Cohort study |
| Simonin et al., 2013 [33] | France | 80 people with HD 41 males 39 females | Not reported (NR) | Cohort study |
| Marder et al., 2009 [34] | United States of America (USA) | People with HD recruited from Prospective Huntington at Risk Observational study (PHAROS) 1001 participants from PHAROS study 675 HD individuals initially completed the National Cancer Institute FFQ 435 participants with non-expanded CAG < 37 and 217 participants with expanded CAG ≥ 37 completed the FFQ BMI 23 individuals excluded due to (missing CAG data and clinically definite HD prior to or at time of FFQ) | Non-expanded CAG < 37 44.9 (7.9) Expanded CAG ≥ 37 43.4 (7.7) | Case-Control study |
| Mochel et al., 2007 [35] | France | 32 HD patients CAG expansion > 36 15 pre-symptomatic 17 symptomatic 21 controls | 42 ± 11 (range 28 to 80 years) 37 ± 9.5 (range 27 to 62 years) | Case-Control study |
| First Author, Year, and Country | Subjects and Ethnicity, N | Mean Age at Blood Collection ± SD Age Range (Years) | Sample Type | Exposure (Dietary Consumption, Dietary Patterns) | Clinical Outcome, Analysis and Effect Estimation | p-Value | Cofounders | Clinical Conclusions |
|---|---|---|---|---|---|---|---|---|
| Marder et al., 2013 (USA) [16] | HD carriers recruited from Prospective Huntington at Risk Observational study (PHAROS) Inclusion of 211 HD carriers with expanded CAG ≥ 37 – asymptomatic at baseline Ethnicity: N/A | 25–57 years | Blood sample for DNA analysis | MeDi score based on FFQ food group intake and Caloric Intake | Multiple regression models comparing indicated variables between MeDi tertiles: Median (25th percentile, 75th percentile) UHDRS MeDi 0–3: 4 (1, 10) MedDi 4–5: 3 (0,8) MeDi 6–9: 2 (1,6) Chorea MeDi 0–3: 0 (0, 3) MedDi 4–5: 0 (0,2) MeDi 6–9: 0 (0,2) Adjusted Hazard ratios from Cox proportional hazard models to predict phenoconversion Caloric intake Medium vs. Low: HR = 0.61 95%: 0.19, 1.99 High vs. Low: HR = 1.70 95%: 0.65, 4.43 MeDi Diet 4-5 vs.0-3: HR = 1.03 95% CI: 0.41, 2.57 6-9 vs. 0-3: HR = 0.74 95% CI: 0.23, 2.42 Cox proportional hazards models: Association between Individual MeDi components and phenoconversion (Lower than sex-specific median intake of detrimental components (i.e., dairy and meat) and higher than sex-specific median intake of beneficial components (i.e., cereal, fish, fruit, legumes, vegetables, MUFA/SFA, moderate alcohol) were treated as reference group: Cereal (Low intake) HR = 1.12 95% CI: 0.50, 2.48 Dairy (High intake) HR = 2.36 95% CI: 1.00, 5.57 Fish (Low intake) HR = 0.71 95% Cl: 0.29, 1.75 Fruit (Low intake) HR = 0.74 95% Cl: 0.30, 1.82 Legumes (Low intake) HR = 1.87 95% Cl: 0.75, 4.62 Meat (High intake) HR = 0.86 95% Cl: 0.37, 1.98 Vegetables (Low intake) HR = 2.05 95% Cl: 0.74, 5.72 MUFA/SFA (Low intake) HR = 1.40 95% Cl: 0.61, 3.19 Alcohol (Moderate intake) HR = 0.8 195% Cl: 0.36 1.83 | 0.100 0.590 0.070 0.730 0.790 0.0507 0.460 0.510 0.180 0.720 0.170 0.430 0.610 | Age CAG repeat length | Adherence to MeDi affects phenoconversion and effects of BMI and caloric intake in time of phenoconversion |
| Rivadeneyra et al., 2016 (Spain) [18] | 98 Spanish HD patients and pre-manifesting HD carriers of the European Huntington Disease Networks Ethnicity: N/A | 48 (range 38–60) | NR | Adherence to Mediterranean Diet and nutrition assessed via 3 days dietary record | Multiple logistic regression model: Moderate MeDi adherence vs. Low (reference) as the dependent variable Comorbidity OR = 0.18 95% (0.05, 0.75) UHDRS Motor score OR = 0.90 95% (0.81, 0.99) High MeDi adherence vs. Low (reference) as the dependent variable UHDRS Motor score OR = 0.81 95% (0.66, 0.98) | 0.018 * 0.041 * 0.033 * | Gender Age Comorbidity UHDRs motor PBAs Dysphagia Physical activity BMI WHtR | Moderate MeDi adherence is associated with better quality life, lower motor impairment and low risk of abdominal obesity compared to HD patients with low MeDi adherence |
| Puri et al., 2005 (UK) [19] | RCT Double blind 135 Symptomatic HD patients 67 in Ethyl EPA 68 in placebo group Ethnicity: Caucasians, African/African Americans and Asians | 50 ± 9.3 49 ± 9.0 | Peripheral blood | 2 g/day ethyl EPA or 2 × 500 mg of capsules of liquid paraffin for a year | ANCOVA test: TMS-4 score ethyl-EPA vs. placebo group 6 months 12 months TMS of UHDRS benefit for ethyl-EPA vs. placebo χ2 test: TMS-4 improvement at 12 months ethyl-EPA group vs. placebo χ2 test: TMS-4 improvement vs. non-improvement for TMS at 12 months for ethyl-EPA group vs. placebo χ2 test: Improvement of total motor score | 0.061 0.110 0.046 * 0.075 0.048 * 0.097 | Age Sex Baseline severity | Ethyl-EPA in the improvement or non-improvement of the TMS-4 score Ethyl-EPA showed stable or improved motor function Relationship between Ethyl-EPA and CAG repeats |
| Puri et al., 2008 (UK) [21] | RCT Double blind 34 Symptomatic HD patients 16 in Ethyl-EPA group 18 in placebo group Ethnicity: N/A | 51.3 ± 2.5 48.7 ± 2.2 | MRI brain scans | 2 g/day of Ethyl-EPA or 2 × 500 mg of light liquid paraffin twice daily for a year | Two samples t test within the framework of a GLM: Global atrophy 0–12 months Ethyl-EPA (Mean change −0.75257) vs. placebo (Mean change −1.22381) 0–6 months Ethyl-EPA (Mean change -0.3175) vs placebo (Mean change -0.61511) 7–12 months Ethyl-EPA (Mean change -0.53964) vs. placebo (Mean change −0.59875) Voxel Wise analyses: Global atrophy during the first 6 months in Ethyl-EPA vs. placebo group Global atrophy during second 6 months in Ethyl-EPA vs. placebo group | 0.067 (NS) 0.050 NS 0.0001 * 0.0001 * | Age Sex | Treatment of Ethyl-EPA showed reduced rate of atrophy over the first 6 months |
| Mochel et al., 2010 (France) [22] | 6 HD patients with abnormal CAG repeat expansions 5 females 1 male Ethnicity: N/A | NR | Blood and urine samples | Ingestion of triheptanoin 1 g/kg per day divided in four meals | Paired t tests: Compare values of plasma acylcarnitines, serum IGF1 and UHDRs before and after triheptanoin CAG repeats with plasma glutamine Plasma C3-carnitine Pre-treatment vs. post-treatment Serum IGF1 pre-treatment vs. post-treatment | <0.001 * 0.011 * 0.010 * | Sex Age | Triheptanoin treatment produced a non-significant increase in mean UHDRS |
| Goetz et al., 1990 (USA) [23] | 10 HD patients in a double blind RCT, crossover design 4 men and 6 women with HD Ethnicity: N/A | 51.6 (16.7) | NR | Administration of L-Acetyl carnitine (LACC) dose of 45 mg/kg/day for 1 week | Friedman’s two-way analysis of variance: Comparison of Reaction time between baseline, placebo and LACC treatment groups Comparison of Mini-Mental examination score between baseline, placebo and LACC treatment groups Comparison of Verbal fluency between baseline, placebo and LACC treatment groups | 0.0247 * NS NS | NR | Safety and toxicity of LACC |
| Cuturic et al., 2012 (USA) [24] | 23 institutionalized HD patients 6 HD patients with treated hypocarnitinemia 17 HD patients without hypocarnitinemia Ethnicity: N/A | 43.4 (10.3) 51. 9 (7.9) | Blood sample | Comparison of mean follow up values for motor, cognitive and behavioural parameters | Comparison of patients with and without hypocarnitinenmia UHDRS initial 52.8 (14.7) vs. 54.5 (17.1) UHDRS-6 months 48.0 (14.7) vs.57.2 (17.1) UHDRS-12 months 51.2 (14.1) vs. 60.5 (17.2) UHDRS change 0–6 months −4.8 (4.8) vs. +2.7 (2.7) UHDRS change 6–12 months +3.2 (1.7) vs. 3.2 (1.8) MMSE initial 18.3 (2.7) vs. 17.6 (4.8) MMSE-6 months 18.3 (3.23) vs. 16.6 (5.1) MMSE-12 months 17.5 (2.9) vs. 15.6 (5.1) MMSE change 0–6 months 0.0 (0.6) vs. −1.0 (1.0) MMSE change 6–12 months −0.8 (0.4) vs. −0.9 (1.0) | 0.831 0.254 0.248 <0.0001 * 0.936 0.727 0.446 0.416 0.018 * 0.796 | NR | HD patients with hypocarnitinemia may benefit from a low dose of levocarnitine supplementation Improvement of UHDRS and MMSE scores within the first 6 months of carnitine supplementation suggesting a slower rate of progression and MMSE decline |
| Tabrizi et al., 2003(UK) [25] | 10 HD patients and 3 HD mutation carriers 4 age matched controls Ethnicity: N/A | NR | Blood sample | 10 g per day of creatine for 12 months | Mann-Whitney U two tailed test: Mean total motor score (TMS) Functional capacity score Neuropsychology testing score | NS NS NS | NR | Tolerability, safety and efficacy of creatine supplementation |
| Auigner et al., 2010(USA) [26] | RCT double-blind parallel group, clinical trail 347 early HD patients 51% males 49% females Ethnicity: N/A | 18–75 (47.9 years) | Blood sample | Given either coenzyme Q10 (600 mg/day), Remacemide (600 mg/day) or both treatments or a placebo for 30 months and serum Uric Acid (UA) will be assessed from blood sample | Adjusted mean change in assessments over 30 months by baseline UA quintile: Primary outcome TFC: 1st vs. 2nd vs.3rd vs.4th −3.17 (0.34) vs. −2.99 (0.34) vs. −2.95 (0.29) vs. −2.28 (0.29) vs. −2.21 (0.31) Linear trend for UA Total Motor Score 1st vs. 2nd vs.3rd vs.4th 14.27 (1.57) vs. 13.02 (1.52) vs. 11.56 (1.34) vs.12.56 (1.36) vs. 9.70 (1.43) Linear trend for UA | 0.030 * 0.034 * 0.070 0.030 * | Gender Study site Baseline age CAG repeat length Baseline value | Association between higher UA levels and slowing of HD progression by measuring TFC Less worsening in total motor scores with increasing UA levels |
| Trejo et al., 2005 (Mexico) [27] | 30 HD patients 70% male 30% female Ethnicity: N/A | 46 (range 20-69) | Blood sample | Nutritional supplement 2 cans of 236 mL in addition to diet for 90 days | Wilcoxon’s signed ranks test or paired t-test: Before and after nutritional intervention UHDRS Scores-Day 0 vs. Day 90 Total motor score 64 ± 14 vs. 65 ± 25 Maximal chorea 13 ± 6 vs. 14 ± 5 Behavioural score 15 ± 13 vs. 10 ± 13 Independence 56 ± 28 vs. 57 ± 27 Functional checklist score 11 ± 8 vs. 11 ± 8 Biochemical Indictors-Day 0 vs. Day 90 Glucose 90 ± 14 vs.89 ± 12 Cholesterol 179 ± 40 vs. 176 ± 38 Triacylglycerol 145 ± 92 vs. 136 ± 72 Albumin 4 ± 0.4 vs. 4 ± 0.4 Hemoglobin 15 ± 2 vs. 15 ± 3 Haematocrit 45 ± 8 vs. 44 ± 11 Total lymphocyte count 1938 ± 536 vs. 2149 ± 1141 | 0.720 0.200 0.100 0.510 0.33 NS NS NS NS NS NS NS | NR | Nutritional innervation slightly improved the anthropometric variables in HD patients Nutritional supplementation increased mean energy and nutritional intake by 20% Good tolerability of patients to the nutritional supplements |
| Cubo et al., 2015 (Spain) [28] | 224 Spanish HD patients and carriers from the European HD registry (EHDN) Control group from Spanish population obtained from EHIDE Ethnicity: N/A | 47.41 ± 14.26 | NR | Dietary intake and nutritional intake via 3-day record and 24 h FFQ | BMI in pre-manifest vs. manifest HD patients 23.00 (26.25–21.13) vs.23.83 (27.25–21.36) Caloric intake in pre-manifest vs. manifest HD patients 1893± 599.58 vs.2084.25 ± 701.71 Correlation between caloric intake and motor and cognitive UHDRS Association between Mediterranean diet adherence and motor and cognitive UHDRS Dietary factors comparison of severe vs. mild-moderate HD Higher Caloric intake: 1950.62 ± 615.93 vs.2178.53 ± 762.22 Higher fat intake Higher vitamin C Higher vitamin A Higher vitamin E Higher thiamine Higher riboflavin Higher pantothenate Higher pyridoxine Higher biotin Higher calcium Higher phosphorus Higher potassium Higher magnesium Higher iron Higher copper Binary logistic regression with advanced vs. mild moderate HD as dependent variable: Intake of water-soluble vitamins OR = 2.08 95% CI: 1.12–3.85 Minerals OR = 1.86 95% CI: 1.12–3.19 | 0.330 0.120 NS NS 0.020 * 0.020 * 0.020 * 0.020 * 0.030 * 0.0002 * 0.010 * 0.003 * 0.002 * 0.005 * 0.020 * 0.0028 * 0.010 * 0.002 * 0.002 * 0.001 * 0.005 * 0.020 * 0.020 * | NR NR NR NR NR NR NR Age Gender Education Physical exercise Intake of supplements | Analyse association of nutritional factors with HD severity Adequate dietary intake prevents weight loss in patients with advanced HD but it is not associated with better functional state |
| Trejo et al., 2004(Mexico) [29] | 25 HD patients 25 age and sex matched controls Ethnicity: N/A | 46 ± 12 (21–70) 46 ± 8 (23–72) | Blood sample | Carbohydrate, protein and fat intake via a 3- day FFQ and anthropometric and biochemical indicators | Independent samples t test: HD patient’s vs. Controls HD patient’s vs. Controls Mean ± SD Weight 58.2 ± 10.01 vs.66.7 ± 10.1 BMI 22.2 ± 2.4 vs.24.6 ± 1.5 Body fat 27.6 ± 8.9 vs.37.9 ± 7.1 Biochemical indictors HD patient’s vs. controls Mean ± SD Albumin 3.98 ± 0.37 vs.4.04 ± 0.41 Hemoglobin 15.10 ± 1.63 vs.15.49 ± 2.44 Hematocrit 45.36 ± 4.07 vs.47.79 ± 7.85 Total lymphocyte count 1907.68 ± 523.27 vs. 1971.75 ± 456.10 Glucose 90.00 ± 11.90 vs. 91.05 ± 10.60 Cholesterol 194 ± 44.70 vs. 215.35 ± 42.98 Triacylglycerol 193.20 ± 101.94 vs. 208.45 ± 92.19 Diet indictors HD patient’s vs. Controls Mean ± SD Energy intake 2325.1 ± 551.4 vs. 1948.4 ± 270.2 Carbohydrate Intake 330.1 ± 98.4 vs. 252.1 ± 72.6 Protein intake 92.3 ± 36.0 vs.80.2 ± 18.1 Fat intake 71.7 ± 20.2 vs. 68.3 ± 18.0 Chi-square test: Association of variables in HD patient’s Weight-loss 32% Increased appetite 36% Decreased appetite 4% | 0.0047 * 0.0001 * 0.00004 * 0.637 0.526 0.186 0.668 0.759 0.116 0.605 0.003 * 0.003 * 0.14 0.5 0.026 * 0.046 * NS | NR | Nutritional status, anthropometric, biochemical indictors, energy and macronutrient intake to determine indicators altered in HD patients and nutritional requirements to improve their quality of life |
| Chen et al., 2015(Taiwan) [30] | 30 HD patients 19 men and 11 women 23 controls 12 men and 11 women 14 HD out of 30 HD patients (2 yr. pilot study) 22 HD patients (1 yr. follow up) Ethnicity: Asian | 44.7 ± 11.4 42.26 ± 2.6 | Arterial blood sample Venous blood sample | Citrulline blood levels, as a marker of urea cycle deficiency in a high protein diet | Pearson’s correlation: Between citrulline concentration in HD patients over 2 years follow up with: UHDRS Motor Score R = −0.1584 Functional capacity R = 0.06484 Independence score R = 0.1193 | 0.0985 0.5010 0.2144 | NR | Blood citrulline concentration – a marker of urea cycle deficiency following a HPD was not associated with HD progression |
| Morales et al., 1989 (Venezuela) [31] | 18 choreic patients 31 offspring (1st generation) 19 individuals (2nd generation) 7 individuals (3rd generation) 40 controls Ethnicity: N/A | 15 to 57 years 12 to 72 years 14 to 45 years 18 to 32 years 14 to 72 years | Fasting blood samples | Nutritional status (daily meal frequency, meal schedule, food quantity and snack intake, energy consumption vegetables, animal proteins, total fat cholesterol and carbohydrates, iron, vitamins A, C, niacin levels and essential amino acids) | ANOVA: comparing amino acid intake in control, choreic patients, 1st generation, 2nd generation and 3rd generation Nutrients and energy provided by food intake in control, choreic patients, 1st generation, 2nd generation and 3rd generation Control Calories 1420.62 ± 101.69 Animal protein 38.94 ± 3.42 Vegetal protein 14.62 ± 1.26 Lipids 56.80 ± 5.50 Carbohydrates 186.25 ± 13.37 Choreic patients Calories 1731.33 ± 191.32 Animal protein 35.61 ± 15.15 Vegetal protein 19.88 ± 2.38 Lipids 60.05 ± 7.61 Carbohydrates 259.33 ± 32.19 1st generation Calories 1470.26 ± 102.16 Animal protein 43.12 ± 4.89 Vegetal protein 14.81 ± 1.42 Lipids 63.25 ± 27.68 Carbohydrates 225.46 ± 27.68 2nd generation Calories 1481.57 ± 128.72 Animal protein 40.52 ± 4.47 Vegetal protein 12.05 ± 1.17 Lipids 59.52 ± 5.56 Carbohydrates 196.10 ± 18.65 AVONA comparing Vitamin C between groups–choreic patients were deficient AVONA comparing Niacin between groups–choreic patients were deficient | NS NS NS NS NS <0.01 * <0.01 * | Age Gender Gender Age Age | |
| Buruma et al., 1987 (The Netherlands) [32] | 51 HD patients Ethnicity: N/A | 53 (range 26-78) | NR | Eating, drinking and smoking habits over a period of 10 years before the age of onset | Spearman’s rank correlation test between overall age at onset (AOAS) and consumption of: Alcohol r = 0.09 Milk intake r = -0.30 Coffee r = 0.07 Fruit juice r = -0.10 Tea r = -0.09 Cheese r = 0.14 Fish r = 0.01 Spearman’s rank correlation test between Age at onset of psychological changes (AOPC) and consumption of: Alcohol r = 0.11 Milk intake r = −0.29 Coffee r = 0.00 Fruit juice r = −0.16 Tea r = −0.25 Cheese r = 0.12 Fish r = −0.04 Spearman’s rank correlation test between Age at onset of involuntary movements (AOIM) and consumption of: Alcohol r = 0.10 Milk intake r = −0.29 Coffee r = −0.04 Fruit juice r = −0.04 Tea r = −0.05 Cheese r = 0.20 Fish r = 0.10 Spearman’s rank correlation test between Rate of progression (RP) and consumption of: Alcohol r = −0.09 Milk intake r = 0.19 Coffee r = 0.00 Fruit juice r = −0.02 Tea r = 0.31 Cheese r = 0.17 Fish r = 0.12 | 0.520 0.030 0.610 0.500 0.520 0.320 0.940 0.470 0.050 0.980 0.280 0.090 0.420 0.800 0.490 0.040 0.750 0.790 0.720 0.170 0.470 0.520 0.190 0.990 0.920 0.030 0.240 0.420 | ||
| Simonin et al., 2013 (France) [33] | 80 HD patients 41 males 39 females Ethnicity: N/A | NR | NR | Mean daily caffeine intake (coffee, tea, chocolate and soda) assessed retrospectively before and after disease onset using dietary survey | Student t test: Comparison of two groups Caffeine intake < 190 mg/d before disease onset vs. Caffeine intake ≥ 190 mg/d before disease onset AAO: 49.5 (12.7) vs. 45.4 (10.0) Annual IS decline −4.9 (7.1) vs. −2.1 (6.9) Annual TFC decline −1.1 (1.4) vs.−0.8 (1.4) Annual motor UHDRS decline +7.1 (8.9) vs. +3.7 (7.6) Annual chorea impairment +1.6 (4.5) vs. +1.1 (3.6) Multivariable linear regression: Higher caffeine consumption before disease onset (≥190 mg/d vs. <190 mg/d) AAO Regression coefficient: −3.6 | 0.1144 0.1072 0.3778 0.1028 0.6426 0.0270 * | Gender Smoking status CAG repeat length Disease duration | Higher caffeine consumption before onset was associated with a younger age of onset |
| Marder et al., 2009 (USA) [34] | HD carriers (pre-symptomatic) and controls recruited from Prospective Huntington at Risk Observational study (PHAROS) 435 participants with non-expanded CAG <37 217 participants with expanded CAG ≥ 37 Ethnicity: N/A | 44.9 (7.9) 43.4 (7.7) | Blood sample | Caloric intake, body mass index (BMI), dietary consumption of macronutrients (carbohydrates, protein, fat intake) assessed via a FFQ | t tests and x2 tests: Demographics and measures from FFQ compared in CAG < 37 vs. CAG ≥ 37 groups Carbohydrates 222.7 ± 113.7 vs. 247.5 ± 119.7 Protein 75.7 ± 40.9 vs. 79.0 ± 38.2 Fat 71.3 ± 40.8 vs. 73.3 ± 35.3 Caloric intake CAG < 37 1858 (940) (224-7138) (113.7) and CAG ≥ 37 1994 (901) (423–6654) BMI CAG < 37 28.4 (6.6) (17.9–56.1) and CAG ≥ 37 27.0 (5.4) (16.7–52.0) Mantel-Haenszel tests for trend after dividing variables into 4 quartile groups. Comparing CAG < 37 vs. CAG ≥ 37 groups Caloric intake Q1 CAG < 37 29.2 and CAG ≥ 37 16.6 Q2 CAG < 37 23.2 and CAG ≥ 37 28.6 Q3 CAG < 37 23.7 and CAG ≥ 37 27.7 Q4 CAG < 37 23.9 and CAG ≥ 37 27.2 Carbohydrates Q1 CAG < 37 29.0 and CAG ≥ 37 17.1 Q2 CAG < 37 23.7 and CAG ≥ 37 28.6 Q3 CAG < 37 23.9 and CAG ≥ 37 28.1 Q4 CAG < 37 23.5 and CAG ≥ 37 26.3 Proteins Q1 CAG < 37 26.0 and CAG ≥ 37 21.7 Q2 CAG < 37 25.3 and CAG ≥ 37 25.4 Q3 CAG < 37 25.3 and CAG ≥ 37 26.7 Q4 CAG < 37 23.5 and CAG ≥ 37 26.3 Fat Q1 CAG < 37 26.9 and CAG ≥ 37 20.3 Q2 CAG < 37 25.1 and CAG ≥ 37 25.8 Q3 CAG < 37 24.6 and CAG ≥ 37 27.7 Q4 CAG < 37 23.5 and CAG ≥ 37 26.3 Regression between Caloric Intake and CAG repeat length Regression coefficient (SE): 0.26 (0.12) Regression between Caloric Intake and the 5 years probability of HD onset in subjects with CAG ≥ 37 Regression coefficient (SE): 0.024 (0.010) | 0.010 NS NS 0.073 0.006 * 0.013 * 0.019 * 0.220 0.097 0.032 * 0.013 * | Age Gender Education Total caloric intake Age Gender Education Total caloric intake Age Gender Education Total caloric intake Age Gender Education Total caloric intake CAG repeat length Caloric intake | |
| Mochel et al., 2007 (France) [35] | 32 HD patients CAG expansion > 36 15 pre-symptomatic 17 symptomatic 21 controls Ethnicity: N/A | 42 ± 11 (range 28 to 80 years) 37 ± 9.5 (range 27 to 62 years) | Blood and urine samples | Semi-quantitative questionnaire of regular food and beverage consumption to observe caloric intake in HD patients | ANOVA Comparison of means Weight loss determined retrospectively over a 5 years period HD patients (−3.3 ± 4.5 kgs) vs. Controls (−2.8 ± 3.9 kgs) BMI HD patients (22.6 ± 3.0 kg/cm2) vs. Controls (24.0 ± 5.0 kg/cm2) Daily caloric intake determined from a 3 day and 24 h questionnaire performed at 1-month interval HD patients (2020 ± 530/24 h) vs. Controls (1665 ± 305/24 h) Proteins determined from a 3 day and 24 h questionnaire performed at 1-month interval HD patients (81.3 ± 23.7 gr/24 h) vs. Controls (70.0 ± 14.1 gr/24 h) Lipids HD patients (86.5 ± 18.3 gr/24 h) vs. Controls (65.7 ± 18.0 gr/24) Sugar HD patients (216.0 ± 77.1 gr/24 h) vs. Controls (191.3 ± 48.6 gr/c24 h) | 0.001 * 0.217 0.008 * 0.054 0.001 * 0.201 | Age BMI | Weight loss starts early in disease Low levels of BCAA correlated with weight loss, disease progression and abnormal repeat expansion size |
© 2020 by the authors. Licensee MDPI, Basel, Switzerland. This article is an open access article distributed under the terms and conditions of the Creative Commons Attribution (CC BY) license (http://creativecommons.org/licenses/by/4.0/).
Share and Cite
Christodoulou, C.C.; Demetriou, C.A.; Zamba-Papanicolaou, E. Dietary Intake, Mediterranean Diet Adherence and Caloric Intake in Huntington’s Disease: A Review. Nutrients 2020, 12, 2946. https://doi.org/10.3390/nu12102946
Christodoulou CC, Demetriou CA, Zamba-Papanicolaou E. Dietary Intake, Mediterranean Diet Adherence and Caloric Intake in Huntington’s Disease: A Review. Nutrients. 2020; 12(10):2946. https://doi.org/10.3390/nu12102946
Chicago/Turabian StyleChristodoulou, Christiana C., Christiana A. Demetriou, and Eleni Zamba-Papanicolaou. 2020. "Dietary Intake, Mediterranean Diet Adherence and Caloric Intake in Huntington’s Disease: A Review" Nutrients 12, no. 10: 2946. https://doi.org/10.3390/nu12102946
APA StyleChristodoulou, C. C., Demetriou, C. A., & Zamba-Papanicolaou, E. (2020). Dietary Intake, Mediterranean Diet Adherence and Caloric Intake in Huntington’s Disease: A Review. Nutrients, 12(10), 2946. https://doi.org/10.3390/nu12102946