Effect of Short-Term Increase in Meal Frequency on Glucose Metabolism in Individuals with Normal Glucose Tolerance or Impaired Fasting Glucose: A Randomized Crossover Clinical Trial

 ,
,
Abstract
1. Introduction
2. Materials and Methods
2.1. Subjects
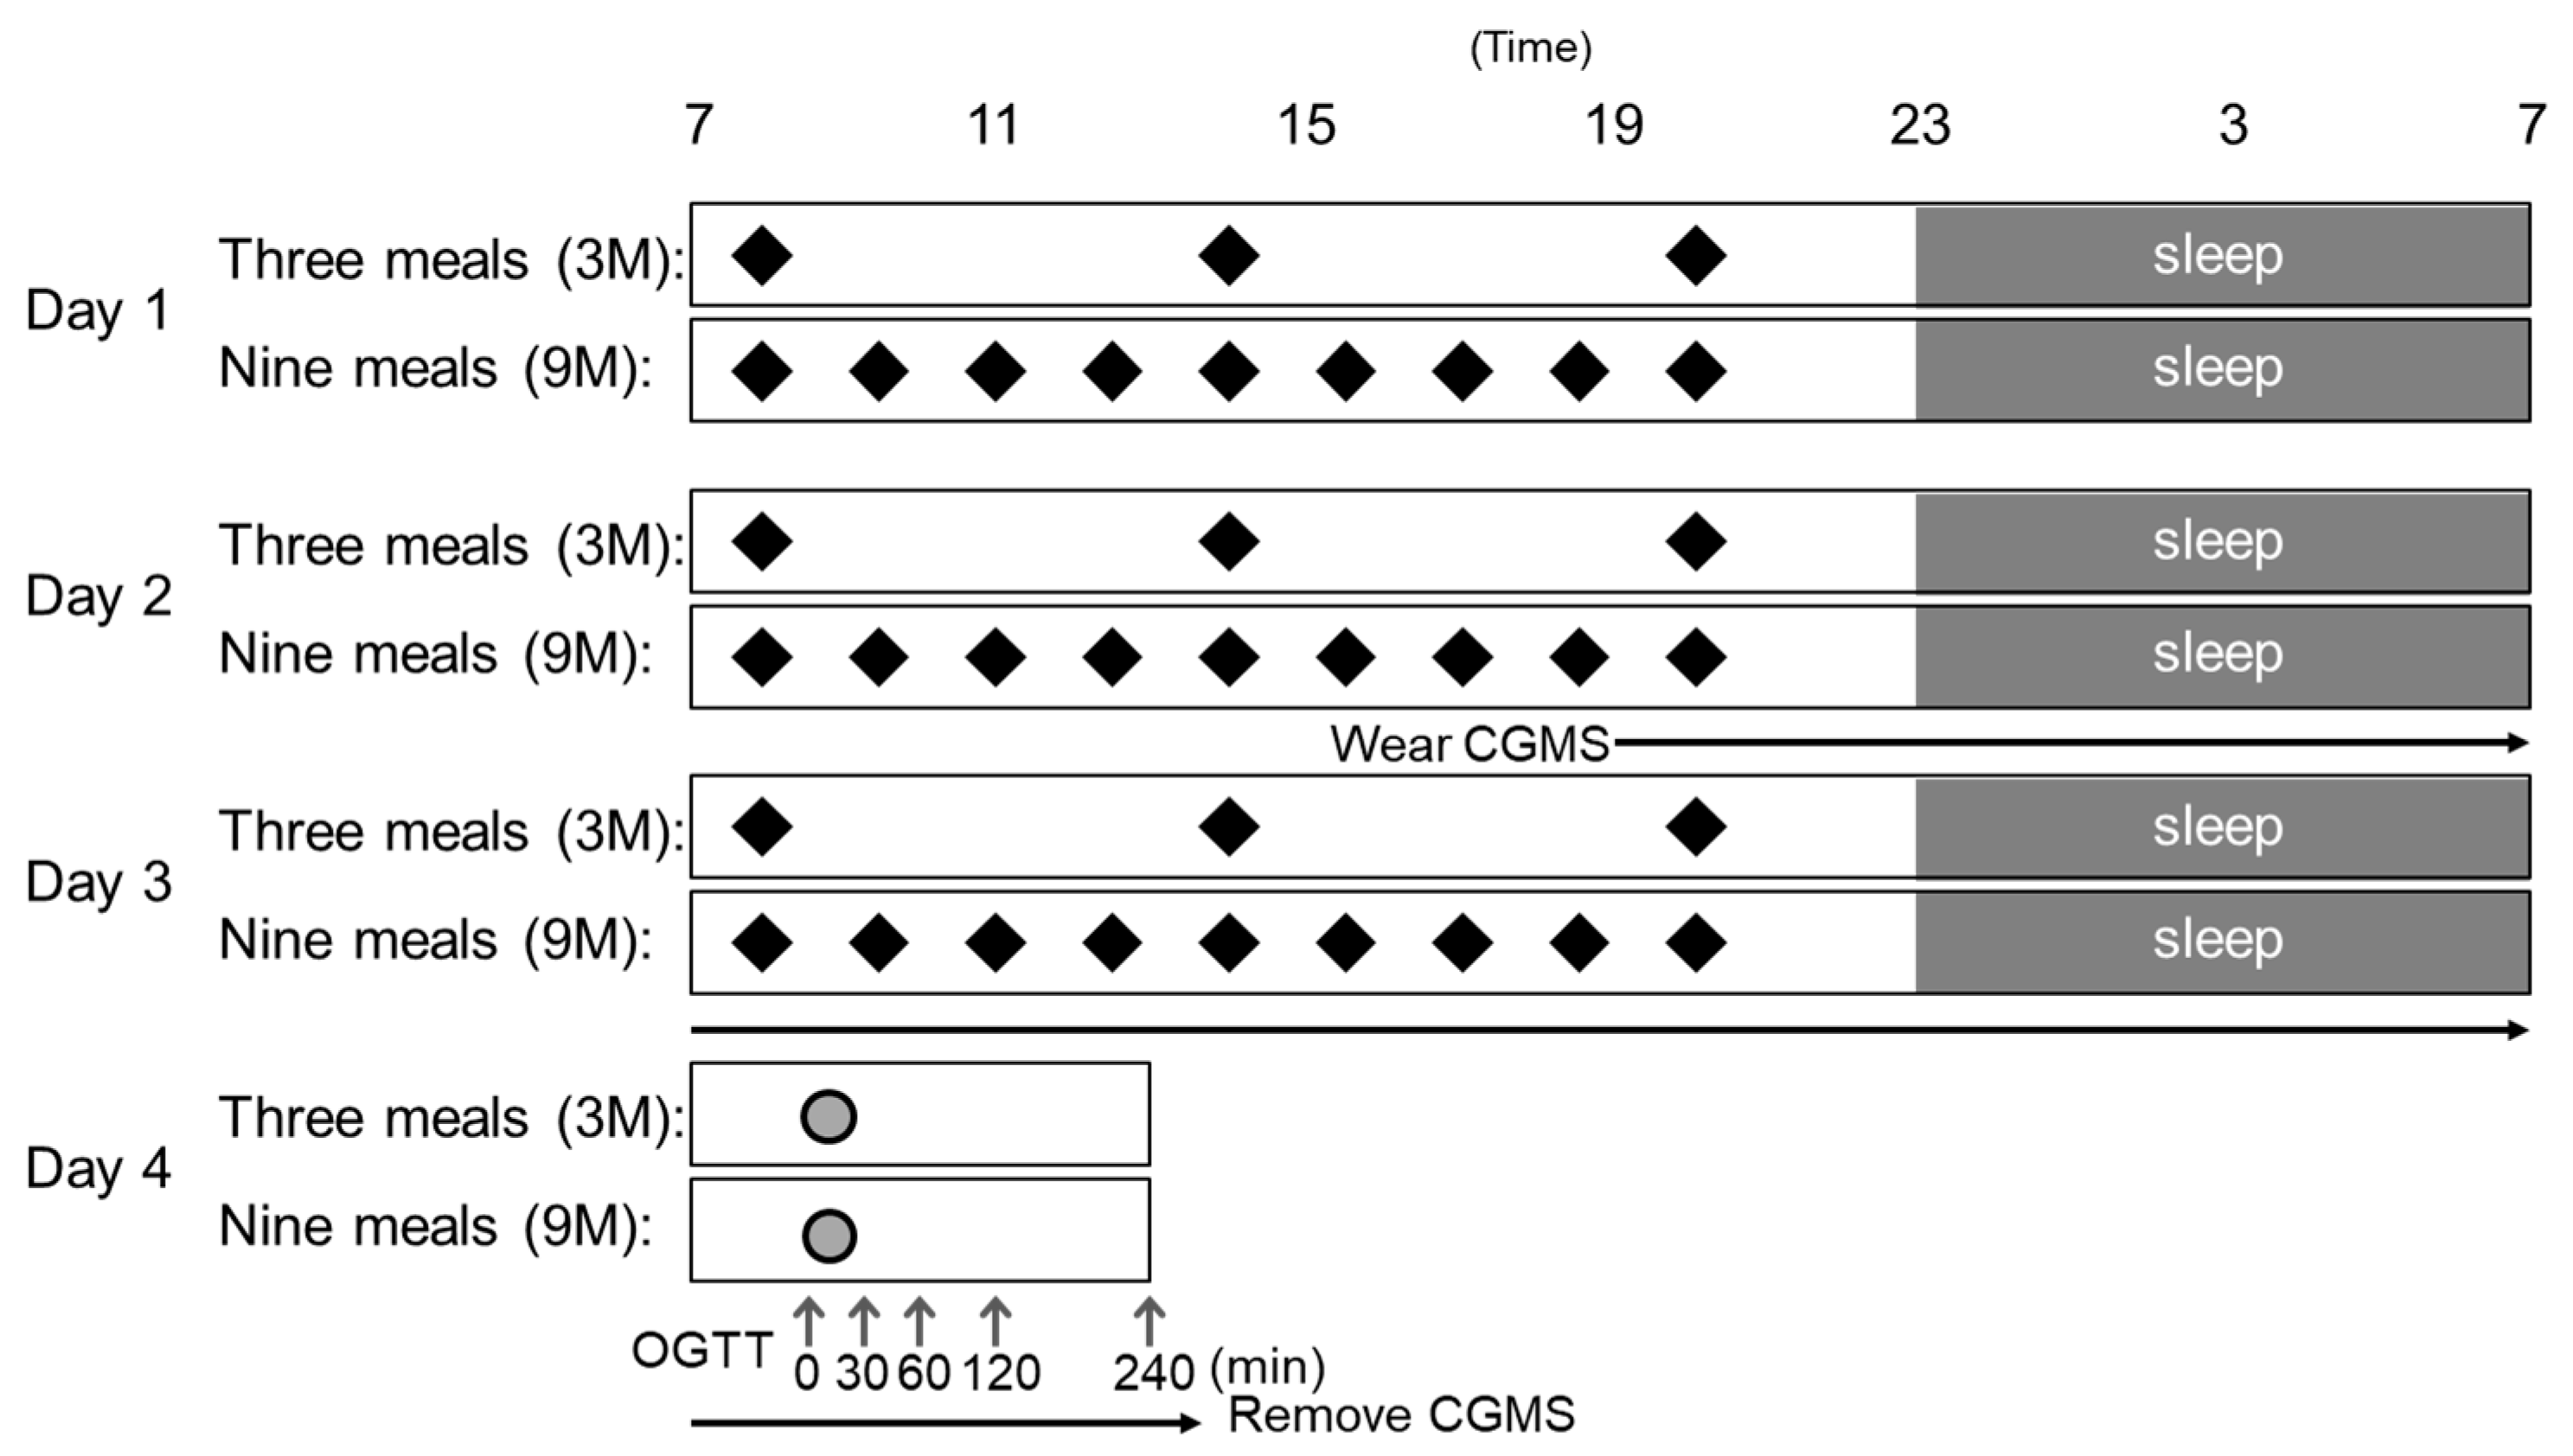
2.2. Study Design
2.3. Test Meals
2.4. Measurements
2.5. Statistical Analysis
3. Results
3.1. Subjects
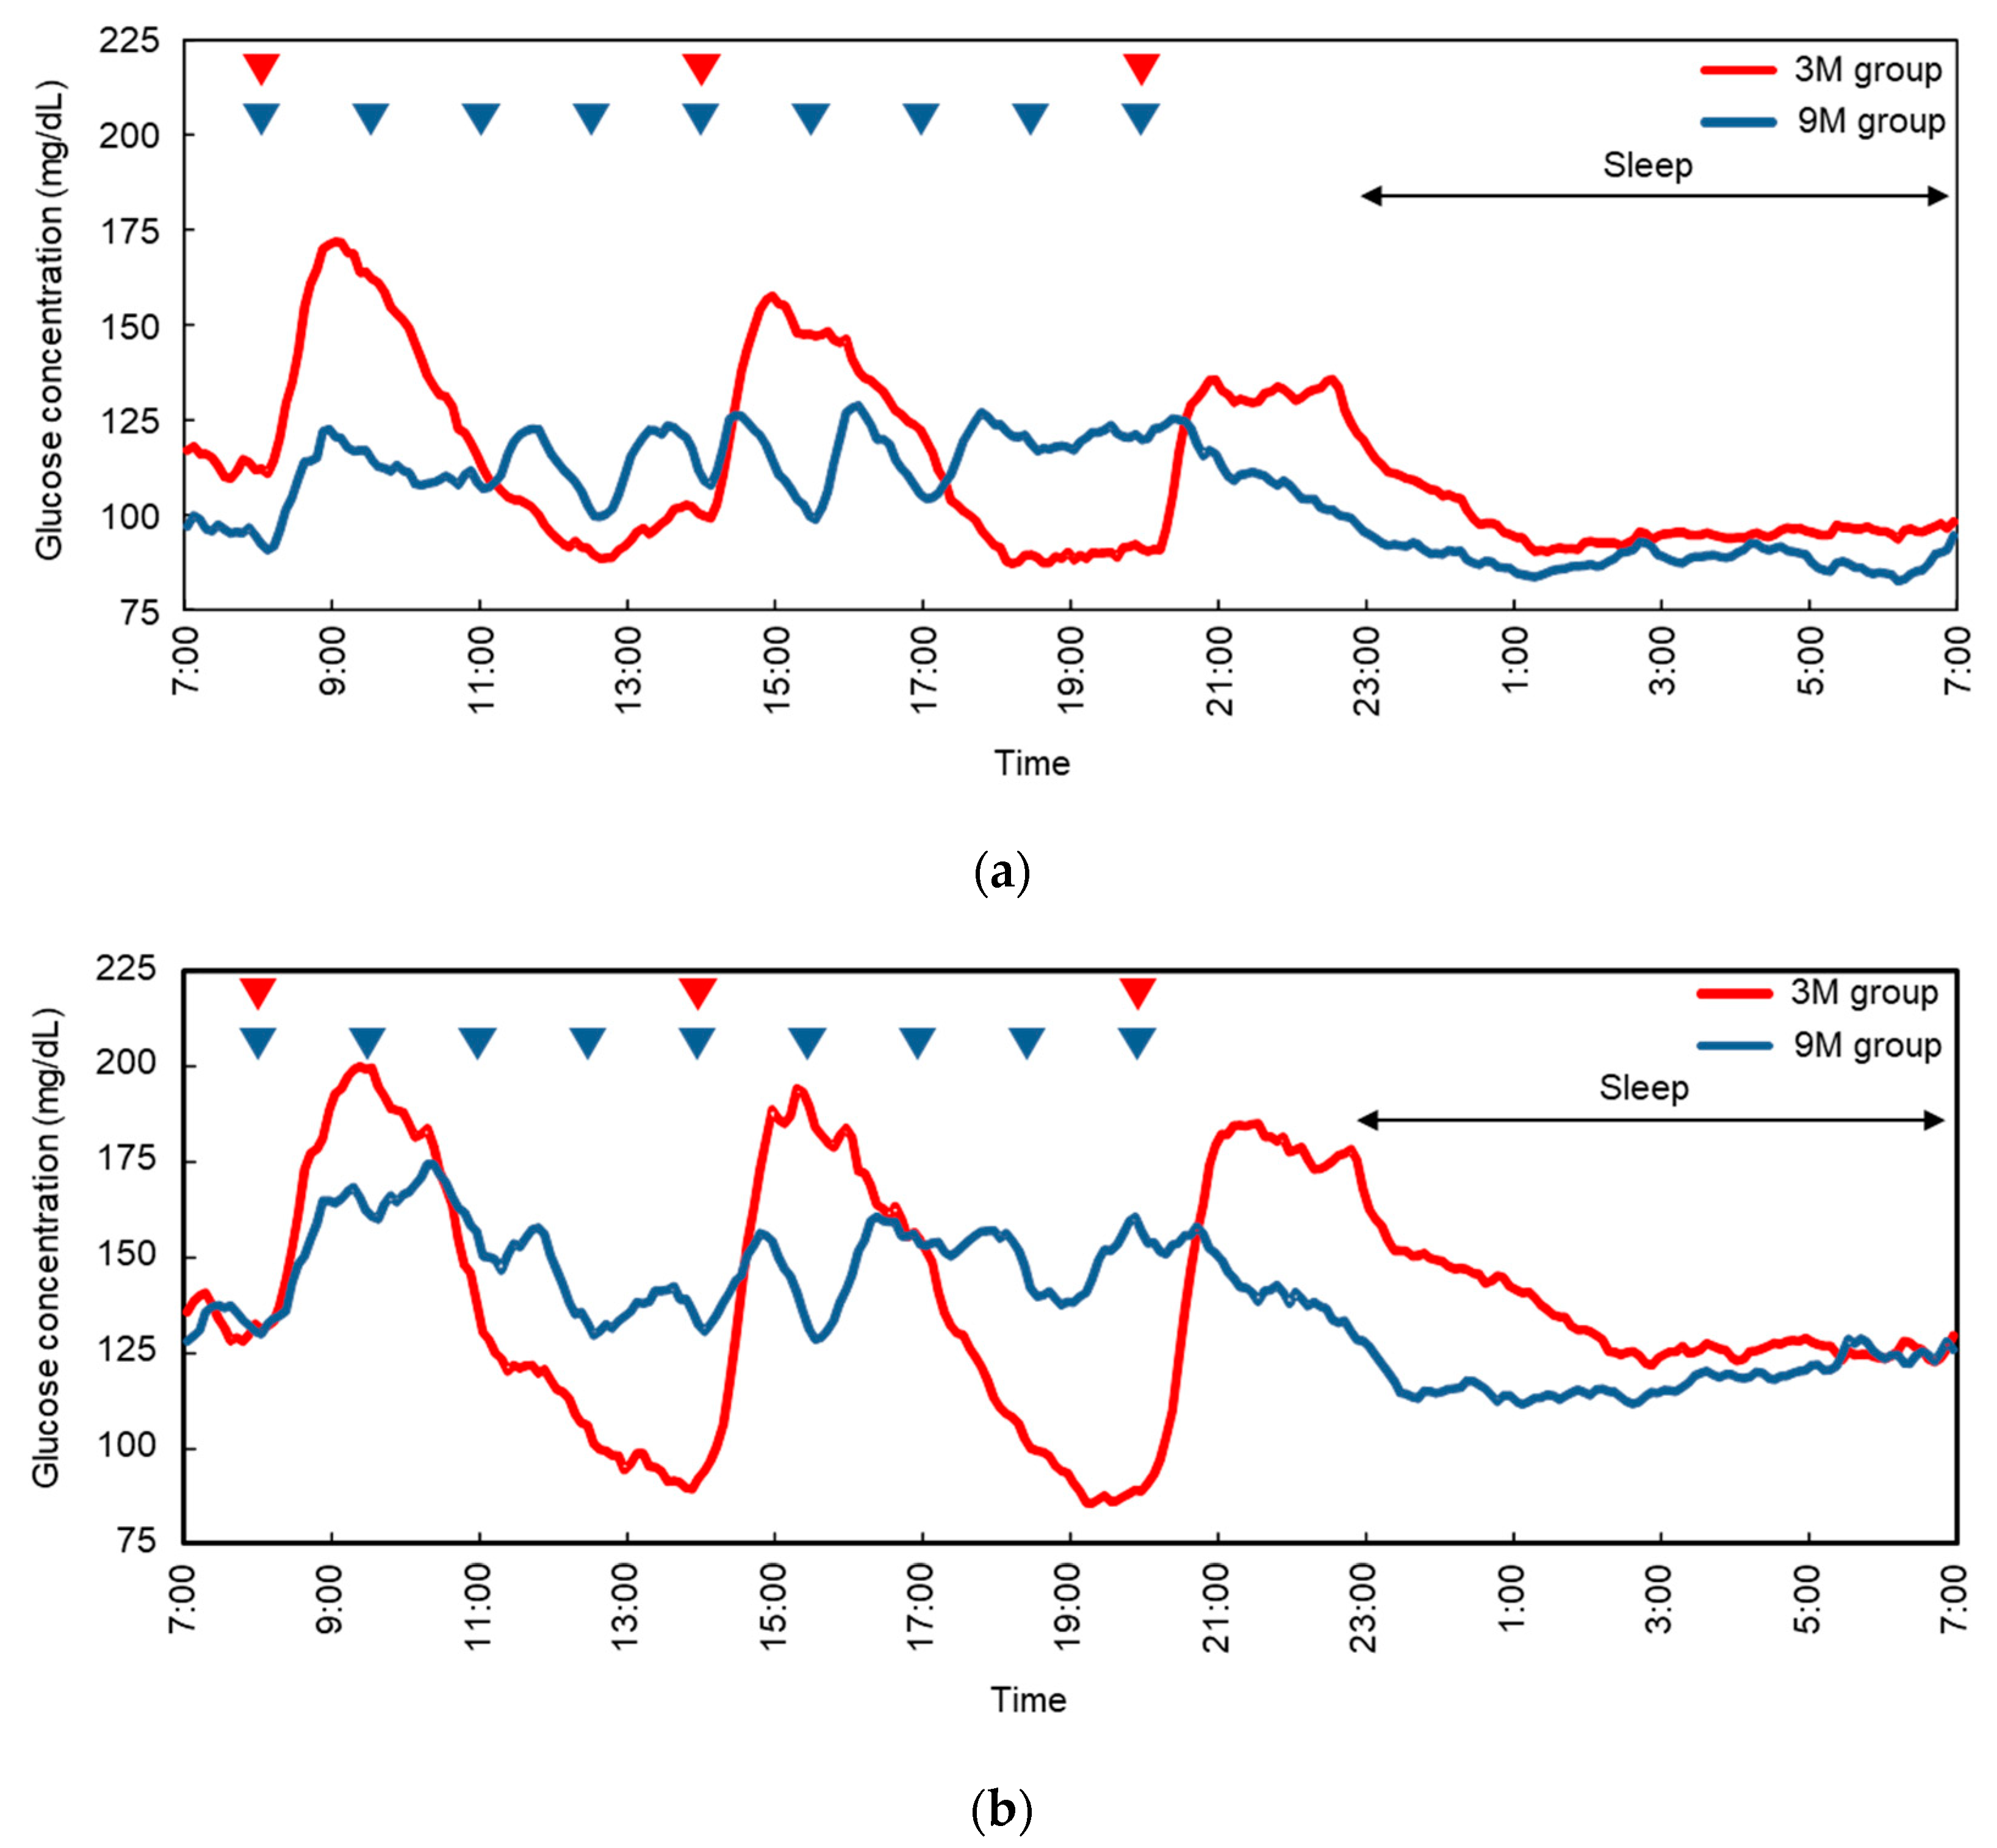
3.2. Continuous Glucose Monitoring Systems
3.3. Glucose Metabolism
4. Discussion
5. Conclusions
Author Contributions
Funding
Conflicts of Interest
References
- Rawshani, A.; Rawshani, A.; Franzen, S.; Eliasson, B.; Svensson, A.M.; Miftaraj, M.; McGuire, D.K.; Sattar, N.; Rosengren, A.; Gudbjornsdottir, S. Mortality and cardiovascular disease in type 1 and type 2 diabetes. N. Engl. J. Med. 2017, 376, 1407–1418. [Google Scholar] [CrossRef]
- Callaghan, B.C.; Price, R.S.; Feldman, E.L. Distal symmetric polyneuropathy: A review. JAMA 2015, 314, 2172–2181. [Google Scholar] [CrossRef]
- Afkarian, M.; Zelnick, L.R.; Hall, Y.N.; Heagerty, P.J.; Tuttle, K.; Weiss, N.S.; de Boer, I.H. Clinical manifestations of kidney disease among us adults with diabetes, 1988–2014. JAMA 2016, 316, 602–610. [Google Scholar] [CrossRef]
- DECODE Study Group, the European Diabetes Epidemiology Group. Glucose tolerance and cardiovascular mortality: Comparison of fasting and 2-hour diagnostic criteria. Arch. Intern. Med. 2001, 161, 397–405. [Google Scholar] [CrossRef]
- Nakagami, T.; Qiao, Q.; Tuomilehto, J.; Balkau, B.; Tajima, N.; Hu, G.; Borch-Johnsen, K. Screen-detected diabetes, hypertension and hypercholesterolemia as predictors of cardiovascular mortality in five populations of Asian origin: The DECODA study. Eur. J. Cardiovasc. Prev. Rehabil. 2006, 13, 555–561. [Google Scholar] [CrossRef]
- Sorkin, J.D.; Muller, D.C.; Fleg, J.L.; Andres, R. The relation of fasting and 2-h postchallenge plasma glucose concentrations to mortality: Data from the Baltimore Longitudinal Study of Aging with a critical review of the literature. Diabetes Care 2005, 28, 2626–2632. [Google Scholar] [CrossRef]
- Hanefeld, M.; Cagatay, M.; Petrowitsch, T.; Neuser, D.; Petzinna, D.; Rupp, M. Acarbose reduces the risk for myocardial infarction in type 2 diabetic patients: Meta-analysis of seven long-term studies. Eur. Heart J. 2004, 25, 10–16. [Google Scholar] [CrossRef]
- Hanefeld, M.; Koehler, C.; Schaper, F.; Fuecker, K.; Henkel, E.; Temelkova-Kurktschiev, T. Postprandial plasma glucose is an independent risk factor for increased carotid intima-media thickness in non-diabetic individuals. Atherosclerosis 1999, 144, 229–235. [Google Scholar] [CrossRef]
- Levitan, E.B.; Song, Y.; Ford, E.S.; Liu, S. Is nondiabetic hyperglycemia a risk factor for cardiovascular disease? A meta-analysis of prospective studies. Arch. Intern. Med. 2004, 164, 2147–2155. [Google Scholar] [CrossRef]
- Shiraiwa, T.; Kaneto, H.; Miyatsuka, T.; Kato, K.; Yamamoto, K.; Kawashima, A.; Kanda, T.; Suzuki, M.; Imano, E.; Matsuhisa, M.; et al. Post-prandial hyperglycemia is an important predictor of the incidence of diabetic microangiopathy in Japanese type 2 diabetic patients. Biochem. Biophys. Res. Commun. 2005, 336, 339–345. [Google Scholar] [CrossRef]
- Woerle, H.J.; Neumann, C.; Zschau, S.; Tenner, S.; Irsigler, A.; Schirra, J.; Gerich, J.E.; Goke, B. Impact of fasting and postprandial glycemia on overall glycemic control in type 2 diabetes importance of postprandial glycemia to achieve target HbA1c levels. Diabetes Res. Clin. Pract. 2007, 77, 280–285. [Google Scholar] [CrossRef]
- Gallwitz, B. Implications of postprandial glucose and weight control in people with type 2 diabetes: Understanding and implementing the international diabetes federation guidelines. Diabetes Care 2009, 32 (Suppl. S2), S322–S325. [Google Scholar] [CrossRef]
- American Diabetes Association. Standards of medical care in diabetes—2010. Diabetes Care 2010, 33 (Suppl. S1), S11–S61. [Google Scholar] [CrossRef]
- Quagliaro, L.; Piconi, L.; Assaloni, R.; Martinelli, L.; Motz, E.; Ceriello, A. Intermittent high glucose enhances apoptosis related to oxidative stress in human umbilical vein endothelial cells: The role of protein kinase C and NAD(P)H-oxidase activation. Diabetes 2003, 52, 2795–2804. [Google Scholar] [CrossRef]
- Risso, A.; Mercuri, F.; Quagliaro, L.; Damante, G.; Ceriello, A. Intermittent high glucose enhances apoptosis in human umbilical vein endothelial cells in culture. Am. J. Physiol. Endocrinol. Metab. 2001, 281, E924–E930. [Google Scholar] [CrossRef]
- Piconi, L.; Quagliaro, L.; Da Ros, R.; Assaloni, R.; Giugliano, D.; Esposito, K.; Szabo, C.; Ceriello, A. Intermittent high glucose enhances ICAM-1, VCAM-1, E-selectin and interleukin-6 expression in human umbilical endothelial cells in culture: The role of poly(ADP-ribose) polymerase. J. Thromb. Haemost. 2004, 2, 1453–1459. [Google Scholar] [CrossRef]
- Jenkins, D.J.; Ocana, A.; Jenkins, A.L.; Wolever, T.M.; Vuksan, V.; Katzman, L.; Hollands, M.; Greenberg, G.; Corey, P.; Patten, R.; et al. Metabolic advantages of spreading the nutrient load: Effects of increased meal frequency in non-insulin-dependent diabetes. Am. J. Clin. Nutr. 1992, 55, 461–467. [Google Scholar] [CrossRef]
- Bertelsen, J.; Christiansen, C.; Thomsen, C.; Poulsen, P.L.; Vestergaard, S.; Steinov, A.; Rasmussen, L.H.; Rasmussen, O.; Hermansen, K. Effect of meal frequency on blood glucose, insulin, and free fatty acids in niddm subjects. Diabetes Care 1993, 16, 4–7. [Google Scholar] [CrossRef]
- Forsythe, J.M. Medical contrasts: Britain and the USA. Br. Med. J. 1977, 1, 698–700. [Google Scholar] [CrossRef]
- Sriram, S.; Xenocostas, A.; Lazo-Langner, A. Erythropoietin in anemia of unknown etiology: A systematic review and meta-analysis. Hematology 2016, 21, 234–240. [Google Scholar] [CrossRef]
- Ohkawara, K.; Cornier, M.A.; Kohrt, W.M.; Melanson, E.L. Effects of increased meal frequency on fat oxidation and perceived hunger. Obesity 2013, 21, 336–343. [Google Scholar] [CrossRef]
- Munsters, M.J.; Saris, W.H. Effects of meal frequency on metabolic profiles and substrate partitioning in lean healthy males. PLoS ONE 2012, 7, e38632. [Google Scholar] [CrossRef]
- Ganpule, A.A.; Tanaka, S.; Ishikawa-Takata, K.; Tabata, I. Interindividual variability in sleeping metabolic rate in Japanese subjects. Eur. J. Clin. Nutr. 2007, 61, 1256–1261. [Google Scholar] [CrossRef]
- Ogata, H.; Tokuyama, K.; Nagasaka, S.; Ando, A.; Kusaka, I.; Sato, N.; Goto, A.; Ishibashi, S.; Kiyono, K.; Struzik, Z.R.; et al. Long-range negative correlation of glucose dynamics in humans and its breakdown in diabetes mellitus. Am. J. Physiol. Regul. Integr. Comp. Physiol. 2006, 291, R1638–R1643. [Google Scholar] [CrossRef]
- Rebrin, K.; Steil, G.M.; van Antwerp, W.P.; Mastrototaro, J.J. Subcutaneous glucose predicts plasma glucose independent of insulin: Implications for continuous monitoring. Am. J. Physiol. 1999, 277, E561–E571. [Google Scholar] [CrossRef]
- Matthews, D.R.; Hosker, J.P.; Rudenski, A.S.; Naylor, B.A.; Treacher, D.F.; Turner, R.C. Homeostasis model assessment: Insulin resistance and beta-cell function from fasting plasma glucose and insulin concentrations in man. Diabetologia 1985, 28, 412–419. [Google Scholar] [CrossRef]
- Katz, A.; Nambi, S.S.; Mather, K.; Baron, A.D.; Follmann, D.A.; Sullivan, G.; Quon, M.J. Quantitative insulin sensitivity check index: A simple, accurate method for assessing insulin sensitivity in humans. J. Clin. Endocrinol. Metab. 2000, 85, 2402–2410. [Google Scholar] [CrossRef]
- Stumvoll, M.; Mitrakou, A.; Pimenta, W.; Jenssen, T.; Yki-Jarvinen, H.; Van Haeften, T.; Renn, W.; Gerich, J. Use of the oral glucose tolerance test to assess insulin release and insulin sensitivity. Diabetes Care 2000, 23, 295–301. [Google Scholar] [CrossRef]
- Matsuda, M.; DeFronzo, R.A. Insulin sensitivity indices obtained from oral glucose tolerance testing: Comparison with the euglycemic insulin clamp. Diabetes Care 1999, 22, 1462–1470. [Google Scholar] [CrossRef]
- Kobayashi, F.; Ogata, H.; Omi, N.; Nagasaka, S.; Yamaguchi, S.; Hibi, M.; Tokuyama, K. Effect of breakfast skipping on diurnal variation of energy metabolism and blood glucose. Obes. Res. Clin. Pract. 2014, 8, e249–e257. [Google Scholar] [CrossRef]
- Kanaley, J.A.; Heden, T.D.; Liu, Y.; Fairchild, T.J. Alteration of postprandial glucose and insulin concentrations with meal frequency and composition. Br. J. Nutr. 2014, 112, 1484–1493. [Google Scholar] [CrossRef]
- Pories, W.J.; Dohm, G.L. Diabetes: Have we got it all wrong? Hyperinsulinism as the culprit: Surgery provides the evidence. Diabetes Care 2012, 35, 2438–2442. [Google Scholar] [CrossRef]
- Cani, P.D.; Knauf, C.; Iglesias, M.A.; Drucker, D.J.; Delzenne, N.M.; Burcelin, R. Improvement of glucose tolerance and hepatic insulin sensitivity by oligofructose requires a functional glucagon-like peptide 1 receptor. Diabetes 2006, 55, 1484–1490. [Google Scholar] [CrossRef]
- Prigeon, R.L.; Quddusi, S.; Paty, B.; D’Alessio, D.A. Suppression of glucose production by GLP-1 independent of islet hormones: A novel extrapancreatic effect. Am. J. Physiol. Endocrinol. Metab. 2003, 285, E701–E707. [Google Scholar] [CrossRef]
- Toft-Nielsen, M.B.; Madsbad, S.; Holst, J.J. Determinants of the effectiveness of glucagon-like peptide-1 in type 2 diabetes. J. Clin. Endocrinol. Metab. 2001, 86, 3853–3860. [Google Scholar] [CrossRef]
- Mannucci, E.; Ognibene, A.; Cremasco, F.; Bardini, G.; Mencucci, A.; Pierazzuoli, E.; Ciani, S.; Fanelli, A.; Messeri, G.; Rotella, C.M. Glucagon-like peptide (GLP)-1 and leptin concentrations in obese patients with type 2 diabetes mellitus. Diabetic. Med. 2000, 17, 713–719. [Google Scholar] [CrossRef]
- Vilsboll, T.; Agerso, H.; Krarup, T.; Holst, J.J. Similar elimination rates of glucagon-like peptide-1 in obese type 2 diabetic patients and healthy subjects. J. Clin. Endocrinol. Metab. 2003, 88, 220–224. [Google Scholar] [CrossRef]
- Ranganath, L.R.; Beety, J.M.; Morgan, L.M.; Wright, J.W.; Howland, R.; Marks, V. Attenuated GLP-1 secretion in obesity: Cause or consequence? Gut 1996, 38, 916–919. [Google Scholar] [CrossRef]
- Lugari, R.; Dei Cas, A.; Ugolotti, D.; Barilli, A.L.; Camellini, C.; Ganzerla, G.C.; Luciani, A.; Salerni, B.; Mittenperger, F.; Nodari, S.; et al. Glucagon-like peptide 1 (GLP-1) secretion and plasma dipeptidyl peptidase iv (dpp-iv) activity in morbidly obese patients undergoing biliopancreatic diversion. Horm. Metab. Res. 2004, 36, 111–115. [Google Scholar]
- Matikainen, N.; Bogl, L.H.; Hakkarainen, A.; Lundbom, J.; Lundbom, N.; Kaprio, J.; Rissanen, A.; Holst, J.J.; Pietilainen, K.H. GLP-1 responses are heritable and blunted in acquired obesity with high liver fat and insulin resistance. Diabetes Care 2014, 37, 242–251. [Google Scholar] [CrossRef]
- Muscelli, E.; Mari, A.; Casolaro, A.; Camastra, S.; Seghieri, G.; Gastaldelli, A.; Holst, J.J.; Ferrannini, E. Separate impact of obesity and glucose tolerance on the incretin effect in normal subjects and type 2 diabetic patients. Diabetes 2008, 57, 1340–1348. [Google Scholar] [CrossRef]
- Gil-Lozano, M.; Mingomataj, E.L.; Wu, W.K.; Ridout, S.A.; Brubaker, P.L. Circadian secretion of the intestinal hormone GLP-1 by the rodent l cell. Diabetes 2014, 63, 3674–3685. [Google Scholar] [CrossRef]
- Gil-Lozano, M.; Wu, W.K.; Martchenko, A.; Brubaker, P.L. High-fat diet and palmitate alter the rhythmic secretion of glucagon-like peptide-1 by the rodent l-cell. Endocrinology 2016, 157, 586–599. [Google Scholar] [CrossRef]
- Holliday, A.; Blannin, A.K. Very low volume sprint interval exercise suppresses subjective appetite, lowers acylated ghrelin, and elevates glp-1 in overweight individuals: A pilot study. Nutrients 2017, 9, 362. [Google Scholar] [CrossRef]


| NGT | IFG | p Values | |
|---|---|---|---|
| Number (men) | 9 (9) | 9 (9) | |
| Age (years) | 47 ± 2 | 51 ± 2 | 0.220 |
| Weight (kg) | 73.0 ± 4.7 | 76.1 ± 4.2 | 0.632 |
| BMI (kg/m2) | 25.4 ± 1.2 | 26.3 ± 1.5 | 0.616 |
| BMR (kcal/d) | 1530 ± 62 | 1556 ± 56 | 0.758 |
| SBP (mmHg) | 126.7 ± 4.5 | 135.2 ± 4.4 | 0.194 |
| DBP (mmHg) | 76.6 ± 3.9 | 85.7 ± 3.2 | 0.091 |
| Glucose (mg/dL) | 87 ± 2 | 114 ± 2 | <0.001 |
| Insulin (mU/mL) | 5.8 ± 0.9 | 7.7 ± 1.2 | 0.215 |
| HbA1c (%) | 5.0 ± 0.1 | 5.9 ± 0.1 | <0.001 |
| HOMA-IR | 1.2 ± 0.2 | 2.2 ± 0.3 | 0.027 |
| Triglycerides (mg/dL) | 186 ± 30 | 132 ± 14 | 0.123 |
| HDL-cholesterol (mg/dL) | 60 ± 4 | 47 ± 3 | 0.023 |
| LDL-cholesterol (mg/dL) | 138 ± 12 | 139 ± 10 | 0.977 |
| FFA (mEq/L) | 0.60 ± 0.03 | 0.71 ± 0.06 | 0.124 |
| NGT | IFG | |||||
|---|---|---|---|---|---|---|
| 3M | 9M | p Values | 3M | 9M | p Values | |
| Mean (mg/dL) | 112 ± 15 | 105 ± 15 | 0.132 | 139 ± 17 | 137 ± 10 | 0.800 |
| SD 2 (mg/dL) | 27 ± 10 | 19 ± 8 | 0.034 | 36 ± 9 | 24 ± 10 | 0.014 |
| AUC (mg/dL×h) | 2680 ± 361 | 2498 ± 352 | 0.132 | 3314 ± 396 | 3283 ± 250 | 0.804 |
| Maximum (mg/dL) | 184 ± 40 | 150 ± 20 | 0.016 | 233 ± 36 | 195 ± 30 | 0.016 |
| Minimum (mg/dL) | 69 ± 17 | 68 ± 13 | 0.923 | 75 ± 17 | 87 ± 14 | 0.185 |
| Max-min range (mg/dL) | 115 ± 42 | 82 ± 26 | 0.039 | 158 ± 31 | 108 ± 37 | 0.008 |
| >180 mg/dL time (min) | 73 ± 79 | 0 ± 0 | 0.025 | 193 ± 184 | 103 ± 140 | 0.172 |
| <70 mg/dL time (min) | 84 ± 122 | 51 ± 119 | 0.599 | 34 ± 60 | 0 ± 0 | 0.130 |
| NGT | IFG | |||||
|---|---|---|---|---|---|---|
| 3M | 9M | p Values | 3M | 9M | p Values | |
| Glucose | ||||||
| Fasting (mg/dL) | 84 ± 4 | 82 ± 5 | 0.201 | 106 ± 13 | 105 ± 8 | 0.528 |
| Cmax (mg/dL) | 166 ± 40 | 160 ± 38 | 0.387 | 249 ± 52 | 236 ± 40 | 0.042 |
| iAUC (mg/dL×h) | 120 ± 67 | 112 ± 86 | 0.691 | 285 ± 123 | 242 ± 119 | 0.080 |
| Insulin | ||||||
| Fasting (μU/ml) | 4.4 ± 1.2 | 4.6 ± 1.5 | 0.697 | 7.1 ± 3.5 | 6.7 ± 3.5 | 0.325 |
| Cmax (μU/ml) | 66.3 ± 38.4 | 66.1 ± 44.0 | 0.990 | 88.5 ± 76.7 | 118.9 ± 112.9 | 0.055 |
| iAUC (μU/ml×h) | 114.5 ± 63.6 | 117.0 ± 77.0 | 0.915 | 171.7 ± 140.5 | 213.6 ± 201.4 | 0.119 |
| Insulin sensitivity indices | ||||||
| HOMA-IR2 | 0.91 ± 0.27 | 0.93 ± 0.32 | 0.856 | 1.88 ± 1.04 | 1.70 ± 0.87 | 0.236 |
| QUICKI | 1.15 ± 0.13 | 1.16 ± 0.15 | 0.809 | 1.30 ± 0.21 | 1.28 ± 0.21 | 0.292 |
| Matsuda index | 9.06 ± 3.14 | 9.53 ± 4.20 | 0.641 | 5.16 ± 2.30 | 5.05 ± 2.03 | 0.789 |
| Insulinogenic index | 2.44 ± 5.51 | 1.05 ± 0.85 | 0.431 | 0.36 ± 0.23 | 0.42 ± 0.28 | 0.396 |
| Glucagon | ||||||
| Fasting (pg/mL) | 2.39 ± 3.24 | 2.28 ± 3.35 | 0.605 | 2.16 ± 3.43 | 2.49 ± 3.49 | 0.666 |
| Cmax (pg/mL) | 3.11 ± 3.96 | 2.97 ± 3.65 | 0.347 | 3.08 ± 3.43 | 3.63 ± 3.80 | 0.602 |
| iAUC (pg/dL×h) | 0.49 ± 1.44 | 0.74 ± 3.42 | 0.829 | −0.61 ± 3.64 | 0.85 ± 3.30 | 0.262 |
| GLP-1 (active) | ||||||
| Fasting (pmol/L) | 0.4 ± 0.8 | 50.3 ± 21.8 | 0.345 | 59.2 ± 60.2 | 35.9 ± 21.1 | 0.364 |
| Cmax (pmol/L) | 7.5 ± 5.9 | 7.9 ± 4.6 | 0.826 | 7.7 ± 3.7 | 10.3 ± 5.6 | 0.083 |
| iAUC (pmol/L×h) | 10.4 ± 8.8 | 14.8 ± 17.9 | 0.437 | 10.0 ± 6.4 | 13.7 ± 6.0 | 0.049 |
| GIP (total) | ||||||
| Fasting (pg/mL) | 62 ± 29 | 50 ± 22 | 0.345 | 59 ± 60 | 36 ± 21 | 0.364 |
| Cmax (pg/mL) | 478 ± 268 | 467 ± 239 | 0.750 | 453 ± 249 | 437 ± 260 | 0.733 |
| iAUC (pg/mL×h) | 855 ± 416 | 473 ± 158 | 0.774 | 1159 ± 772 | 1098 ± 657 | 0.644 |
© 2019 by the authors. Licensee MDPI, Basel, Switzerland. This article is an open access article distributed under the terms and conditions of the Creative Commons Attribution (CC BY) license (http://creativecommons.org/licenses/by/4.0/).
Share and Cite
Hibi, M.; Hari, S.; Yamaguchi, T.; Mitsui, Y.; Kondo, S.; Katashima, M. Effect of Short-Term Increase in Meal Frequency on Glucose Metabolism in Individuals with Normal Glucose Tolerance or Impaired Fasting Glucose: A Randomized Crossover Clinical Trial. Nutrients 2019, 11, 2126. https://doi.org/10.3390/nu11092126
Hibi M, Hari S, Yamaguchi T, Mitsui Y, Kondo S, Katashima M. Effect of Short-Term Increase in Meal Frequency on Glucose Metabolism in Individuals with Normal Glucose Tolerance or Impaired Fasting Glucose: A Randomized Crossover Clinical Trial. Nutrients. 2019; 11(9):2126. https://doi.org/10.3390/nu11092126
Chicago/Turabian StyleHibi, Masanobu, Sayaka Hari, Tohru Yamaguchi, Yuki Mitsui, Sumio Kondo, and Mitsuhiro Katashima. 2019. "Effect of Short-Term Increase in Meal Frequency on Glucose Metabolism in Individuals with Normal Glucose Tolerance or Impaired Fasting Glucose: A Randomized Crossover Clinical Trial" Nutrients 11, no. 9: 2126. https://doi.org/10.3390/nu11092126
APA StyleHibi, M., Hari, S., Yamaguchi, T., Mitsui, Y., Kondo, S., & Katashima, M. (2019). Effect of Short-Term Increase in Meal Frequency on Glucose Metabolism in Individuals with Normal Glucose Tolerance or Impaired Fasting Glucose: A Randomized Crossover Clinical Trial. Nutrients, 11(9), 2126. https://doi.org/10.3390/nu11092126