Effects of Regular Kefir Consumption on Gut Microbiota in Patients with Metabolic Syndrome: A Parallel-Group, Randomized, Controlled Study
 ,
,  , ,
, ,
Abstract
1. Introduction
2. Materials and Methods
2.1. Subjects
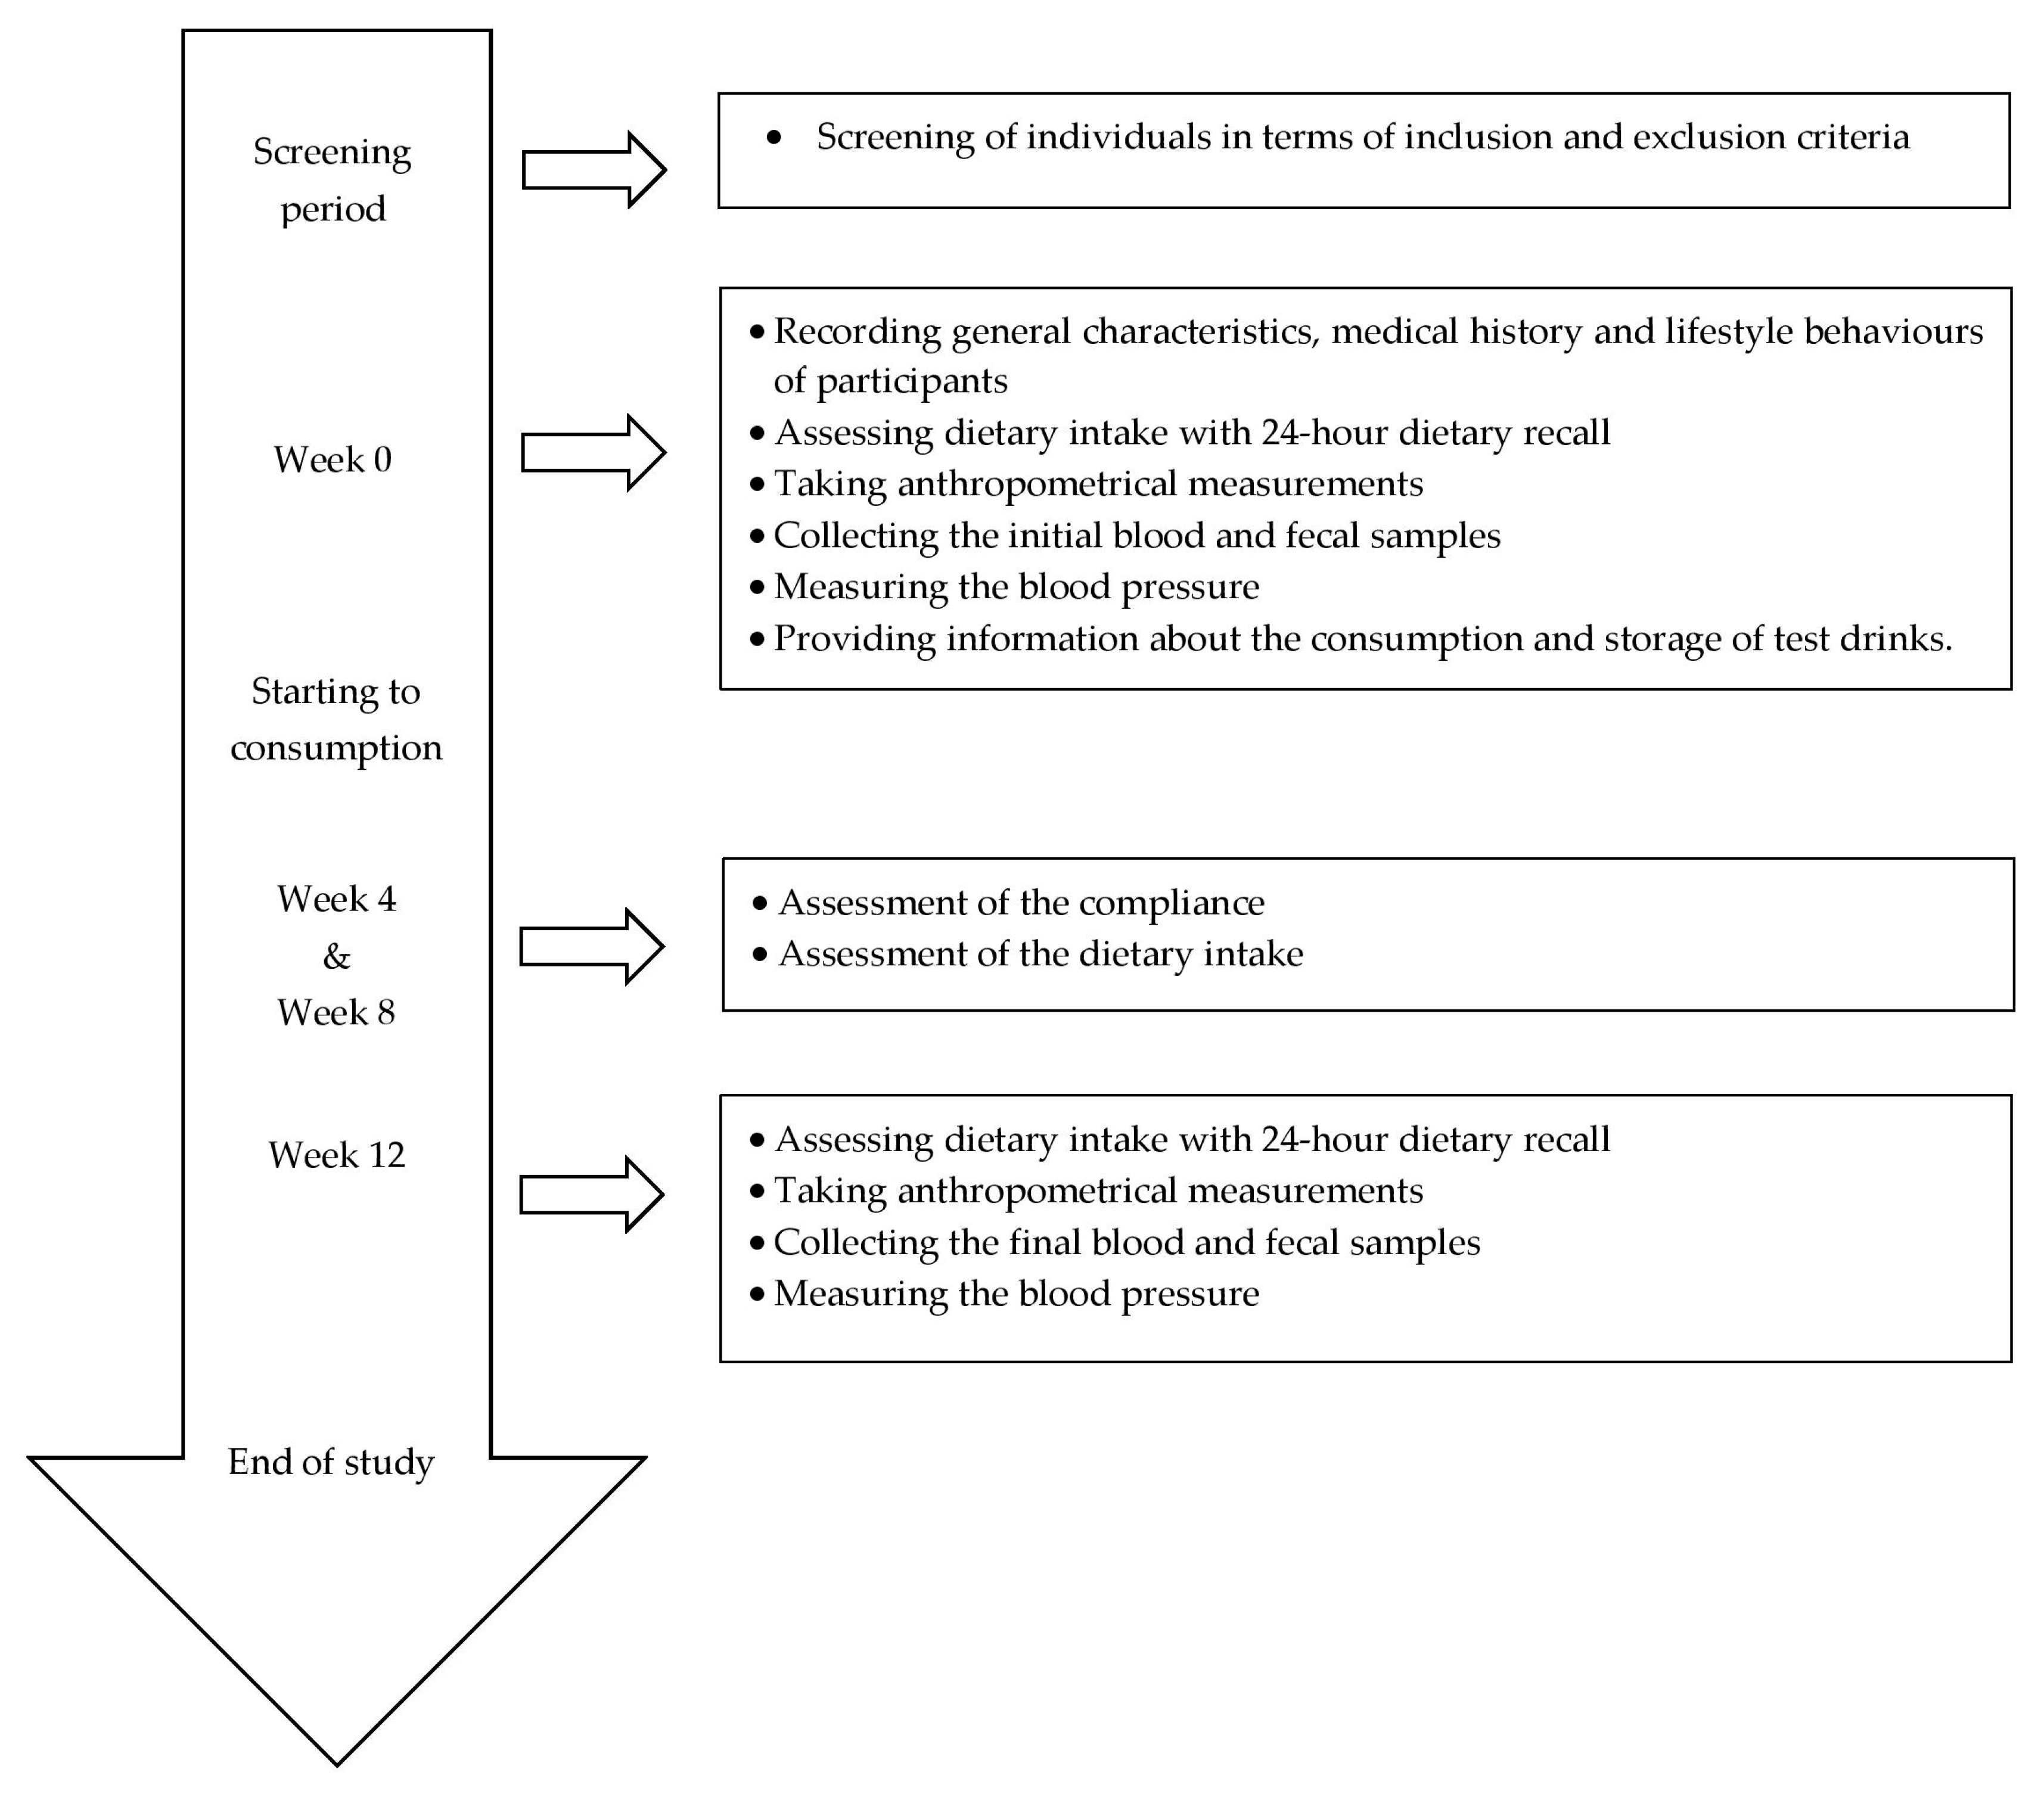
2.2. Study Design
2.3. Intervention
2.4. Test Drinks
2.5. Dietary Assessment
2.6. Anthropometrical Measurements
2.7. Biochemical Analysis and Blood Pressure
2.8. Specimen Processing, 16S rRNA Amplification and Sequencing
2.9. Data Handling, Phylogenetic and Statistical Analyses
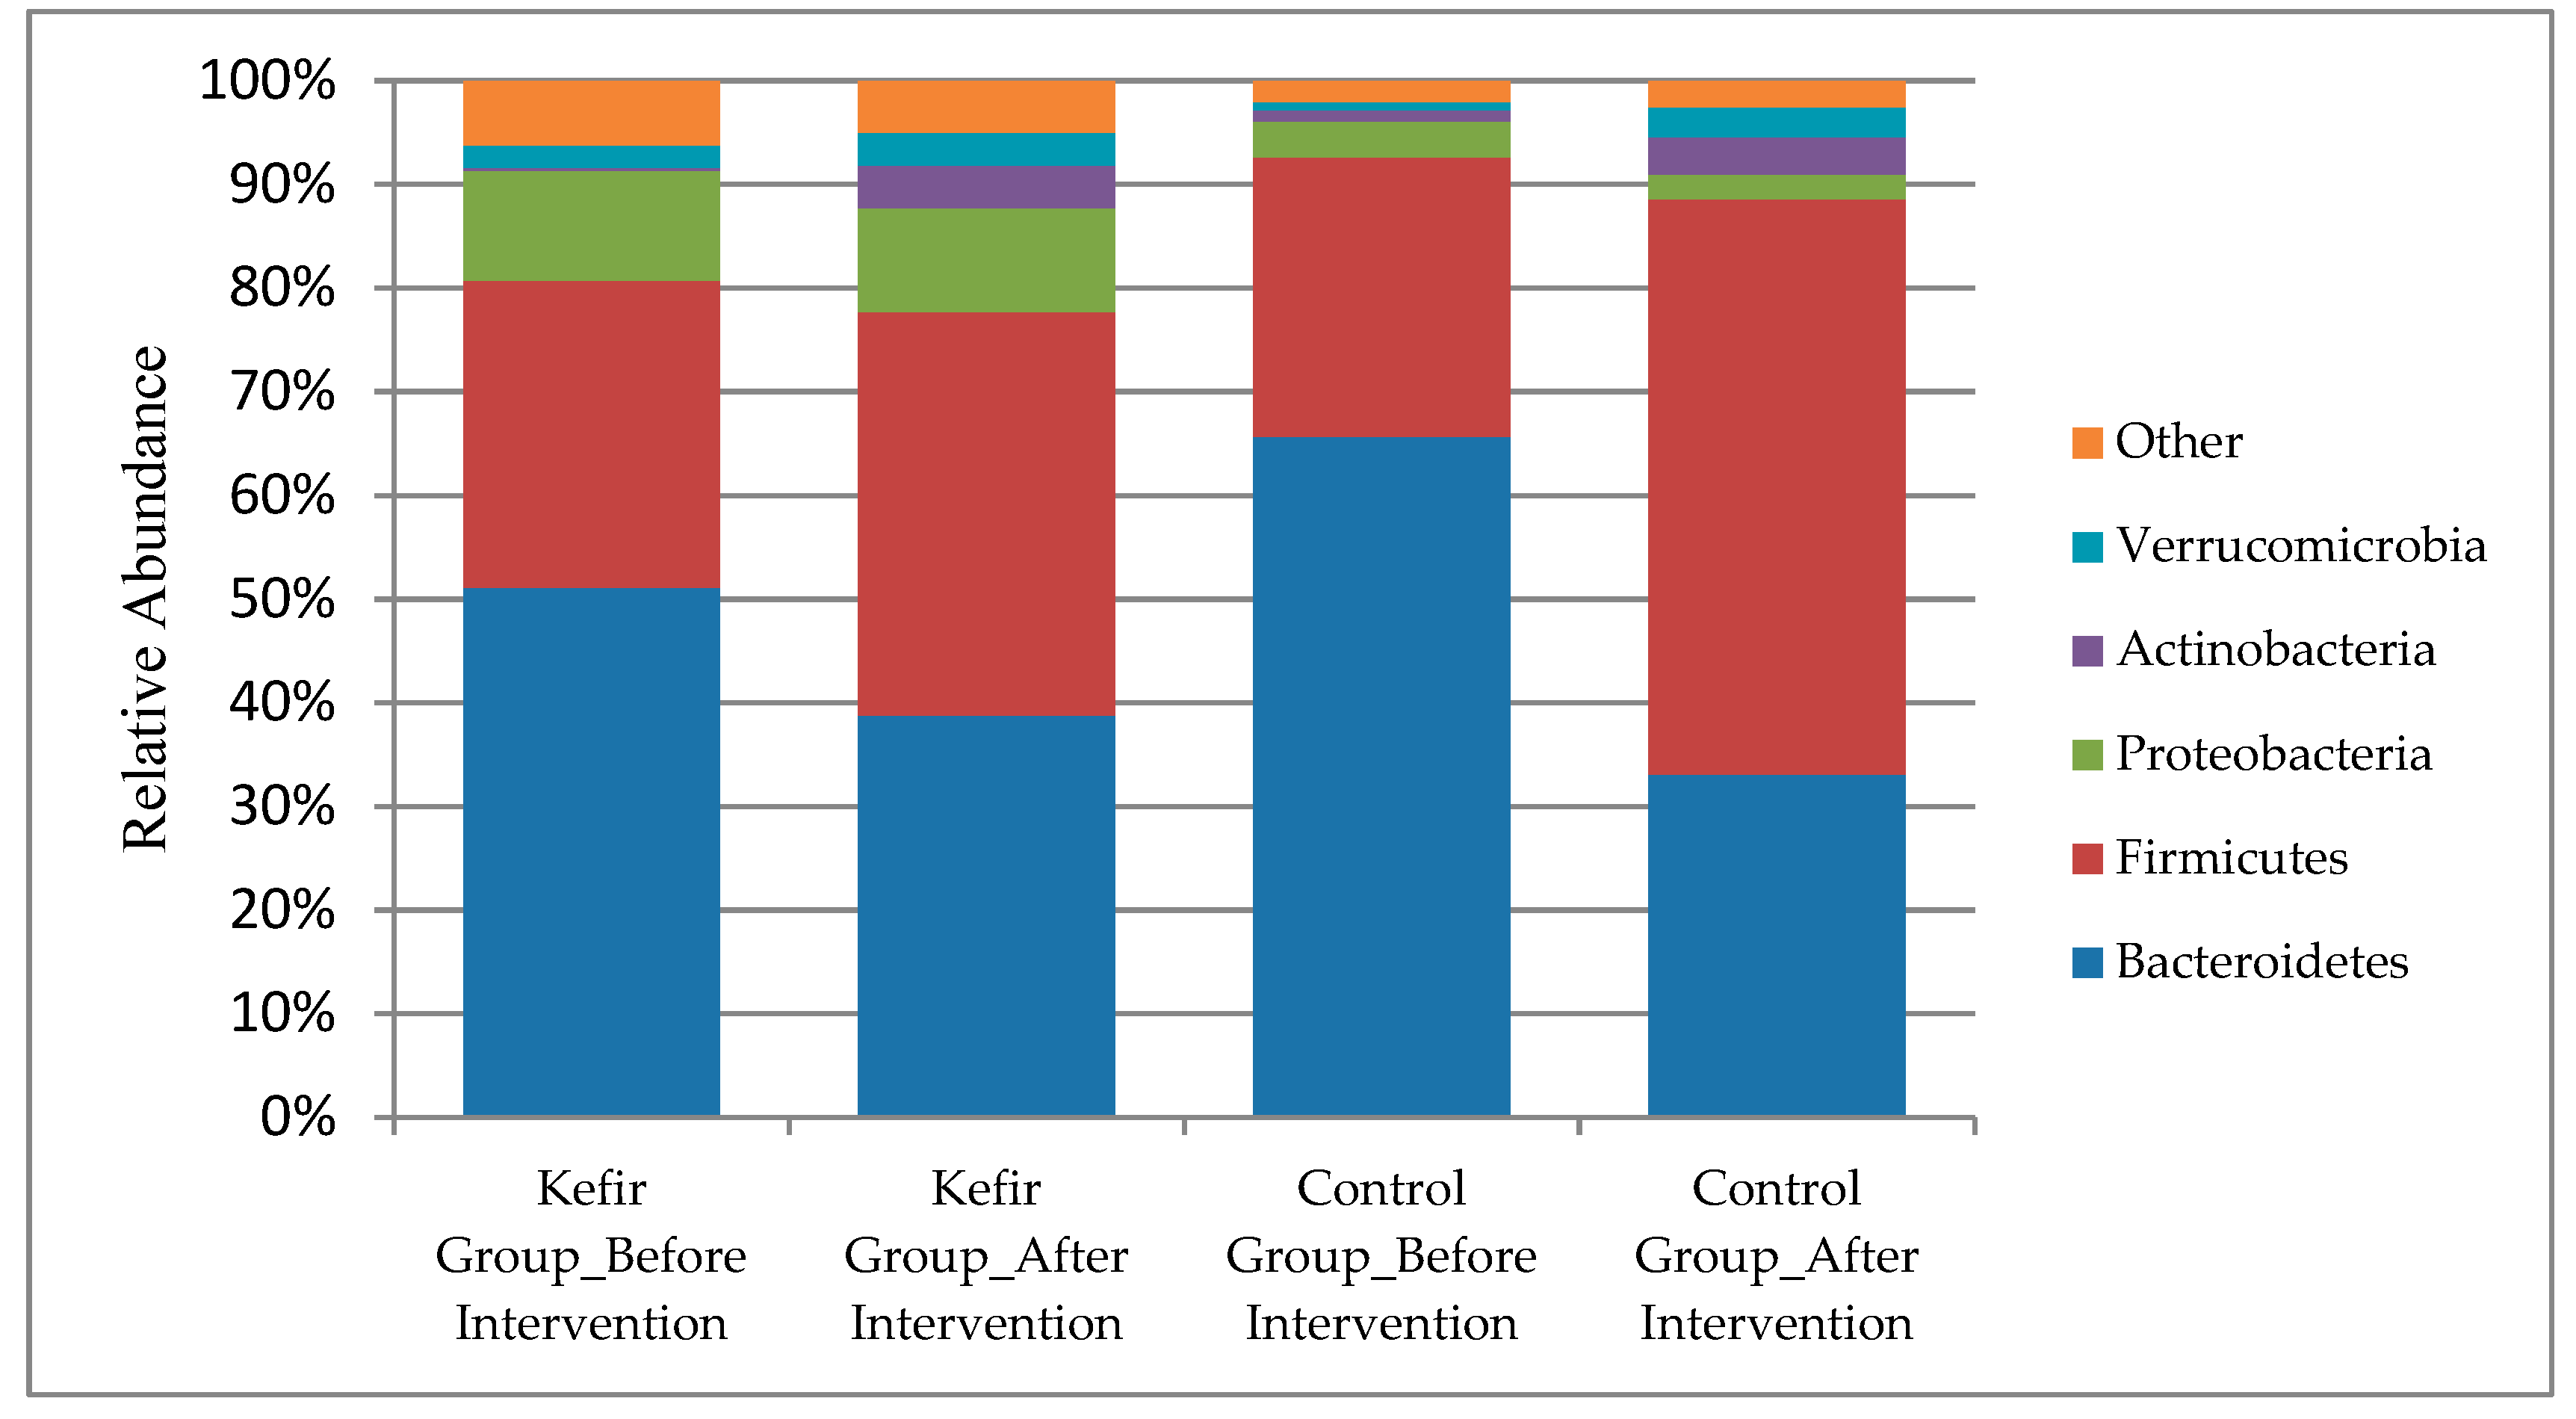
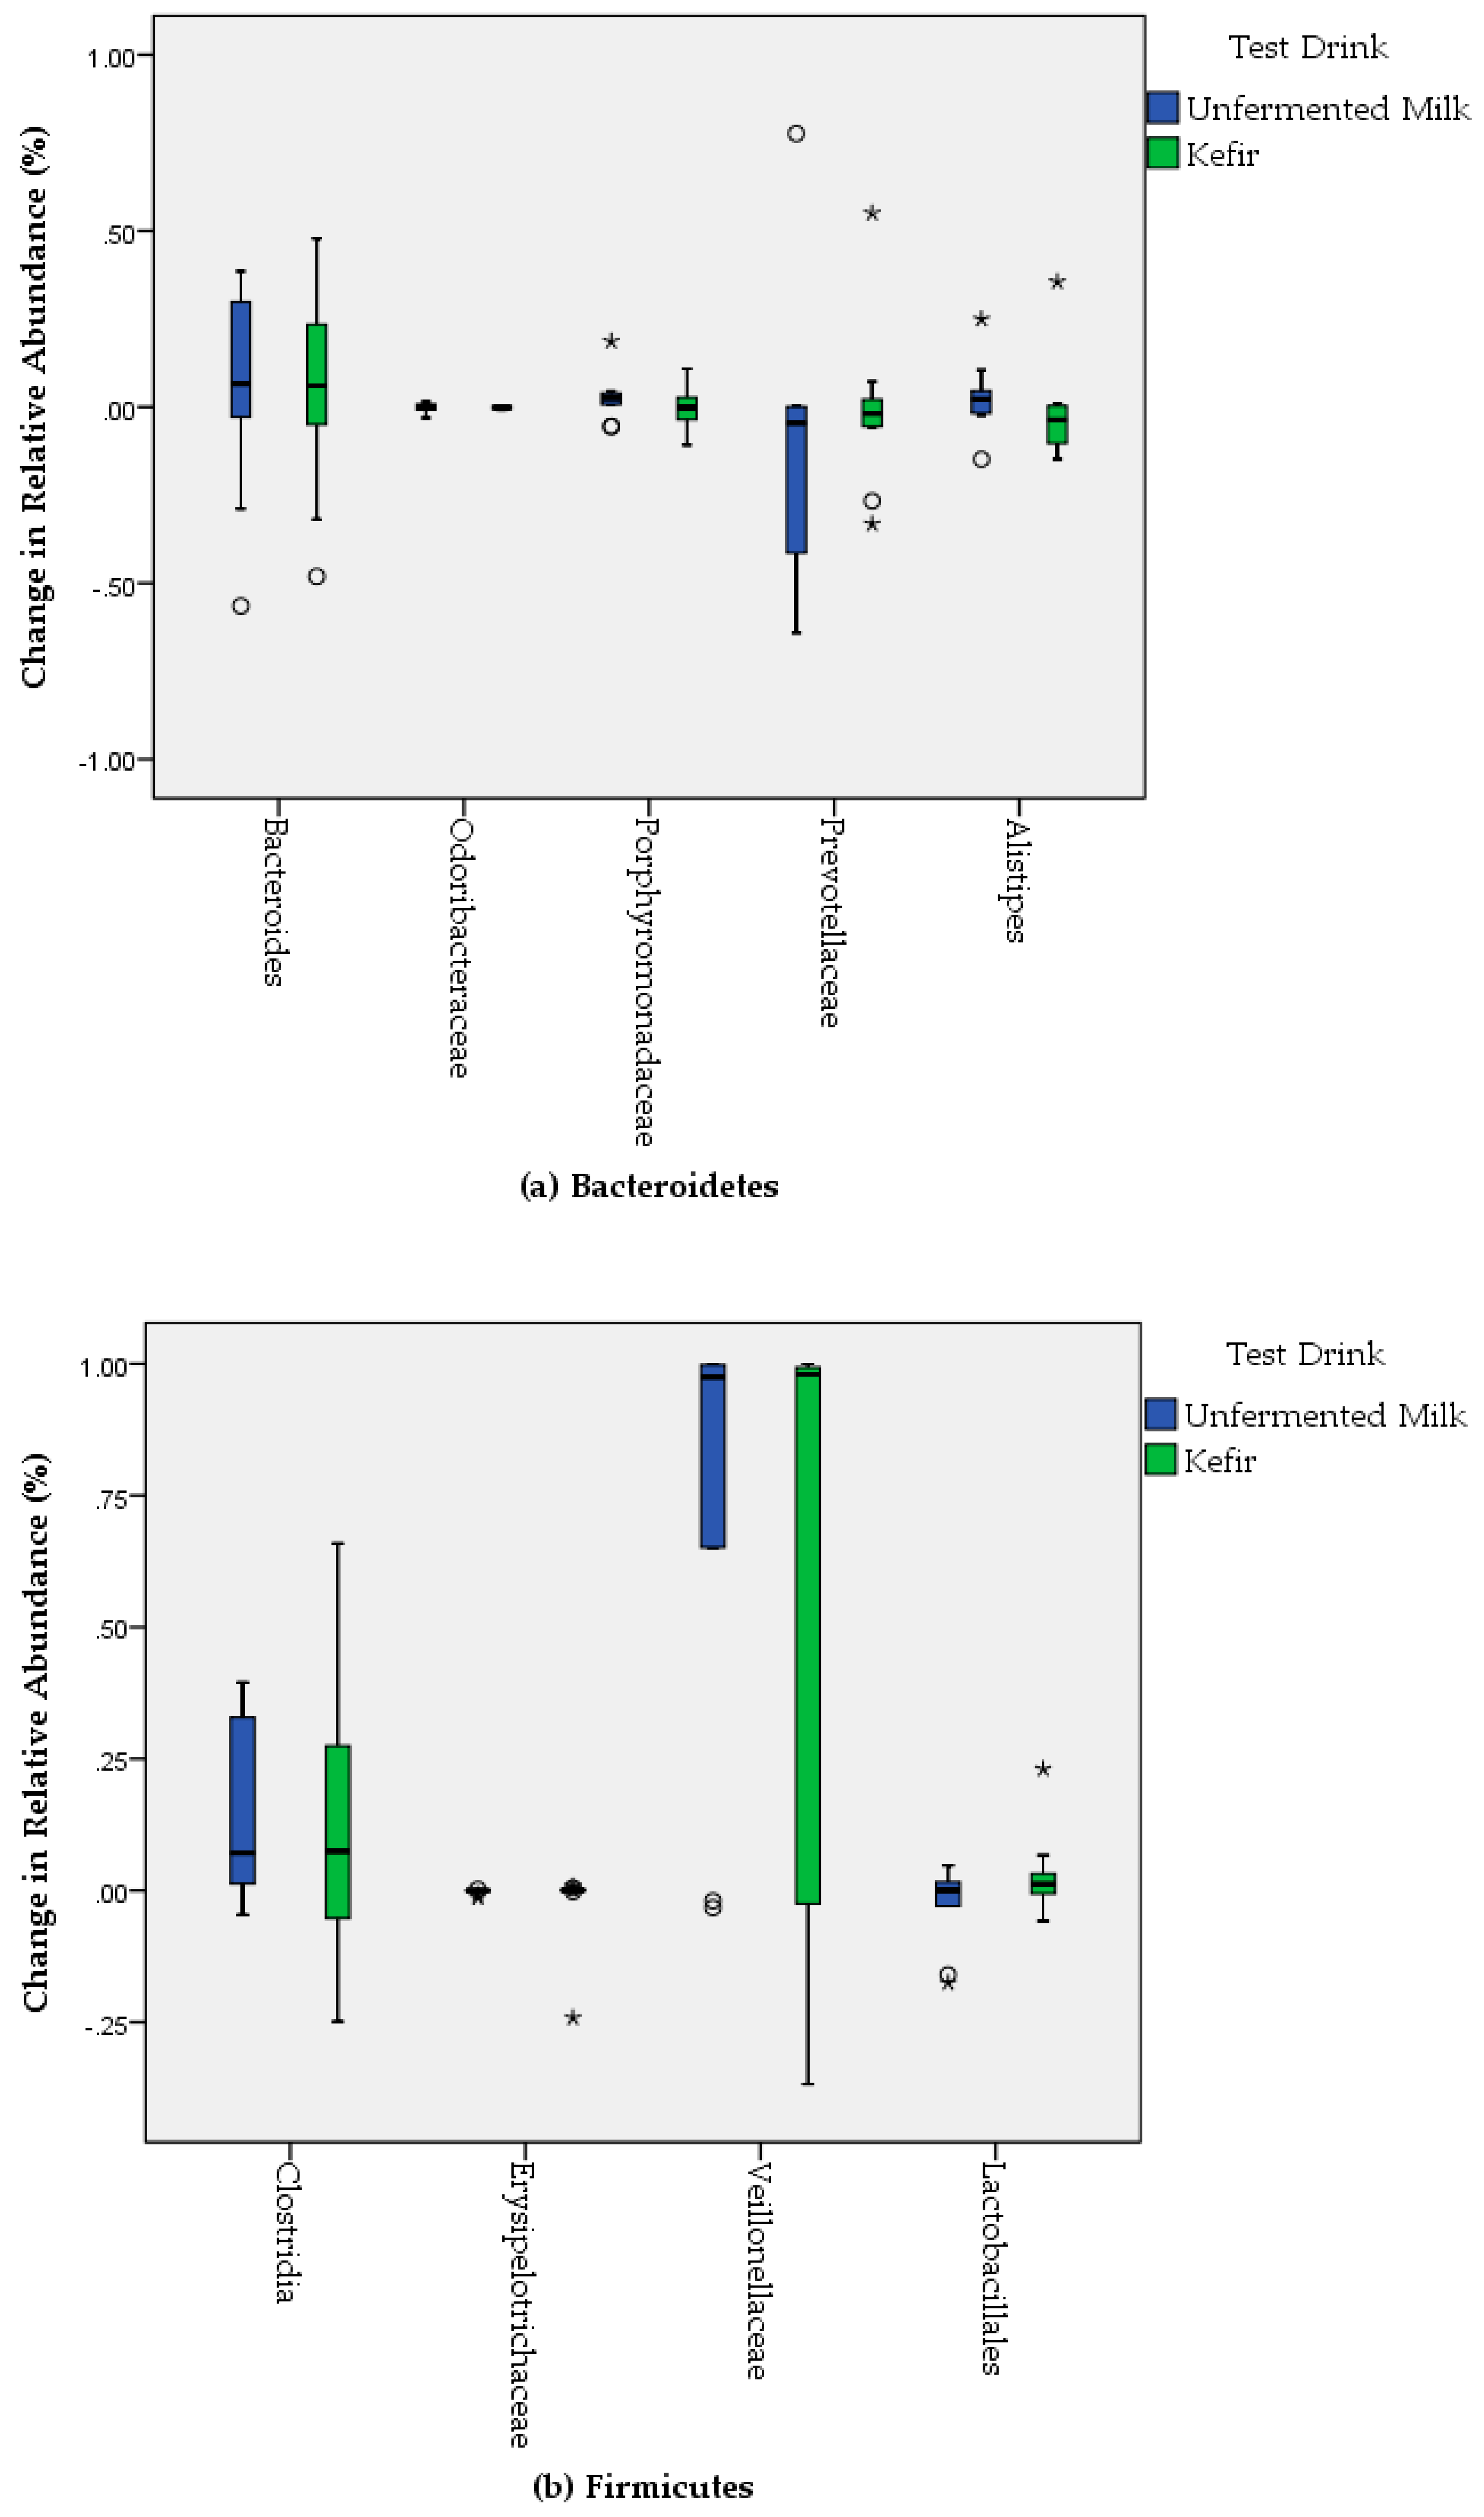
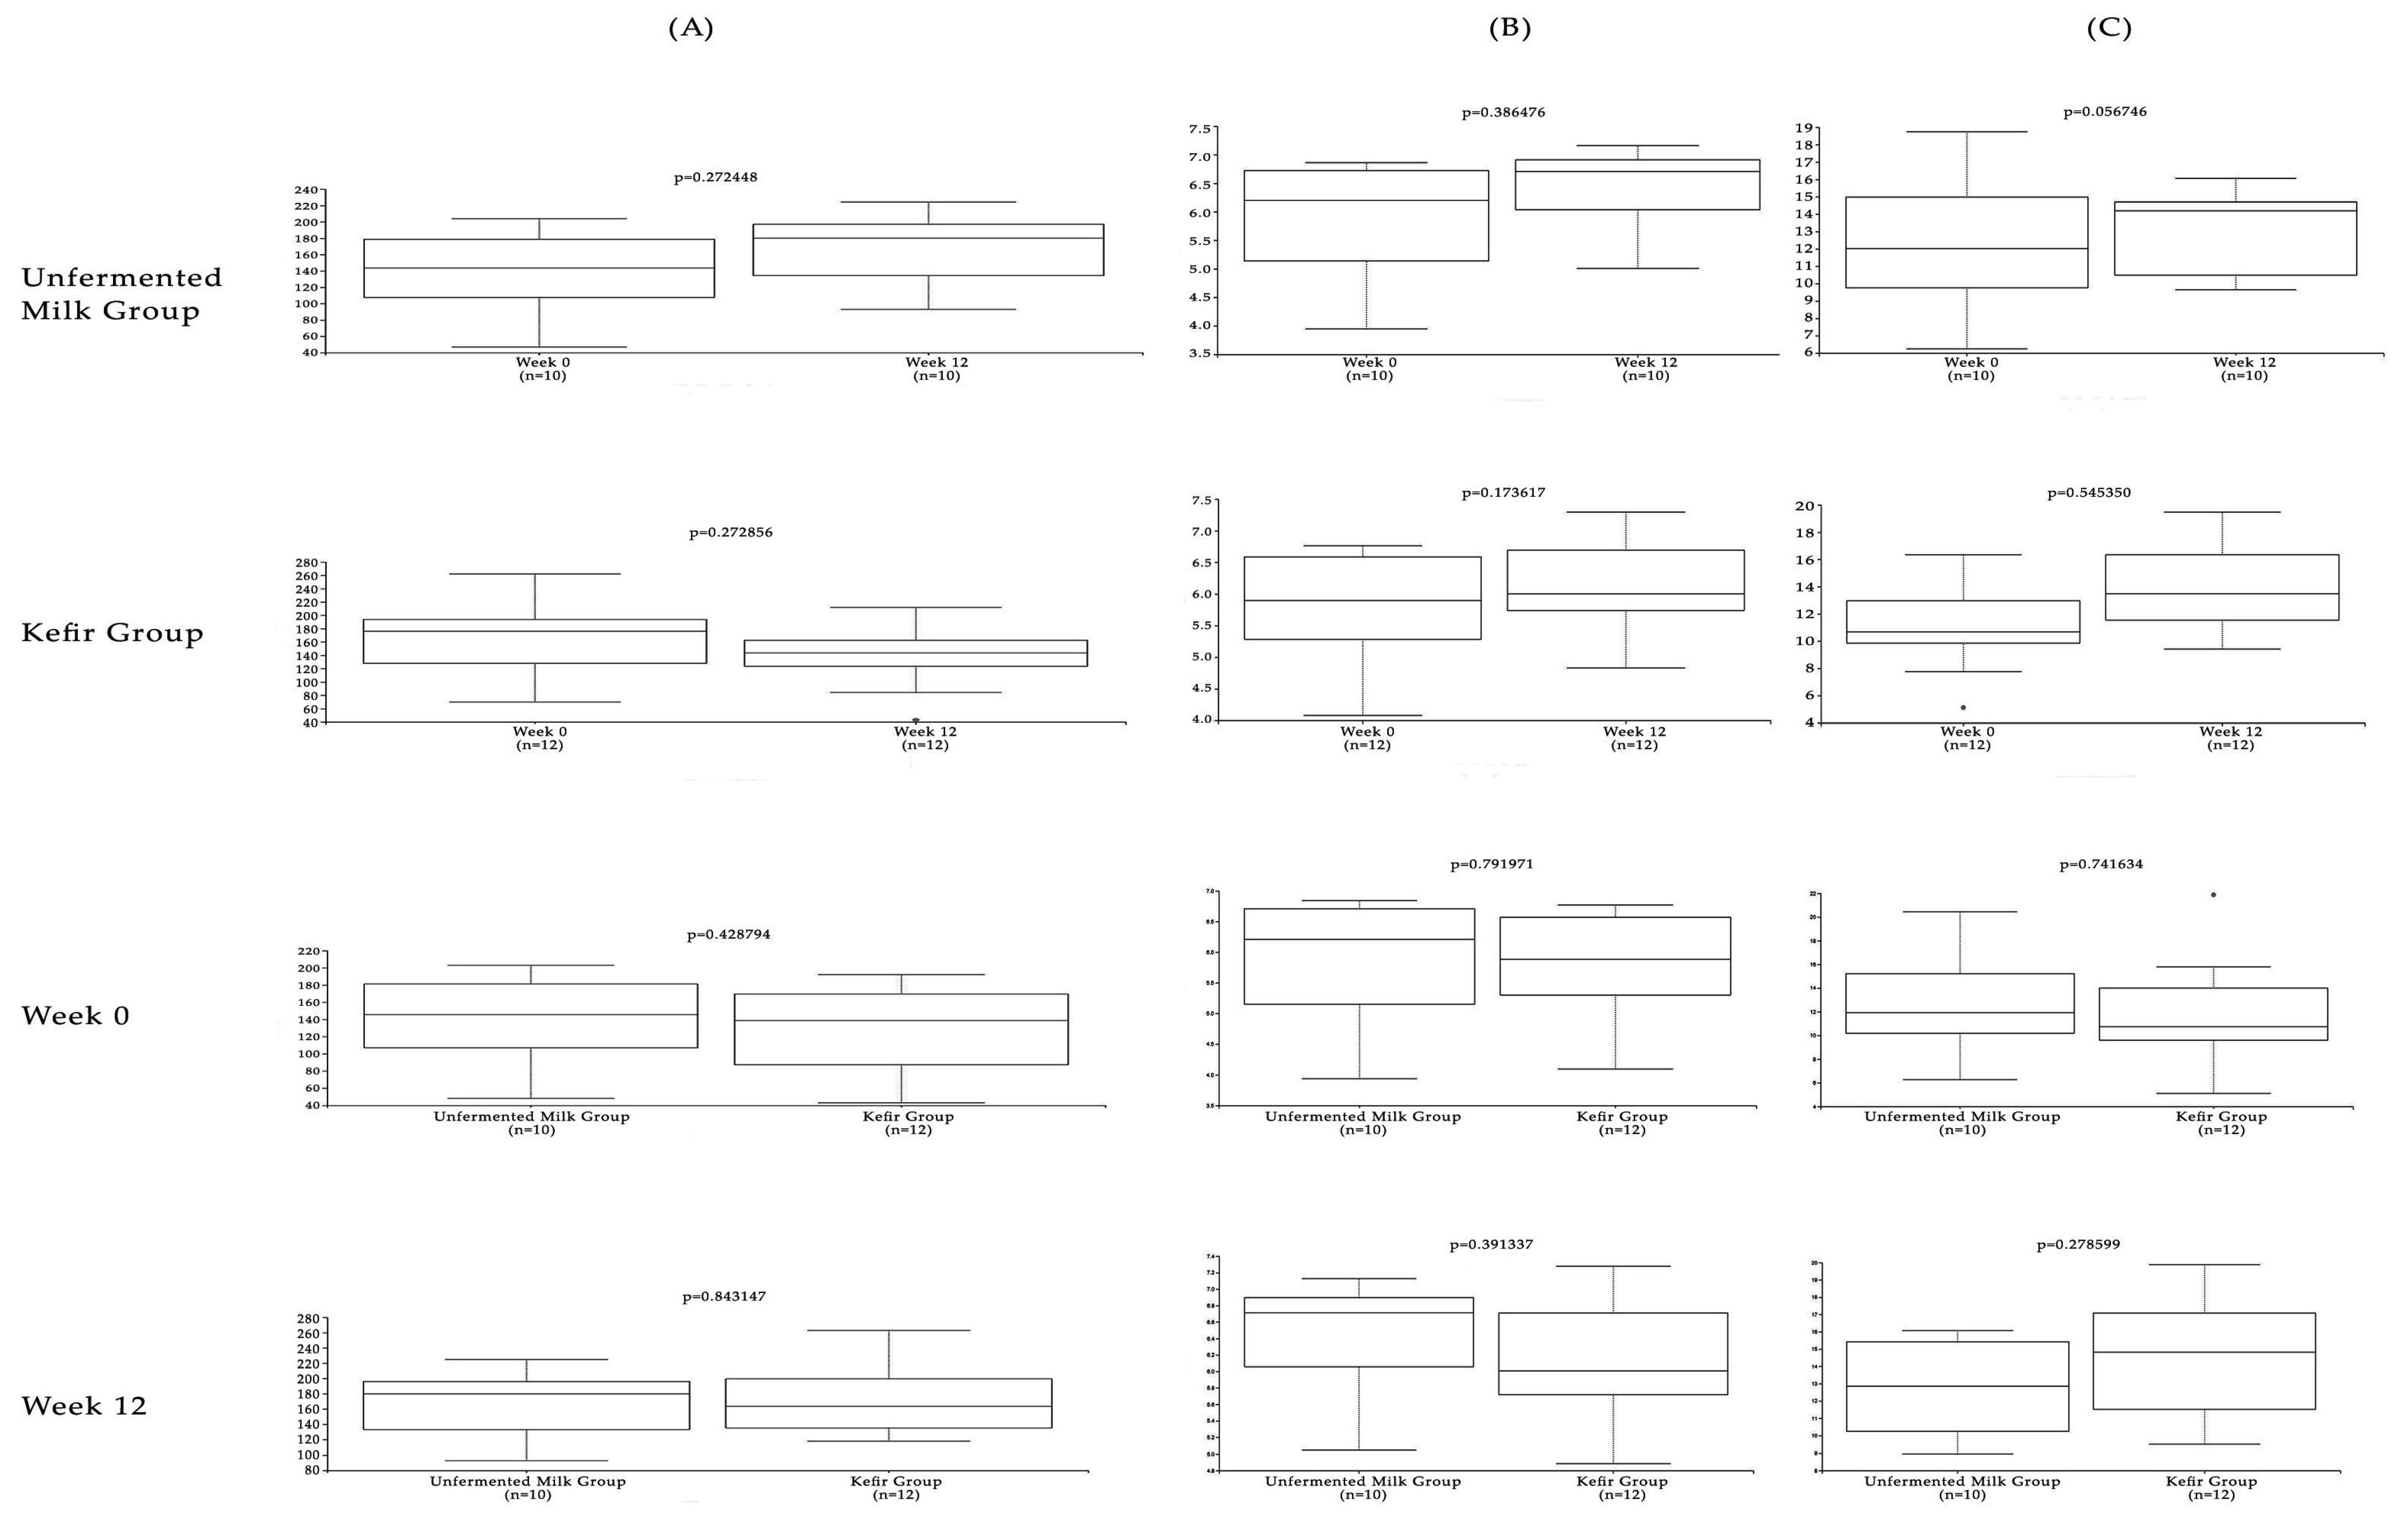
3. Results
4. Discussion
5. Conclusions
Author Contributions
Funding
Acknowledgments
Conflicts of Interest
References
- Alberti, K.G.; Eckel, R.H.; Grundy, S.M.; Zimmet, P.Z.; Cleeman, J.I.; Donato, K.A.; Fruchart, J.C.; James, W.P.; Loria, C.M.; Smith, S.C., Jr.; et al. Harmonizing the metabolic syndrome: a joint interim statement of the International Diabetes Federation Task Force on Epidemiology and Prevention; National Heart, Lung, and Blood Institute; American Heart Association; World Heart Federation; International Atherosclerosis Society; and International Association for the Study of Obesity. Circulation 2009, 120, 1640–1645. [Google Scholar] [CrossRef] [PubMed]
- Mottillo, S.; Filion, K.B.; Genest, J.; Joseph, L.; Pilote, L.; Poirier, P.; Rinfret, S.; Schiffrin, E.L.; Eisenberg, M.J. The metabolic syndrome and cardiovascular risk a systematic review and meta–analysis. J. Am. Coll. Cardiol. 2010, 56, 1113–1132. [Google Scholar] [CrossRef] [PubMed]
- Elder, S.J.; Lichtenstein, A.H.; Pittas, A.G.; Roberts, S.B.; Fuss, P.J.; Greenberg, A.S.; McCrory, M.A.; Bouchard, T.J., Jr.; Saltzman, E.; Neale, M.C. Genetic and environmental influences on factors associated with cardiovascular disease and the metabolic syndrome. J. Lipid. Res. 2009, 50, 1917–1926. [Google Scholar] [CrossRef] [PubMed]
- Stancakova, A.; Laakso, M. Genetics of metabolic syndrome. Rev. Endocr. Metab. Disord. 2014, 15, 243–252. [Google Scholar] [CrossRef] [PubMed]
- Turnbaugh, P.J.; Ley, R.E.; Mahowald, M.A.; Magrini, V.; Mardis, E.R.; Gordon, J.I. An obesity–associated gut microbiome with increased capacity for energy harvest. Nature 2006, 444, 1027–1031. [Google Scholar] [CrossRef] [PubMed]
- Burcelin, R.; Luche, E.; Serino, M.; Amar, J. The gut microbiota ecology: a new opportunity for the treatment of metabolic diseases? Front Biosci 2009, 14, 5107–5117. [Google Scholar] [CrossRef]
- Cani, P.D.; Amar, J.; Iglesias, M.A.; Poggi, M.; Knauf, C.; Bastelica, D.; Neyrinck, A.M.; Fava, F.; Tuohy, K.M.; Chabo, C.; et al. Metabolic endotoxemia initiates obesity and insulin resistance. Diabetes 2007, 56, 1761–1772. [Google Scholar] [CrossRef]
- Ley, R.E.; Backhed, F.; Turnbaugh, P.; Lozupone, C.A.; Knight, R.D.; Gordon, J.I. Obesity alters gut microbial ecology. Proc. Natl. Acad. Sci. USA 2005, 102, 11070–11075. [Google Scholar] [CrossRef]
- Backhed, F.; Ley, R.E.; Sonnenburg, J.L.; Peterson, D.A.; Gordon, J.I. Host–bacterial mutualism in the human intestine. Science 2005, 307, 1915–1920. [Google Scholar] [CrossRef]
- Shen, J.; Obin, M.S.; Zhao, L. The gut microbiota, obesity and insulin resistance. Mol. Asp. Med. 2013, 34, 39–58. [Google Scholar] [CrossRef]
- Esteve, E.; Ricart, W.; Fernandez-Real, J.M. Gut microbiota interactions with obesity, insulin resistance and type 2 diabetes: did gut microbiote co–evolve with insulin resistance? Curr. Opin. Clin. Nutr. Metab. Care 2011, 14, 483–490. [Google Scholar] [CrossRef]
- Festi, D.; Schiumerini, R.; Eusebi, L.H.; Marasco, G.; Taddia, M.; Colecchia, A. Gut microbiota and metabolic syndrome. World J. Gastroenterol. 2014, 20, 16079–16094. [Google Scholar] [CrossRef] [PubMed]
- Le Barz, M.; Anhe, F.F.; Varin, T.V.; Desjardins, Y.; Levy, E.; Roy, D.; Urdaci, M.C.; Marette, A. Probiotics as Complementary Treatment for Metabolic Disorders. Diabetes Metab. J. 2015, 39, 291–303. [Google Scholar] [CrossRef] [PubMed]
- Cani, P.D.; Van Hul, M. Novel opportunities for next–generation probiotics targeting metabolic syndrome. Curr. Opin. Biotechnol. 2015, 32, 21–27. [Google Scholar] [CrossRef] [PubMed]
- Ahmed, Z.; Wang, Y.; Ahmad, A.; Khan, S.T.; Nisa, M.; Ahmad, H.; Afreen, A. Kefir and health: A contemporary perspective. Crit. Rev. Food Sci. Nutr. 2013, 53, 422–434. [Google Scholar] [CrossRef] [PubMed]
- Koyu, E.B.; Buyuktuncer Demirel, Z. A functional food: Kefir. J. Nutr. Diet. 2018, 46, 166–175. [Google Scholar] [CrossRef]
- Rosa, D.D.; Dias, M.M.S.; Grzeskowiak, L.M.; Reis, S.A.; Conceicao, L.L.; Peluzio, M. Milk kefir: nutritional, microbiological and health benefits. Nutr. Res. Rev. 2017, 30, 82–96. [Google Scholar] [CrossRef]
- Bourrie, B.C.; Willing, B.P.; Cotter, P.D. The microbiota and health promoting characteristics of the fermented beverage kefir. Front. Microbiol. 2016, 7, 647. [Google Scholar] [CrossRef] [PubMed]
- Liu, J.R.; Chen, M.J.; Lin, C.W. Antimutagenic and antioxidant properties of milk–kefir and soymilk–kefir. J. Agric. Food Chem. 2005, 53, 2467–2474. [Google Scholar] [CrossRef] [PubMed]
- Lee, M.Y.; Ahn, K.S.; Kwon, O.K.; Kim, M.J.; Kim, M.K.; Lee, I.Y.; Oh, S.R.; Lee, H.K. Anti–inflammatory and anti–allergic effects of kefir in a mouse asthma model. Immunobiology 2007, 212, 647–654. [Google Scholar] [CrossRef]
- Turan, I.; Dedeli, O.; Bor, S.; Ilter, T. Effects of a kefir supplement on symptoms, colonic transit, and bowel satisfaction score in patients with chronic constipation: a pilot study. Turk. J. Gastroenterol. 2014, 25, 650–656. [Google Scholar] [CrossRef] [PubMed]
- Friques, A.G.F.; Arpini, C.M.; Kalil, I.C.; Gava, A.L.; Leal, M.A.; Porto, M.L.; Nogueira, B.V.; Dias, A.T.; Andrade, T.U.; Pereira, T.M.C.; et al. Chronic administration of the probiotic kefir improves the endothelial function in spontaneously hypertensive rats. J. Transl. Med. 2015, 13, 390. [Google Scholar] [CrossRef] [PubMed]
- Hadisaputro, S.; Djokomoeljanto, R.R.; Judiono; Soesatyo, M.H. The effects of oral plain kefir supplementation on proinflammatory cytokine properties of the hyperglycemia Wistar rats induced by streptozotocin. Acta Med. Indones. 2012, 44, 100–104. [Google Scholar] [PubMed]
- Zimmet, P.; KG, M.M.A.; Serrano Rios, M. A new international diabetes federation worldwide definition of the metabolic syndrome: the rationale and the results. Rev. Esp. Cardiol. 2005, 58, 1371–1376. [Google Scholar] [CrossRef]
- Thomas, V.; Clark, J.; Dore, J. Fecal microbiota analysis: an overview of sample collection methods and sequencing strategies. Future Microbiol. 2015, 10, 1485–1504. [Google Scholar] [CrossRef]
- Wu, W.K.; Chen, C.C.; Panyod, S.; Chen, R.A.; Wu, M.S.; Sheen, L.Y.; Chang, S.C. Optimization of fecal sample processing for microbiome study—The journey from bathroom to bench. J. Formos. Med. Assoc. 2019, 118, 545–555. [Google Scholar] [CrossRef]
- Klindworth, A.; Pruesse, E.; Schweer, T.; Peplies, J.; Quast, C.; Horn, M.; Glockner, F.O. Evaluation of general 16S ribosomal RNA gene PCR primers for classical and next–generation sequencing–based diversity studies. Nucleic Acids Res. 2013, 41, e1. [Google Scholar] [CrossRef]
- Huson, D.H.; Beier, S.; Flade, I.; Górska, A.; El-Hadidi, M.; Mitra, S.; Ruscheweyh, H.J.; Tappu, R. MEGAN Community Edition– Interactive exploration and analysis of large–scale microbiome sequencing data. PLoS Comput. Biol. 2016, 12, e1004957. [Google Scholar] [CrossRef]
- Bolger, A.M.; Lohse, M.; Usadel, B. Trimmomatic: A flexible trimmer for Illumina sequence data. Bioinformatics 2014, 30, 2114–2120. [Google Scholar] [CrossRef]
- Langmead, B.; Salzberg, S.L. Fast gapped–read alignment with Bowtie 2. Nat. Methods 2012, 9, 357–359. [Google Scholar] [CrossRef]
- Bolyen, E.; Rideout, J.R.; Dillon, M.R.; Bokulich, N.A.; Abnet, C.; Al-Ghalith, G.A.; Alexander, H.; Alm, E.J.; Arumugam, M.; Asnicar, F.; et al. QIIME 2: Reproducible, interactive, scalable, and extensible microbiome data science. PeerJ Prepr. 2018, 6, e27295v27292. [Google Scholar] [CrossRef] [PubMed]
- Callahan, B.J.; McMurdie, P.J.; Rosen, M.J.; Han, A.W.; Johnson, A.J.; Holmes, S.P. DADA2: High–resolution sample inference from Illumina amplicon data. Nat. Methods 2016, 13, 581–583. [Google Scholar] [CrossRef] [PubMed]
- Amir, A.; McDonald, D.; Navas-Molina, J.A.; Kopylova, E.; Morton, J.T.; Zech Xu, Z.; Kightley, E.P.; Thompson, L.R.; Hyde, E.R.; Gonzalez, A.; et al. Deblur rapidly resolves single–nucleotide community sequence patterns. MSystems 2017, 2, e00191-16. [Google Scholar] [CrossRef] [PubMed]
- McDonald, D.; Price, M.N.; Goodrich, J.; Nawrocki, E.P.; DeSantis, T.Z.; Probst, A.; Andersen, G.L.; Knight, R.; Hugenholtz, P. An improved Greengenes taxonomy with explicit ranks for ecological and evolutionary analyses of bacteria and archaea. ISME J. 2012, 6, 610–618. [Google Scholar] [CrossRef] [PubMed]
- Yilmaz, P.; Parfrey, L.W.; Yarza, P.; Gerken, J.; Pruesse, E.; Quast, C.; Schweer, T.; Peplies, J.; Ludwig, W.; Glockner, F.O. The SILVA and “All–species Living Tree Project (LTP)” taxonomic frameworks. Nucleic Acids Res. 2014, 42, D643–D648. [Google Scholar] [CrossRef] [PubMed]
- Vazquez-Baeza, Y.; Pirrung, M.; Gonzalez, A.; Knight, R. EMPeror: a tool for visualizing high–throughput microbial community data. GigaScience 2013, 2, 16. [Google Scholar] [CrossRef]
- Ostadrahimi, A.; Taghizadeh, A.; Mobasseri, M.; Farrin, N.; Payahoo, L.; Beyramalipoor Gheshlaghi, Z.; Vahedjabbari, M. Effect of probiotic fermented milk (kefir) on glycemic control and lipid profile in type 2 diabetic patients: a randomized double–blind placebo–controlled clinical trial. Iran. J. Public Health 2015, 44, 228–237. [Google Scholar]
- Rosa, D.D.; Grzeskowiak, L.M.; Ferreira, C.L.; Fonseca, A.C.; Reis, S.A.; Dias, M.M.; Siqueira, N.P.; Silva, L.L.; Neves, C.A.; Oliveira, L.L.; et al. Kefir reduces insulin resistance and inflammatory cytokine expression in an animal model of metabolic syndrome. Food Funct. 2016, 7, 3390–3401. [Google Scholar] [CrossRef]
- Kim, D.H.; Kim, H.; Jeong, D.; Kang, I.B.; Chon, J.W.; Kim, H.S.; Song, K.Y.; Seo, K.H. Kefir alleviates obesity and hepatic steatosis in high–fat diet–fed mice by modulation of gut microbiota and mycobiota: targeted and untargeted community analysis with correlation of biomarkers. J. Nutr. Biochem. 2017, 44, 35–43. [Google Scholar] [CrossRef]
- St-Onge, M.P.; Farnworth, E.R.; Savard, T.; Chabot, D.; Mafu, A.; Jones, P.J. Kefir consumption does not alter plasma lipid levels or cholesterol fractional synthesis rates relative to milk in hyperlipidemic men: A randomized controlled trial [ISRCTN10820810]. BMC Complement. Altern. Med. 2002, 2, 1. [Google Scholar] [CrossRef]
- Fathi, Y.; Ghodrati, N.; Zibaeenezhad, M.J.; Faghih, S. Kefir drink causes a significant yet similar improvement in serum lipid profile, compared with low–fat milk, in a dairy–rich diet in overweight or obese premenopausal women: A randomized controlled trial. J. Clin. Lipidol. 2017, 11, 136–146. [Google Scholar] [CrossRef] [PubMed]
- Fathi, Y.; Faghih, S.; Zibaeenezhad, M.J.; Tabatabaei, S.H. Kefir drink leads to a similar weight loss, compared with milk, in a dairy–rich non–energy–restricted diet in overweight or obese premenopausal women: A randomized controlled trial. Eur. J. Nutr. 2016, 55, 295–304. [Google Scholar] [CrossRef] [PubMed]
- Fuentes, M.C.; Lajo, T.; Carrion, J.M.; Cune, J. Cholesterol–lowering efficacy of Lactobacillus plantarum CECT 7527, 7528 and 7529 in hypercholesterolaemic adults. Br. J. Nutr. 2013, 109, 1866–1872. [Google Scholar] [CrossRef] [PubMed]
- Nikbakht, E.; Khalesi, S.; Singh, I.; Williams, L.T.; West, N.P.; Colson, N. Effect of probiotics and synbiotics on blood glucose: a systematic review and meta–analysis of controlled trials. Eur. J. Nutr. 2018, 57, 95–106. [Google Scholar] [CrossRef] [PubMed]
- Mallappa, R.H.; Rokana, N.; Duary, R.K.; Panwar, H.; Batish, V.K.; Grover, S. Management of metabolic syndrome through probiotic and prebiotic interventions. Indian J. Endocrinol. Metab. 2012, 16, 20–27. [Google Scholar] [CrossRef] [PubMed]
- Zhang, H.; Sun, J.; Liu, X.; Hong, C.; Zhu, Y.; Liu, A.; Li, S.; Guo, H.; Ren, F. Lactobacillus paracasei subsp. paracasei LC01 positively modulates intestinal microflora in healthy young adults. J. Microbiol. 2013, 51, 777–782. [Google Scholar] [CrossRef] [PubMed]
- Toscano, M.; De Grandi, R.; Stronati, L.; De Vecchi, E.; Drago, L. Effect of Lactobacillus rhamnosus HN001 and Bifidobacterium longum BB536 on the healthy gut microbiota composition at phyla and species level: A preliminary study. World J. Gastroenterol. 2017, 23, 2696–2704. [Google Scholar] [CrossRef] [PubMed]
- Larsen, N.; Vogensen, F.K.; Gobel, R.J.; Michaelsen, K.F.; Forssten, S.D.; Lahtinen, S.J.; Jakobsen, M. Effect of Lactobacillus salivarius Ls–33 on fecal microbiota in obese adolescents. Clin. Nutr. 2013, 32, 935–940. [Google Scholar] [CrossRef] [PubMed]
- Stadlbauer, V.; Leber, B.; Lemesch, S.; Trajanoski, S.; Bashir, M.; Horvath, A.; Tawdrous, M.; Stojakovic, T.; Fauler, G.; Fickert, P.; et al. Lactobacillus casei Shirota Supplementation Does Not Restore Gut Microbiota Composition and Gut Barrier in Metabolic Syndrome: A Randomized Pilot Study. PLoS ONE 2015, 10, e0141399. [Google Scholar] [CrossRef]
- Nova, E.; Pérez de Heredia, F.; Gómez-Martínez, S.; Marcos, A. The Role of Probiotics on the Microbiota: Effect on Obesity. Nutr. Clin. Pract. 2016, 31, 387–400. [Google Scholar] [CrossRef]
- Costabile, A.; Buttarazzi, I.; Kolida, S.; Quercia, S.; Baldini, J.; Swann, J.R.; Brigidi, P.; Gibson, G.R. An in vivo assessment of the cholesterol–lowering efficacy of Lactobacillus plantarum ECGC 13110402 in normal to mildly hypercholesterolaemic adults. PLoS ONE 2017, 12, e0187964. [Google Scholar] [CrossRef]
- Kristensen, N.B.; Bryrup, T.; Allin, K.H.; Nielsen, T.; Hansen, T.H.; Pedersen, O. Alterations in fecal microbiota composition by probiotic supplementation in healthy adults: a systematic review of randomized controlled trials. Genome Med. 2016, 8, 52. [Google Scholar] [CrossRef] [PubMed]
- Kim, D.-H.; Chon, J.-W.; Kim, H.; Seo, K.-H. Modulation of intestinal microbiota in mice by kefir administration. Food Sci. Biotechnol. 2015, 24, 1397–1403. [Google Scholar] [CrossRef]
- Liu, J.-R.; Wang, S.-Y.; Chen, M.-J.; Yueh, P.-Y.; Lin, C.-W. The anti–allergenic properties of milk kefir and soymilk kefir and their beneficial effects on the intestinal microflora. J. Sci. Food Agric. 2006, 86, 2527–2533. [Google Scholar] [CrossRef]
- Carasi, P.; Racedo, S.M.; Jacquot, C.; Romanin, D.E.; Serradell, M.A.; Urdaci, M.C. Impact of kefir derived Lactobacillus kefiri on the mucosal immune response and gut microbiota. J. Immunol. Res. 2015, 2015, 361604. [Google Scholar] [CrossRef] [PubMed]
- Hamet, M.F.; Medrano, M.; Perez, P.F.; Abraham, A.G. Oral administration of kefiran exerts a bifidogenic effect on BALB/c mice intestinal microbiota. Benef. Microbes 2016, 7, 237–246. [Google Scholar] [CrossRef] [PubMed]
- Lahtinen, S.J.; Forssten, S.; Aakko, J.; Granlund, L.; Rautonen, N.; Salminen, S.; Viitanen, M.; Ouwehand, A.C. Probiotic cheese containing Lactobacillus rhamnosus HN001 and Lactobacillus acidophilus NCFM(R) modifies subpopulations of fecal lactobacilli and Clostridium difficile in the elderly. Age 2012, 34, 133–143. [Google Scholar] [CrossRef] [PubMed]
- Bogovic Matijasic, B.; Obermajer, T.; Lipoglavsek, L.; Sernel, T.; Locatelli, I.; Kos, M.; Smid, A.; Rogelj, I. Effects of synbiotic fermented milk containing Lactobacillus acidophilus La–5 and Bifidobacterium animalis ssp. lactis BB–12 on the fecal microbiota of adults with irritable bowel syndrome: A randomized double–blind, placebo–controlled trial. J. Dairy Sci. 2016, 99, 5008–5021. [Google Scholar] [CrossRef]
- Yilmaz, I.; Dolar, M.E.; Ozpinar, H. Effect of administering kefir on the changes in fecal microbiota and symptoms of inflammatory bowel disease: A randomized controlled trial. Turk. J. Gastroenterol. 2019. [Google Scholar] [CrossRef]
- Uyeno, Y.; Sekiguchi, Y.; Kamagata, Y. Impact of consumption of probiotic lactobacilli–containing yogurt on microbial composition in human feces. Int. J. Food Microbiol. 2008, 122, 16–22. [Google Scholar] [CrossRef]
- Santos-Marcos, J.A.; Rangel-Zuniga, O.A.; Jimenez-Lucena, R.; Quintana-Navarro, G.M.; Garcia-Carpintero, S.; Malagon, M.M.; Landa, B.B.; Tena-Sempere, M.; Perez-Martinez, P.; Lopez-Miranda, J.; et al. Influence of gender and menopausal status on gut microbiota. Maturitas 2018, 116, 43–53. [Google Scholar] [CrossRef] [PubMed]
- Gerritsen, J.; Smidt, H.; Rijkers, G.T.; de Vos, W.M. Intestinal microbiota in human health and disease: The impact of probiotics. Genes Nutr. 2011, 6, 209–240. [Google Scholar] [CrossRef] [PubMed]
- Chakraborti, C.K. New–found link between microbiota and obesity. World J. Gastrointest. Pathophysiol. 2015, 6, 110–119. [Google Scholar] [CrossRef] [PubMed]
- Ley, R.E.; Turnbaugh, P.J.; Klein, S.; Gordon, J.I. Human gut microbes associated with obesity. Nature 2006, 444, 1022–1023. [Google Scholar] [CrossRef] [PubMed]
- Turnbaugh, P.J.; Hamady, M.; Yatsunenko, T.; Cantarel, B.L.; Duncan, A.; Ley, R.E.; Sogin, M.L.; Jones, W.J.; Roe, B.A.; Affourtit, J.P.; et al. A core gut microbiome in obese and lean twins. Nature 2008, 457, 480. [Google Scholar] [CrossRef]
- Rizzatti, G.; Lopetuso, L.; Gibiino, G.; Binda, C.; Gasbarrini, A.J.B.r.i. Proteobacteria: A common factor in human diseases. Biomed. Res. Int. 2017, 2017. [Google Scholar] [CrossRef] [PubMed]
- Larsen, N.; Vogensen, F.K.; van den Berg, F.W.; Nielsen, D.S.; Andreasen, A.S.; Pedersen, B.K.; Al-Soud, W.A.; Sorensen, S.J.; Hansen, L.H.; Jakobsen, M. Gut microbiota in human adults with type 2 diabetes differs from non–diabetic adults. PLoS ONE 2010, 5, e9085. [Google Scholar] [CrossRef]
- Egshatyan, L.; Kashtanova, D.; Popenko, A.; Tkacheva, O.; Tyakht, A.; Alexeev, D.; Karamnova, N.; Kostryukova, E.; Babenko, V.; Vakhitova, M.; et al. Gut microbiota and diet in patients with different glucose tolerance. Endocr. Connect. 2016, 5, 1–9. [Google Scholar] [CrossRef]
- Qin, J.; Li, Y.; Cai, Z.; Li, S.; Zhu, J.; Zhang, F.; Liang, S.; Zhang, W.; Guan, Y.; Shen, D.; et al. A metagenome–wide association study of gut microbiota in type 2 diabetes. Nature 2012, 490, 55. [Google Scholar] [CrossRef]
- Huang, G.; Xu, J.; Lefever, D.E.; Glenn, T.C.; Nagy, T.; Guo, T.L. Genistein prevention of hyperglycemia and improvement of glucose tolerance in adult non–obese diabetic mice are associated with alterations of gut microbiome and immune homeostasis. Toxicol. Appl. Pharmacol. 2017, 332, 138–148. [Google Scholar] [CrossRef]
- Yang, T.; Santisteban, M.M.; Rodriguez, V.; Li, E.; Ahmari, N.; Carvajal, J.M.; Zadeh, M.; Gong, M.; Qi, Y.; Zubcevic, J.; et al. Gut dysbiosis is linked to hypertension. Hypertension 2015, 65, 1331–1340. [Google Scholar] [CrossRef] [PubMed]
- Yan, Q.; Gu, Y.; Li, X.; Yang, W.; Jia, L.; Chen, C.; Han, X.; Huang, Y.; Zhao, L.; Li, P.; et al. Alterations of the Gut Microbiome in Hypertension. Front. Cell. Infect. Microbiol. 2017, 7, 381. [Google Scholar] [CrossRef] [PubMed]
- Ventura, M.; Canchaya, C.; Tauch, A.; Chandra, G.; Fitzgerald, G.F.; Chater, K.F.; van Sinderen, D. Genomics of Actinobacteria: tracing the evolutionary history of an ancient phylum. Microbiol. Mol. Biol. Rev. 2007, 71, 495–548. [Google Scholar] [CrossRef] [PubMed]
- Santisteban, M.M.; Qi, Y.; Zubcevic, J.; Kim, S.; Yang, T.; Shenoy, V.; Cole-Jeffrey, C.T.; Lobaton, G.O.; Stewart, D.C.; Rubiano, A.; et al. Hypertension–Linked Pathophysiological Alterations in the Gut. Circulation Res. 2017, 120, 312–323. [Google Scholar] [CrossRef] [PubMed]
- Burton, K.J.; Rosikiewicz, M.; Pimentel, G.; Butikofer, U.; von Ah, U.; Voirol, M.J.; Croxatto, A.; Aeby, S.; Drai, J.; McTernan, P.G.; et al. Probiotic yogurt and acidified milk similarly reduce postprandial inflammation and both alter the gut microbiota of healthy, young men. Br. J. Nutr. 2017, 117, 1312–1322. [Google Scholar] [CrossRef]
- Ntemiri, A.; Ribiere, C.; Stanton, C.; Ross, R.P.; O’Connor, E.; O’Toole, P.W. Retention of microbiota diversity by lactose–free milk in a mouse model of elderly gut microbiota. J. Agric. Food Chem. 2019. [Google Scholar] [CrossRef] [PubMed]
- Lim, J.; Kale, M.; Kim, D.H.; Kim, H.S.; Chon, J.W.; Seo, K.H.; Lee, H.G.; Yokoyama, W.; Kim, H. Antiobesity Effect of Exopolysaccharides Isolated from Kefir Grains. J. Agric. Food Chem. 2017, 65, 10011–10019. [Google Scholar] [CrossRef]
- Hemarajata, P.; Versalovic, J. Effects of probiotics on gut microbiota: mechanisms of intestinal immunomodulation and neuromodulation. Therap. Adv. Gastroenterol. 2013, 6, 39–51. [Google Scholar] [CrossRef]
- Sanchez, B.; Delgado, S.; Blanco-Miguez, A.; Lourenco, A.; Gueimonde, M.; Margolles, A. Probiotics, gut microbiota, and their influence on host health and disease. Mol. Nutr. Food Res. 2017, 61. [Google Scholar] [CrossRef]


| Characteristics | Kefir Group | Unfermented Milk Group | |
|---|---|---|---|
| Baseline | Baseline | p | |
| Sex (Female/Male) | 10/2 | 6/4 | 0.348 |
| Age (year) | 52.00 (47.50–60.50) | 53.00 (45.00–60.00) | 0.821 |
| Dietary intake | |||
| Energy (kcal/day) | 1694.16 (1590.92–1936.72) | 1655.35 (1423.52–2026.12) | 0.821 |
| Carbohydrate (g) | 182.87 (166.79–205.74) | 155.79 (141.61–224.90) | 0.283 |
| Protein (g) | 73.12 (59.29–83.91) | 65.23 (47.55–75.36) | 0.254 |
| Fat (g) | 73.89 (68.16–97.67) | 85.21 (68.06–105.53) | 0.418 |
| Fibre (g) | 26.11 (18.42–36.90) | 23.28 (17.11–26.23) | 0.418 |
| Anthropometrical measurements | |||
| Weight (kg) | 84.05 (69.23–88.78) | 87.65 (75.60–100.60) | 0.180 |
| Body mass index (kg/m2) | 30.67 (26.94–34.66) | 32.38 (29.18–34.59) | 0.381 |
| Body fat mass (%) | 37.05 (31.33–44.05) | 37.45 (27.05–41.45) | 0.582 |
| Waist circumference (cm) | 100.50 (90.75–110.00) | 106.75 (102.25–119.00) | 0.228 |
| Hip circumference (cm) | 111.50 (106.00–116.50) | 112.00 (106.00–119.25) | 0.771 |
| Waist–to–hip ratio | 0.92 (0.86–0.99) | 0.97 (0.92–1.00) | 0.203 |
| Lipid profile | |||
| Total cholesterol (mg/dL) | 243.50 (217.25–265.25) | 220.00 (199.75–249.00) | 0.228 |
| HDL cholesterol (mg/dL) | 45.00 (39.00–55.75) | 42.50 (34.50–56.25) | 0.456 |
| LDL cholesterol (mg/dL) | 154.50 (135.75–177.00) | 141.00 (114.50–177.50) | 0.283 |
| Triglycerides (mg/dL) | 185.00 (114.50–216.75) | 164.50 (126.25–220.75) | 0.923 |
| Homocysteine (µmoL/L) | 10.01 (8.64–12.40) | 13.10 (10.73–15.25) | 0.050 |
| Glycaemic status | |||
| Glucose (mg/dL) | 105.00 (93.75–109.75) | 101.50 (97.00–107.25) | >0.99 |
| Insulin (mU/L) | 15.94 (11.75–17.64) | 19.04 (18.09–25.49) | 0.011 * |
| HbA1c (%) | 5.60 (5.25–5.88) | 5.65 (5.20–6.03) | 0.872 |
| HOMA–IR | 4.18 (2.86–4.59) | 4.52 (4.29–6.65) | 0.180 |
| Inflammation–related indicators | |||
| hs–CRP (mg/dL) | 0.22 (0.69–0.80) | 0.27 (0.21–0.41) | 0.722 |
| TNF–α (pg/mL) | 12.01 (0.76–43.05) | 8.51 (0.49–25.85) | 0.418 |
| IL–6 (pg/mL) | 15.82 (11.52–29.75) | 19.73 (13.85–28.71) | 0.418 |
| IL–10 (pg/mL) | 4.38 (1.13–32.90) | 1.45 (1.13–9.34) | 0.456 |
| IFN–γ (IU/mL) | 1.23 (0.12–2.19) | 0.56 (0.02–3.04) | >0.99 |
| ALT (U/L) | 18.50 (16.50–24.00) | 25.00 (20.75–31.25) | 0.140 |
| AST (U/L) | 19.00 (18.00–20.00) | 19.00 (18.00–20.25) | 0.923 |
| GGT (U/L) | 15.00 (10.75–23.00) | 19.00 (16.00–40.50) | 0.169 |
| Blood pressure | |||
| Systolic blood pressure (mmHg) | 134.50 (115.25–140.50) | 132.50 (123.75–144.00) | 0.722 |
| Diastolic blood pressure (mmHg) | 85.00 (77.50–92.00) | 89.00 (81.00–92.00) | 0.497 |
| Characteristics | Kefir Group | Unfermented Milk Group | |||||
|---|---|---|---|---|---|---|---|
| Baseline | Week 12 | p1 | Baseline | Week 12 | p2 | p3 | |
| Dietary intake | |||||||
| Energy (kcal/day) | 1694.16 (1590.92–1936.72) | 1995.73 (1567.23–2351.80) | 0.347 | 1655.35 (1423.52–2026.12) | 1979.09 (1606.15–2123.62) | 0.575 | 0.821 |
| Carbohydrate (%) | 44.00 (38.00–45.75) | 42.50 (37.75–48.75) | 0.964 | 41.00 (32.00–45.25) | 46.00 (38.50–52.50) | 0.214 | 0.283 |
| Protein (%) | 16.50 (15.25–19.00) | 13.50 (12.00–18.50) | 0.066 | 15.50 (12.75–17.25) | 15.00 (12.00–16.50) | 0.717 | 0.254 |
| Fat (%) | 39.50 (37.00–44.75) | 41.00 (38.00–46.00) | 0.666 | 43.50 (41.75–48.00) | 40.00 (32.75–44.25) | 0.167 | 0.228 |
| Fibre (g) | 26.11 (18.42–36.90) | 26.81 (21.58–32.65) | 0.814 | 23.28 (17.11–26.23) | 25.17 (16.67–33.61) | 0.646 | 0.722 |
| Anthropometrical measurements | |||||||
| Weight (kg) | 84.05 (69.23–88.78) | 83.50 (66.90–88.75) | 0.695 | 87.65 (75.60–100.60) | 88.55 (74.33–96.65) | 0.207 | 0.418 |
| Body mass index (kg/m2) | 30.67 (26.94–34.66) | 30.58 (26.24–34.31) | 0.754 | 32.38 (29.18–34.59) | 31.90 (29.05–33.71) | 0.241 | 0.418 |
| Body fat mass (%) | 37.05 (31.33–44.05) | 35.85 (30.58–44.23) | 0.248 | 37.45 (27.05–41.45) | 38.30 (29.63–43.98) | 0.241 | 0.069 |
| Waist circumference (cm) | 100.50 (90.75–110.00) | 102.25 (90.00–109.00) | 0.407 | 106.75 (102.25–119.00) | 106.75 (100.50–118.50) | 0.952 | 0.722 |
| Hip circumference (cm) | 111.50 (106.00–116.50) | 110.00 (106.25–118.63) | 0.813 | 112.00 (106.00–119.25) | 111.75 (105.13–116.25) | 0.483 | 0.228 |
| Waist–to–hip ratio | 0.92 (0.86–0.99) | 0.92 (0.86–0.95) | 0.929 | 0.97 (0.92–1.00) | 0.99 (0.92–1.03) | 0.386 | 0.497 |
| Lipid profile | |||||||
| Total cholesterol (mg/dL) | 243.50 (217.25–265.25) | 222.00 (201.25–275.00) | 0.209 | 220.00 (199.75–249.00) | 226.50 (198.75–240.25) | 0.953 | 0.539 |
| HDL cholesterol (mg/dL) | 45.00 (39.00–55.75) | 46.00 (41.00–63.00) | 0.271 | 42.50 (34.50–56.25) | 43.50 (36.00–58.00) | 0.412 | 0.346 |
| LDL cholesterol (mg/dL) | 154.50 (135.75–177.00) | 144.00 (116.50–188.75) | 0.170 | 141.00 (114.50–177.50) | 147.50 (115.75–167.50) | 0.959 | 0.314 |
| Triglycerides (mg/dL) | 185.00 (114.50–216.75) | 152.50 (116.50–191.25) | 0.530 | 164.50 (126.25–220.75) | 161.50 (117.00–236.75) | 0.878 | 1.000 |
| Homocysteine (µmol/L) | 10.01 (8.64–12.40) | 9.31 (7.45–12.70) | 0.182 | 13.10 (10.73–15.25) | 12.00 (11.05–14.35) | 0.213 | 0.710 |
| Glycaemic status | |||||||
| Glucose (mg/dL) | 105.00 (93.75–109.75) | 100.50 (96.50–103.00) | 0.157 | 101.50 (97.00–107.25) | 98.50 (97.50–116.25) | 0.918 | 0.159 |
| Insulin (mU/L) | 15.94 (11.75–17.64) | 13.64 (7.33–16.36) | 0.050 * | 19.04 (18.09–25.49) | 22.08 (15.05–28.54) | 0.386 | 0.123 |
| HbA1c (%) | 5.60 (5.25–5.88) | 5.65 (5.50–5.98) | 0.157 | 5.65 (5.20–6.03) | 5.70 (5.10–5.90) | 0.918 | 0.123 |
| HOMA–IR | 4.18 (2.86–4.59) | 3.42 (1.93–4.22) | 0.050 * | 4.52 (4.29–6.65) | 5.52 (3.38–8.49) | 0.445 | 0.159 |
| Inflammation–related indicators | |||||||
| hs–CRP (mg/dL) | 0.22 (0.69–0.80) | 0.16 (0.10–0.46) | 0.533 | 0.27 (0.21–0.41) | 0.24 (0.13–0.50) | 0.917 | 0.733 |
| TNF–α (pg/mL) | 12.01 (0.76–43.05) | 1.13 (0.49–8.33) | 0.015 * | 8.51 (0.49–25.85) | 4.12 (0.49–13.03) | 0.401 | 0.123 |
| IL–6 (pg/mL) | 15.82 (11.52–29.75) | 13.47 (5.65–21.39) | 0.099 | 19.73 (13.85–28.71) | 10.03 (6.16–16.45) | 0.047 * | 0.872 |
| IL–10 (pg/mL) | 4.38 (1.13–32.90) | 1.91 (1.13–14.77) | 0.386 | 1.45 (1.13–9.34) | 1.13 (1.13–15.95) | 0.735 | 0.539 |
| IFN–γ (IU/mL) | 1.23 (0.12–2.19) | 0.38 (0.04–0.85) | 0.013 * | 0.56 (0.02–3.04) | 0.49 (0.18–1.19) | 0.086 | 0.628 |
| ALT (U/L) | 18.50 (16.50–24.00) | 22.00 (19.50–24.00) | 0.288 | 25.00 (20.75–31.25) | 24.50 (18.75–29.00) | 0.215 | 0.180 |
| AST (U/L) | 19.00 (18.00–20.00) | 19.00 (17.00–22.50) | 0.887 | 19.00 (18.00–20.25) | 17.50 (17.00–19.50) | 0.136 | 0.203 |
| GGT (U/L) | 15.00 (10.75–23.00) | 14.50 (12.00–23.75) | 0.371 | 19.00 (16.00–40.50) | 19.00 (14.25–29.25) | 0.065 | 0.169 |
| Blood pressure | |||||||
| Systolic blood pressure (mmHg) | 134.50 (115.25–140.50) | 118.00 (103.25–137.75) | 0.041 * | 132.50 (123.75–144.00) | 118.00 (105.75–137.00) | 0.047 * | 0.974 |
| Diastolic blood pressure (mmHg) | 85.00 (77.50–92.00) | 78.50 (69.00–80.00) | 0.019 * | 89.00 (81.00–92.00) | 78.50 (66.75–89.50) | 0.059 | 1.000 |
| Bacteroidetes | Bacteroides | Odoribacteraceae | Porphyromonadaceae | Prevotellaceae | Alistipes | Firmicutes | Clostridia | Erysipelotrichaceae | Veillonellaceae | Lactobacillales | Verrucomicrobia | Actinobacteria | Bifidobacterium | Proteobacteria | |
|---|---|---|---|---|---|---|---|---|---|---|---|---|---|---|---|
| Anthropometric measurements | |||||||||||||||
| Weight (kg) | −0.384 | 0.070 | 0.176 | 0.160 | −0.131 | 0.133 | 0.433 * | −0.432 * | −0.338 | 0.295 | 0.352 | 0.132 | 0.400 | 0.030 | 0.456 * |
| Body mass index (kg/m2) | −0.383 | 0.103 | 0.189 | 0.172 | −0.168 | 0.139 | 0.434 * | −0.455 * | −0.341 | 0.291 | 0.347 | 0.095 | 0.382 | 0.047 | 0.461 * |
| Body fat mass (%) | −0.563 ** | 0.223 | 0.285 | 0.468 * | −0.388 | 0.402 | 0.599 ** | 0.017 | −0.070 | 0.210 | 0.038 | 0.420 | 0.536 * | −0.018 | 0.371 |
| Waist circumference (cm) | −0.151 | 0.267 | −0.321 | −0.009 | −0.217 | −0.047 | 0.242 | −0.505 * | −0.287 | 0.432 * | 0.135 | 0.247 | 0.128 | 0.044 | 0.332 |
| Hip circumference (cm) | 0.082 | 0.029 | 0.326 | 0.164 | −0.149 | −0.078 | 0.070 | −0.096 | −0.264 | 0.272 | 0.215 | −0.115 | 0.127 | −0.367 | 0.081 |
| Waist–to–hip ratio | −0.239 | 0.112 | −0.526 * | −0.086 | −0.038 | 0.014 | 0.168 | −0.251 | 0.046 | 0.066 | −0.043 | 0.376 | 0.090 | 0.223 | 0.208 |
| Bacteroidetes | Bacteroides | Odoribacteraceae | Porphyromonadaceae | Prevotellaceae | Alistipes | Firmicutes | Clostridia | Erysipelotrichaceae | Veillonellaceae | Lactobacillales | Verrucomicrobia | Actinobacteria | Bifidobacterium | Proteobacteria | |
|---|---|---|---|---|---|---|---|---|---|---|---|---|---|---|---|
| Lipid profile | |||||||||||||||
| Total cholesterol (mg/dL) | −0.151 | −0.444 * | −0.025 | −0.026 | 0.334 | −0.007 | −0.101 | 0.389 | 0.205 | −0.408 | 0.009 | 0.059 | 0.190 | −0.164 | −0.096 |
| HDL cholesterol (mg/dL) | −0.003 | −0.418 | 0.130 | −0.066 | 0.414 | −0.004 | −0.248 | −0.224 | 0.161 | 0.154 | 0.259 | 0.175 | −0.016 | −0.012 | 0.130 |
| LDL cholesterol (mg/dL) | −0.016 | −0.535 * | −0.021 | −0.023 | 0.305 | 0.075 | −0.298 | 0.322 | 0.330 | −0.431 * | 0.005 | 0.152 | 0.042 | −0.034 | −0.094 |
| Triglycerides (mg/dL) | −0.080 | −0.007 | −0.118 | −0.079 | 0.197 | −0.263 | 0.251 | 0.334 | −0.211 | −0.242 | −0.082 | −0.176 | 0.199 | −0.292 | −0.210 |
| Homocysteine (µmoL/L) | −0.162 | 0.077 | −0.186 | 0.141 | −0.135 | −0.023 | −0.057 | −0.044 | 0.232 | 0.224 | 0.149 | 0.477 * | 0.110 | 0.127 | 0.359 |
| Glycaemic status | |||||||||||||||
| Glucose (mg/dL) | −0.590 ** | 0.092 | 0.423 * | 0.370 | −0.374 | 0.629 ** | 0.387 | 0.317 | 0.056 | −0.037 | −0.033 | 0.328 | 0.365 | 0.090 | 0.187 |
| Insulin (mU/L) | −0.331 | 0.069 | 0.344 | 0.244 | −0.265 | 0.361 | 0.357 | −0.098 | −0.159 | 0.312 | 0.010 | 0.428 * | 0.284 | −0.218 | 0.123 |
| HbA1c (%) | 0.189 | 0.062 | −0.168 | −0.266 | 0.004 | −0.123 | 0.021 | 0.126 | −0.372 | 0.211 | −0.282 | −0.003 | −0.280 | 0.068 | −0.277 |
| HOMA–IR | −0.356 | 0.030 | 0.406 | 0.207 | −0.255 | 0.458 * | 0.346 | −0.119 | −0.148 | 0.269 | 0.067 | 0.395 | 0.294 | −0.209 | 0.123 |
| Inflammation Related Indicators | |||||||||||||||
| hs–CRP (mg/dL) | −0.145 | 0.110 | −0.294 | 0.238 | −0.255 | −0.032 | 0.096 | 0.145 | 0.358 | 0.078 | −0.015 | 0.380 | 0.321 | −0.289 | 0.078 |
| TNF–α (pg/mL) | −0.297 | 0.087 | −0.305 | −0.034 | −0.224 | 0.051 | 0.010 | 0.317 | 0.093 | 0.023 | −0.062 | 0.392 | 0.281 | −0.323 | 0.322 |
| IL–6 (pg/mL) | −0.016 | 0.381 | 0.001 | 0.013 | −0.287 | −0.142 | 0.313 | −0.320 | −0.333 | 0.399 | −0.170 | 0.039 | −0.043 | 0.091 | 0.274 |
| IL–10 (pg/mL) | 0.086 | −0.130 | −0.414 | −0.314 | 0.165 | −0.216 | −0.054 | −0.289 | −0.040 | 0.015 | 0.273 | 0.151 | −0.006 | 0.008 | −0.054 |
| IFN–γ (IU/mL) | 0.066 | −0.241 | −0.089 | −0.074 | 0.111 | 0.291 | −0.182 | −0.024 | 0.074 | −0.162 | 0.084 | 0.093 | −0.029 | 0.086 | −0.076 |
| AST | −0.343 | 0.292 | 0.016 | 0.058 | −0.159 | −0.178 | 0.283 | −0.160 | −0.031 | −0.006 | 0.203 | −0.328 | 0.190 | −0.187 | 0.169 |
| ALT | −0.251 | 0.235 | −0.089 | 0.067 | −0.081 | −0.423 * | 0.391 | 0.138 | −0.120 | 0.253 | 0.098 | 0.158 | 0.252 | −0.402 | 0.175 |
| GGT | 0.255 | −0.264 | 0.112 | −0.099 | 0.493 * | −0.385 | −0.093 | 0.025 | −0.285 | −0.089 | −0.093 | −0.457 * | −0.016 | −0.169 | −0.208 |
| Blood Pressure | |||||||||||||||
| Systolic blood pressure (mmHg) | −0.531 * | −0.148 | −0.080 | 0.137 | 0.092 | 0.076 | 0.243 | −0.172 | 0.144 | −0.198 | 0.536 * | 0.205 | 0.710 ** | −0.168 | 0.379 |
| Diastolic blood pressure (mmHg) | −0.491 * | 0.169 | 0.183 | 0.271 | −0.348 | 0.171 | 0.244 | −0.205 | 0.239 | −0.128 | 0.561 ** | 0.096 | 0.452 * | 0.013 | 0.469 * |
© 2019 by the authors. Licensee MDPI, Basel, Switzerland. This article is an open access article distributed under the terms and conditions of the Creative Commons Attribution (CC BY) license (http://creativecommons.org/licenses/by/4.0/).
Share and Cite
BELLIKCI-KOYU, E.; SARER-YUREKLI, B.P.; AKYON, Y.; AYDIN-KOSE, F.; KARAGOZLU, C.; OZGEN, A.G.; BRINKMANN, A.; NITSCHE, A.; ERGUNAY, K.; YILMAZ, E.; et al. Effects of Regular Kefir Consumption on Gut Microbiota in Patients with Metabolic Syndrome: A Parallel-Group, Randomized, Controlled Study. Nutrients 2019, 11, 2089. https://doi.org/10.3390/nu11092089
BELLIKCI-KOYU E, SARER-YUREKLI BP, AKYON Y, AYDIN-KOSE F, KARAGOZLU C, OZGEN AG, BRINKMANN A, NITSCHE A, ERGUNAY K, YILMAZ E, et al. Effects of Regular Kefir Consumption on Gut Microbiota in Patients with Metabolic Syndrome: A Parallel-Group, Randomized, Controlled Study. Nutrients. 2019; 11(9):2089. https://doi.org/10.3390/nu11092089
Chicago/Turabian StyleBELLIKCI-KOYU, Ezgi, Banu Pınar SARER-YUREKLI, Yakut AKYON, Fadime AYDIN-KOSE, Cem KARAGOZLU, Ahmet Gokhan OZGEN, Annika BRINKMANN, Andreas NITSCHE, Koray ERGUNAY, Engin YILMAZ, and et al. 2019. "Effects of Regular Kefir Consumption on Gut Microbiota in Patients with Metabolic Syndrome: A Parallel-Group, Randomized, Controlled Study" Nutrients 11, no. 9: 2089. https://doi.org/10.3390/nu11092089
APA StyleBELLIKCI-KOYU, E., SARER-YUREKLI, B. P., AKYON, Y., AYDIN-KOSE, F., KARAGOZLU, C., OZGEN, A. G., BRINKMANN, A., NITSCHE, A., ERGUNAY, K., YILMAZ, E., & BUYUKTUNCER, Z. (2019). Effects of Regular Kefir Consumption on Gut Microbiota in Patients with Metabolic Syndrome: A Parallel-Group, Randomized, Controlled Study. Nutrients, 11(9), 2089. https://doi.org/10.3390/nu11092089